Photovoltaic Solar Cells and Panels Waste in Jordan: Figures, Facts, and Concerns

 ,
,
Abstract
:1. Introduction
2. Materials and Mass Estimations of PV Cells and Panels
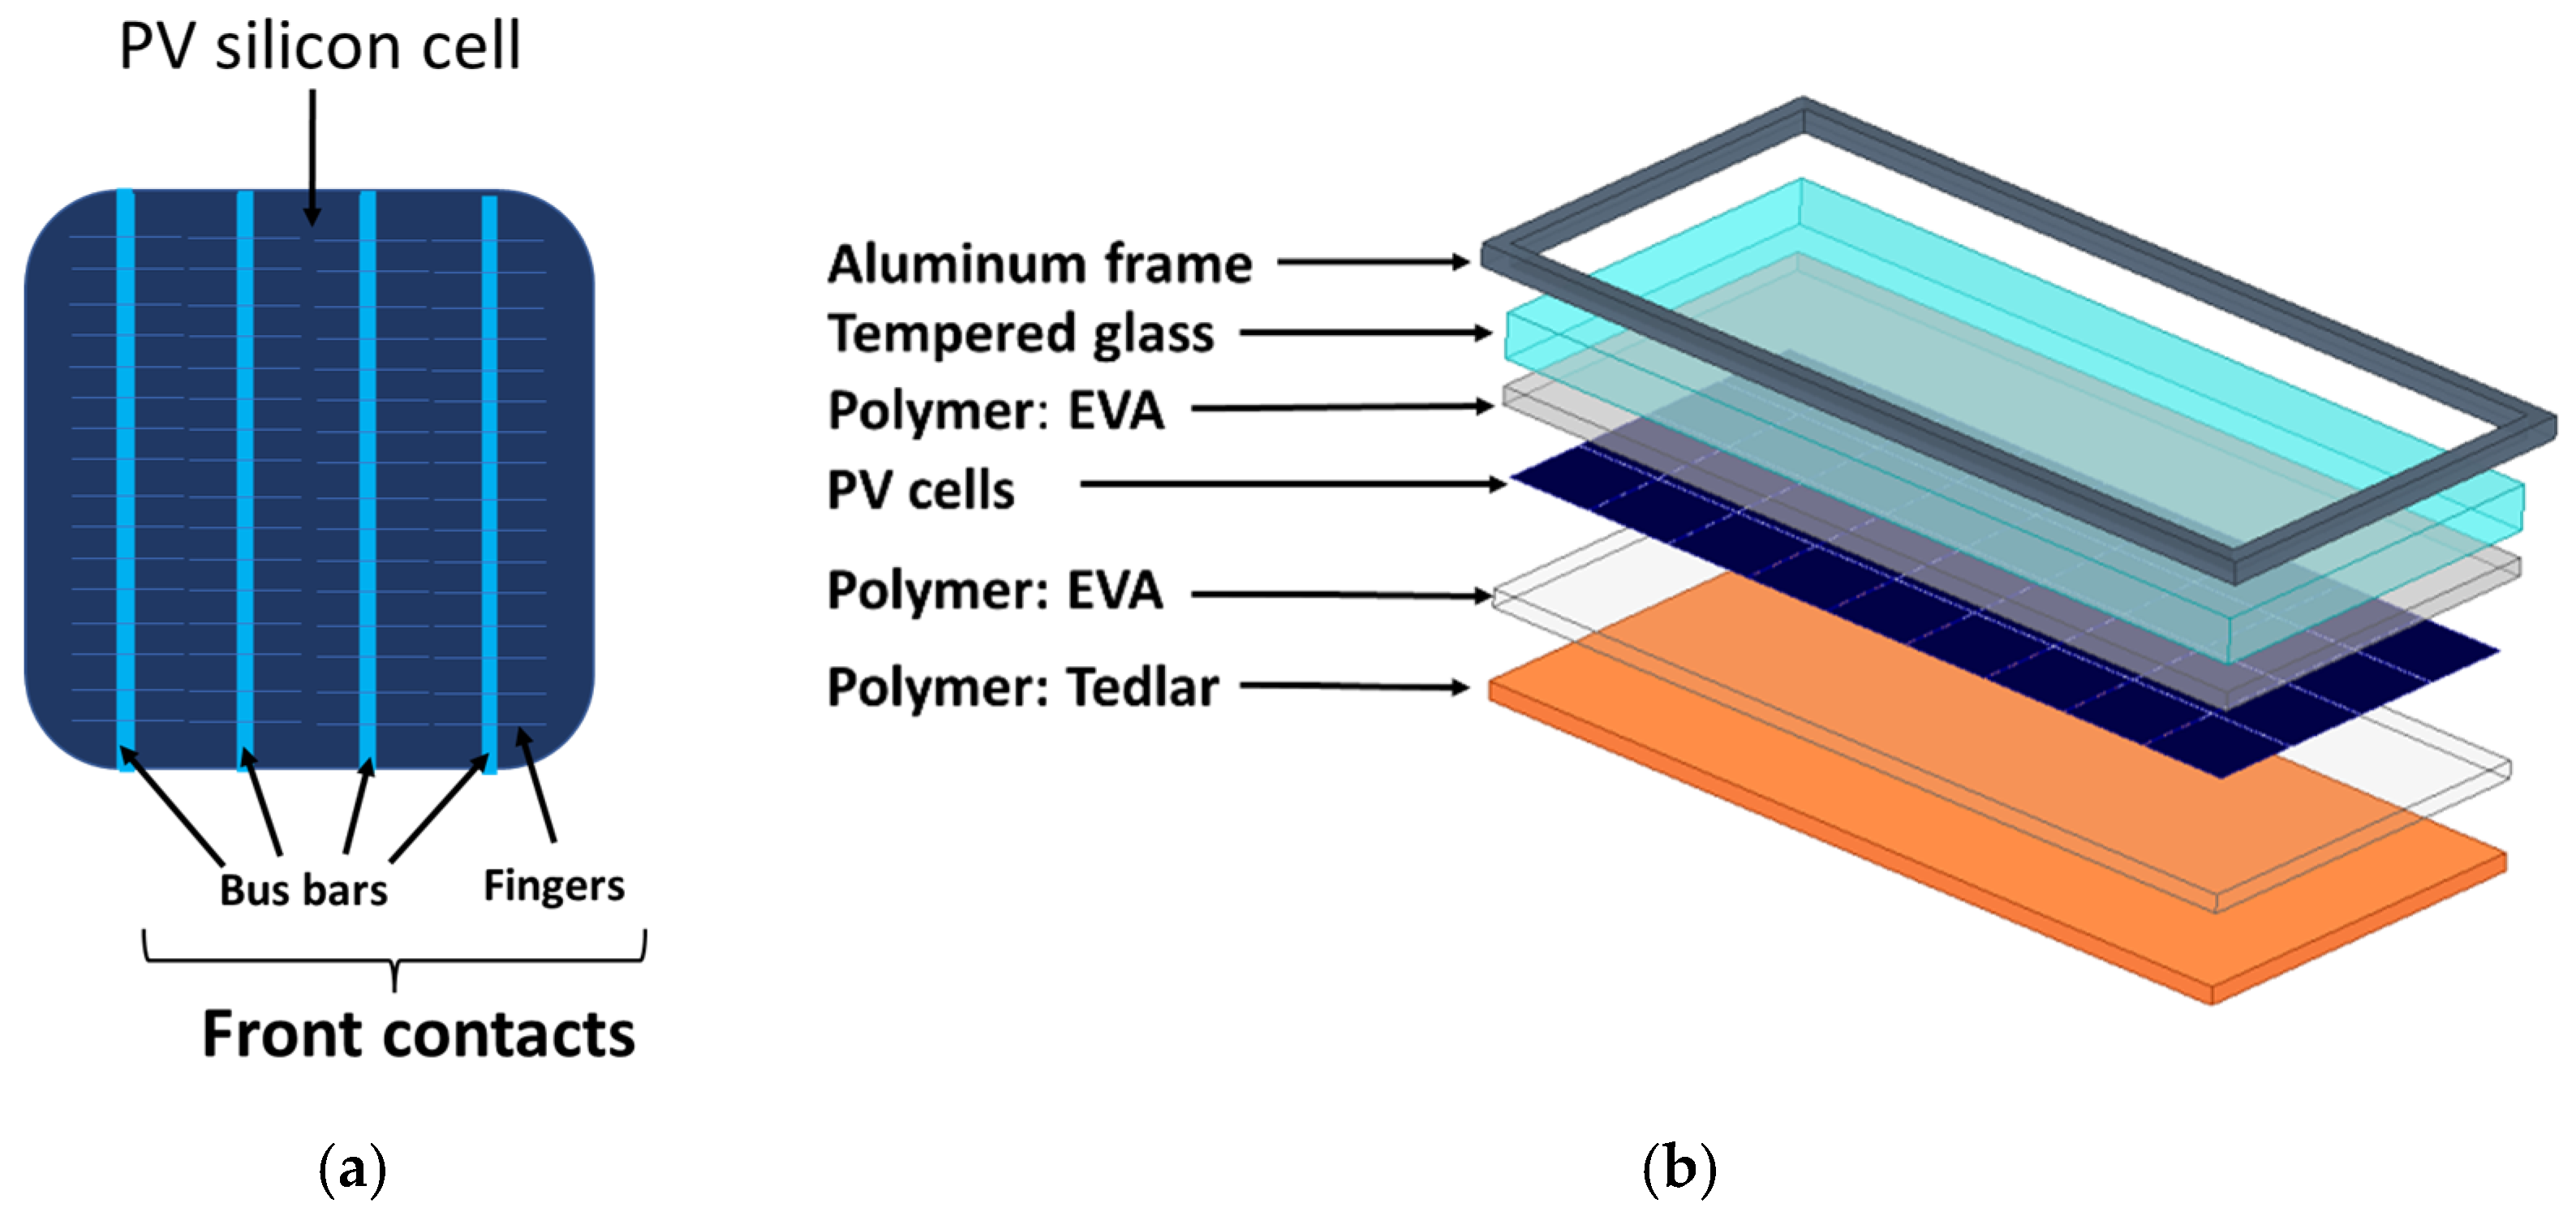
2.1. Materials in PV Cells and Panels
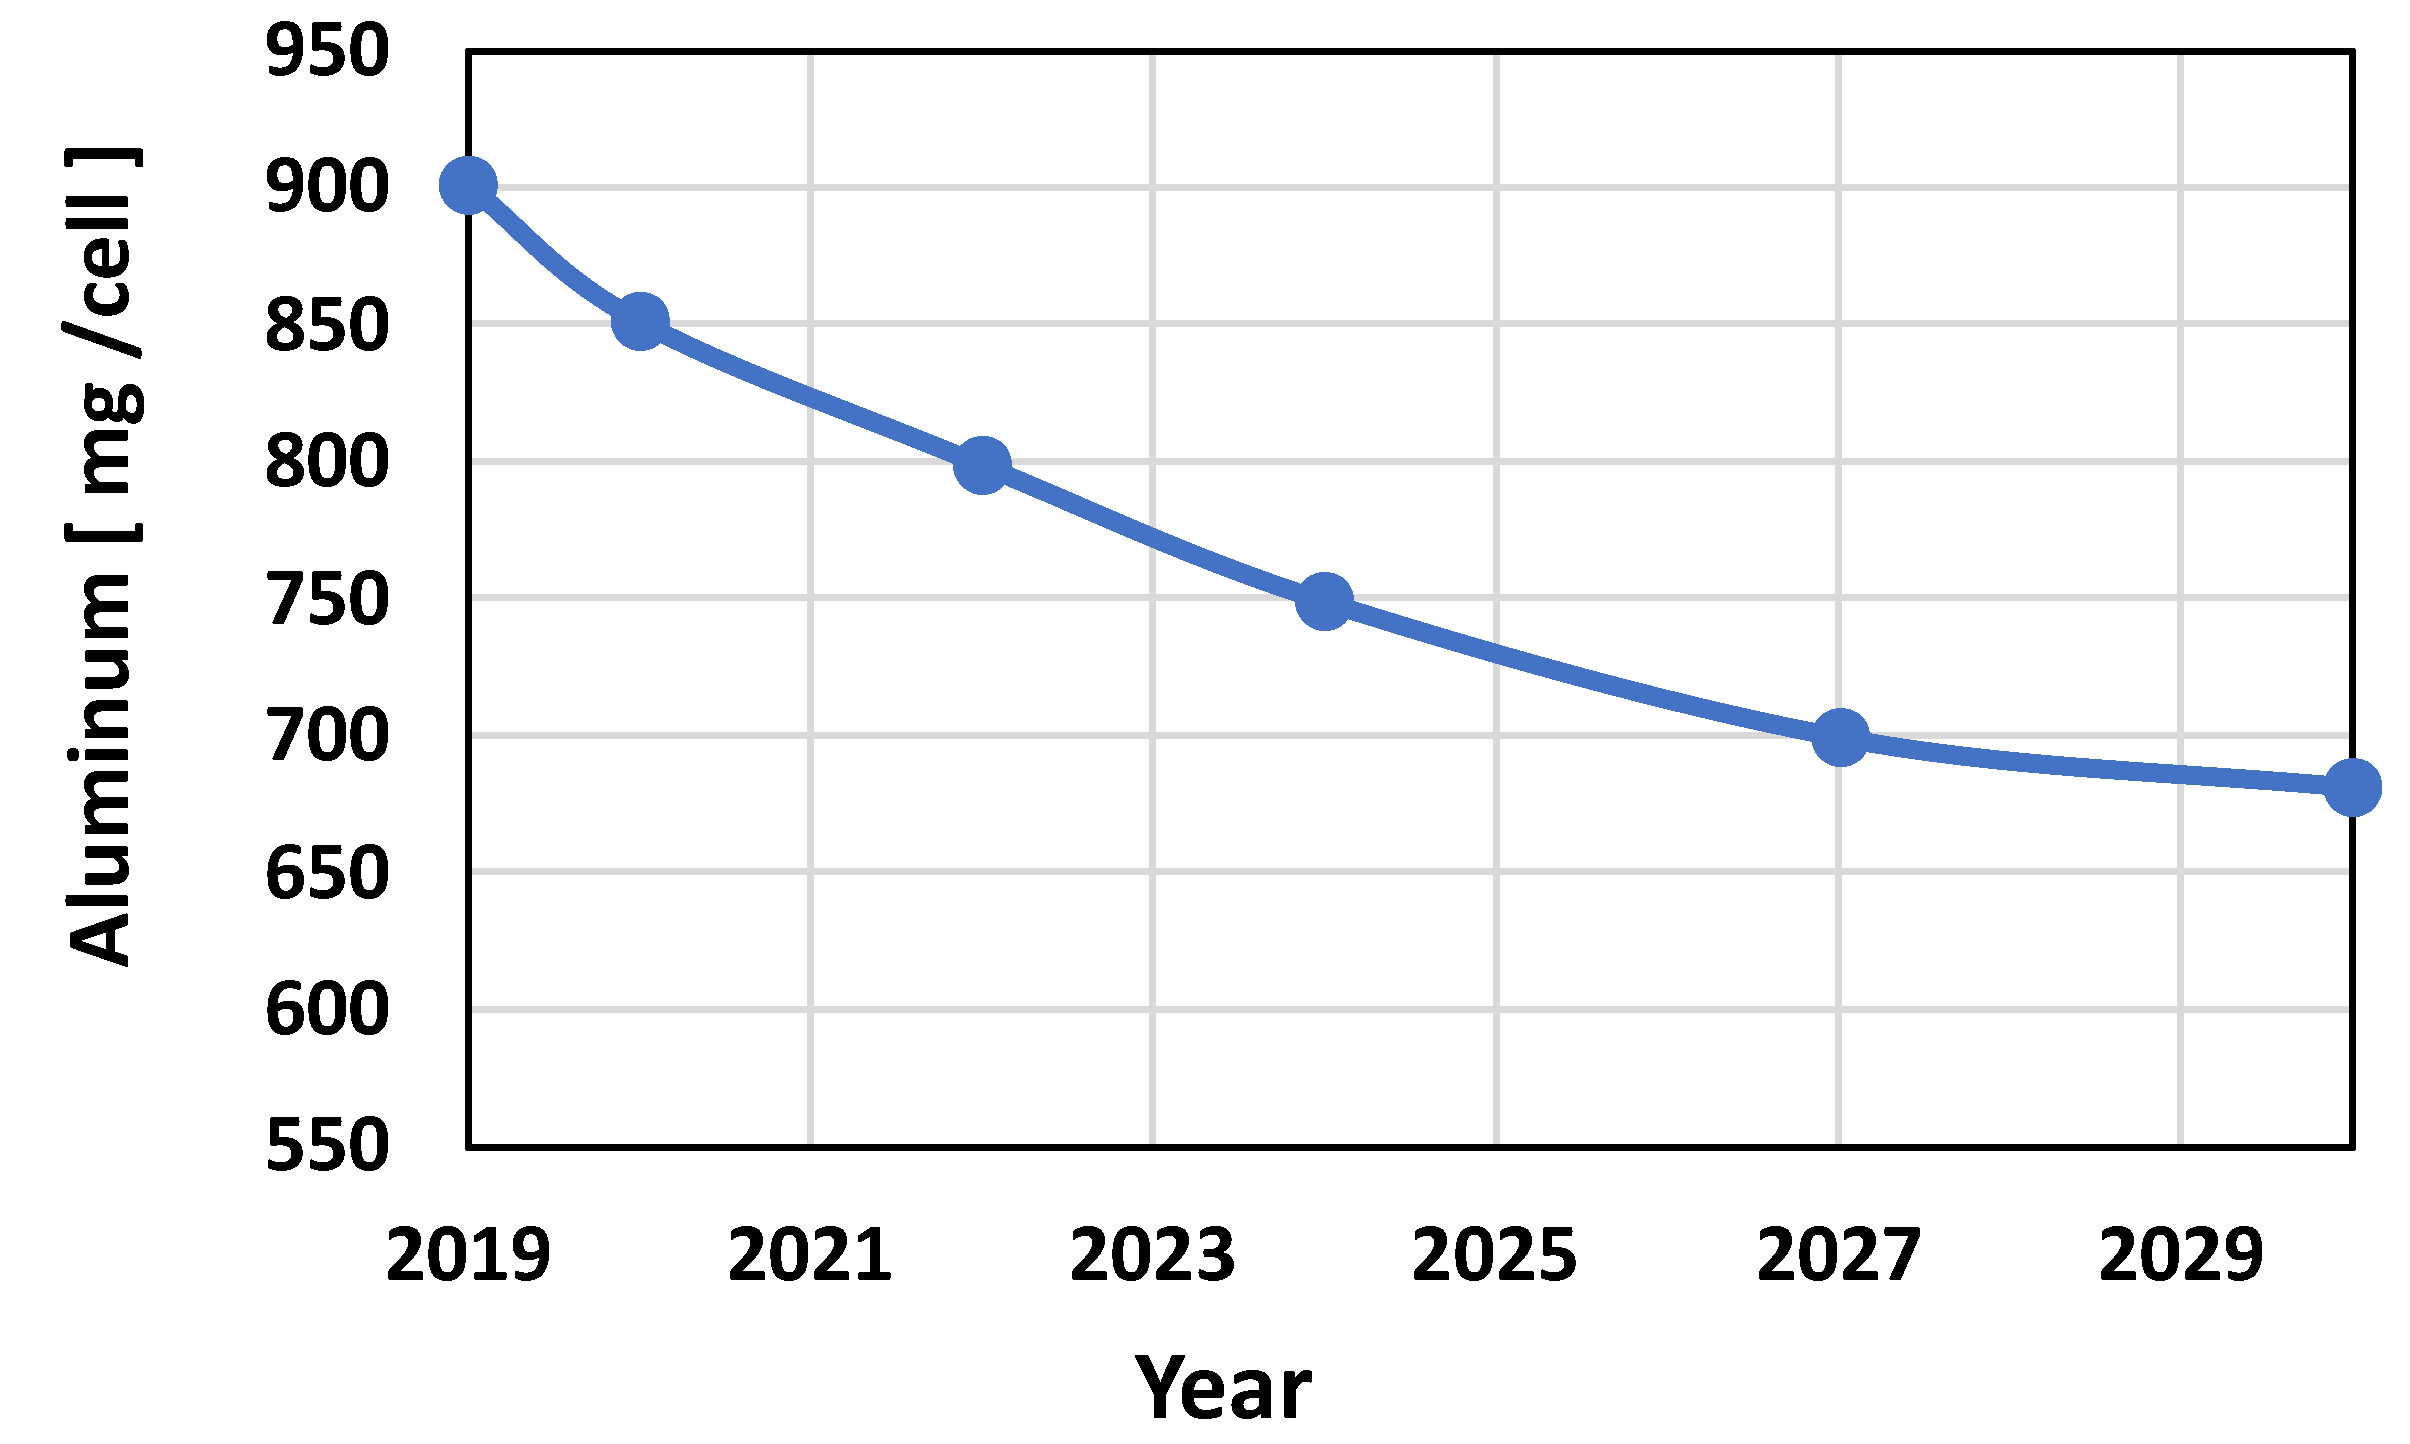
2.1.1. Aluminum
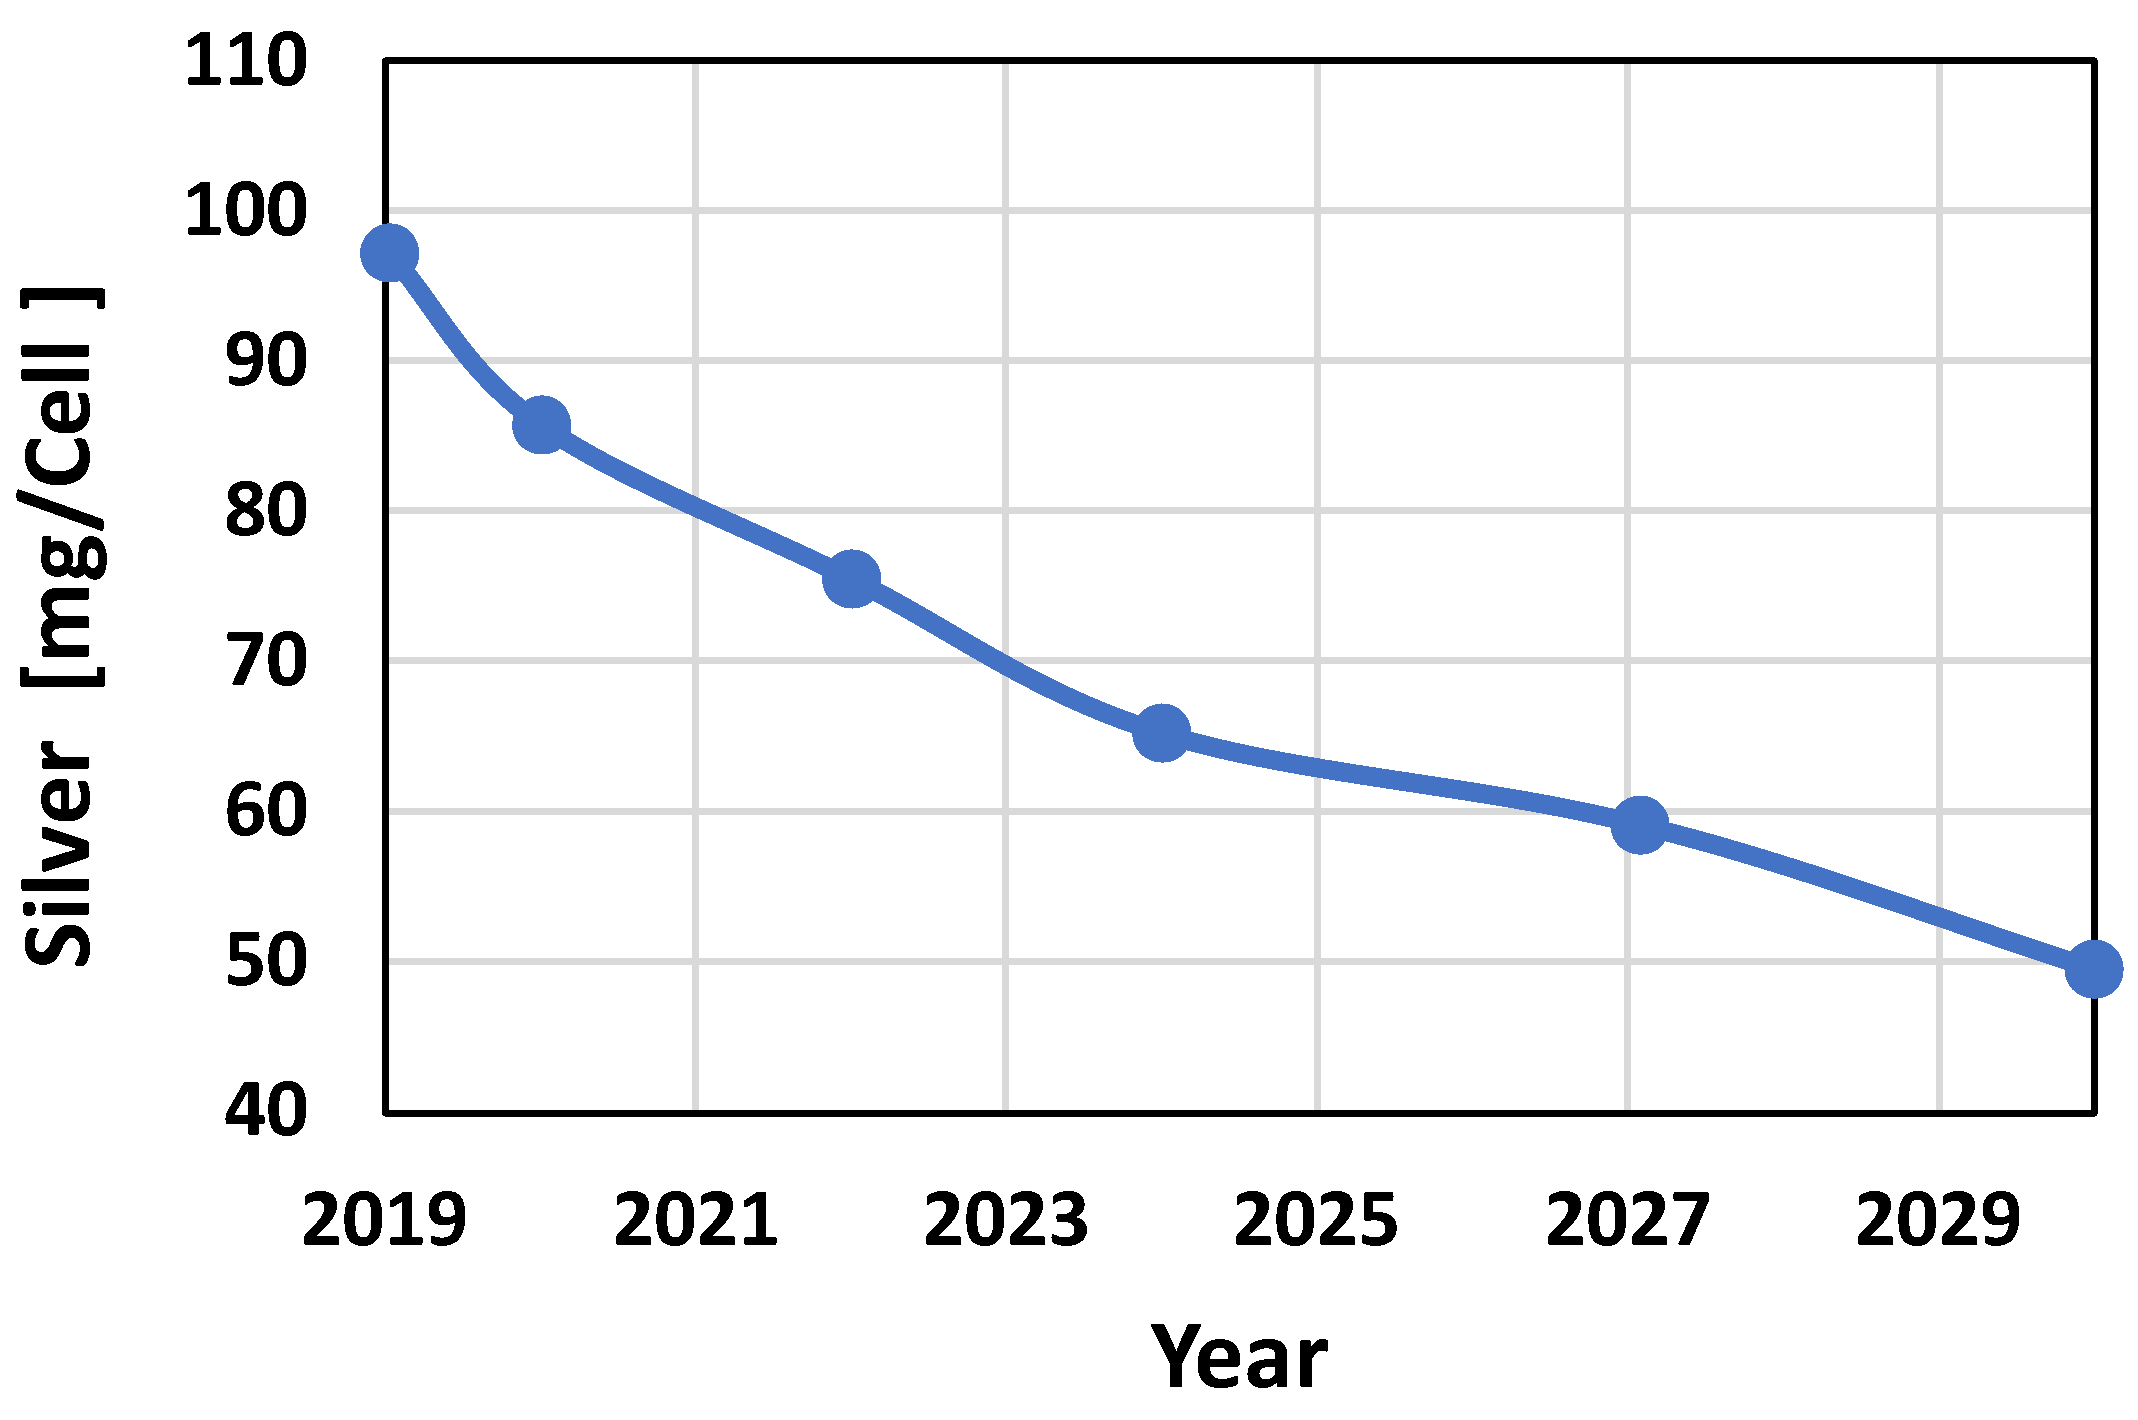
2.1.2. Silver
2.1.3. Lead and Tin
2.1.4. Dopant Materials
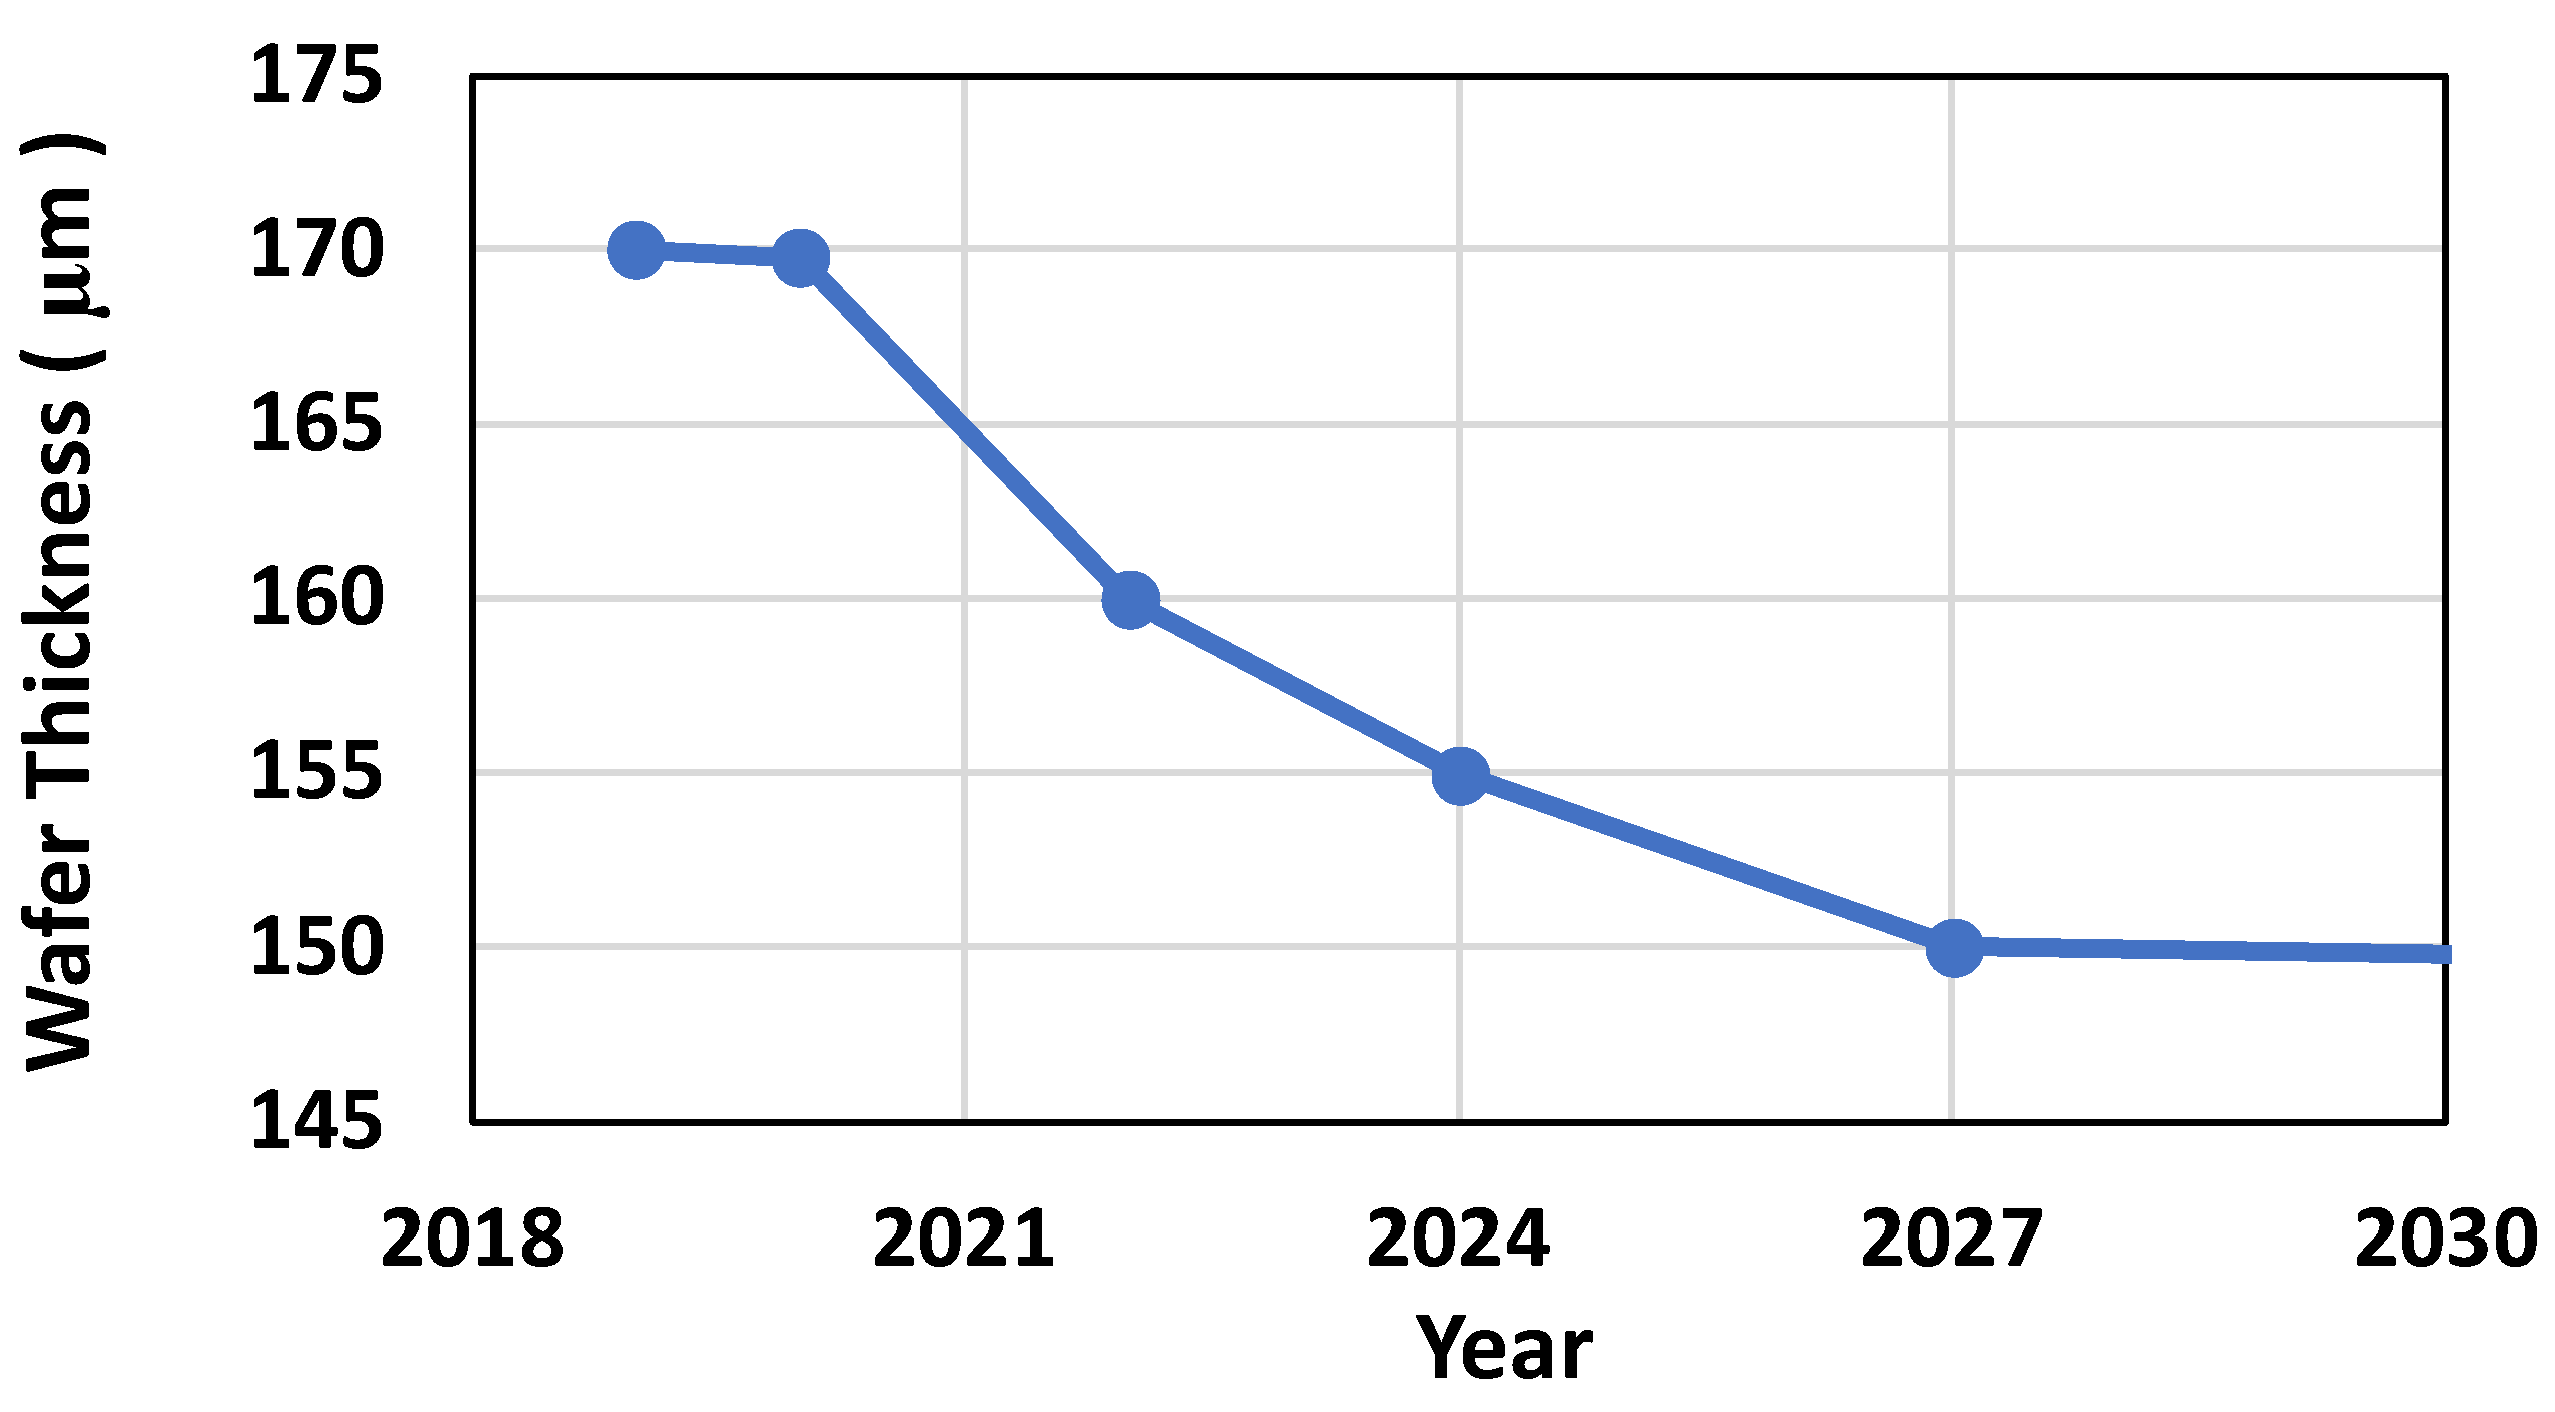
2.1.5. Silicon
2.1.6. Copper
2.2. Glass and Polymers
3. Estimation of the Amounts of PV Waste in Jordan
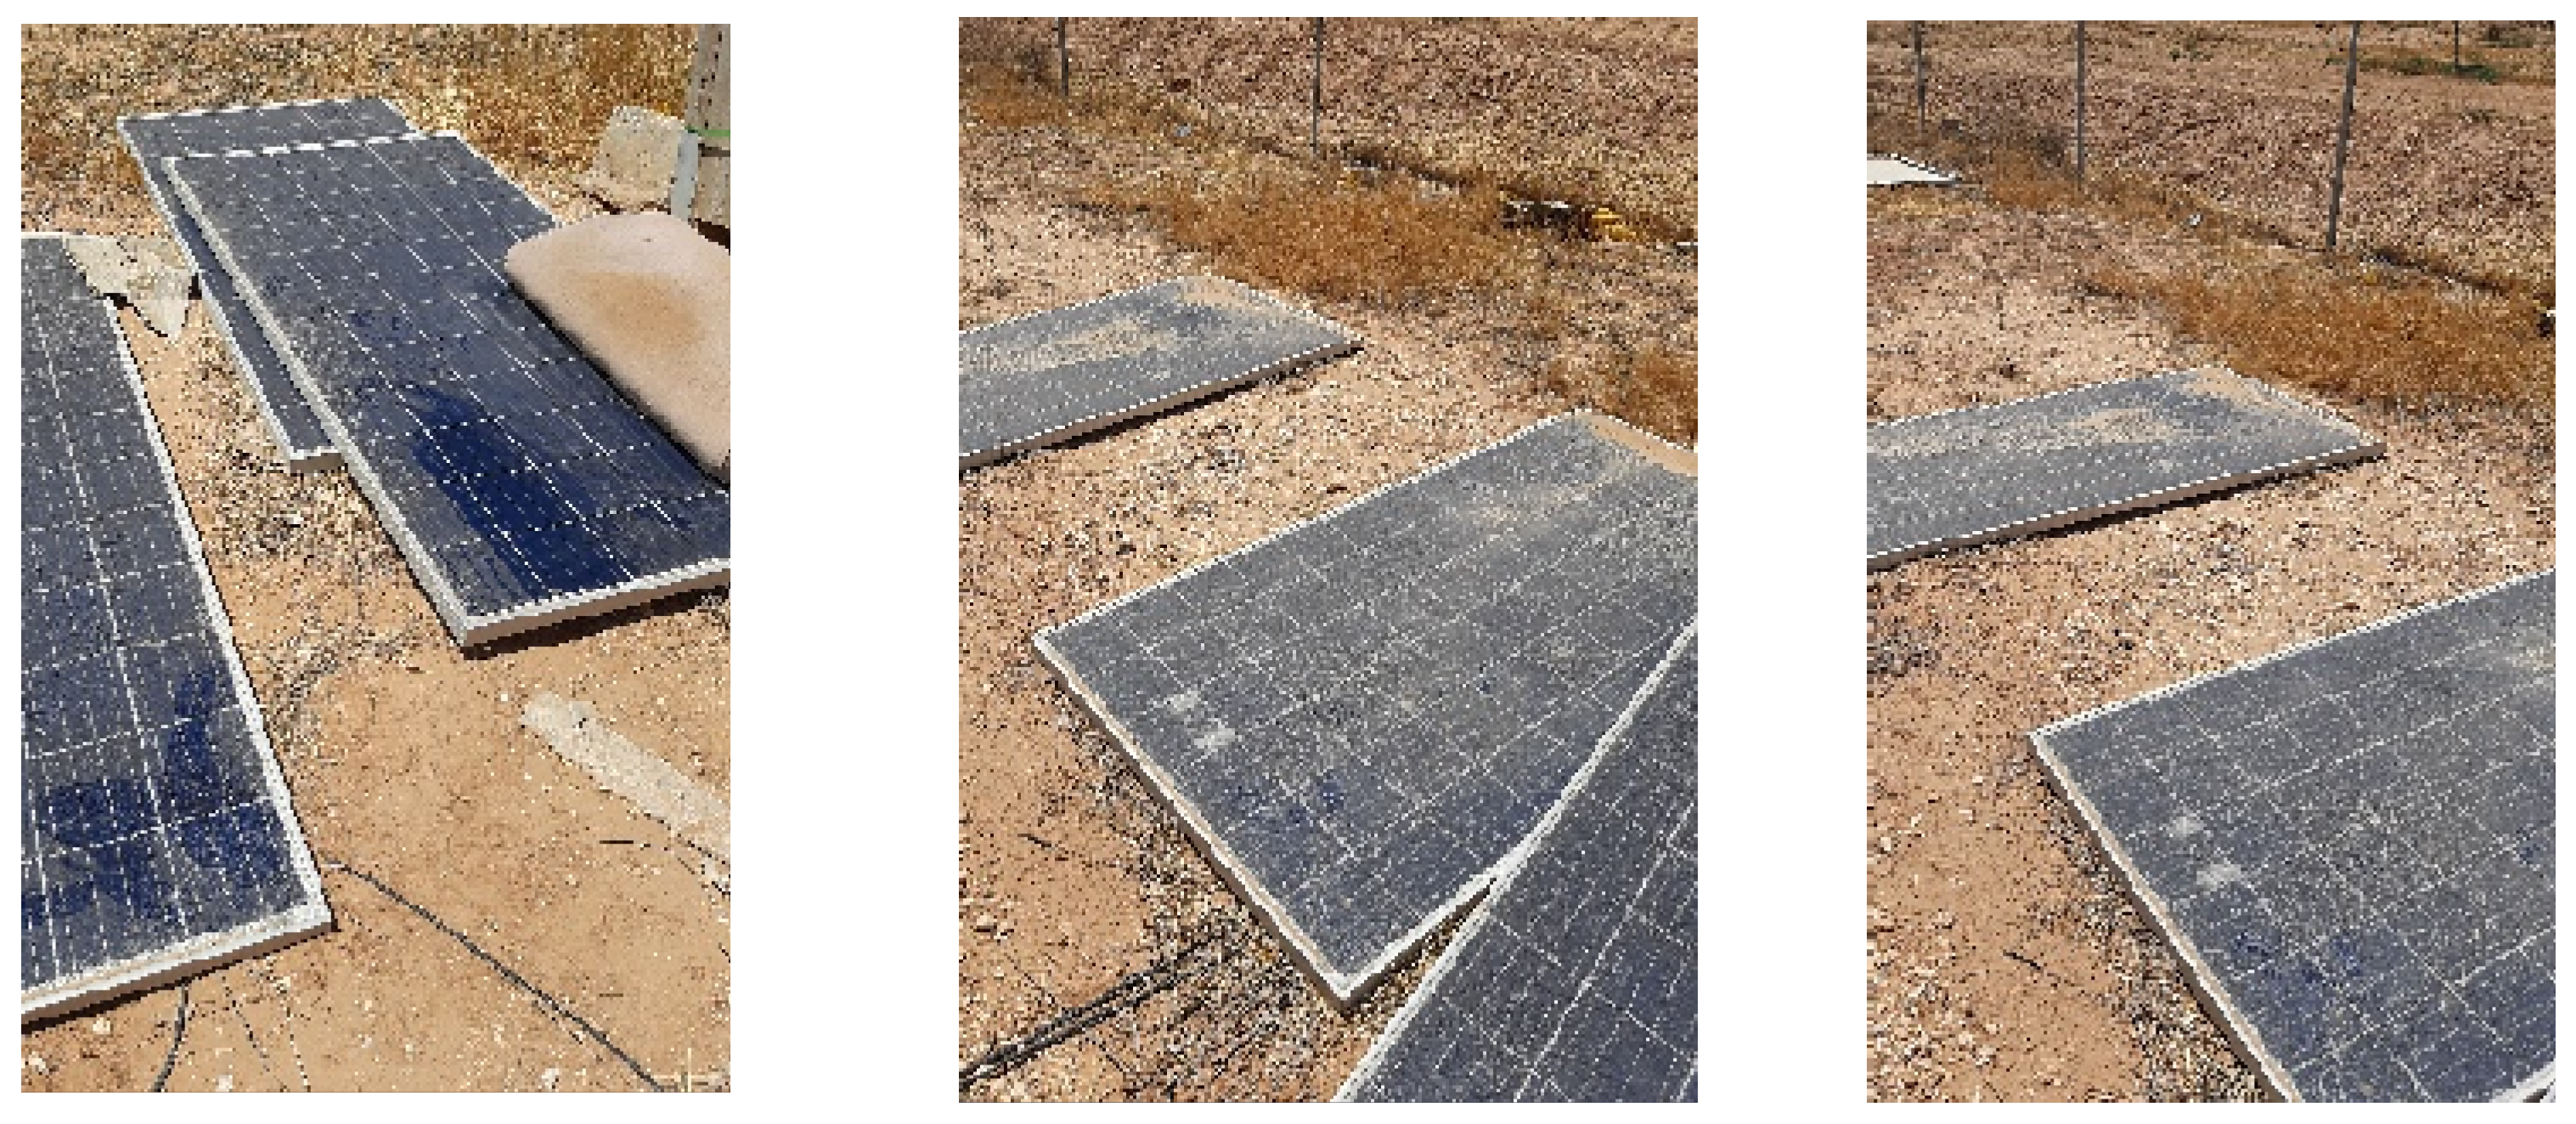
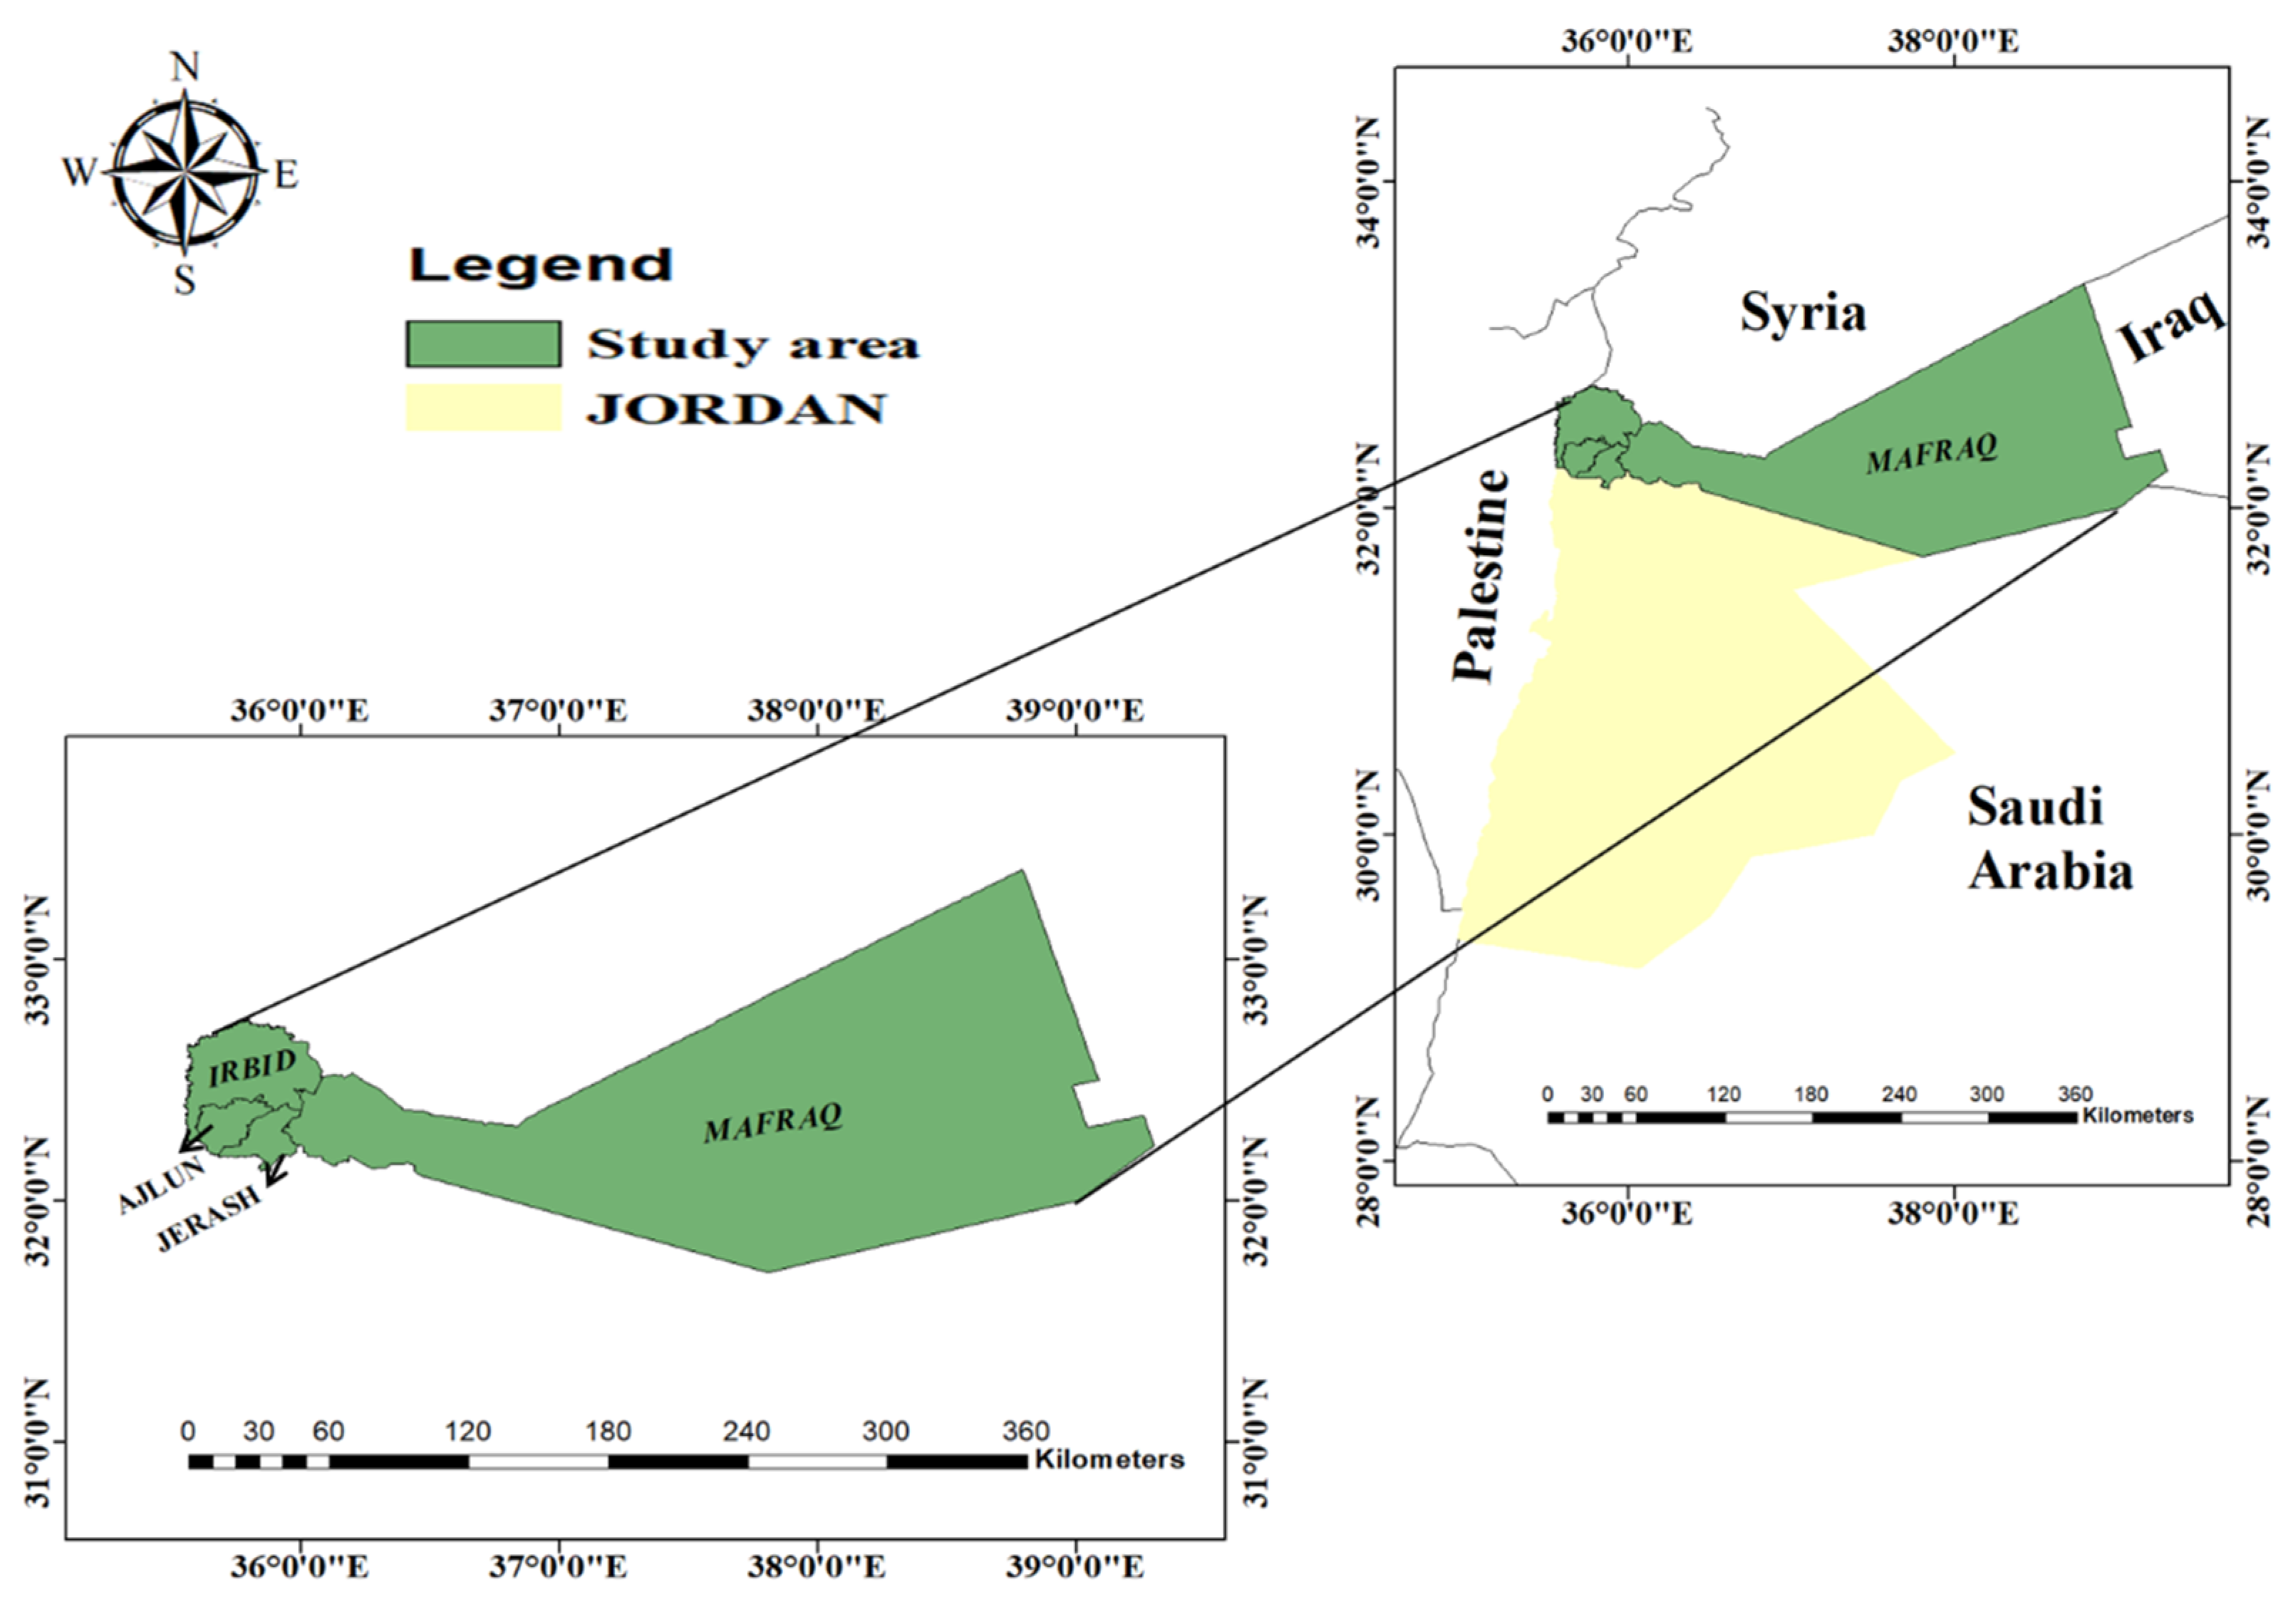
3.1. Study Area
3.2. Thin-Film PV Technology
- Silicon-based PV panels have a leaching potential of approximately 4 g of lead per kilowatt installed, compared to approximately 23 g of cadmium per kilowatt installed for CdTe-based PV panels.
- Cadmium is considered approximately 10 times more hazardous than lead.
- The possible wide geographical distribution of such panels in different regions in Jordan will result in widespread and long-term environmental contamination and hazards to human health.
- Jordan has no policies or regulations regarding the procurement of thin-film PV panels or the management of their waste.
4. Discussion
4.1. Recyclable Materials and Economic Value
4.2. Management Plant and Collection Areas
4.3. Environmental Impact and Regulation
5. Conclusions and Recommendations
- First: Awareness about PV panels at their EoL between sectors that deal with PV energy, including companies, installers, legislators, etc.
- Second: Awareness of the emerging PV waste problem among decision-makers.
- Third: The importance of issuing laws, bylaws, and regulations that organize and enforce measures to manage and deal with PV waste safely and correctly.
- Fourth: Assigning an area, or areas, dedicated to PV waste accumulation for further treatment later.
- Fifth: Establish facilities that treat, recycle, or reuse PV waste after the EoL of panels.
- Sixth: Thin-film PV panels should be considered seriously when exporting, installing, and disposing of at their EoL.
- Seventh: In addition to typical crystalline PV panels, importing, installing, and waste management of thin-film PV panels are essential issues that need to be addressed by different sectors, particularly the legislation sector.
- Eighth: A comprehensive study needs to be conducted to determine Jordan’s optimal management and recycling method for energy, economy, and ecology.
- The importance of PV waste and its management can be seen from many aspects: legislation, environmental, economic, social, and human health.
Author Contributions
Funding
Institutional Review Board Statement
Informed Consent Statement
Data Availability Statement
Conflicts of Interest
References
- The Future of Renewable Energy in Jordan—Energy Fanack.com. Available online: https://fanack.com/fanack-energy/jordan/renewable-energy-in-jordan/ (accessed on 27 February 2022).
- Kiwan, S.; Al-Gharibeh, E. Jordan toward a 100% renewable electricity system. Renew. Energy 2020, 147, 423–436. [Google Scholar] [CrossRef]
- Available online: https://www.ideco.com.jo/portal/WebForms/FilesLibrary.aspx (accessed on 13 October 2020).
- D’Adamo, I.; Miliacca, M.; Rosa, P. Economic Feasibility for Recycling of Waste Crystalline Silicon Photovoltaic Modules. Int. J. Photoenergy 2017, 2017, 1–6. [Google Scholar] [CrossRef]
- Cucchiella, F.; D’Adamo, I.; Rosa, P. End-of-Life of used photovoltaic modules: A financial analysis. Renew. Sustain. Energy Rev. 2015, 47, 552–561. [Google Scholar] [CrossRef]
- Bogacka, M.; Pikoń, K.; Landrat, M. Environmental impact of PV cell waste scenario. Waste Manag. 2017, 70, 198–203. [Google Scholar] [CrossRef]
- Giacchetta, G.; Leporini, M.; Marchetti, B. Evaluation of the environmental benefits of new high value process for the management of the end of life of thin film photovoltaic modules. J. Clean. Prod. 2013, 51, 214–224. [Google Scholar] [CrossRef]
- Nieuwlaar, E.; Alsema, E.A.; IEA PVPS Task 1 Workshop. Environmental Aspects of PV Power Systems: Report on the Iea Pvps Task 1 Workshop 25–27 June 1997 Utrecht, the Netherlands; Department of Science, Technology and Society, Utrecht University: Utrecht, The Netherlands, 1997. [Google Scholar]
- Fthenakis, V.; Raugei, M. Environmental life-cycle assessment of photovoltaic systems. In The Performance of Photovoltaic (PV) Systems; Elsevier: Amsterdam, The Netherlands, 2017. [Google Scholar] [CrossRef]
- Herceg, S.; Pinto Bautista, S.; Weiß, K.A. Influence of Waste Management on the Environmental Footprint of Electricity Produced by Photovoltaic Systems. Energies 2020, 13, 2146. [Google Scholar] [CrossRef]
- Kwak, J.I.; Nam, S.H.; Kim, L.; An, Y.J. Potential environmental risk of solar cells: Current knowledge and future challenges. J. Hazard. Mater. 2020, 392, 122297. [Google Scholar] [CrossRef]
- Stamford, L.; Azapagic, A. Environmental Impacts of Photovoltaics: The Effects of Technological Improvements and Transfer of Manufacturing from Europe to China. Energy Technol. 2018, 6, 1148–1160. [Google Scholar] [CrossRef] [Green Version]
- Vellini, M.; Gambini, M.; Prattella, V. Environmental impacts of PV technology throughout the life cycle: Importance of the end-of-life management for Si-panels and CdTe-panels. Energy 2017, 138, 1099–1111. [Google Scholar] [CrossRef]
- Nain, P.; Kumar, A. Initial metal contents and leaching rate constants of metals leached from end-of-life solar photovoltaic waste: An integrative literature review and analysis. Renew. Sustain. Energy Rev. 2020, 119, 109592. [Google Scholar] [CrossRef]
- Bang, Y.Y.; Hong, N.J.; Sung Lee, D.; Lim, S.R. Comparative assessment of solar photovoltaic panels based on metal-derived hazardous waste, resource depletion, and toxicity potentials. Int. J. Green Energy 2018, 15, 550–557. [Google Scholar] [CrossRef]
- Aman, M.M.; Solangi, K.H.; Hossain, M.S.; Badarudin, A.; Jasmon, G.B.; Mokhlis, H.; Bakar, A.H.A.; Kazi, H.N. A review of Safety, Health and Environmental (SHE) issues of solar energy system. Renew. Sustain. Energy Rev. 2015, 41, 1190–1204. [Google Scholar] [CrossRef]
- Nain, P.; Kumar, A. Ecological and human health risk assessment of metals leached from end-of-life solar photovoltaics. Environ. Pollut. 2020, 267, 115393. [Google Scholar] [CrossRef]
- Espinosa, N.; Zimmermann, Y.S.; dos Reis Benatto, G.A.; Lenz, M.; Krebs, F.C. Outdoor fate and environmental impact of polymer solar cells through leaching and emission to rainwater and soil. Energy Environ. Sci. 2016, 9, 1674–1680. [Google Scholar] [CrossRef] [Green Version]
- Franz, M.; Piringer, G. Market development and consequences on end-of-life management of photovoltaic implementation in Europe. Energy Sustain. Soc. 2020, 10, 31. [Google Scholar] [CrossRef]
- Fthenakis, V.M. End-of-life management and recycling of PV modules. Energy Policy 2000, 28, 1051–1058. [Google Scholar] [CrossRef] [Green Version]
- Vargas, C.; Chesney, M. End of life decommissioning and recycling of solar panels in the United States. A real options analysis. J. Sustain. Financ. Investig. 2020, 11, 1–21. [Google Scholar] [CrossRef]
- Komoto, K.; Lee, J.S.; Zhang, J.; Ravikumar, D.; Sinha, P.; Wade, A.; Heath, G.A. End-of-Life Management of Photovoltaic Panels: Trends in PV Module Recycling Technologies; OSTI: Oak Ridge, TN, USA, 2018. [Google Scholar] [CrossRef]
- Faircloth, C.C.; Wagner, K.H.; Woodward, K.E.; Rakkwamsuk, P.; Gheewala, S.H. The environmental and economic impacts of photovoltaic waste management in Thailand. Resour. Conserv. Recycl. 2019, 143, 260–272. [Google Scholar] [CrossRef]
- Kim, H.; Park, H. PV Waste Management at the Crossroads of Circular Economy and Energy Transition: The Case of South Korea. Sustainability 2018, 10, 3565. [Google Scholar] [CrossRef] [Green Version]
- Rathi, S. Optimization model for integrated municipal solid waste management in Mumbai, India. Environ. Dev. Econ. 2007, 12, 105–121. [Google Scholar] [CrossRef] [Green Version]
- Domínguez, A.; Geyer, R. Photovoltaic waste assessment in Mexico. Resour. Conserv. Recycl. 2017, 127, 29–41. [Google Scholar] [CrossRef]
- Paiano, A. Photovoltaic waste assessment in Italy. Renew. Sustain. Energy Rev. 2015, 41, 99–112. [Google Scholar] [CrossRef]
- Lunardi, M.; Alvarez-Gaitan, J.; Corkish, J. A Review of Recycling Processes for Photovoltaic Modules. In Solar Panels and Photovoltaic Materials; Zaidi, B., Ed.; IntechOpen: London, UK, 2018. [Google Scholar] [CrossRef] [Green Version]
- Ardente, F.; Latunussa, C.E.L.; Blengini, G.A. Resource efficient recovery of critical and precious metals from waste silicon PV panel recycling. Waste Manag. 2019, 91, 156–167. [Google Scholar] [CrossRef] [PubMed]
- Gok, A. (Ed.) Reliability and Ecological Aspects of Photovoltaic Modules; IntechOpen: London, UK, 2020. [Google Scholar] [CrossRef] [Green Version]
- VDMA Photovoltaic Equipment. International Technology Roadmap for Photovoltaic (Itrpv)—2019 Results, 11th ed.; VDMA Photovoltaic Equipment: Frankfurt, Germany, 2020; pp. 1–88. [Google Scholar]
- Klugmann-Radziemska, E.; Ostrowski, P. Chemical treatment of crystalline silicon solar cells as a method of recovering pure silicon from photovoltaic modules. Renew. Energy 2010, 35, 1751–1759. [Google Scholar] [CrossRef]
- Adrian, A.; Rudolph, D.; Willenbacher, N.; Lossen, J. Finger Metallization Using Pattern Transfer Printing Technology for c-Si Solar Cell. IEEE J. Photovolt. 2020, 10, 1290–1298. [Google Scholar] [CrossRef]
- Fraunhofer Institute for Solar Energy Systems ISE. Recent Facts about photovoltaics in Germany—Fraunhofer ISE. Available online: https://www.ise.fraunhofer.de/en/publications/studies/recent-facts-about-pv-in-germany.html (accessed on 18 April 2021).
- Renewable Energy World. Will the Transition to Renewable Energy Be Paved in Copper? Available online: https://www.renewableenergyworld.com/storage/will-the-transition-to-renewable-energy-be-paved-in-copper/#gref (accessed on 18 April 2021).
- Corcelli, F.; Ripa, M.; Leccisi, E.; Cigolotti, V.; Fiandra, V.; Graditi, G.; Lucio, S.; Marco, T.; Sergio, U. Sustainable urban electricity supply chain—Indicators of material recovery and energy savings from crystalline silicon photovoltaic panels end-of-life. Ecol. Indic. 2018, 94, 37–51. [Google Scholar] [CrossRef]
- Joint Research Centre, European Commission. Analysis of Material Recovery from Photovoltaic Panels; Publications Office, European Commission: Luxembourg, 2016. [Google Scholar]
- Ilias, A.V.; Meletios, R.G.; Yiannis, K.A.; Nikolaos, B. Integration & assessment of recycling into c-Si photovoltaic module’s life cycle. Int. J. Sustain. Eng. 2018, 11, 186–195. [Google Scholar]


| Material | Gram/Wp * | Notes |
|---|---|---|
| Silicon | ~1.47–~2.08 [31] | We consider the value of 1.47 g/Wp |
| Lead | ~0.04–0.06 [34] | We consider the value of 0.04 g/Wp |
| Tin | ~0.08–0.12 [37] | We consider the value of 0.08 g/Wp |
| Silver | ~0.02–0.05 [31,33] | The median silver paste consumption for one solar cell has decreased from 0.3 g/cell in 2010 to 0.1 g/cell in 2019. We consider the value of 0.02 g/Wp, based on the reported amounts in 2019 [31]. |
| Copper | ~3.96 [29] | This amount includes wiring and cables of a PV system, including that amount inside PV cells and panels. |
| Aluminum (PV cell) | ~0.18 [31] | This represents the amount of remaining aluminum on a PV cell |
| Aluminum (panel frame) | ~6.87 [36] | This represents the amount of aluminum in the holding frame of a panel |
| Glass | ~49.30 [36] | |
| EVA and Tedlar | ~7.40 [36] | |
| Phosphorous | A very little amount: should be considered for leaching, and when managing the waste of PV cells | |
| Arsenide | ||
| Boron |
| Population | Households | |
|---|---|---|
| Irbid | 2,003,800 | 402,532 |
| Mafraq | 622,500 | 120,574 |
| Jerash | 268,300 | 52,965 |
| Ajloun | 199,400 | 39,579 |
| Total | 3,094,000 | 615,650 |
| Year | Capacity (Megawatt Peak) | EoL Year | PV Waste Mass (Metric Tons) | PV Waste Volume (m3) |
|---|---|---|---|---|
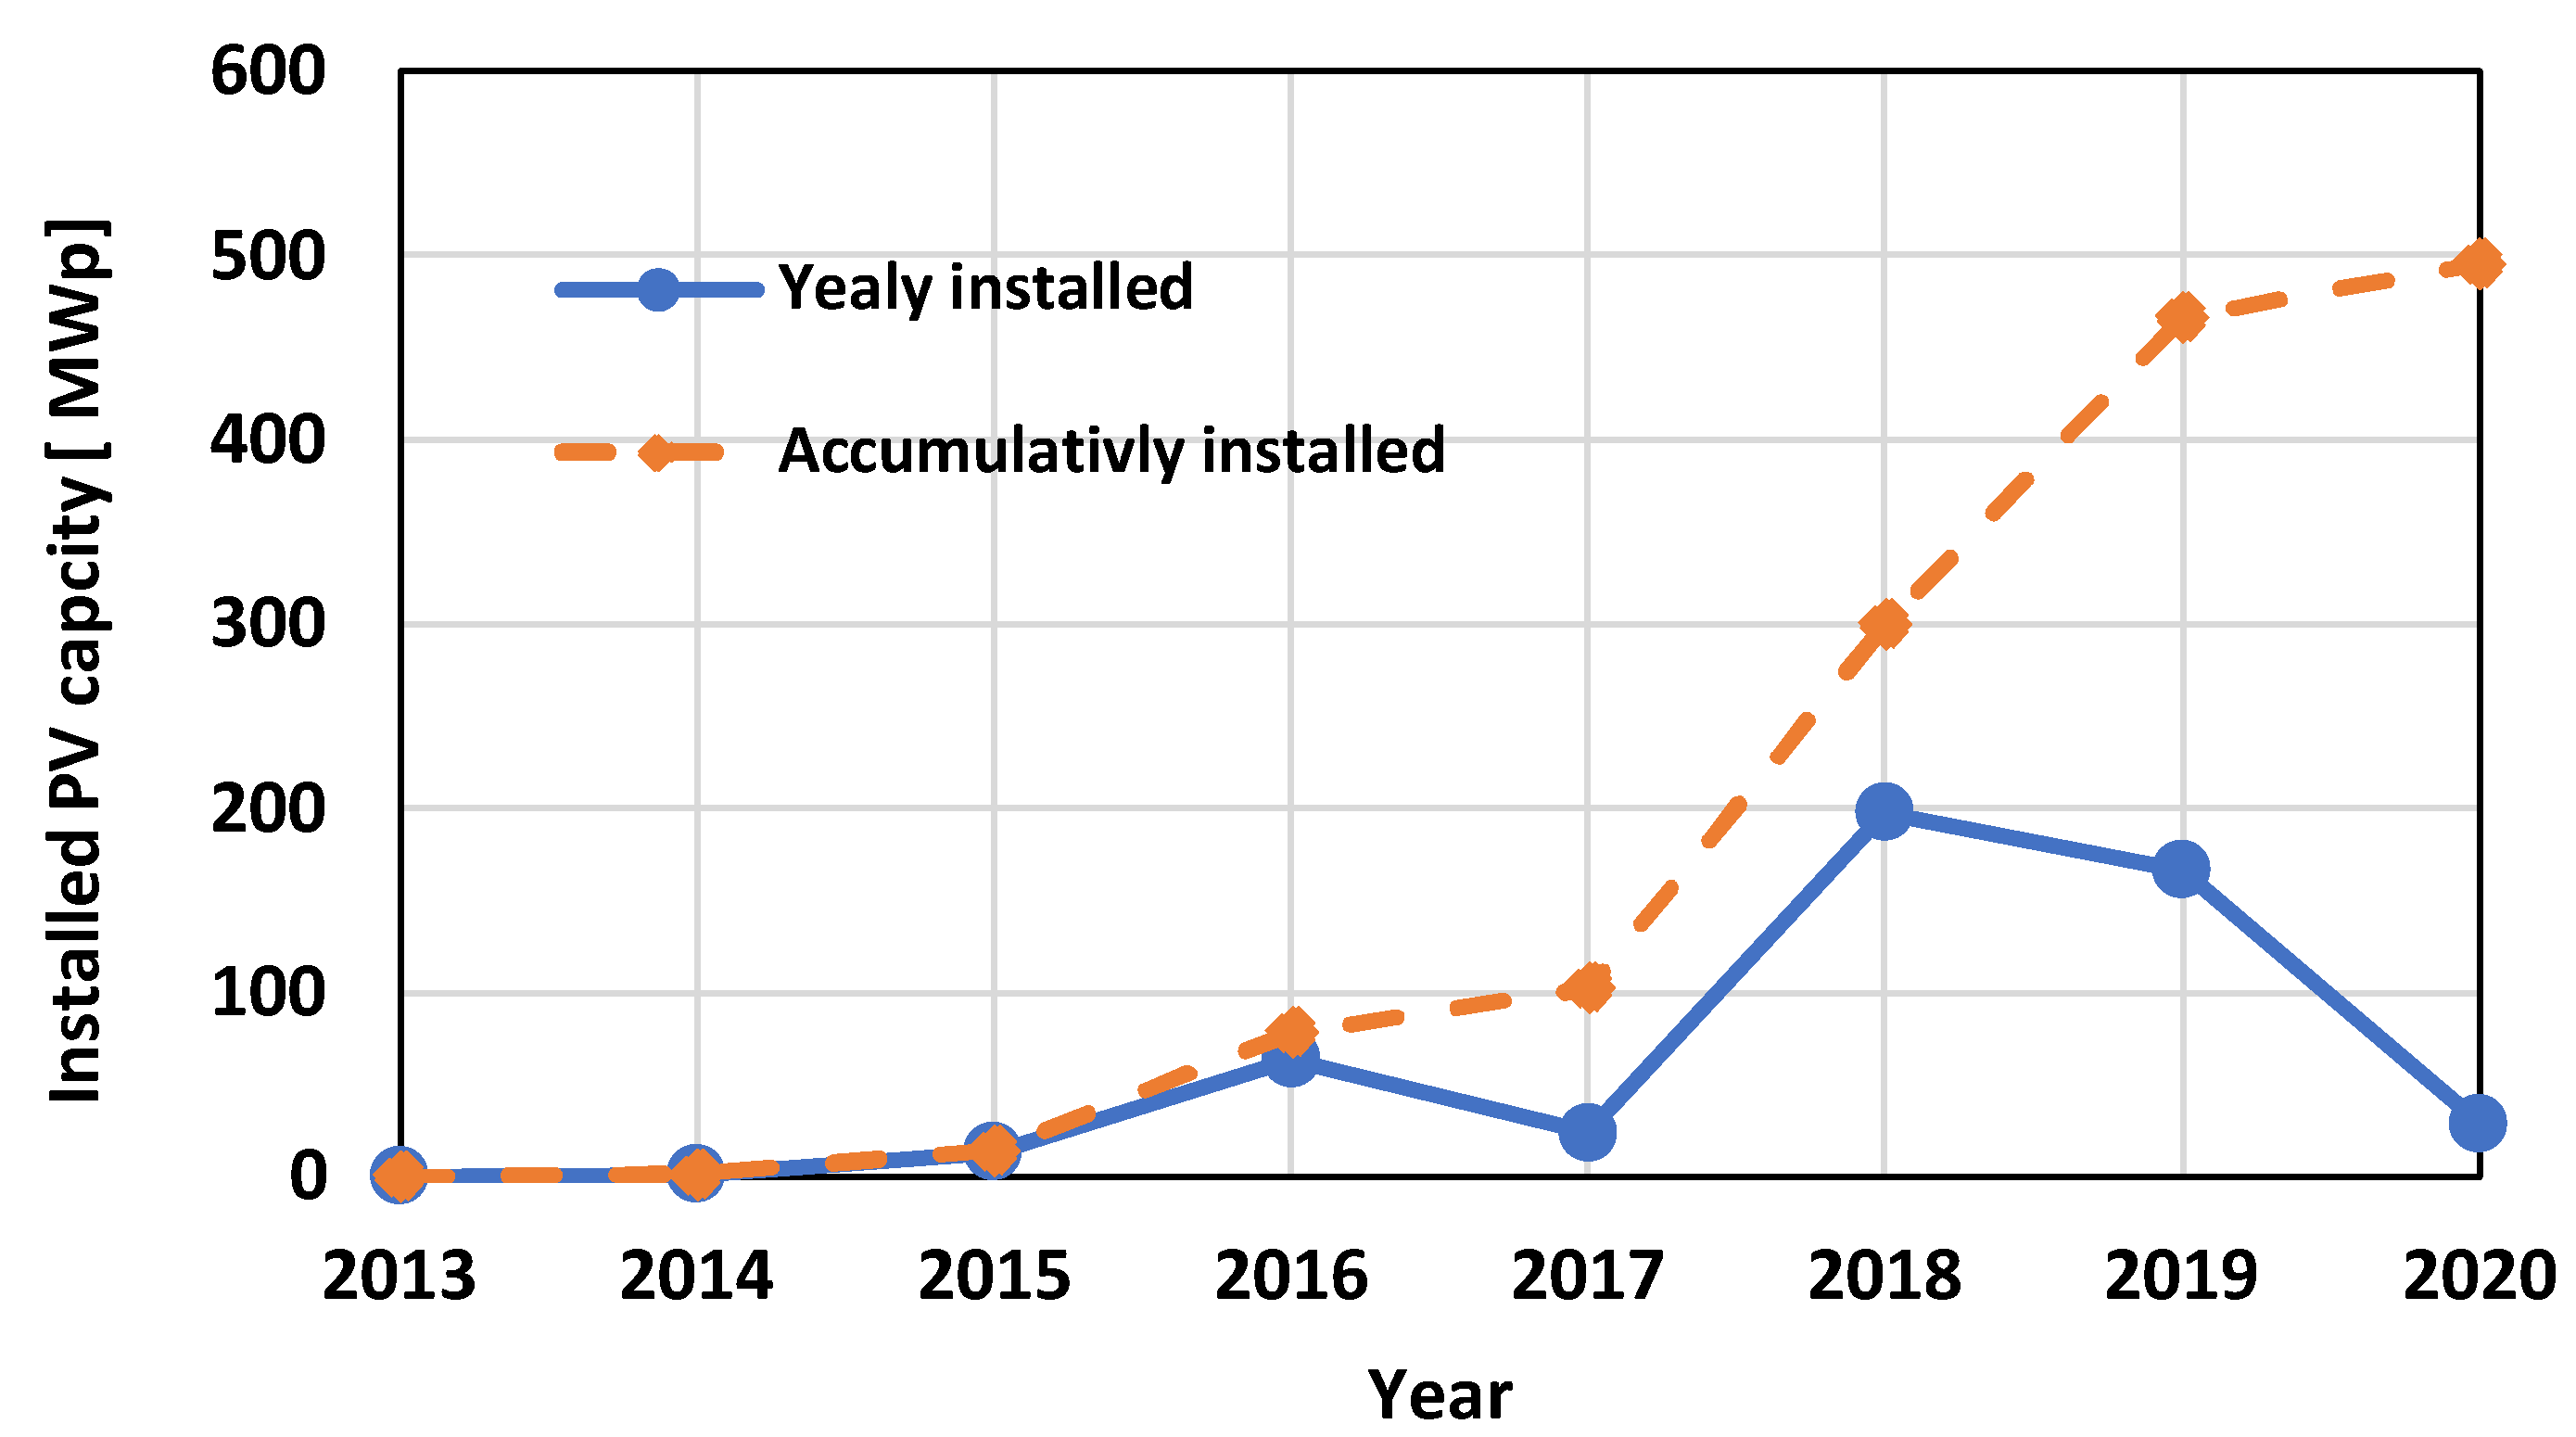
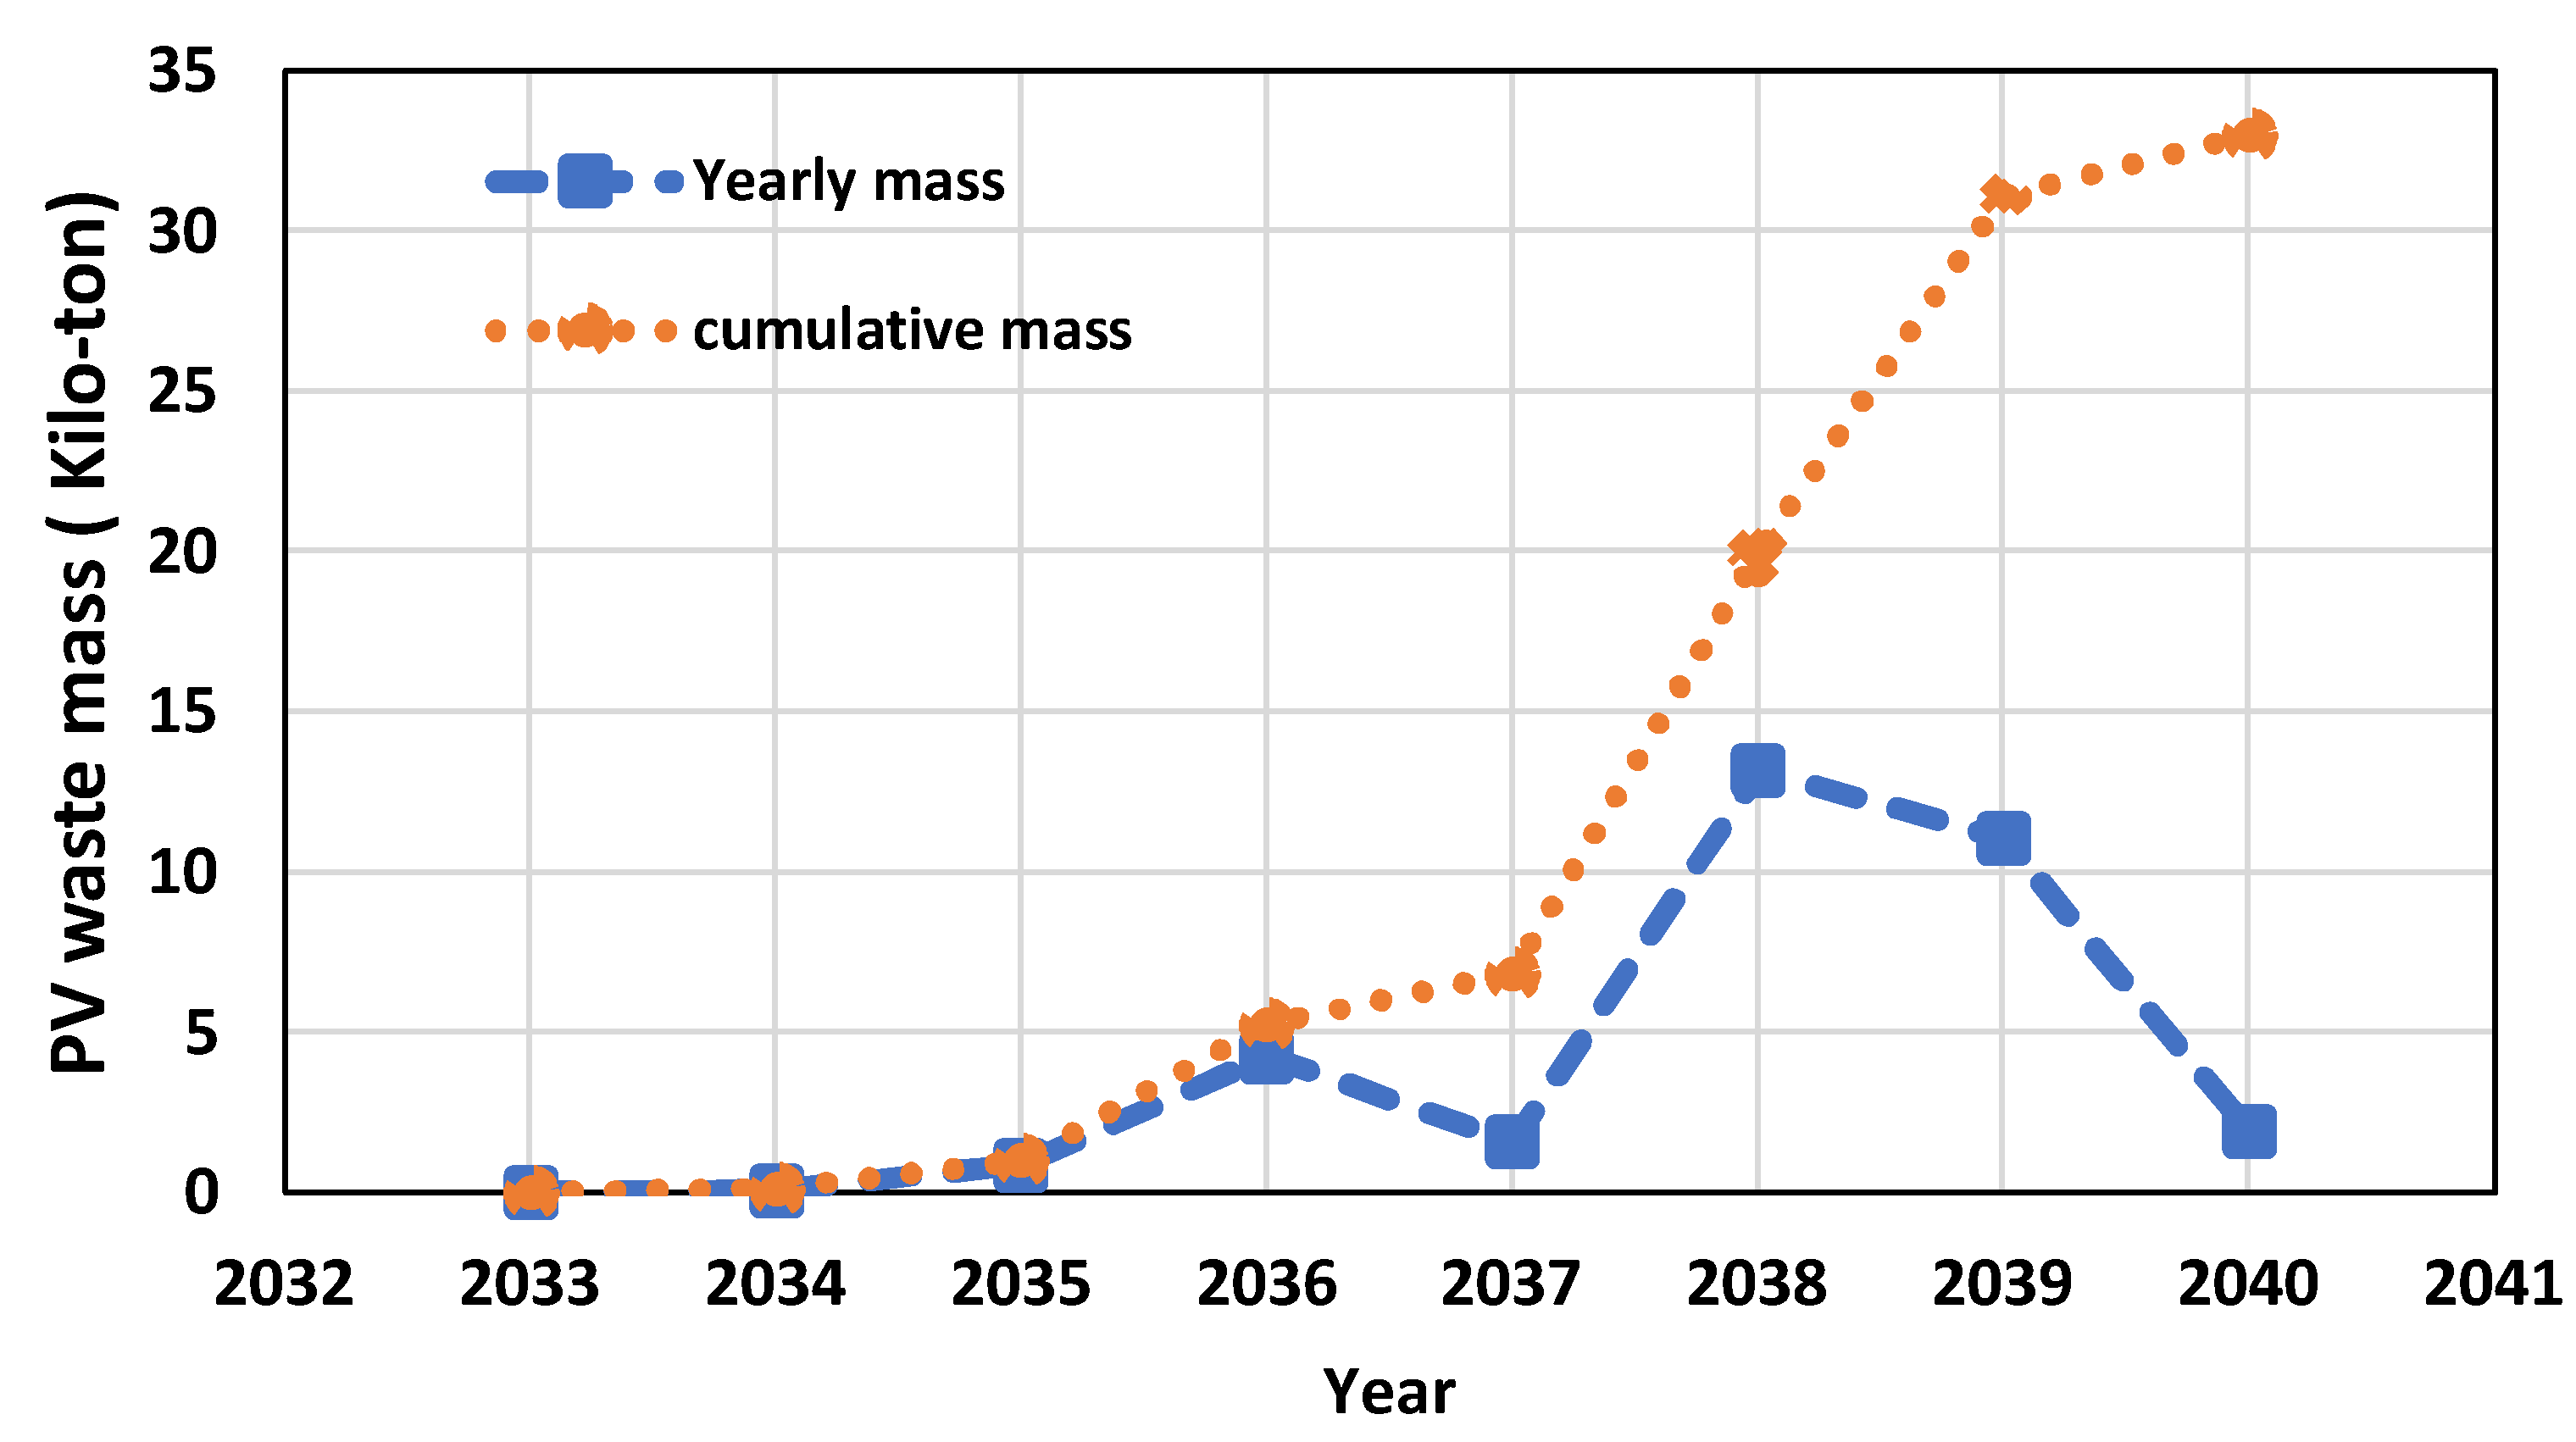
| 2013 | 0.4625 | 2033 | ~30.80 | ~83.25 |
| 2014 | 1.3552 | 2034 | ~90.25 | ~243.94 |
| 2015 | 13.2390 | 2035 | ~881.72 | ~2383.02 |
| 2016 | 63.8060 | 2036 | ~4249.48 | ~11,485.08 |
| 2017 | 23.8450 | 2037 | ~1588.10 | ~4292.10 |
| 2018 | 197.6600 | 2038 | ~13,164.16 | ~35,578.80 |
| 2019 | 166.4800 | 2039 | ~11,089.57 | ~29,966.40 |
| 2020 | 28.9610 | 2040 | ~1928.80 | ~5212.98 |
| Total | 495.81 | 33,022.88 | 89,245.80 |
| Year | Material Weight (Kg) | ||||||||
|---|---|---|---|---|---|---|---|---|---|
| Al | Al Frame | Si | Ag | Glass | Polymers | Cu | Sn | Pb | |
| 2033 | 83 | 3177 | 679 | 9.25 | 22,801 | 3422 | 1831 | 37 | 74 |
| 2034 | 243 | 9310 | 1992 | 27.1 | 66,811 | 10,028 | 5366 | 108 | 216 |
| 2035 | 2383 | 90,951 | 19,461 | 264.78 | 652,682 | 97,968 | 52,426 | 1059 | 2118 |
| 2036 | 11,584 | 438,347 | 93,794 | 1276.12 | 3,145,635 | 472,164 | 252,671 | 5105 | 10,210 |
| 2037 | 4292 | 163,815 | 35,052 | 476.90 | 1,175,558 | 176,453 | 94,426 | 1908 | 3816 |
| 2038 | 35,579 | 1,357,924 | 290,560 | 3953.20 | 9,744,638 | 1,462,684 | 782,733 | 15,813 | 31,626 |
| 2039 | 29,966 | 1,143,717 | 244,725 | 3329.60 | 8,207,464 | 1,231,952 | 659,260 | 13,318 | 26,636 |
| 2040 | 5213 | 198,962 | 42,572 | 579.22 | 1,427,777 | 214,311 | 114,685 | 2317 | 4634 |
| Total | 9343 | 3,406,203 | 728,838 | 9916 | 24,443,368 | 3,668,984 | 1,963,402 | 39,665 | 79,330 |
Publisher’s Note: MDPI stays neutral with regard to jurisdictional claims in published maps and institutional affiliations. |
© 2022 by the authors. Licensee MDPI, Basel, Switzerland. This article is an open access article distributed under the terms and conditions of the Creative Commons Attribution (CC BY) license (https://creativecommons.org/licenses/by/4.0/).
Share and Cite
AL-Zoubi, O.H.; Shawaqfah, M.; Almomani, F.; Damash, R.A.; Al-Zboon, K. Photovoltaic Solar Cells and Panels Waste in Jordan: Figures, Facts, and Concerns. Sustainability 2022, 14, 13313. https://doi.org/10.3390/su142013313
AL-Zoubi OH, Shawaqfah M, Almomani F, Damash RA, Al-Zboon K. Photovoltaic Solar Cells and Panels Waste in Jordan: Figures, Facts, and Concerns. Sustainability. 2022; 14(20):13313. https://doi.org/10.3390/su142013313
Chicago/Turabian StyleAL-Zoubi, Omar H., Moayyad Shawaqfah, Fares Almomani, Rebhi A. Damash, and Kamel Al-Zboon. 2022. "Photovoltaic Solar Cells and Panels Waste in Jordan: Figures, Facts, and Concerns" Sustainability 14, no. 20: 13313. https://doi.org/10.3390/su142013313