
Thermo-Economic Analysis of Innovative Integrated Power Cycles for Low-Temperature Heat Sources Based on Heat Transformer
Abstract
:1. Introduction
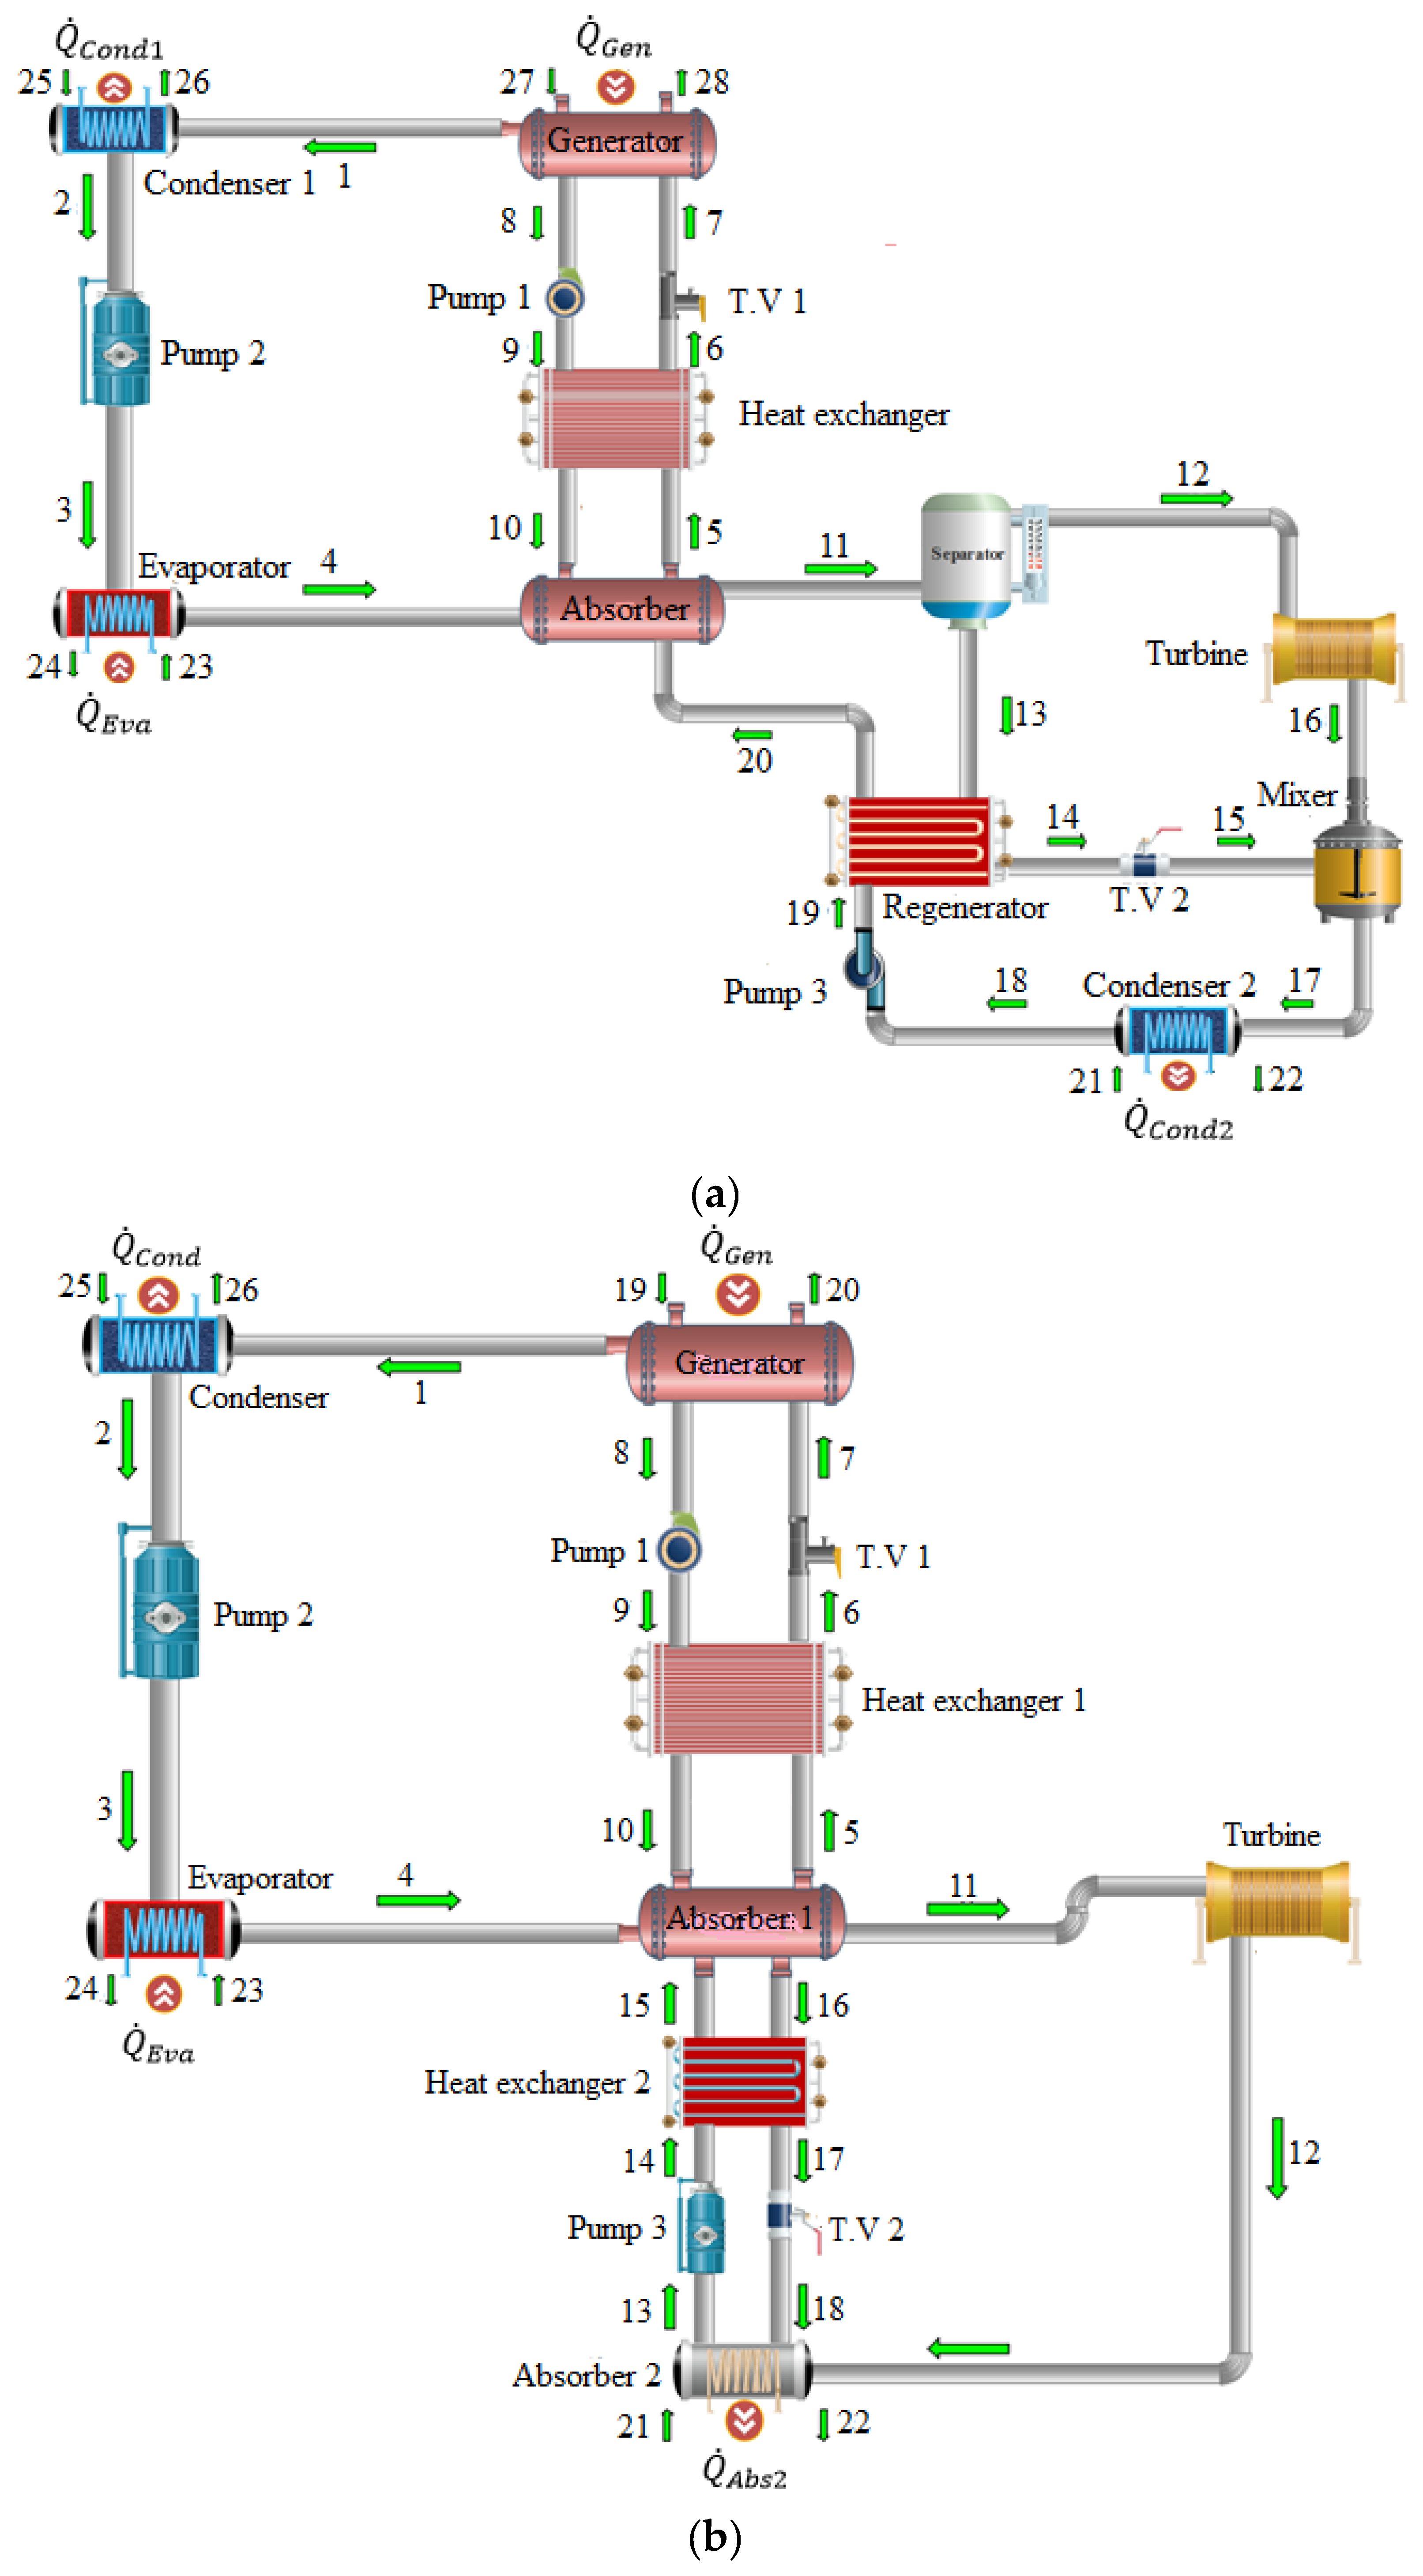
2. System Statement
3. Mathematical Modeling
- The systems work under steady conditions.
- The heat loss in the components and pressure drops in the pipelines are negligible.
- Variations in the potential and kinematic energies are not regarded.
- All turbines and pumps undergo an isentropic process.
- Outlets of condensers, evaporators, generators, and absorbers are presumed saturated.
3.1. Thermodynamic Analysis
3.2. Thermoeconomic Analysis
4. Model Validation
5. Results and Discussion
6. Parametric Study
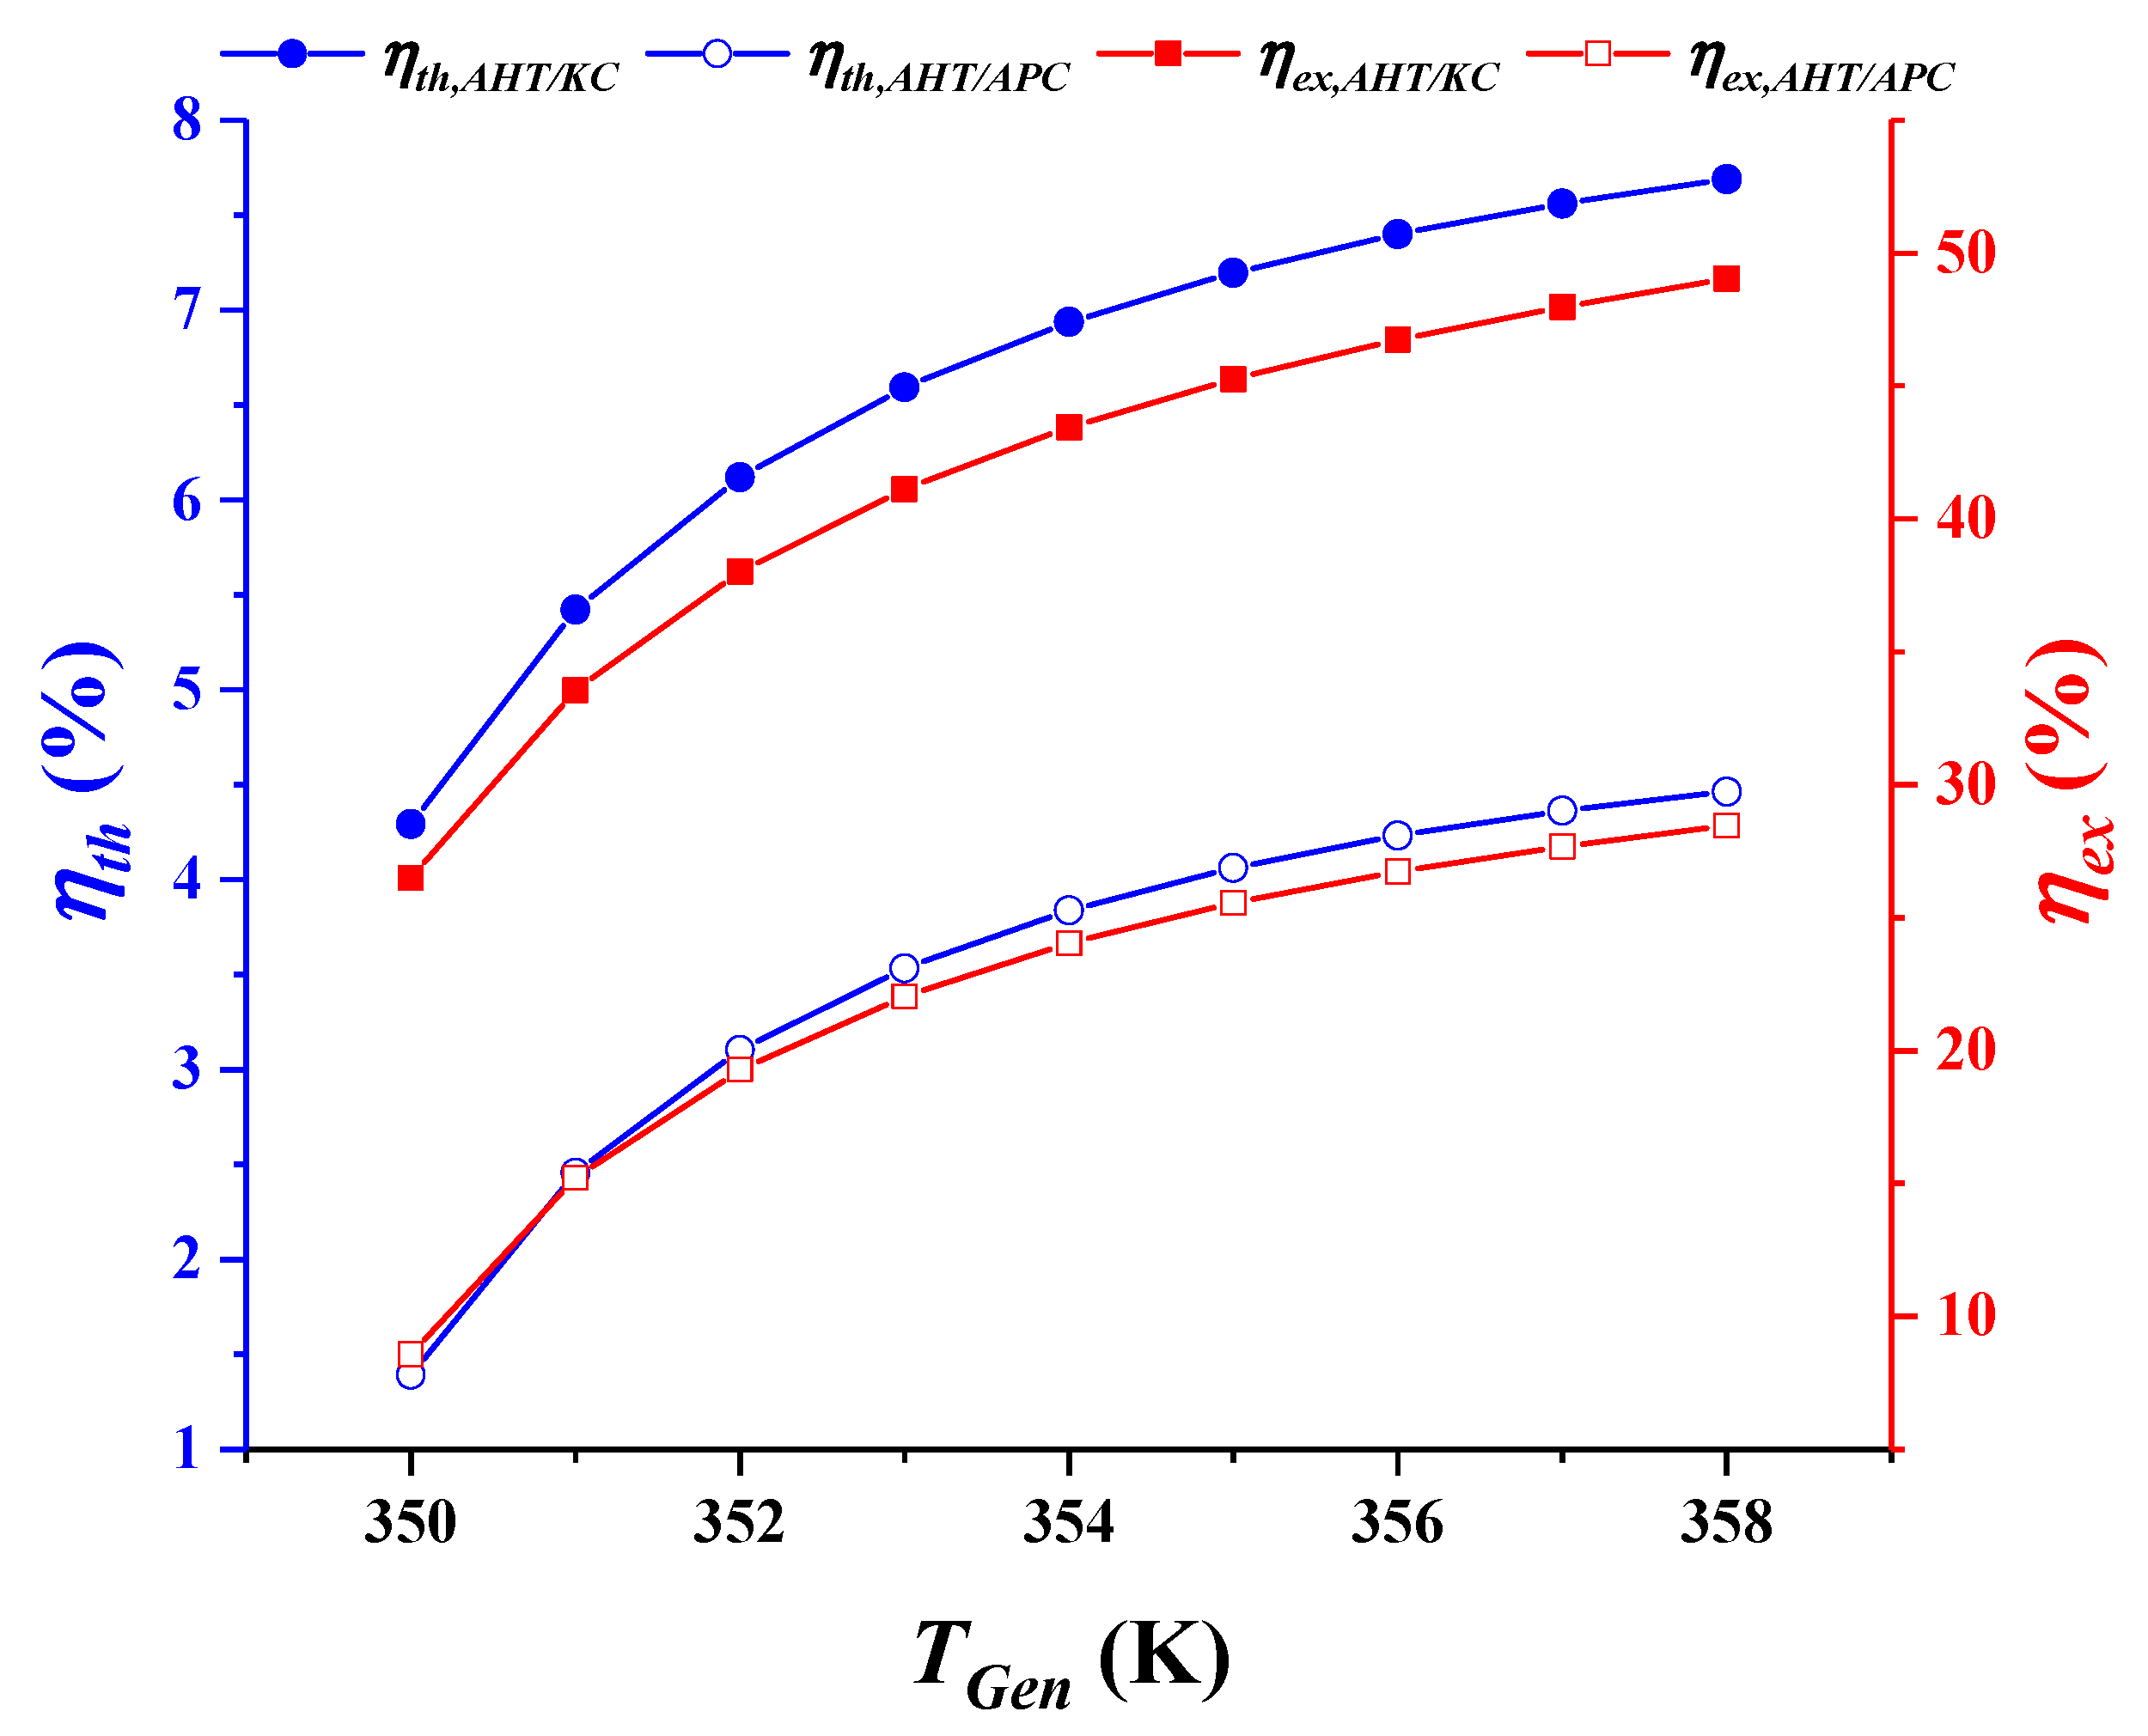
6.1. The Effect of Generator Temperature
6.2. Effect of Absorber Temperature
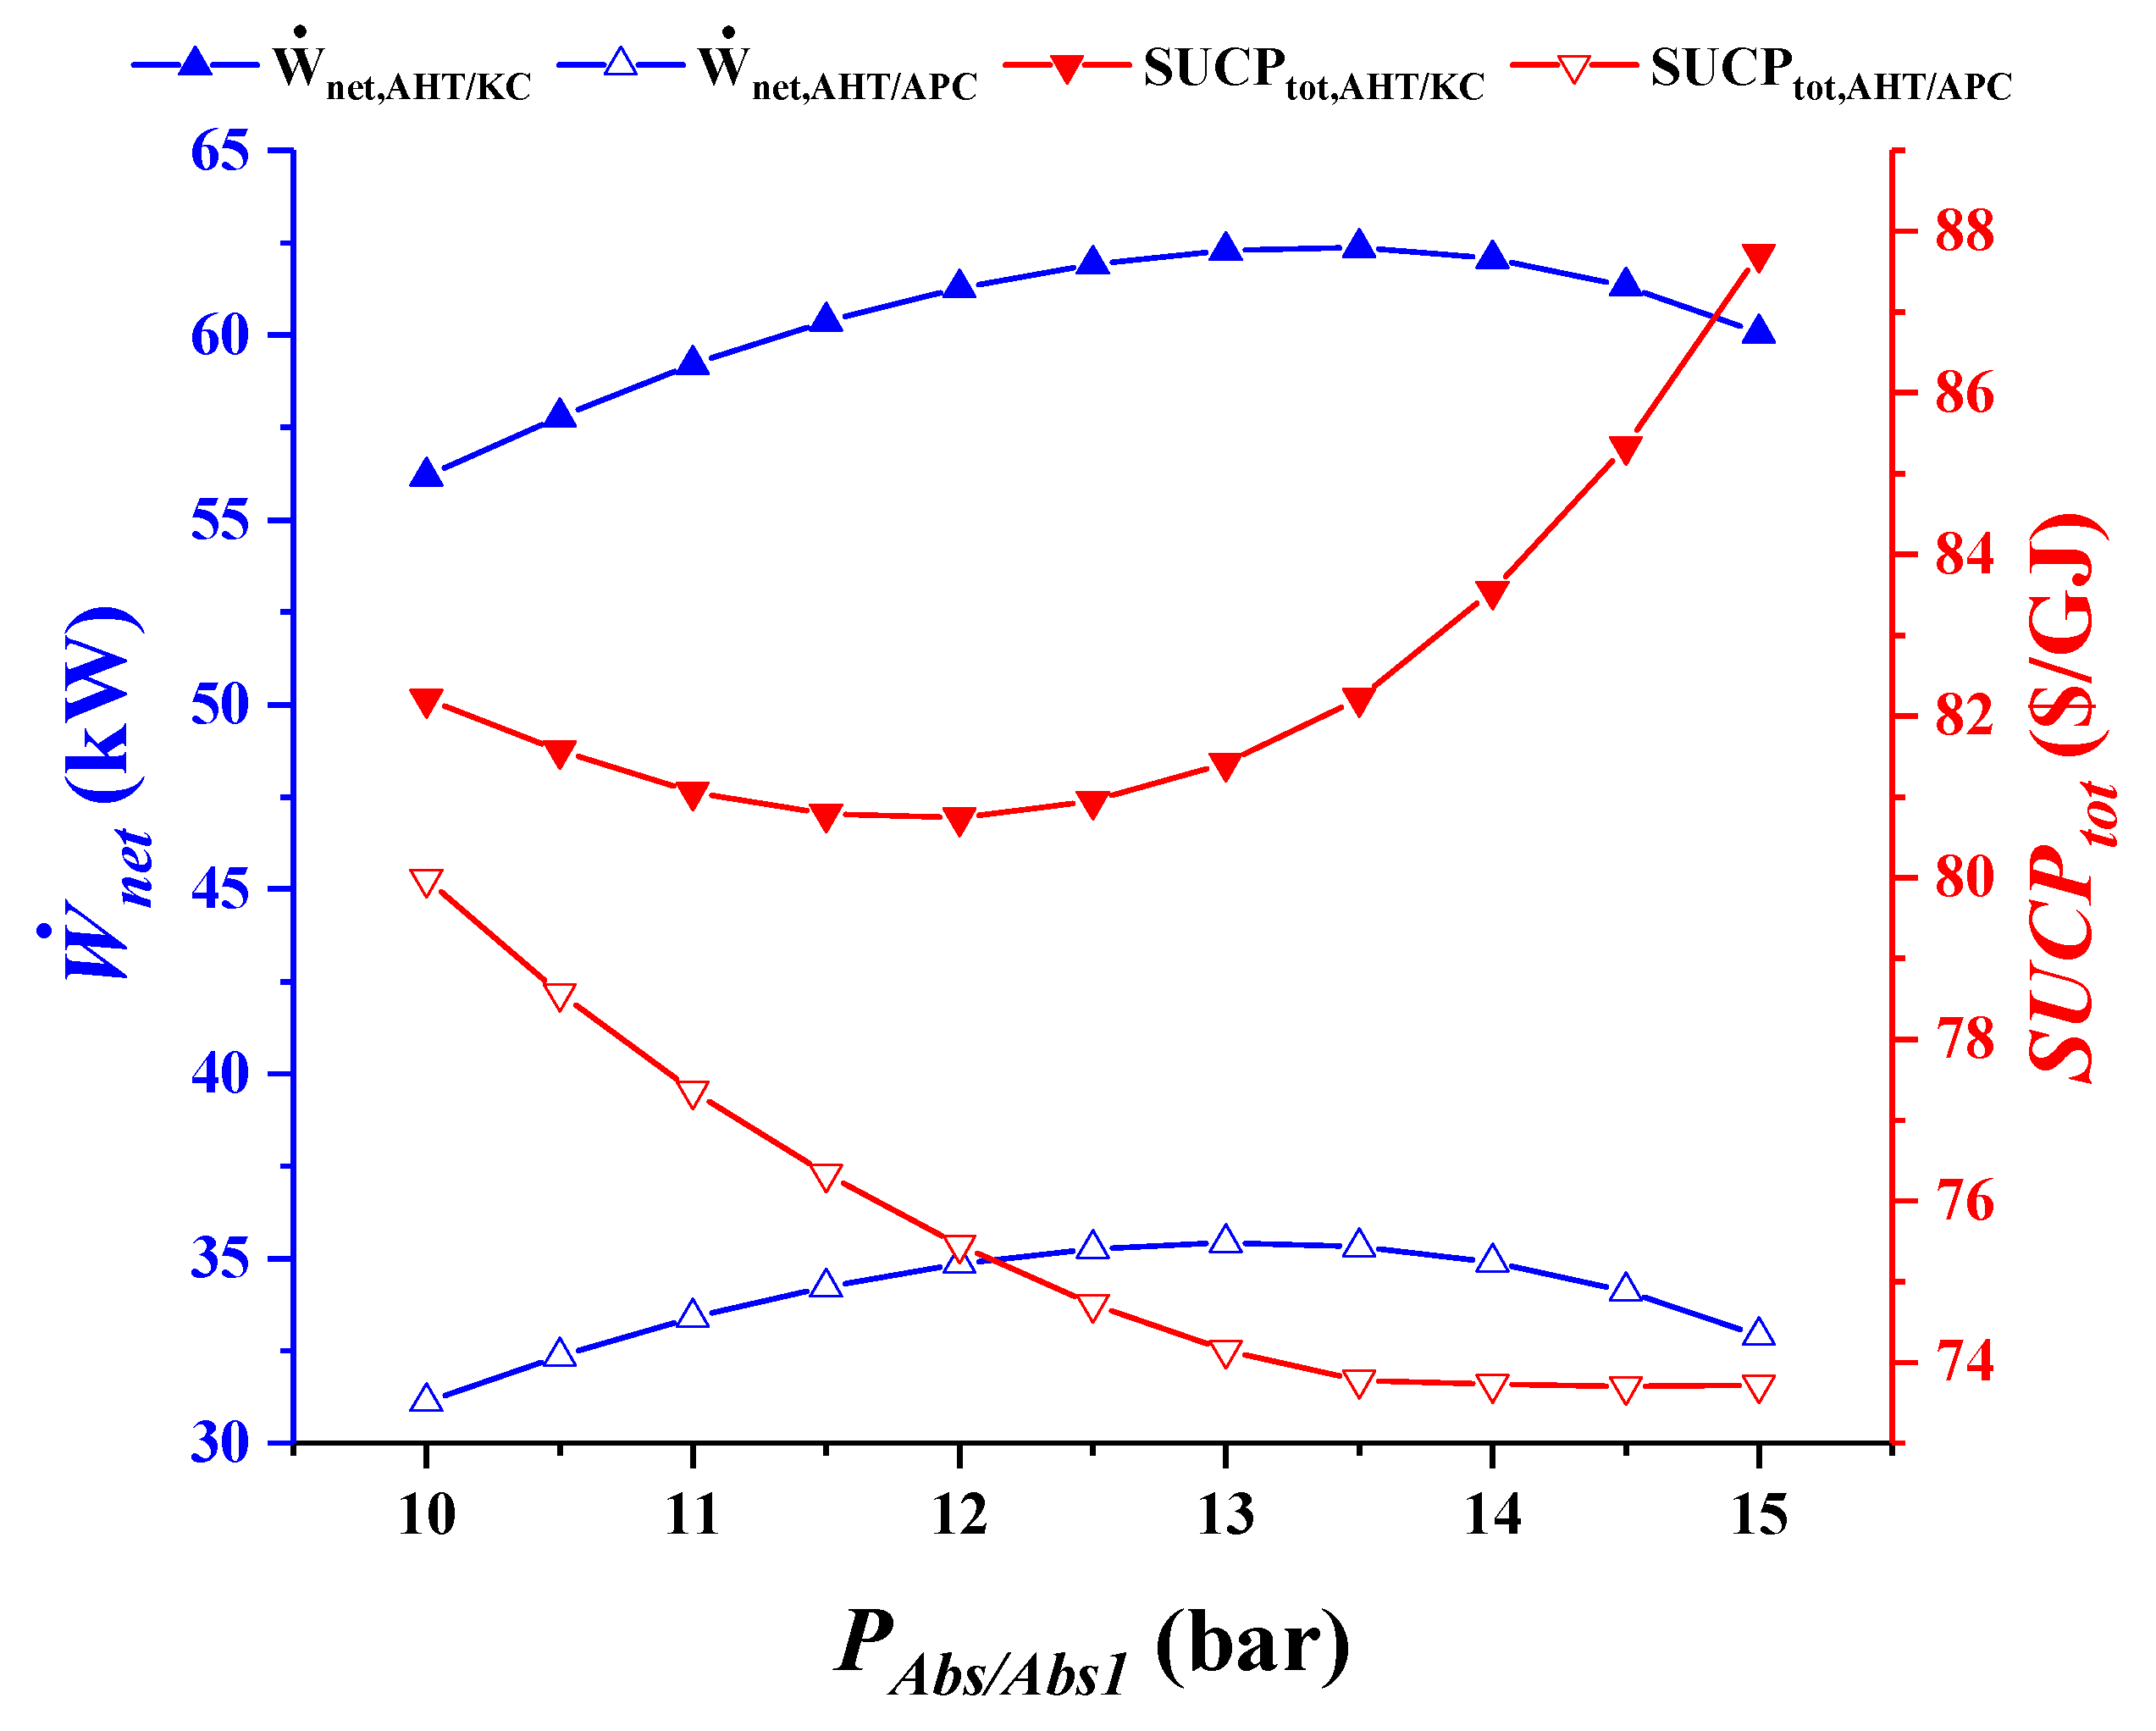
6.3. Effect of Absorber Pressure
6.4. Effect of Ammonia Concentration
6.5. Effect of Condenser 2 Temperature
6.6. Effect of Absorber 2 Temperature
7. Conclusions
- The maximum value of the thermal efficiency belongs to the AHT/KC cycle with 7.69%.
- The maximum exergy efficiency is calculated 49.03% for the AHT/KC cycle.
- The maximum exergy destruction rate in the AHT/KC and AHT/APC is related to throttle valve 1 and absorber 1, respectively.
- Among all components, the turbine in the AHT/KC cycle and the generator in the AHT/APC cycle have the highest investment cost, respectively. In addition, the investment cost associated with the mixer and separator in the AHT/KC cycle and the throttling valves is the lowest one.
- The energetic performance of the proposed power cycles improves with the rise of generator temperature, while it decreases with condenser temperature. Furthermore, it has a polynomial trend with absorber temperature, absorber pressure, and ammonia concentration.
- From the exergy perspective, the cycles’ efficiency is boosted with the rise of generator temperature and is decreased with the increment of ammonia concentration and condenser and absorber temperature.
8. Future Work
Author Contributions
Funding
Institutional Review Board Statement
Informed Consent Statement
Data Availability Statement
Conflicts of Interest
Nomenclature
| Symbols | Subscripts and Superscripts | ||
| AHT | absorption Heat Transformer | ch | chemical |
| APC | absorption Power Cycle | Abs | absorber |
| c | cost per energy unit ($ GJ−1) | CI | capital investment |
| cost rate ($ yr−1) | Cond | condenser | |
| COP | coefficient of performance | CV | control volume |
| CR | circulation rate | D | destruction |
| CRF | capital recovery factor | Eva | evaporator |
| ECOP | exergetic coefficient of performance | ex | exergy |
| Ex | exergy per unit mass (kWkg−1) | F | fuel |
| x | exergy rate (kW) | fk | exergoeconomic factor (%) |
| h | specific enthalpy (kJ kg−1) | Gen | generator |
| HP | heat pump | Geo | geothermal |
| ir | interest rate | HE | heat exchanger |
| KC | Kalina Cycle | i | ith component |
| mass flow rate (kg s−1) | in | inlet | |
| N | annual number of hours (h) | is | isentropic |
| n | components expected life | k | kth component |
| molar flow rate (mol s−1) | L | loss | |
| P | pressure (bar) | Mix | mixer |
| Q | heat transfer (kJ) | net | net value |
| heat transfer rate (kW) | OM | operating and maintenance | |
| universal gases constant (J kg−1 K−1) | out | outlet | |
| S | specific entropy (kJ kg−1 K−1) | P | product |
| SUCP | sum unit cost of the product | ph | physical |
| T | temperature (K) | PP | pinch point |
| TTD | terminal temperature difference | Pum | pump |
| TV | throttling valve | R | reference |
| U | overall heat transfer coefficient (kW m−2 K−1) | Reg | regenerator |
| power (kW) | rk | relative cost difference (%) | |
| X | ammonia concentration (%) | s | constant entropy |
| XB | basic ammonia concentration (%) | Sep | separator |
| yi | molar concentration | Th | thermal |
| Z | investment cost of components ($) | Tot | total value |
| investment cost rate of components ($ yr−1) | Tur | turbine | |
| Greek symbols | TV | throttling valve | |
| ε | effectiveness | w | work |
| η | efficiency (%) | 1,2,… | cycle locations |
| ϕr | maintenance factor | 0 | dead state |
References
- Aleklett, K.; Höök, M.; Jakobsson, K.; Lardelli, M.; Snowden, S.; Söderbergh, B. The peak of the oil age–analyzing the world oil production reference scenario in world energy outlook 2008. Energy Policy 2010, 38, 1398–1414. [Google Scholar] [CrossRef]
- Boyle, G. (Ed.) Renewable Energy: Power for a Sustainable Future, Second Edition, 2nd ed.; Oxford University Press: Oxford, UK, 2004; p. 456. ISBN 10 0199261784. [Google Scholar]
- Parham, K.; Khamooshi, M.; Tematio, D.B.K.; Yari, M.; Atikol, U. Absorption heat transformers—A comprehensive review. Renew. Sustain. Energy Rev. 2014, 34, 430–452. [Google Scholar] [CrossRef]
- Jensen, J.K.; Markussen, W.B.; Reinholdt, L.; Elmegaard, B. On the development of high temperature ammonia–water hybrid absorption–compression heat pumps. Int. J. Refrig. 2015, 58, 79–89. [Google Scholar] [CrossRef] [Green Version]
- Aikins, K.A.; Lee, S.-H.; Choi, J.M.I.N. Technology review of two-stage vapor compression heat pump system. Int. J. Air-Cond. Refrig. 2013, 21, 1330002. [Google Scholar] [CrossRef]
- Eini, S.; Shahhosseini, H.; Delgarm, N.; Lee, M.; Bahadori, A. Multi-objective optimization of a cascade refrigeration system: Exergetic, economic, environmental, and inherent safety analysis. Appl. Therm. Eng. 2016, 107, 804–817. [Google Scholar] [CrossRef]
- Huicochea, A.; Rivera, W.; Gutiérrez-Urueta, G.; Bruno, J.C.; Coronas, A. Thermodynamic analysis of a trigeneration system consisting of a micro gas turbine and a double effect absorption chiller. Appl. Therm. Eng. 2011, 31, 3347–3353. [Google Scholar] [CrossRef]
- Liu, F.; Sui, J.; Liu, T.; Jin, H. Energy and exergy analysis in typical days of a steam generation system with gas boiler hybrid solar-assisted absorption heat transformer. Appl. Therm. Eng. 2017, 115, 715–725. [Google Scholar] [CrossRef]
- Singh, A.; Das, R. Improved exergy evaluation of ammonia-water absorption refrigeration system using inverse method. J. Energy Resour. Technol. 2021, 143, 44–50. [Google Scholar] [CrossRef]
- Yari, M.; Zare, V.; Mahmoudi, S.M.S. Parametric study and optimization of an ejector-expansion TRCC cycle integrated with a water purification system. Proc. Inst. Mech. Eng. Part A J. Power Energy 2013, 227, 383–398. [Google Scholar] [CrossRef]
- Jain, V.; Sachdeva, G. Energy, exergy, economic (3E) analyses and multi-objective optimization of vapor absorption heat transformer using NSGA-II technique. Energy Convers. Manag. 2017, 148, 1096–1113. [Google Scholar] [CrossRef]
- Sun, F.; Hao, B.; Fu, L.; Wu, H.; Xie, Y. New medium-low temperature hydrothermal geothermal district heating system based on distributed electric compression heat pumps and a centralized absorption heat transformer. Energy 2021, 232, 120974. [Google Scholar] [CrossRef]
- Ghiasirad, H.; Asgari, N.; Saray, R.K.; Mirmasoumi, S. Thermoeconomic assessment of a geothermal based combined cooling, heating, and power system, integrated with a humidification-dehumidification desalination unit and an absorption heat transformer. Energy Convers. Manag. 2021, 235, 113969. [Google Scholar] [CrossRef]
- Tian, H.; Wang, X.; Shu, G.; Wu, M.; Yan, N.; Ma, X. A quantitative risk-assessment system (QR-AS) evaluating operation safety of Organic Rankine Cycle using flammable mixture working fluid. J. Hazard. Mater. 2017, 338, 394–409. [Google Scholar] [CrossRef] [PubMed]
- Lee, Y.; Kim, J.; Ahmed, U.; Kim, C.; Lee, Y.-W. Multi-objective optimization of Organic Rankine Cycle (ORC) design considering exergy efficiency and inherent safety for LNG cold energy utilization. J. Loss Prev. Process Ind. 2019, 58, 90–101. [Google Scholar] [CrossRef]
- Kalina, A.I. Combined cycle and waste heat recovery power systems based on a novel thermodynamic energy cycle utilizing low-temperature heat for power generation. In Proceedings of the 1983 Joint Power Generation Conference: GT papers, Indianapolis, IN, USA, 25–29 September 1983. [Google Scholar]
- Coskun, A.; Bolatturk, A.; Kanoglu, M. Thermodynamic and economic analysis and optimization of power cycles for a medium temperature geothermal resource. Energy Convers. Manag. 2014, 78, 39–49. [Google Scholar] [CrossRef]
- Rezaee, V.; Houshmand, A. Energy and exergy analysis of a combined power generation system using PEM fuel cell and Kalina Cycle System 11. Period. Polytech. Chem. Eng. 2016, 60, 98–105. [Google Scholar] [CrossRef]
- Cao, L.; Wang, J.; Dai, Y. Thermodynamic analysis of a biomass-fired Kalina cycle with regenerative heater. Energy 2014, 77, 760–770. [Google Scholar] [CrossRef]
- Ghaebi, H.; Parikhani, T.; Rostamzadeh, H.; Farhang, B. Proposal and assessment of a novel geothermal combined cooling and power cycle based on Kalina and ejector refrigeration cycles. Appl. Therm. Eng. 2018, 130, 767–781. [Google Scholar] [CrossRef]
- Lolos, P.A.; Rogdakis, E.D. A Kalina power cycle driven by renewable energy sources. Energy 2009, 34, 457–464. [Google Scholar] [CrossRef]
- Ghaebi, H.; Farhang, B.; Rostamzadeh, H.; Parikhani, T. Energy, exergy, economic and environmental (4E) analysis of using city gate station (CGS) heater waste for power and hydrogen production: A comparative study. Int. J. Hydrog. Energy 2018, 43, 1855–1874. [Google Scholar] [CrossRef]
- Rostamzadeh, H.; Ebadollahi, M.; Ghaebi, H.; Shokri, A. Comparative study of two novel micro-CCHP systems based on organic Rankine cycle and Kalina cycle. Energy Convers. Manag. 2019, 183, 210–229. [Google Scholar] [CrossRef]
- Mirolli, M.D. The Kalina cycle for cement kiln waste heat recovery power plants. In Proceedings of the Conference Record Cement Industry Technical Conference, Kansas City, MO, USA, 15–20 May 2005; pp. 330–336. [Google Scholar]
- Singh, O.K.; Kaushik, S.C. Energy and exergy analysis and optimization of Kalina cycle coupled with a coal fired steam power plant. Appl. Therm. Eng. 2013, 51, 787–800. [Google Scholar] [CrossRef]
- Ghaebi, H.; Parikhani, T.; Rostamzadeh, H.; Farhang, B. Thermodynamic and thermoeconomic analysis and optimization of a novel combined cooling and power (CCP) cycle by integrating of ejector refrigeration and Kalina cycles. Energy 2017, 139, 262–276. [Google Scholar] [CrossRef]
- Cao, L.; Wang, J.; Wang, H.; Zhao, P.; Dai, Y. Thermodynamic analysis of a Kalina-based combined cooling and power cycle driven by low-grade heat source. Appl. Therm. Eng. 2017, 111, 8–19. [Google Scholar] [CrossRef]
- Fallah, M.; Mahmoudi, S.M.S.; Yari, M.; Ghiasi, R.A. Advanced exergy analysis of the Kalina cycle applied for low temperature enhanced geothermal system. Energy Convers. Manag. 2016, 108, 190–201. [Google Scholar] [CrossRef]
- Zheng, S.; Chen, K.; Du, Y.; Fan, G.; Dai, Y.; Zhao, P.; Wang, J. Comparative analysis on off-design performance of a novel parallel dual-pressure Kalina cycle for low-grade heat utilization. Energy Convers. Manag. 2021, 234, 113912. [Google Scholar] [CrossRef]
- Singh, A.; Das, R. A novel combined power and cooling cycle design and a modified conditional exergy destruction approach. Energy Convers. Manag. 2021, 233, 113943. [Google Scholar] [CrossRef]
- Wang, Y.; Chen, T.; Liang, Y.; Sun, H.; Zhu, Y. A novel cooling and power cycle based on the absorption power cycle and booster-assisted ejector refrigeration cycle driven by a low-grade heat source: Energy, exergy and exergoeconomic analysis. Energy Convers. Manag. 2020, 204, 112321. [Google Scholar] [CrossRef]
- Ayou, D.S.; Bruno, J.C.; Coronas, A. Integration of a mechanical and thermal compressor booster in combined absorption power and refrigeration cycles. Energy 2017, 135, 327–341. [Google Scholar] [CrossRef]
- Parikhani, T.; Ghaebi, H.; Rostamzadeh, H. A novel geothermal combined cooling and power cycle based on the absorption power cycle: Energy, exergy and exergoeconomic analysis. Energy 2018, 153, 265–277. [Google Scholar] [CrossRef]
- Horuz, I.; Kurt, B. Single stage and double absorption heat transformers in an industrial application. Int. J. Energy Res. 2009, 33, 787–798. [Google Scholar] [CrossRef]
- Rostamzadeh, H.; Nourani, P. Investigating potential benefits of a salinity gradient solar pond for ejector refrigeration cycle coupled with a thermoelectric generator. Energy 2019, 172, 675–690. [Google Scholar] [CrossRef]
- Ghaebi, H.; Namin, A.S.; Rostamzadeh, H. Performance assessment and optimization of a novel multi-generation system from thermodynamic and thermoeconomic viewpoints. Energy Convers. Manag. 2018, 165, 419–439. [Google Scholar] [CrossRef]
- Bejan, A.; Tsatsaronis, G.; Moran, M.J. Thermal Design and Optimization; John Wiley & Sons: Hoboken, NJ, USA, 1995. [Google Scholar]
- Best, R.; Eisa, M.A.R.; Holland, F.A. Thermodynamic design data for absorption heat transformers—III. Operating on ammonia-water. Heat Recover. Syst. CHP 1987, 7, 259–272. [Google Scholar] [CrossRef]
- Wakim, M.; Rivera-Tinoco, R. Absorption heat transformers: Sensitivity study to answer existing discrepancies. Renew. Energy 2019, 130, 881–890. [Google Scholar] [CrossRef]
- He, J.; Liu, C.; Xu, X.; Li, Y.; Wu, S.; Xu, J. Performance research on modified KCS (Kalina cycle system) 11 without throttle valve. Energy 2014, 64, 389–397. [Google Scholar] [CrossRef]
- Ghaebi, H.; Parikhani, T.; Rostamzadeh, H. A novel trigeneration system using geothermal heat source and liquefied natural gas cold energy recovery: Energy, exergy and exergoeconomic analysis. Renew. Energy 2018, 119, 513–527. [Google Scholar] [CrossRef]
- Shokati, N.; Ranjbar, F.; Yari, M. A comparative analysis of rankine and absorption power cycles from exergoeconomic viewpoint. Energy Convers. Manag. 2014, 88, 657–668. [Google Scholar] [CrossRef]


| Parameter | Value |
|---|---|
| (K) | 298 |
| (bar) | 1.013 |
| (K) | 363 |
| (K) | 363 |
| (kg s−1) | 10 |
| (bar) | 2.5 |
| (K) | 5 |
| (K) | 403 |
| (K) | 298 |
| (K) | 10 |
| (bar) | 15 |
| (bar) | 12 |
| (%) | 40 |
| (%) | 40 |
| ) (K) | 10 |
| (K) | 303 |
| (K) | 316 |
| Pump’s isentropic efficiency, ηis,Pum (%) | 85 |
| Turbine’s isentropic efficiency, ηis,Tur (%) | 90 |
| (%) | 80 |
| Component | Mass and Energy Balance Equations | Exergy Equations | |
|---|---|---|---|
| Fuel | Product | ||
| (a) AHT/KC | |||
| Condenser1 | , , , | ||
| Generator | , , , , | ||
| Pump2 | , , | ||
| Pump1 | , , | ||
| T.V1 | , | ||
| Heat Exchanger | , , , | ||
| Evaporator | , , , | ||
| Absorber | , , | ||
| Separator | , | ||
| Turbine | , , | ||
| Regenerator | , , , | ||
| T.V2 | , | ||
| Mixer | , | ||
| Pump3 | , , | ||
| Condenser2 | , , , | ||
| (b) AHT/APC | |||
| Condenser | , , , | ||
| Generator | , , , , | ||
| Pump2 | , , | ||
| Pump1 | , , | ||
| T.V1 | , | ||
| Heat Exchanger1 | , , , , | ||
| Evaporator | , , , | ||
| Absorber1 | , , , | ||
| Turbine | , , | ||
| Heat Exchanger2 | , , , , | ||
| Pump3 | , , | ||
| T.V2 | , | ||
| Absorber2 | , , , , | ||
| Component | Cost Balance Equations | Auxiliary Equations | Equipment Cost |
|---|---|---|---|
| (a) AHT/KC | |||
| Condenser1 | |||
| Generator | |||
| Pump2 | |||
| Pump1 | |||
| T.V1 | |||
| Heat Exchanger | |||
| Evaporator | |||
| Absorber | |||
| Separator | |||
| Turbine | |||
| Regenerator | |||
| T.V2 | |||
| Mixer | |||
| Pump3 | |||
| Condenser2 | |||
| (b) AHT/APC | |||
| Condenser | |||
| Generator | |||
| Pump2 | |||
| Pump1 | |||
| T.V1 | |||
| Heat Exchanger1 | |||
| Evaporator | |||
| Absorber1 | |||
| Turbine | |||
| Heat Exchanger2 | |||
| Pump3 | |||
| T.V2 | |||
| Absorber2 | |||
| Component | U (kW m−2 K−1) |
|---|---|
| Absorber | 0.6 |
| Condenser | 1.1 |
| Evaporator | 1.5 |
| Generator | 1.6 |
| Heat Exchanger | 1 |
| Regenerator | 1 |
| Parameter | Present Work | Ref. | Relative Error (%) |
|---|---|---|---|
| First law efficiency (%) | 10.69 | 10.71 | 0.19 |
| Mass flow rate across turbine (kg s−1) | 4.26 | 4.356 | 2.2 |
| Steam generator thermal power (MW) | 9.387 | 9.335 | 0.56 |
| State | Fluid | T (K) | P (bar) | X (-) | h (kJ kg−1) | s (kJ kg−1 K−1) | (kg s−1) | ($ yr−1) | c ($ GJ−1) | |
|---|---|---|---|---|---|---|---|---|---|---|
| 1 | Ammonia | 358 | 10.03 | 1 | 1646 | 5.816 | 0.717 | 239 | 212,800 | 28.24 |
| 2 | Ammonia | 298.2 | 10.03 | 1 | 317.7 | 1.409 | 0.717 | 229 | 203,904 | 28.24 |
| 3 | Ammonia | 299.3 | 45.94 | 1 | 324.7 | 1.412 | 0.717 | 233.2 | 220,141 | 29.93 |
| 4 | Ammonia | 358 | 45.94 | 1 | 1468 | 4.681 | 0.717 | 254.2 | 334,292 | 29.93 |
| 5 | Ammonia-Water | 403.1 | 45.94 | 0.548 | 380.9 | 1.647 | 2.738 | 314.7 | 414,931 | 41.8 |
| 6 | Ammonia-Water | 379.4 | 45.94 | 0.548 | 258.2 | 1.334 | 2.738 | 234.8 | 309,586 | 41.8 |
| 7 | Ammonia-Water | 341.4 | 10.03 | 0.548 | 258.2 | 1.381 | 2.738 | 195.8 | 309,652 | 50.14 |
| 8 | Ammonia-Water | 358 | 10.03 | 0.3876 | 152.4 | 1.06 | 2.021 | 54.46 | 165,335 | 96.28 |
| 9 | Ammonia-Water | 358.7 | 45.94 | 0.3876 | 157.6 | 1.062 | 2.021 | 63.66 | 198,406 | 98.83 |
| 10 | Ammonia-Water | 394.3 | 45.94 | 0.3876 | 323.7 | 1.503 | 2.021 | 133.5 | 308,600 | 73.32 |
| 11 | Ammonia-Water | 384.3 | 15 | 0.4 | 401.6 | 1.723 | 3.208 | 259.6 | 590,549 | 72.15 |
| 12 | Ammonia-Water | 384.3 | 15 | 0.9327 | 1570 | 4.962 | 0.2955 | 117.9 | 268,356 | 72.15 |
| 13 | Ammonia-Water | 384.3 | 15 | 0.346 | 283 | 1.395 | 2.912 | 141.6 | 322,194 | 72.15 |
| 14 | Ammonia-Water | 313.3 | 15 | 0.346 | −33.69 | 0.4848 | 2.912 | 9.459 | 21,522 | 72.15 |
| 15 | Ammonia-Water | 313 | 2.062 | 0.346 | −33.69 | 0.4895 | 2.912 | 5.372 | 21,593 | 127.5 |
| 16 | Ammonia-Water | 313.5 | 2.062 | 0.9327 | 1295 | 5.059 | 0.2955 | 28.07 | 63,859 | 72.15 |
| 17 | Ammonia-Water | 313.1 | 2.062 | 0.4 | 88.72 | 0.9105 | 3.208 | 33.44 | 85,452 | 81.02 |
| 18 | Ammonia-Water | 303.1 | 2.062 | 0.4 | −94.68 | 0.3178 | 3.208 | 11.93 | 30,493 | 81.02 |
| 19 | Ammonia-Water | 303.3 | 15 | 0.4 | −92.91 | 0.3187 | 3.208 | 16.77 | 48,743 | 92.19 |
| 20 | Ammonia-Water | 367.6 | 15 | 0.4 | 194.6 | 1.178 | 3.208 | 117.5 | 354,280 | 95.59 |
| 21 | Water | 298.2 | 1.013 | − | 104.8 | 0.3669 | 46.88 | 0 | 0 | 0 |
| 22 | Water | 301.2 | 1.013 | − | 117.4 | 0.4088 | 46.88 | 2.94 | 59,637 | 643.2 |
| 23 | Water | 363.2 | 2.5 | − | 377.1 | 1.192 | 19.52 | 509.9 | 245,039 | 15.24 |
| 24 | Water | 353.2 | 2.5 | − | 335.1 | 1.075 | 19.52 | 372.6 | 133,141 | 11.33 |
| 25 | Water | 293.2 | 1.013 | − | 83.93 | 0.2962 | 15.18 | 2.692 | 0 | 0 |
| 26 | Water | 308.2 | 1.013 | − | 146.7 | 0.5049 | 15.18 | 10.41 | 13,908 | 42.35 |
| 27 | Water | 363 | 2.5 | − | 376.4 | 1.191 | 10 | 260 | 124,970 | 15.24 |
| 28 | Water | 344.4 | 2.5 | − | 298.3 | 0.9698 | 10 | 137.5 | 66,097 | 15.24 |
| State | Fluid | T (K) | P (bar) | X (-) | h (kJ kg−1) | s (kJ kg−1 K−1) | (kg s−1) | ($ yr−1) | c ($ GJ−1) | |
|---|---|---|---|---|---|---|---|---|---|---|
| 1 | Ammonia | 358 | 10.03 | 1 | 1646 | 5.816 | 0.717 | 239 | 209,826 | 27.84 |
| 2 | Ammonia | 298.2 | 10.03 | 1 | 317.7 | 1.409 | 0.717 | 229 | 201,054 | 27.84 |
| 3 | Ammonia | 299.3 | 45.94 | 1 | 324.7 | 1.412 | 0.717 | 233.2 | 215,351 | 29.28 |
| 4 | Ammonia | 358 | 45.94 | 1 | 1468 | 4.681 | 0.717 | 254.2 | 327,018 | 29.28 |
| 5 | Ammonia-Water | 403.1 | 45.94 | 0.548 | 380.9 | 1.647 | 2.738 | 314.7 | 399,705 | 40.27 |
| 6 | Ammonia-Water | 379.4 | 45.94 | 0.548 | 258.2 | 1.334 | 2.738 | 234.8 | 298,225 | 40.27 |
| 7 | Ammonia-Water | 341.4 | 10.03 | 0.548 | 258.2 | 1.381 | 2.738 | 195.8 | 298,292 | 48.3 |
| 8 | Ammonia-Water | 358 | 10.03 | 0.3876 | 152.4 | 1.06 | 2.021 | 54.46 | 156,950 | 91.39 |
| 9 | Ammonia-Water | 358.7 | 45.94 | 0.3876 | 157.6 | 1.062 | 2.021 | 63.66 | 185,955 | 92.63 |
| 10 | Ammonia-Water | 394.3 | 45.94 | 0.3876 | 323.7 | 1.503 | 2.021 | 133.5 | 292,282 | 69.45 |
| 11 | Ammonia | 384.3 | 12 | 1 | 1705 | 5.893 | 0.2893 | 106.9 | 217,094 | 64.39 |
| 12 | Ammonia | 293.7 | 3.239 | 1 | 1522 | 5.963 | 0.2893 | 47.99 | 97,437 | 64.39 |
| 13 | Ammonia-Water | 316.1 | 3.239 | 0.4 | −37.41 | 0.5024 | 2.047 | 12.21 | 29,588 | 76.83 |
| 14 | Ammonia-Water | 316.3 | 12 | 0.4 | −36.2 | 0.5029 | 2.047 | 14.35 | 36,936 | 81.65 |
| 15 | Ammonia-Water | 362.5 | 12 | 0.4 | 170.9 | 1.114 | 2.047 | 65.46 | 281,188 | 136.2 |
| 16 | Ammonia-Water | 384.3 | 12 | 0.3012 | 296.2 | 1.407 | 1.757 | 83.61 | 291,212 | 110.4 |
| 17 | Ammonia-Water | 329.9 | 12 | 0.3012 | 54.98 | 0.7312 | 1.757 | 14.09 | 49,084 | 110.4 |
| 18 | Ammonia-Water | 330 | 3.239 | 0.3012 | 54.98 | 0.7342 | 1.757 | 12.5 | 49,126 | 124.6 |
| 19 | Water | 363 | 2.5 | − | 376.4 | 1.191 | 10 | 260 | 124,970 | 15.24 |
| 20 | Water | 344.4 | 2.5 | − | 298.3 | 0.9698 | 10 | 137.5 | 66,097 | 15.24 |
| 21 | Water | 298.2 | 1.013 | − | 104.8 | 0.3669 | 14.67 | 0 | 0 | 0 |
| 22 | Water | 308.2 | 1.013 | − | 146.7 | 0.5049 | 14.67 | 10.06 | 120,774 | 380.5 |
| 23 | Water | 363.2 | 2.5 | − | 377.1 | 1.192 | 19.52 | 509.9 | 245,039 | 15.24 |
| 24 | Water | 353.2 | 2.5 | − | 335.1 | 1.075 | 19.52 | 372.6 | 135,625 | 11.54 |
| 25 | Water | 293.2 | 1.013 | − | 83.93 | 0.2962 | 15.18 | 2.692 | 0 | 0 |
| 26 | Water | 308.2 | 1.013 | − | 146.7 | 0.5049 | 15.18 | 10.41 | 13,784 | 41.97 |
| Component | ||||||
|---|---|---|---|---|---|---|
| (a) AHT/KC | ||||||
| Condenser1 | 2.268 | 4084 | 5012 | 77.3 | 55.1 | 102.2 |
| Generator | 24.91 | 17,484 | 9611 | 79.66 | 35.47 | 46.02 |
| Pump2 | 0.75 | 2854 | 2358 | 85.05 | 45.24 | 37.55 |
| Pump1 | 1.311 | 4712 | 3987 | 87.53 | 45.83 | 29.91 |
| T.V1 | 38.99 | 61,644 | 66.45 | 83.4 | 0.1077 | 19.93 |
| Heat Exchanger | 10.11 | 15,957 | 4848 | 87.35 | 23.3 | 19.75 |
| Evaporator | 16.34 | 15,421 | 2253 | 88.1 | 12.75 | 15.8 |
| Absorber | 30.88 | 51,365 | 8308 | 82.14 | 13.92 | 26.18 |
| Separator | 0 | 0 | 0 | 100 | 0 | 0 |
| Turbine | 8.623 | 23,851 | 20,279 | 90.41 | 45.95 | 21.58 |
| Regenerator | 31.39 | 95,194 | 4866 | 76.24 | 4.863 | 33.28 |
| T.V2 | 4.087 | 16,429 | 70.67 | 56.79 | 0.4283 | 76.66 |
| Mixer | 0 | 0 | 0 | 100 | 0 | 0 |
| Pump3 | 0.8359 | 3157 | 2571 | 85.25 | 44.89 | 36.53 |
| Condenser2 | 18.57 | 376,634 | 4678 | 13.67 | 1.227 | 693.8 |
| (b) AHT/APC | ||||||
| Condenser | 2.268 | 4048 | 5012 | 77.3 | 55.32 | 103.3 |
| Generator | 24.91 | 17,484 | 9611 | 79.66 | 35.47 | 46.02 |
| Pump2 | 0.75 | 2513 | 2358 | 85.05 | 48.41 | 40.8 |
| Pump1 | 1.311 | 4133 | 3987 | 87.53 | 49.1 | 32.46 |
| T.V1 | 38.99 | 59,382 | 66.45 | 83.4 | 0.1118 | 19.93 |
| Heat Exchanger1 | 10.11 | 15,397 | 4848 | 87.35 | 23.95 | 19.95 |
| Evaporator | 16.34 | 15,086 | 2253 | 88.1 | 12.99 | 15.85 |
| Absorber1 | 47.84 | 86,866 | 7523 | 72.33 | 7.97 | 42.98 |
| Turbine | 6.053 | 14,404 | 6166 | 89.73 | 29.98 | 17.19 |
| Heat Exchanger2 | 18.41 | 87,966 | 2124 | 73.52 | 2.357 | 37.21 |
| Pump3 | 0.3519 | 1212 | 1432 | 85.85 | 54.17 | 44.69 |
| T.V2 | 1.594 | 6266 | 42.64 | 88.69 | 0.6759 | 12.85 |
| Absorber2 | 38.21 | 458,542 | 3799 | 20.85 | 0.8216 | 395.2 |
| Performance Parameters | Unit | Amount |
|---|---|---|
| CR | − | 3.819 |
| COP | − | 0.4108 |
| ECOP | − | 0.6107 |
| kW | 60.06 | |
| kW | 0.82 | |
| % | 7.69 | |
| % | 49.03 | |
| Total SUCP of system (SUCPtot) | $ GJ−1 | 87.72 |
| Performance Parameters | Unit | Amount |
|---|---|---|
| CR | − | 3.819 |
| COP | − | 0.4108 |
| ECOP | − | 0.6107 |
| kW | 34.86 | |
| kW | 0.82 | |
| % | 4.464 | |
| % | 28.46 | |
| Total SUCP of system (SUCPtot) | $ GJ−1 | 75.45 |
Publisher’s Note: MDPI stays neutral with regard to jurisdictional claims in published maps and institutional affiliations. |
© 2022 by the authors. Licensee MDPI, Basel, Switzerland. This article is an open access article distributed under the terms and conditions of the Creative Commons Attribution (CC BY) license (https://creativecommons.org/licenses/by/4.0/).
Share and Cite
Nematzadeh, N.; Ghaebi, H.; Abdi Aghdam, E. Thermo-Economic Analysis of Innovative Integrated Power Cycles for Low-Temperature Heat Sources Based on Heat Transformer. Sustainability 2022, 14, 13194. https://doi.org/10.3390/su142013194
Nematzadeh N, Ghaebi H, Abdi Aghdam E. Thermo-Economic Analysis of Innovative Integrated Power Cycles for Low-Temperature Heat Sources Based on Heat Transformer. Sustainability. 2022; 14(20):13194. https://doi.org/10.3390/su142013194
Chicago/Turabian StyleNematzadeh, Nazila, Hadi Ghaebi, and Ebrahim Abdi Aghdam. 2022. "Thermo-Economic Analysis of Innovative Integrated Power Cycles for Low-Temperature Heat Sources Based on Heat Transformer" Sustainability 14, no. 20: 13194. https://doi.org/10.3390/su142013194