Article

Cross-Border E-Commerce Brand Internationalization: An Online Review Evaluation Based on Kano Model

1
School of Management, Jiangsu University, Zhenjiang 212013, China
2
School of Finance and Economics, Jiangsu University, Zhenjiang 212013, China
3
Institute for International Strategy, Tokyo International University, Kawagoe 3501197, Saitama, Japan
*
Authors to whom correspondence should be addressed.
Sustainability 2022, 14(20), 13127; https://doi.org/10.3390/su142013127
Submission received: 12 September 2022 / Revised: 6 October 2022 / Accepted: 12 October 2022 / Published: 13 October 2022

Abstract

:
The objective of this study was to build an international evaluation index system of cross-border e-commerce brands. It improves the sustainable development ability of the brand and then drives the sustainable development of the enterprise’s brand internationalization. As the top priority in the innovative development process of cross-border e-commerce enterprises, it is a key means to achieve longer-term and more stable development of cross-border enterprises and to maintain a place in the fiercely competitive market. Therefore, the internationalization of cross-border e-commerce brands is a topic that needs to be explored in depth to provide a comprehensive understanding to businesses from the consumers’ perspectives. This study constructs an international evaluation index system for cross-border e-commerce brands. The keywords in the online reviews are captured through the Latent Dirichlet Allocation (LDA) and matched to the indexes, and the indicators are classified into Kano categories through Long Short-Term Memory (LSTM) training to explore the promotion strategies of different Kano categories in the process of brand internationalization. Based on the empirical analysis of online reviews of the Kano model, it was determined that in the process of internationalization of cross-border e-commerce brands, managers should focus on service indicators related to expected factors, give priority to meeting service indicators related to essential factors, strive to meet service indicators related to charm factors, and make appropriate choices to observe service indicators related to indifference factors in real-time.

1. Introduction

Thanks to internet evaluations and technology advancement e-commerce is constantly increasing worldwide [1]. It is predicted that the e-commerce market will increase by 25% by 2026, and that online purchases will have increased from 32% to 43%. However, the tremendous increase in online businesses has been observed to have adverse impacts on environmental sustainability, in the form of energy consumption and CO2 emissions [2]. In order to promote energy transitions to meet the requirements of the Paris Agreement [3], there is a need to change the way people live, including how they shop. E-commerce is a more environmentally protective and energy-saving way of conducting sales. In China’s rapidly developing economy, e-commerce positively reduces energy and material consumption, while promoting economic growth and social transformation. At the same time, brand internationalization is beneficial to enhance product quality and to improve the sustainable development of brands and enterprises. Therefore, cross-border e-commerce brand internationalization for the sustainable development of enterprises has an important role.
As early as the 1790s, western developed countries began to study brand value [4]. In 1993, American scholar Kevin Lane Keller proposed the Customer-Based Brand Equity (CBBE) model [5], which is a consumer-based brand value model. Since then, brand value has appeared in the research and discussion of various scholars as a complete concept [6]. In 1996, Aaker divided brand value into five dimensions: brand awareness, brand recognition, brand loyalty, brand association and other proprietary brand equity, including patents, trademarks, and channel relationships [7]. He believed that brand value could be measured only through these five dimensions [8]. The Brand Equity Engine model, proposed by the International Market Research Group, believes that brand equity is driven by brand image. Although the realization of brand equity depends on consumers’ purchase behaviors, the purchase behavior of consumers is fundamentally determined by the consumers’ views of the brand, that is, the brand image. Therefore, although purchase behavior can reflect the existence of brand equity, it cannot reveal the key factors that drive brand equity in consumers’ minds.
Since the 1990s, the apparel consumer goods market has gradually shifted from pure product sales to brand sales, which marks the arrival of the era of brand marketing with brand competitiveness as the core. From 1998 to 2008, China’s manufacturing industry, which had been based worldwide, began to rise and enter the brand era. It not only strictly controlled quality, but also made breakthroughs in technology and creativity. At the same time, China’s manufacturing industry has evolved from only a specific link of OEM (Original Entrusted Manufacture) to a complete whole industry chain system. Local brands have also expanded overseas through acquisitions. This multi-pronged approach has steadily improved the core competitiveness of China’s manufacturing. Many local Chinese brands have also entered the international stage one after another, interpreting Chinese feelings with younger images, leading the marketing trend, and sweeping the consumer market. In the context of economic globalization, brand internationalization has become the strategic goal of more and more enterprises. Promoting brand internationalization can enable enterprises to give full play to their comparative competitive advantages and economies of scale, use global resources, learn advanced technologies, effectively explore international markets, and accumulate international experience. Wei [9] proposed that brand internationalization is enterprises’ extension and dissemination of brands to the international market to obtain economies of scale. Song [10] believes that as long as enterprises promote the brand and extend it to other countries, the brand becomes internationalized. It is not only a case of selling a brand in the international market, but also a case of being recognized by the international market. Wang [11] believes that brand internationalization focuses on creating credibility, reputation, and uniqueness that is not easy to be imitated. Whitelock and Fernando [12] argue that brand internationalization, in the narrow sense, is the internationalization of brand decisions that include brand names, logos, and personalities. Brand internationalization, in a broad sense, is the process by which a brand establishes brand equity in the international market [12]. Brand equity includes perceived quality of the brand, brand awareness, brand association, and brand loyalty [13]. With regard to brand dimension, six major measurement indicators for the brand internationalization of manufacturing enterprises, based on cross-border e-commerce, have been constructed: brand strategy, brand performance, brand recognition, brand image, brand preference, and brand development [14]. Therefore, this study uses the Kano model to conduct an empirical analysis of online reviews to help cross-border e-commerce brands improve their international status.
The Kano model, and its five categories, have been implemented in different industries [15]. For example, Kim [16] took the flight service process as a research object and calculated the satisfaction and dissatisfaction coefficients, respectively. Using data from 350 passengers, 26 flight management items were grouped into Kano categories. Chiang [17] also adopted this approach to summarize 51 hotel attributes and obtained ratings for these attributes through a questionnaire. By constructing a two-dimensional matrix, hotel attributes were successfully mapped to five Kano categories. Bi [18] used support vector machines (SVMs) and ensemble neural networks to replace traditional Kano index calculations to classify Kano further. In addition to attributing classification, based on the Kano model, previous studies have also focused on decision support problems considering the Kano classification [19,20]. Dou [19] proposes a fuzzy clustering algorithm for large-scale industrial production. To increase customized information, the Kano model is adopted to address the different preferences of customers. Likewise, Zhao [20] highlights the difficulty of identifying customer needs in product design. Customer requirements are divided into engineering features according to application, and the optimal product configuration scheme is obtained.
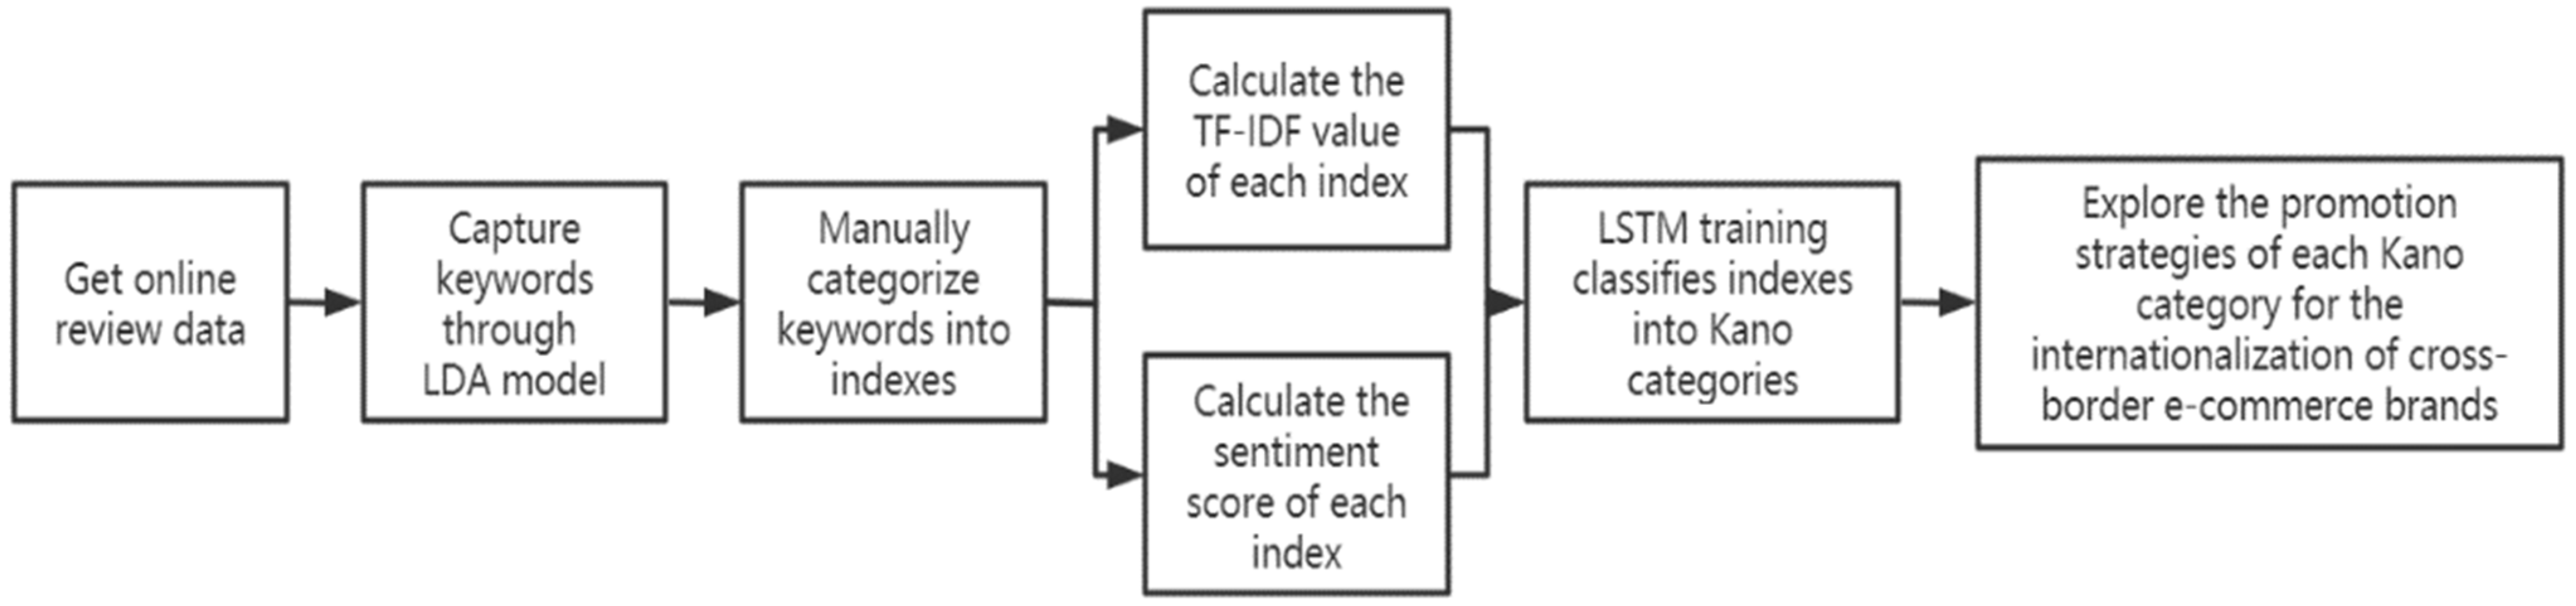
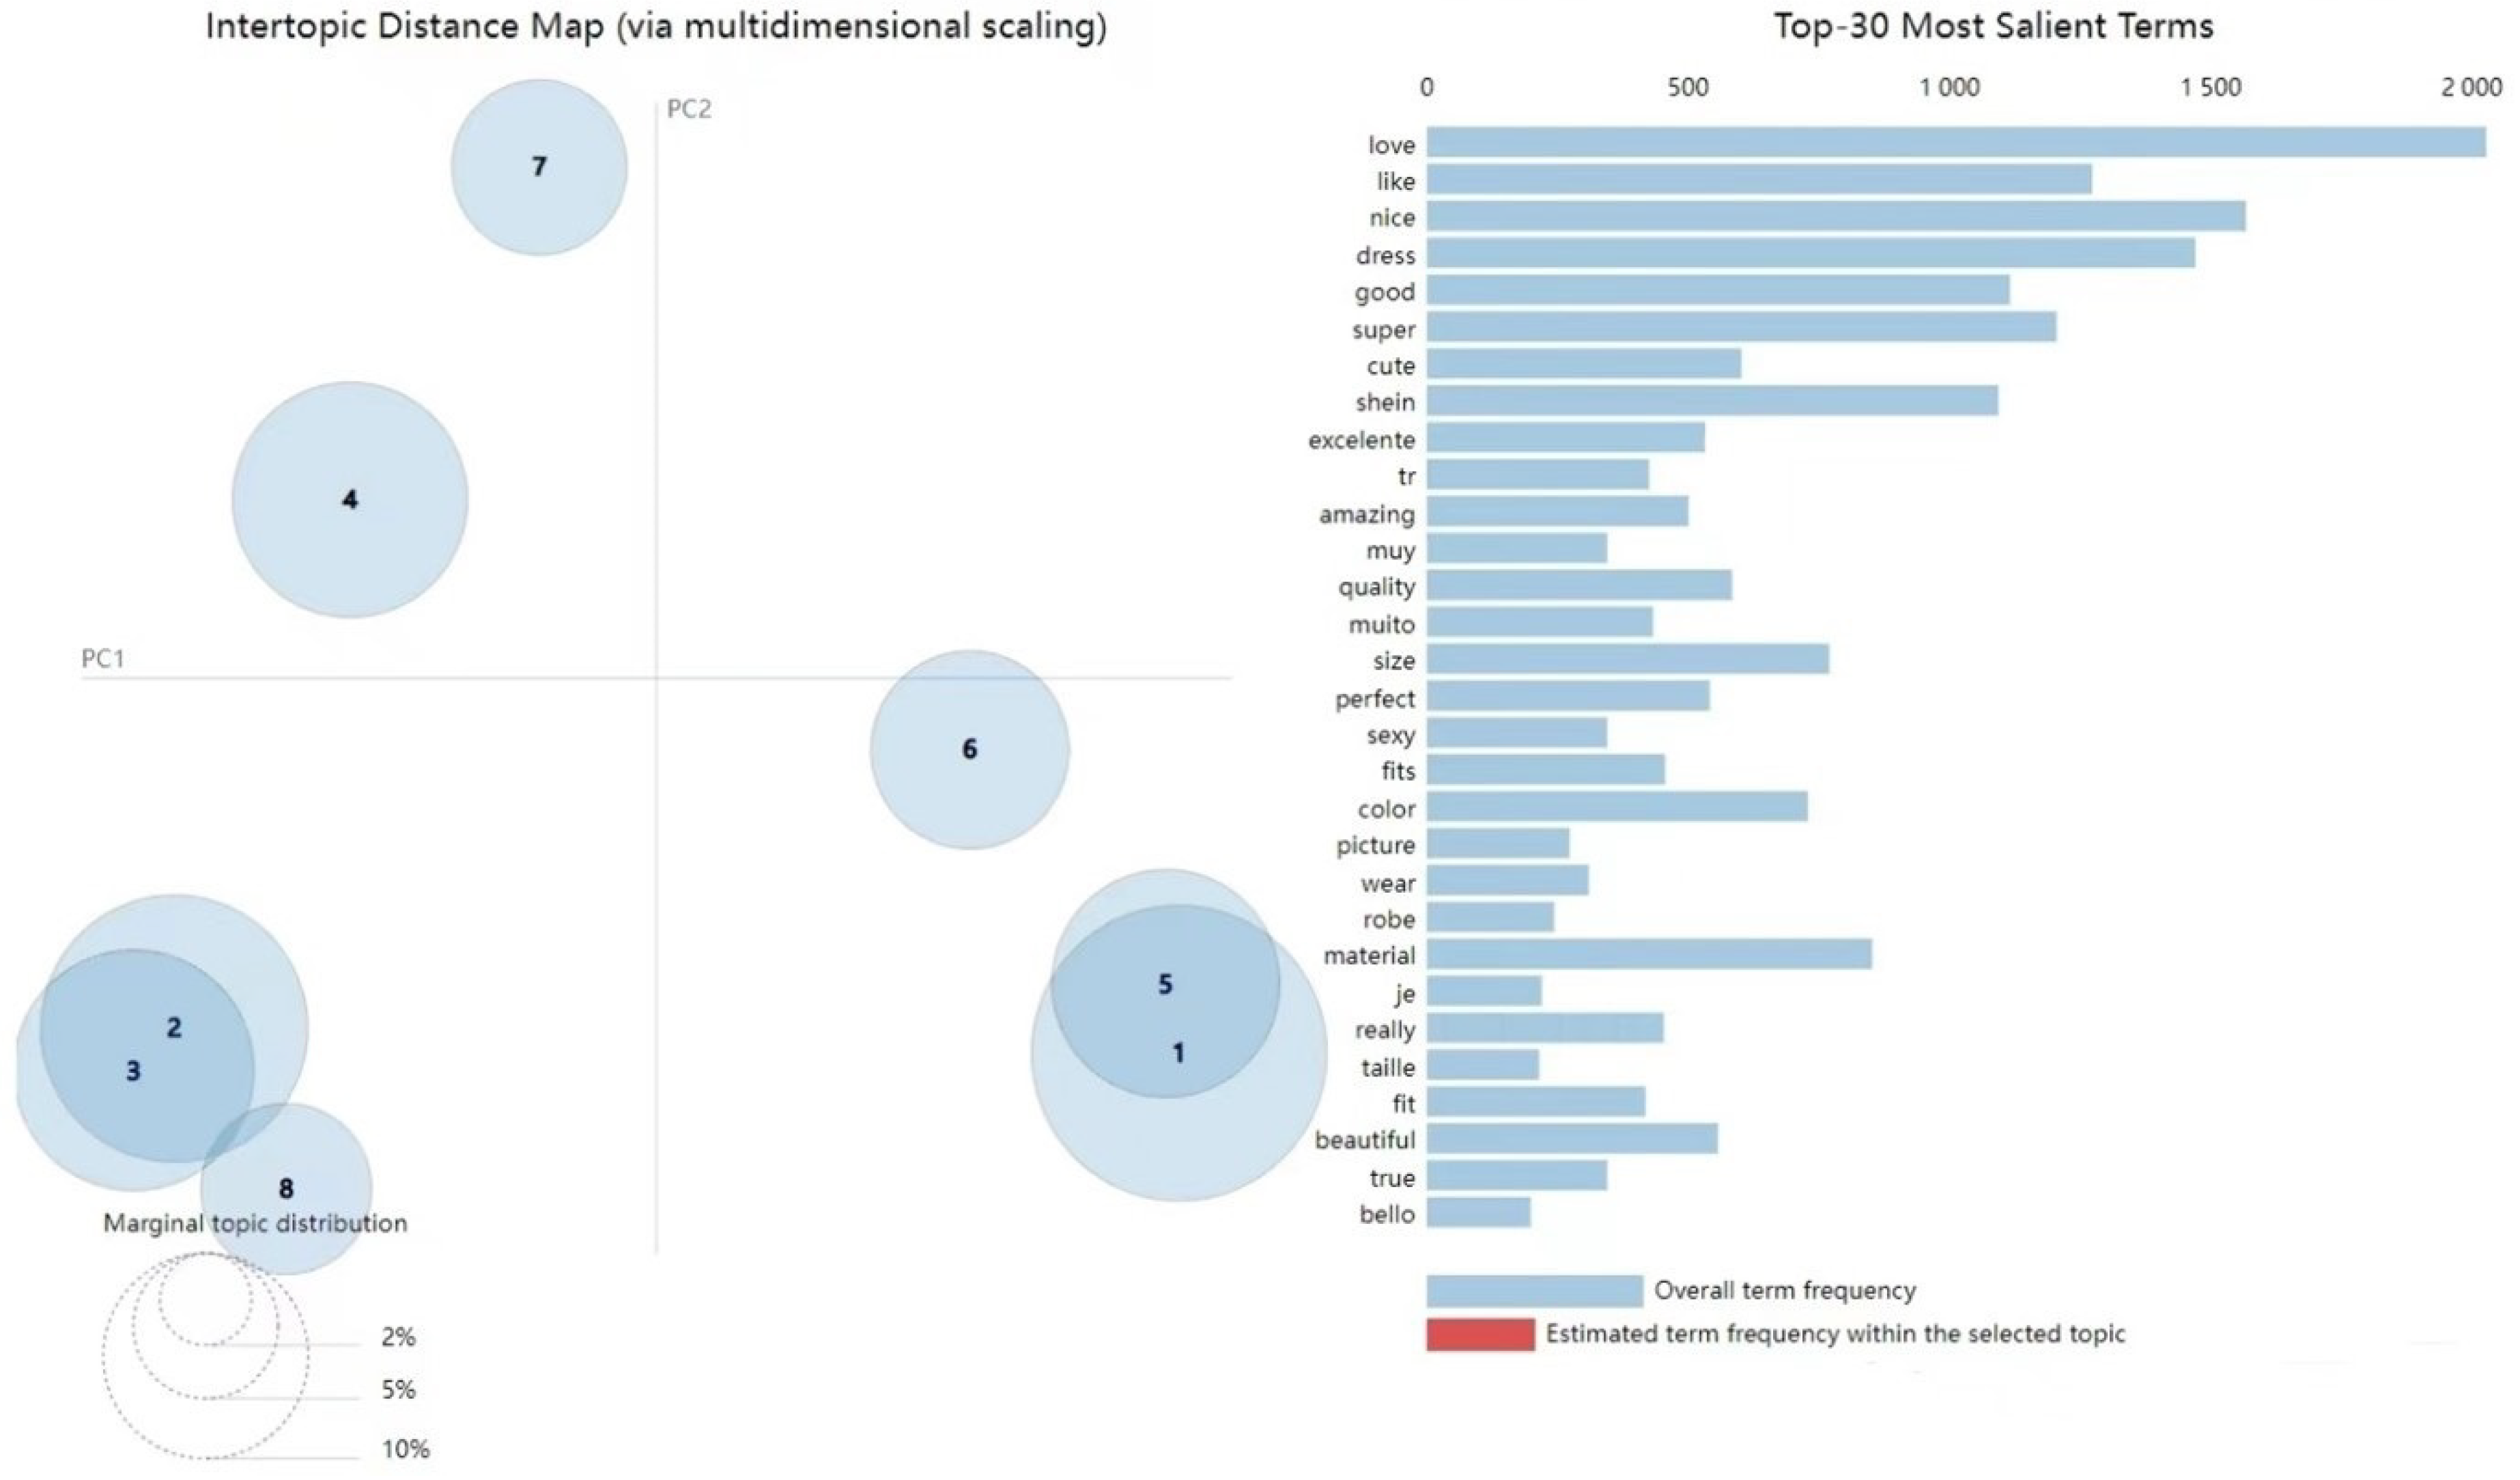
Since previous research on the Kano model has mainly taken the form of a questionnaire, this study derives the information from online comments and extends the application of the model. From the perspective of consumer demand, this research uses the LDA (Latent Dirichlet Allocation) model to mine the text and get the keywords of reviews. At the same time, the index system of cross-border E-commerce brand internationalization evaluation is established, and the index is divided into Kano categories by LSTM training, which provides the corresponding promotion path for each Kano category. This study answers the following questions:
(1) How can one build an international evaluation index system for cross-border e-commerce brands?
(2) How can one classify indexes into Kano categories through LSTM training?
(3) What are the demand levels and improvement paths for each factor of the Kano category?
This study follows a literature review of the theoretical basis and introduces the research path, method, and analysis of results. Finally, the discussion of results, implications, limitations, and future studies are presented.

2. Theoretical Basis

2.1. Kano Model

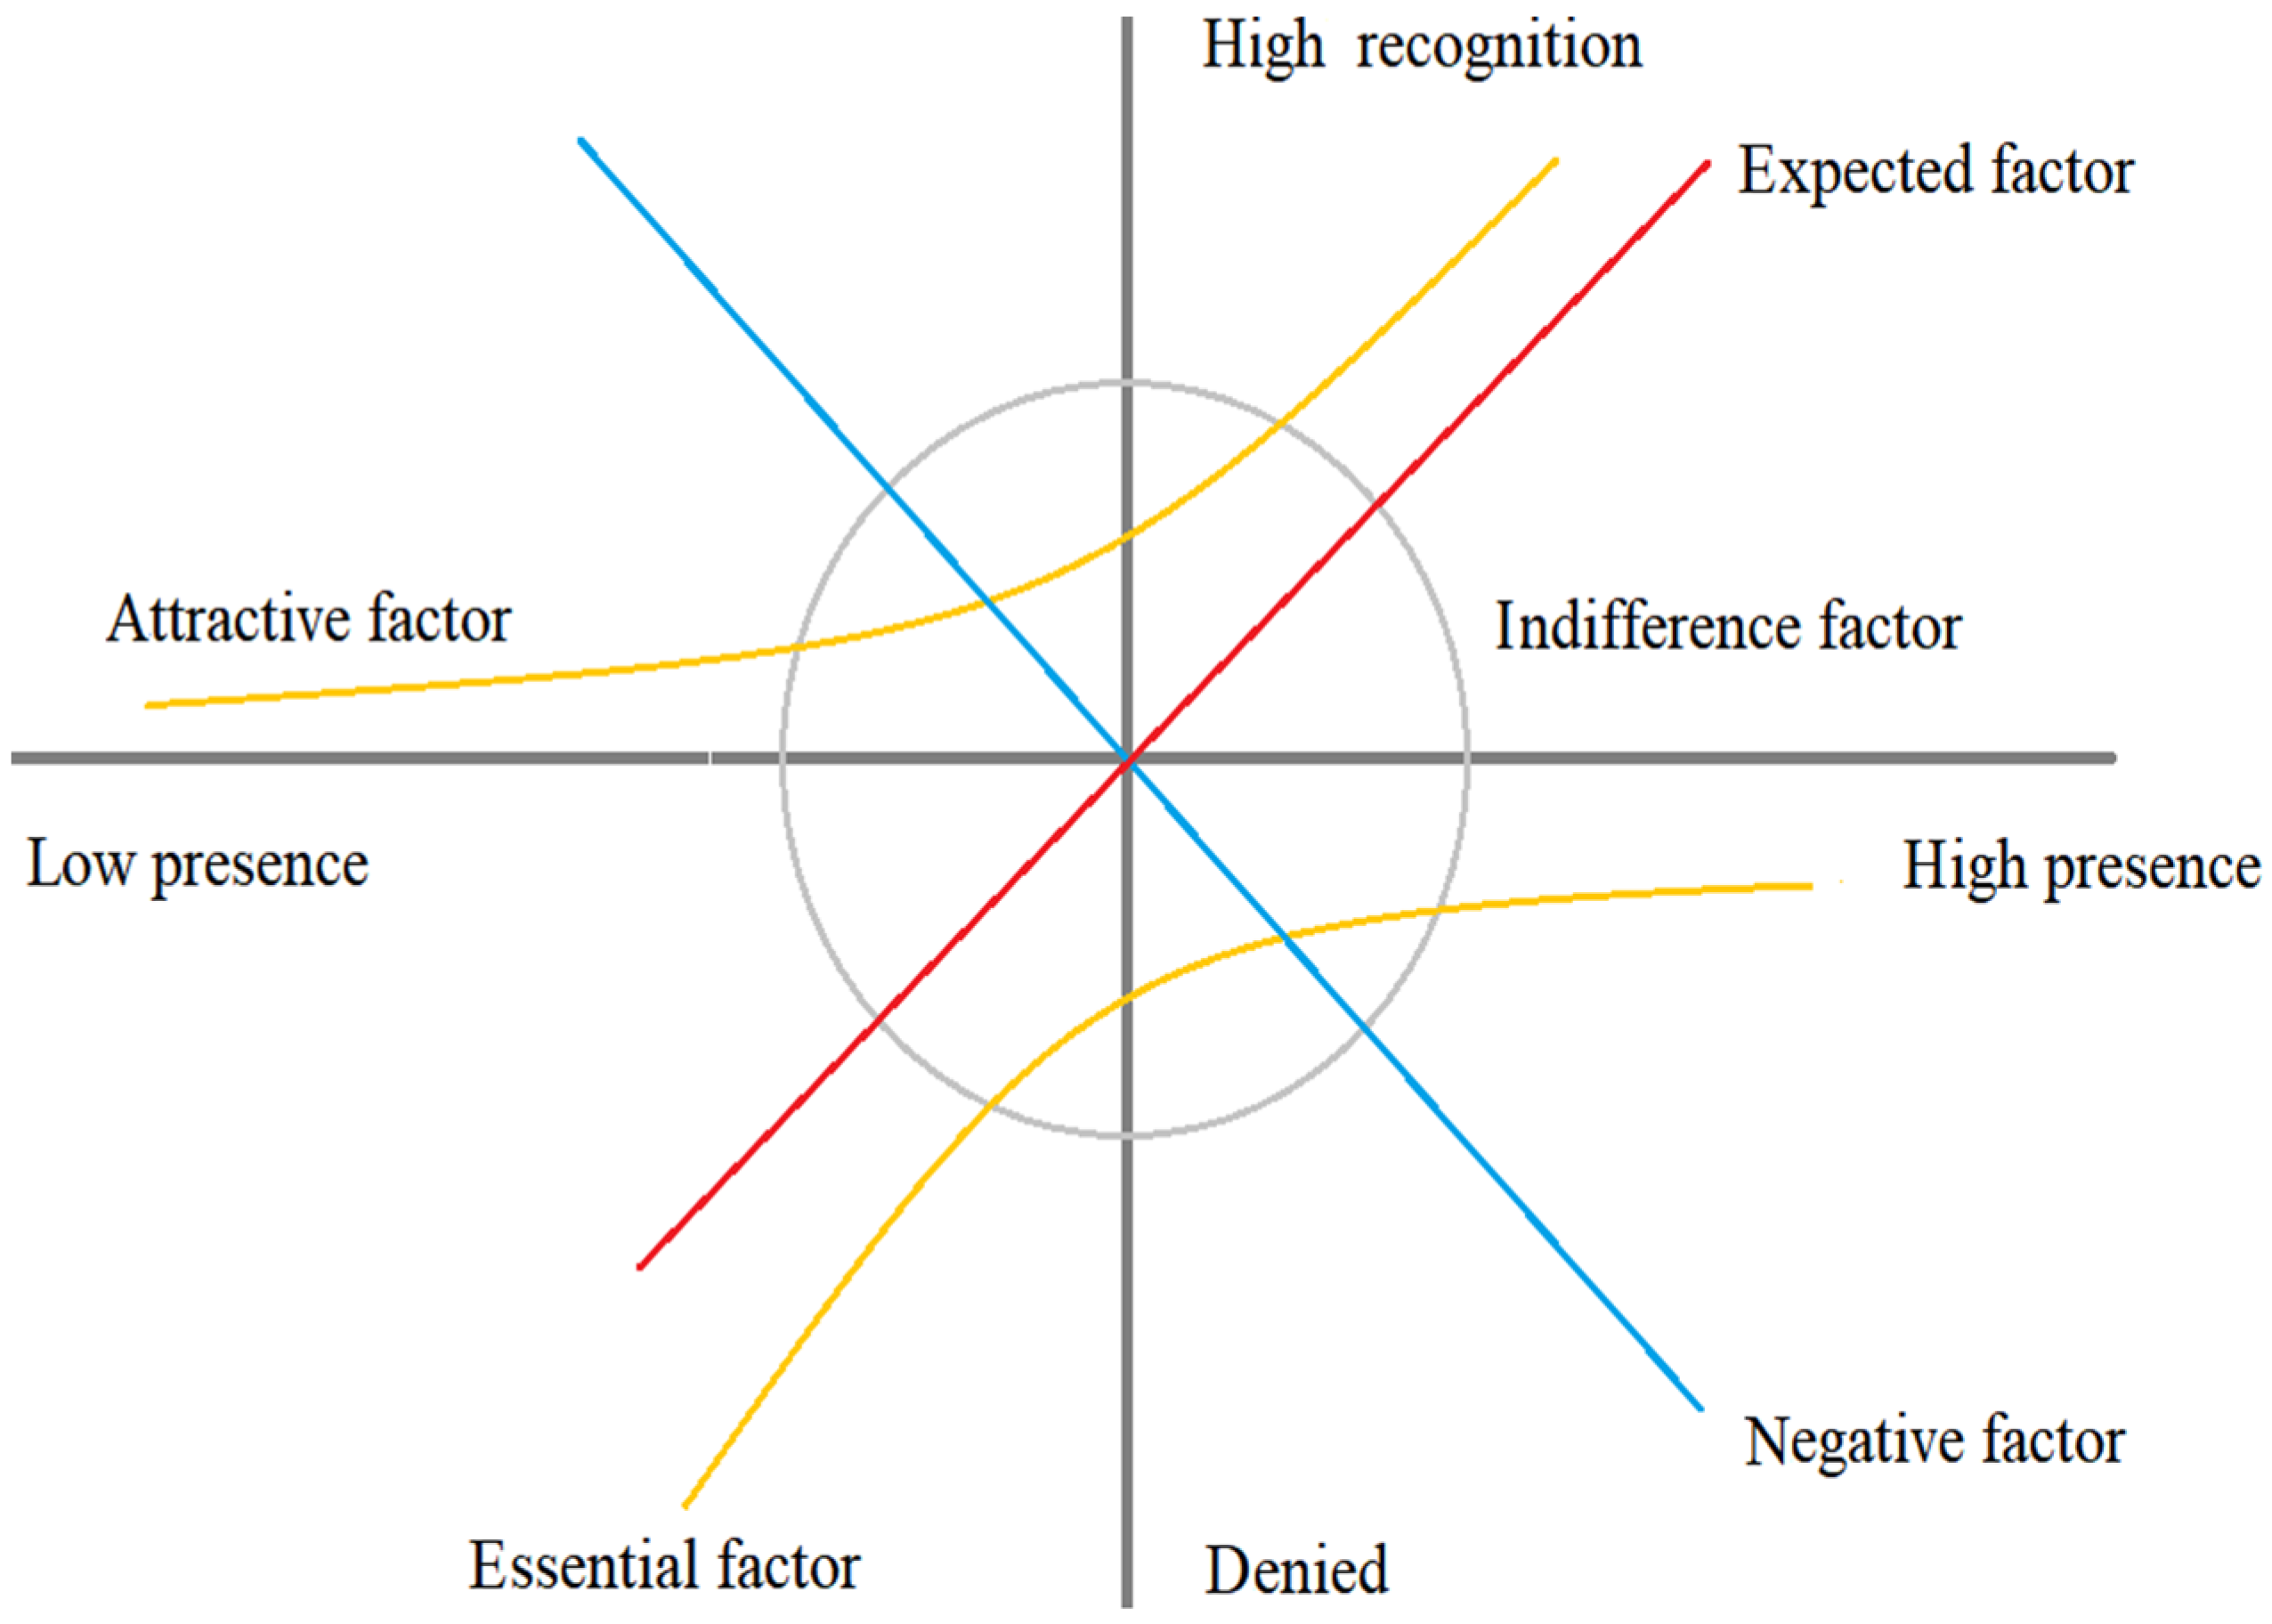
The purpose of the Kano model is to classify customers’ needs and divide them into different categories, as shown in Figure 1. Furthermore, based on customer needs analysis, the nonlinear relationship between functional realization and satisfaction is emphasized [21].
(1) Expected factor: There is a positive linear relationship between feature satisfaction and category satisfaction. These features will continue to improve consumer impressions.
(2) Essential factor: Consumers take such characteristics for granted. Improvements in these features do not bring additional benefits. Conversely, consumers get frustrated when they cannot find such features in their products.
(3) Attractive factor: Consumers feel very happy when they find that a product has the attributes of attractiveness. These features will significantly increase consumer satisfaction.
(4) Indifference factor: The features in this category have no significant impact on consumer perception. Consumers do not care that much about whether a product has these features.
(5) Negative factor: Reverse features can cause consumer dissatisfaction. The reason is that not all customers like these features. Businesses that offer negative attributes can receive negative feedback.

2.2. Long Short-Term Memory (LSTM)

Long Short-Term Memory (LSTM), capable of learning long-term dependencies, was proposed in [22] and refined and generalized by many in subsequent works. It is very effective and widely used in dealing with various problems. Neural networks have long been used for classifications [23,24] and Prediction Problems [25,26,
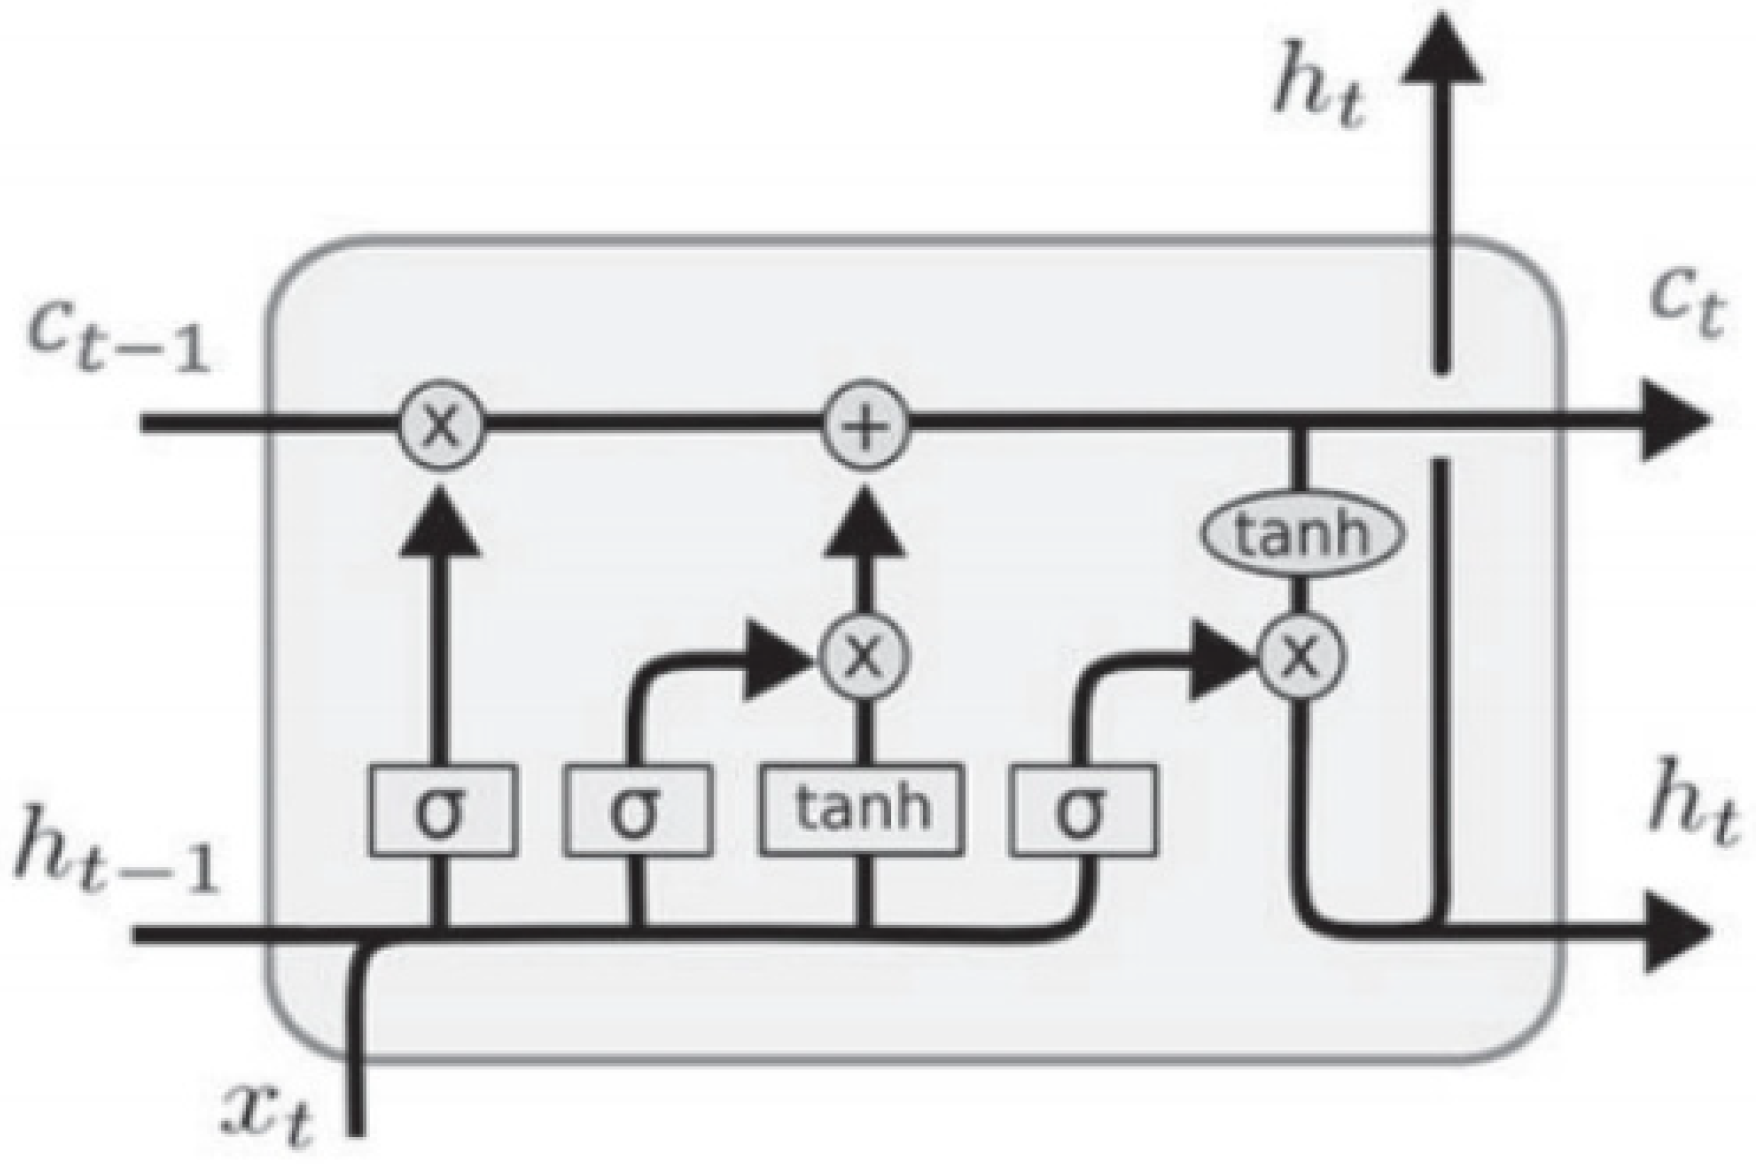
27]. The advantage of LSTM is its ability to remove or add nodes and to pass gate information (input, forget, and output gate) to the cell state [28]. The forget gate determines whether previous cell information is passed to the current cell. The input gate determines the information update of the current cell, and the output gate calculates the output of the current cell. Each gate is represented by a neural network, which has an input layer, a hidden layer, and an output layer, as shown in Figure 2 below.
Microscopically, the LSTM introduces a cellular state and maintains control information using three gates: an input gate, a forgetting gate and an output gate. The formula is as follows:
C t ˜ = t a n h W c · h t 1 , x t + b c
C t = f t C t 1 + i t C t ˜
O t = σ W o · h t 1 , x t + b o
h t = O t     t a n h C t
In the formula, O t is the output gate, C t is the cell state, C t ˜ is the candidate value of the cell state, h t is the hidden layer state, and W and B represent the weight and bias, respectively.

2.3. Sense, Interest and Interaction, Connect and Communicate, Action, Share (SICAS) Model

SICAS consumer behavior model (DCCI, 2011) is a psychological change model of user consumption behavior, which was proposed in the Web 3.0 era, and provides a comprehensive and refined consumer behavior model in the Internet 3.0 era. The SICAS model is divided into five parts: sense, interest and interaction, connect and communicate, action and share.
(1) Sense is based on the perception of both consumers and brands. Consumers realize that they need something, and brands inform them of products to meet their needs through different platforms, such as TV, online search, information flow, patch advertisements, outdoor media, etc.
(2) Interest and interaction mean that when consumers know that a product can meet their needs, they can acquire knowledge about the product through different channels, including consulting with the brand and detailed information about the product.
(3) Connect and communicate mean that when a consumer learns that a product can meet his or her needs, he or she takes the initiative to establish a deep link with the brand for a more detailed understanding.
(4) Action means that consumers decide to take action after in-depth communication and understanding to purchase and use the product.
(5) Share means that if a consumer feels that a product is exactly the same as what he or she learned about it at the beginning, he or she shares this good product with relatives and friends and provides good word-of-mouth evaluation of the product.
The entire SICAS model covers the whole consumer behavior process and has established an open evaluation model. Brand merchants must first make brand information available so consumers care about and consume the information promptly. Brand merchants must pay attention to consumers’ sharing behavior and participate in, and guide, consumers’ sharing behavior.

3. Methodology and Data

3.1. Research Technique

This study used Jisouke software to obtain online review data, and keywords were captured through the LDA model. The keywords were manually divided into indexes, and the indexes classified into Kano categories through LSTM training. The promotion strategies of each Kano category in the internationalization of cross-border e-commerce brands were explored and analyzed. The research technique is shown in Figure 3 below.

3.2. Construction of Cross-Border E-Commerce Brand Internationalization Evaluation Index System

3.2.1. Construction of Index System

Based on the SICAS consumer behavior model, this study integrated the CBBE model, the ten-factor model of brand value, and the Brand Equity Engine model, to determine the cross-border e-commerce brand internationalization evaluation index system, as shown in Figure 4 below.
The research combined the proportion of the comment data under each evaluation index, appropriately added and deleted according to the actual situation, and optimized and improved the index system. The first-level dimensions were set as five indexes: brand perception, product quality, service quality, brand response, and brand loyalty. The specific adjustment process was as follows:
(1) Based on the sense aspect in the SICAS consumer behavior model, brand recognition, personality, and value and social recognition were combined into brand perception.
Brand perception refers to consumers’ perceptions of a brand and its reputation. It is the most basic and important part and can fully influence consumers’ perceptions and attitudes. In some cases, consumer preference is influenced by brand perception, and consumers favor some well-known brands. Its indexes come from the brand affinity dimension of the Brand Equity Engine model, and the brand association and differentiation assessment dimensions of the ten-factor model of brand value.
(2) Based on the action aspect in the SICAS consumer behavior model, perceived quality, conditions of use, and basic characteristics were combined into product quality.
Product quality refers to consumers’ perceptions of product quality, conditions of use, and practicality. For apparel companies, product quality directly affects consumer satisfaction, which, in turn, affects consumers’ overall perception of products, and even of brands. The basic characteristics of the product include product information, such as material and size. Its indexes are composed of the brand recognition and leadership brand assessment dimensions in the ten-factor model of brand value, and the brand connotation dimension of the CBBE model.
(3) Based on the interest and interaction aspect in the SICAS consumer behavior model, purchasing channel, active service, and professionalism were combined into service quality.
Service quality refers to consumers’ perceptions of the tangibility, reliability, response speed, and professional quality of service provided by service personnel. Service quality directly affects consumer satisfaction, which, in turn, affects consumers’ attitudes and perceptions of brands. Its indexes are composed of the brand connotation dimension of the CBBE model.
(4) Based on the connection and communication aspect in the SICAS consumer behavior model, brand feeling, brand judgment, and price recognition were combined into a brand response.
Brand response refers to how consumers feel and think about a brand. Product quality and service quality affect consumers’ acceptance of brand prices to a certain extent. Its indexes are composed of the brand response dimension of the CBBE model, and the brand function dimension of the Brand Equity Engine model.
(5) Based on the share aspect in the SICAS consumer behavior model, behavioral loyalty and emotional loyalty were combined into brand loyalty.
Brand loyalty refers to consumers’ willingness to repurchase and their awareness of recommendation, that is, consumers’ persistent, inclined and targeted consumption behavior, which is reflected by consumers’ brand preference through shopping behavior. Consumers’ persistent positive attitude towards a brand and repurchase behavior are both manifestations of brand loyalty. Its indexes are composed of the brand relationship dimension of the CBBE model.
(6) Delete brand development history, sense of belonging and active involvement.
Combined with the review data, it was found that there were no keywords related to the brand development history and the keywords that visited the brand website and actively participated in the activities in consumer reviews. Therefore, the brand development in the brand connotation index, that of belonging, and active engagement metrics in the brand relationship index of the CBBE model, were deleted.

3.2.2. The Meaning and Source of Indicators

This study specifically divided the 5 dimensions of the evaluation index system into 14 indexes. The indexes and their sources are shown in Table 1, Cross-border e-commerce brand internationalization evaluation index.

3.3. Data

3.3.1. Data Collection and Preprocessing

The study focused on a fashion cross-border e-commerce brand, mainly for female consumer groups, providing users with clothing, accessories, shoes, luggage, and other categories of products, while establishing a community, providing experience sharing, shopping guides, making friends, logistics, and other services. The business covers Europe, the United States, the Middle East, Latin America, and Southeast Asia markets and more than 200 countries. To sum up, this brand was chosen as the case object of this study, being highly typical and representative.
Internet word of mouth is one of the essential sources of big data for apparel companies, and its content is mainly customer feedback [29]. This study used the custom collection rules of Jisouke crawler software to get the review data of 81 products in the women’s clothing category on the official website, with 12,849 valid pieces of data.

3.3.2. LDA Model Construction

The LDA model was constructed to extract the topic classification results of online reviews [30], to conduct more in-depth mining and clustering of corpus texts, and to further understand consumers’ attention to various aspects of the brand [31].
(1) Determination of the number of topics
In this study, the pyLDAvis package of Python was used to visualize the results of topic distribution [32]. Each bubble in the visualization represents a topic, the size of the bubble represents the frequency of the topic, and the distance between the bubbles represents the similarity between topics [33]. It can be seen that some topics were far apart, indicating that they were highly independent and some topics were close, or even overlapping, indicating that they were highly similar. As shown in Figure 5, according to the distribution of comment topics, the number of topics in the LDA model was finally set to 8.
(2) Analysis of model results
Different topics were selected so as to view the vocabulary related to the topic to further summarize and analyze. By adjusting the value of λ, the relevance of words and topics could be adjusted. When λ was closer to 1, the words that appeared more frequently under the topic were more relevant to the topic, and the closer λ was to 0, the more special and less frequent words under the topic were more relevant to the topic. After continuous testing, λ = 0.6 was finally selected, with a total of 48 keywords, as shown in Table 2 below.

3.3.3. TF-IDF Keyword Weight Calculation

Since measuring the importance of the frequency of words appearing in the text was not rigorous, this study chose to sort the words by the importance of the terms in the text to improve the accuracy of keyword extraction.
The basic idea of the TF-IDF algorithm is that if a word appears more frequently in one document and less frequently in other documents, it is considered the word has a good ability to distinguish between categories. TF refers to the number of times a feature word appears in the article, which usually needs to be standardized [34]. However, due to modal particles, function words, etc., the number of times a certain term appears in the article does not represent its importance, so it is necessary to use IDF, that is, inverse document frequency. It refers to the importance of a feature word in the text. Its principle is to assign a value to the word according to its rarity. The rarer a word is, the higher the value is, indicating that the word is more important. The TF-IDF algorithm combines these two methods in word frequency–inverse document frequency. It is a statistical method that uses a weighted algorithm to evaluate the importance of words. Its algorithm is TF-IDF=TF*IDF, and the formula is as follows:
T F I D F = n N l o g T t + 1
  • n is the number of times the feature word appears in the document
  • N is the total number of words in the document
  • t is the total number of documents that contain the feature word
  • T is the total number of documents in the corpus
The keywords obtained by the LDA model are calculated and summarized as shown in Table 3.

3.3.4. Sentiment Score Calculation

This study used TextBlob for sentiment analysis. TextBlob is a Python text processing library that can perform many natural language processing tasks, such as part-of-speech tagging, sentiment analysis, etc., [35]. It integrates two modules; only sentiment scores were used in this study. Sentiment scores ranged from +1.0 to −1.0, where +1.0 represented positive sentiment and −1.0 represented negative sentiment. Each comment text was calculated and summarized according to the keywords, as shown in Table 4 below.

3.4. LSTM Training

3.4.1. Classification and Calculation of Keywords

In this study, keywords were manually mapped to evaluation indexes, and the average TF-IDF of keywords under each index was calculated as the index’s weight. The classification of keywords is shown in Table 5.

3.4.2. LSTM Training

This study divided the indexes into 5 Kano categories according to TF-IDF and sentiment score. We referred to the TensorFlow implementation mechanism [36] to implement the classification of indicators to Kano categories. First, TF-IDF and sentiment score were used as the input feature x; that is, the input layer had 2 nodes. The Kano category was used as the label y; that is, the output layer had 5 nodes. Secondly, the parameter weight W and bias b in the network needed to be initialized. The indexes were classified into Kano categories through a forwarding propagation calculation, that is, an iterative calculation from the input layer to the output layer.
The calculation formula is as follows:
y = i = 1 n x i W i + b
All inputs x were multiplied by their respective weights W and added to the bias b to obtain the output y. The parameters were optimized, and the nested loop iteration realized the parameter update. Then, the deviation was calculated through the loss function, and the loss visualization is shown in Figure 6 below. As the number of epochs increased, the loss value decreased. When the number of iterations reached 500, the loss value was less than 0.0358, and the smaller the loss value, the more accurate the classification. Finally, the optimal parameters were selected and the effect tested.
The results of the index division into the Kano category are shown in Table 6.

4. Result and Discussion

According to the relevant theories of the Kano model [
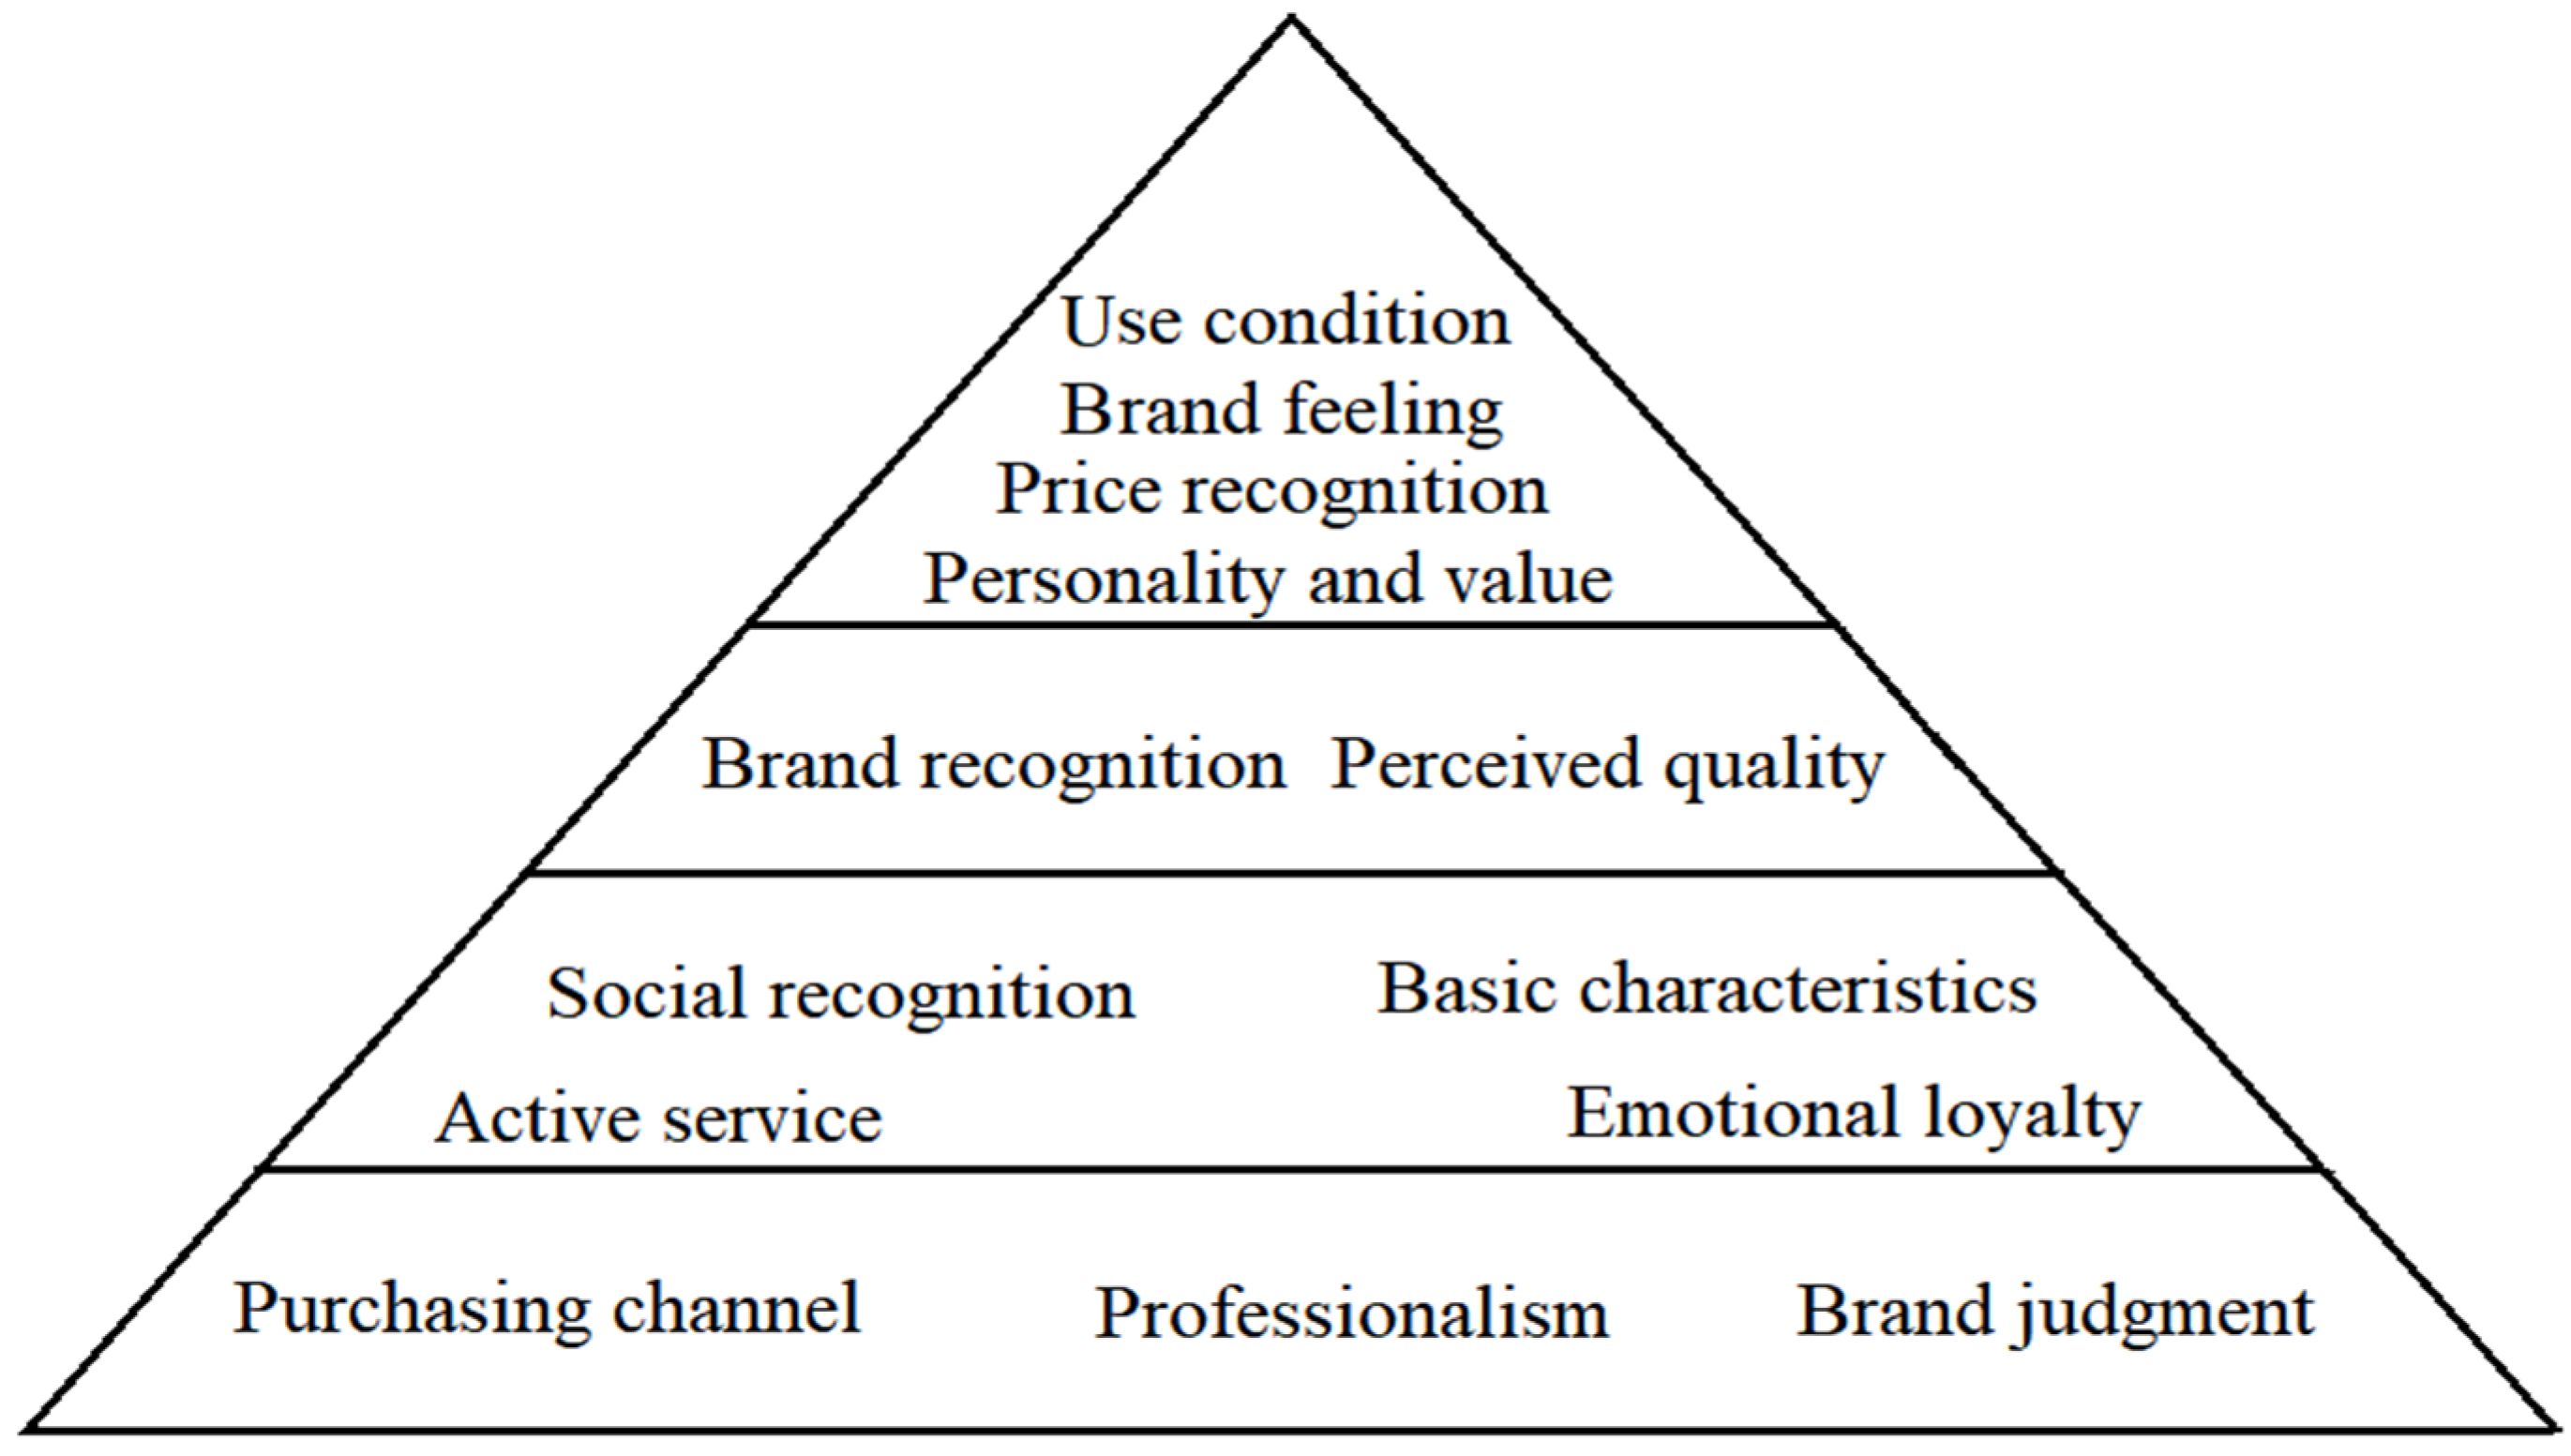
21], the expected factor had a linear relationship with consumer satisfaction. If the relevant service indexes of the essential factors were not met, consumer satisfaction would be greatly reduced. The attractive factor could greatly improve consumer satisfaction in the international construction of cross-border e-commerce brands, but it would not ensure consumer satisfaction without providing service indexes related to the attractiveness factor. Since satisfying the essential factors did not improve consumer satisfaction, the improvement of expected and attractive factors was an effective way to improve customer satisfaction. Therefore, the importance of the demand factors of each Kano model was ranked according to the gradient of "essential factor > expected factor > attractive factor > indifference factor", and, based on the above conclusions, a hierarchical tower of international demand for cross-border e-commerce brands was constructed, as shown in Figure 7.

4.1. Expected Factor

Expected factors include two indexes: brand recognition and perceived quality. Expected factors have a linear relationship with consumer satisfaction. If the relevant service indexes of the expected factors are provided, consumer satisfaction increases and if the relevant service indexes of the expected factors are not provided, consumer satisfaction decreases accordingly. Therefore, when cross-border e-commerce brands improve their internationalization, they should consider the provision of such factors.

4.2. Essential Factor

Essential factors include social recognition, basic characteristics, active service, and emotional loyalty, which are basic needs. Suppose the relevant service indexes of the essential factors are not met. In that case, consumer satisfaction is greatly reduced, but consumers take such service indexes for granted, and improvement does not improve consumer satisfaction.

4.3. Attractive Factor

Attractive factor includes four indicators: personality and value, use condition, brand feeling, and price recognition. These indexes surprise consumers. If the relevant service indexes of the attractive factor are provided, consumer satisfaction is greatly improved and if the relevant service indexes of the attractive factor are not provided, consumer satisfaction is not be reduced. Therefore, when cross-border e-commerce brands improve the degree of internationalization, after the essential factors and expected factors are determined, they can consider adding relevant service indexes for setting attractive factors to improve user satisfaction faster.

4.4. Indifference Factor

The indifference factors include professionalism, purchasing channel, and brand judgment. This index has no significant impact on consumers. Consumers do not care that much about whether a product has these features. Consumer satisfaction does not change whether or not features are provided for the index related to indifferences. However, the Kano model theory points out that change in consumer demand has dynamic characteristics, which change with changes of time and place, and evolve in the direction of an indifference factor → attractive factor → expected factor, → essential factor. Therefore, cross-border e-commerce brands should also pay attention to the relevant service indexes without indifferent factors when improving the degree of internationalization.

4.5. Negative Factor

A negative factor includes an index of behavioral loyalty. Consumers have no demand for indexes related to reverse factors, and consumer satisfaction is not increased after provision but can even slightly decrease.

5. Conclusion and Limitations

The research found that the expected factors include brand recognition and perceived quality indexes. In the internationalization process of cross-border e-commerce brands, managers should focus on service indexes related to expected factors.
We also found that the essential factors include four indexes of social recognition, basic characteristics, active service, and emotional loyalty. In the internationalization process of cross-border e-commerce brands, managers should prioritize meeting service indexes related to essential factors.
In addition, there are four indexes in the attractive factors, including personality and value, use condition, brand feeling, and price recognition. In the internationalization process of cross-border e-commerce brands, managers should strive to meet service indexes related to attractive factors.
Moreover, there are three indifference factors indexes: professionalism, purchasing channel, and brand judgment. In the internationalization process of cross-border e-commerce brands, managers should make appropriate choices to observe service indexes related to indifference factors in real time.
Finally, there is one index in the negative factor: behavioral loyalty. In the internationalization process of cross-border e-commerce brands, managers should avoid the appearance of negative factors as much as possible.

5.1. Theoretical Contributions

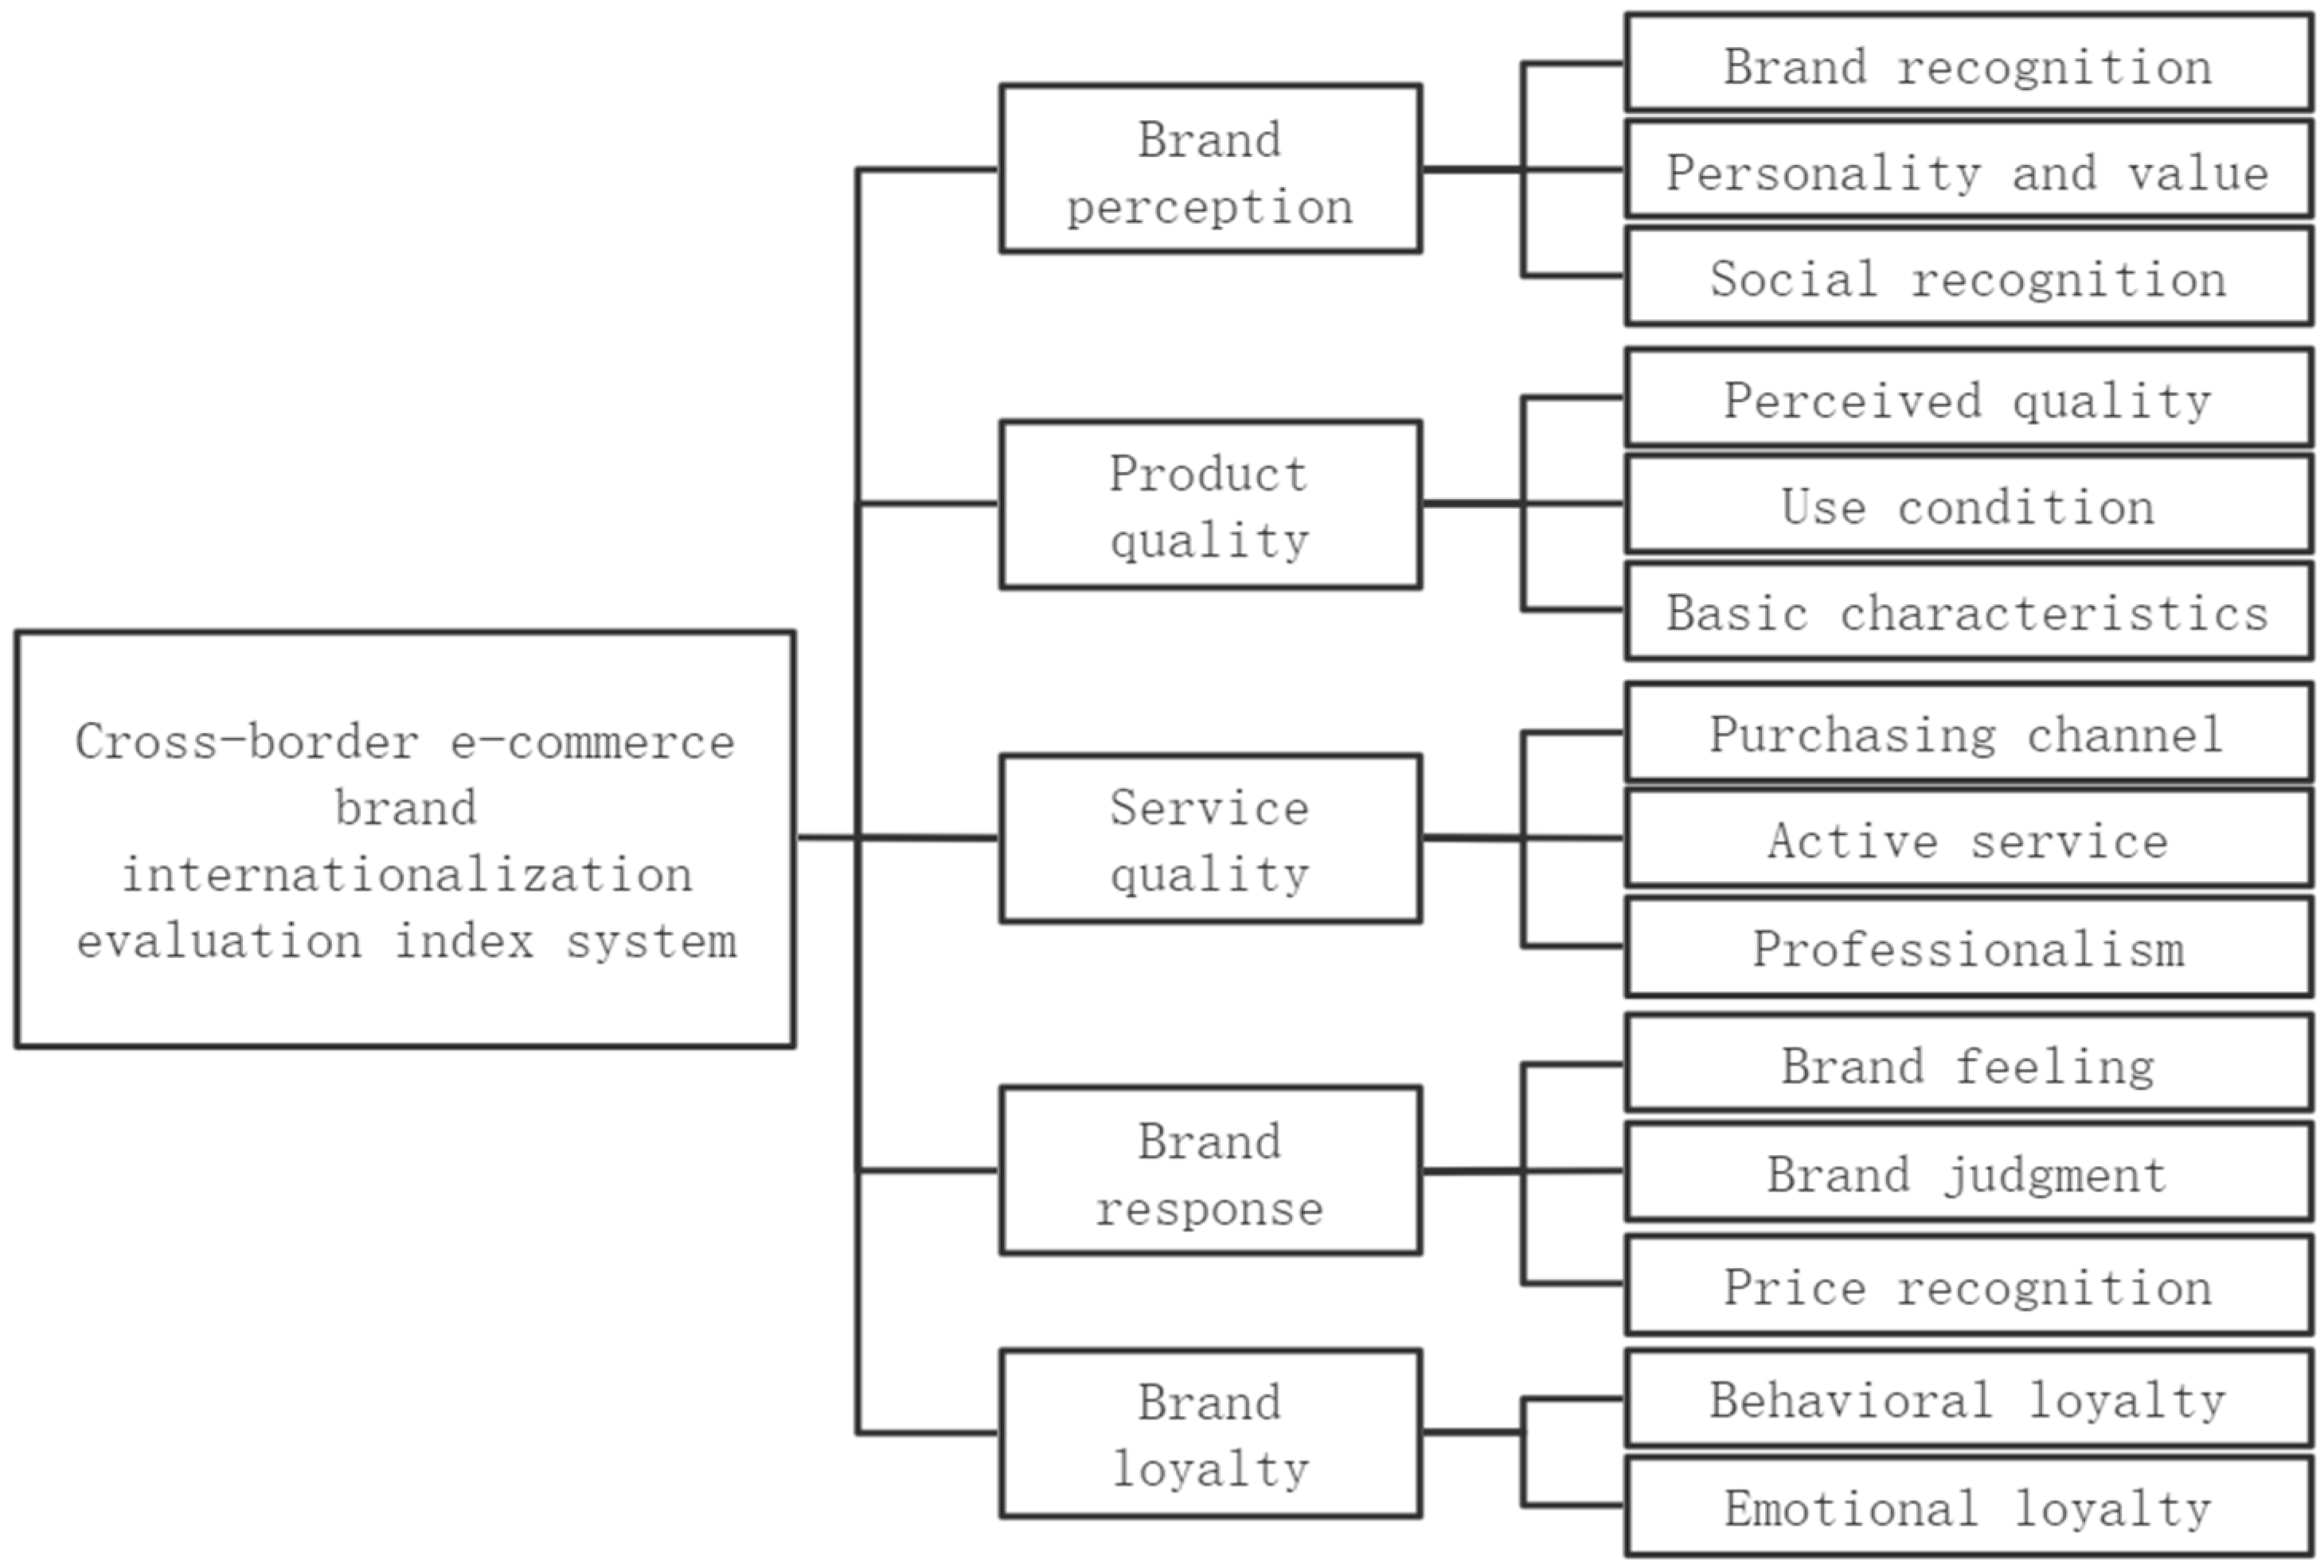
Based on the SICAS consumer behavior model, this study integrated the CBBE model, the ten-factor brand value model, and the Brand Equity Engine model to construct an international evaluation index system for cross-border e-commerce brands. The system is divided into five dimensions, totaling 14 indexes. The brand perception dimension represents consumer perception of a brand and brand reputation, including brand recognition, personality and value, and social recognition. The product quality dimension represents the consumer cognition of the product’s quality, conditions of use, and practicality, including three indexes: perceived quality, use condition, and basic characteristics. The service quality dimension represents consumer cognition of the tangibility, reliability, response speed, and professional quality of service personnel, including three indexes: purchasing channel, active service, and professionalism. The brand response dimension represents consumer feelings and views on the brand, including brand feeling, brand judgment, and price recognition. The brand loyalty dimension represents consumer willingness to repurchase and recommendation awareness, including two indexes: behavioral loyalty and emotional loyalty.

5.2. Practical Contributions

According to the gradient ranking of “necessary factors > expectation factors > charm factors > no difference factors” of importance, the optimization of the service indicators related to each factor was completed layer by layer. Therefore, managers could focus on service indexes related to expected factors, and give priority to meeting the service indexes related to the essential factors and striving to meet the service indexes related to the attractive factor. Indeed, indifference and negative factors should not be a major concern. Managers can enhance the internationalization of cross-border e-commerce brands through the following measures.
Managers could focus on the expected factors related to service indexes. In cross-border e-commerce brand internationalization, managers should prioritize improving and enriching the expected factors, ensuring consumer brand recognition and perceived quality needs, and striving to build their own competitive advantages to ensure consumers get a better consumer experience. According to the brand recognition index, managers could choose different marketing methods to increase publicity, such as internet marketing, e-commerce platform marketing, product co-marketing, etc. [37] Given the perceived quality index, managers need to improve the selection of raw materials, enhance their production technological level, and improve the quality of inspection systems. In addition, managers could also strengthen the design of packaging, from the details to enhancing consumer perception of product quality.
In the initial stage of internationalization, priority should be given to the provision of services related to indicators of the necessary factors. For active service index, managers should improve customer service attitude, provide intimate services for consumers, such as the initiative to provide notice of new products or brand activity, let the consumer realize the cross-border e-commerce brand’s unique service in the consumption process, enhance the service’s perceived value to the consumer [38]. According to the social recognition index, managers could ascertain the degree of brand recognition in consumers’ minds and strengthen any weak links to improve social recognition.
As far as possible, the manager should pay attention to the service related to the attractive factor to ensure the satisfaction of the expected factors and the essential factors. As much as possible, managers should expand the attractive factor-related services to maintain existing consumers and attract potential consumers. For the personality and value index, managers should increase investment in product design and research and development and avoid outside influence. For the price recognition index, managers should provide price concessions, such as launching full reductions in official websites, providing limited discounts, and other activities to attract consumers to buy their products. For the conditions of use index, managers need to improve the scope of application of the product as far as possible and, according to the uses of the product, simplify or improve its functionality. For the brand feeling index, managers should seek to break inherent impressions of the brand to establish a new all-around brand perception for consumers, such as improving the brand short board, developing new product types, and strengthening publicity [39].
There should be appropriate trade-off in real-time observation of indifference factors related to service indexes. Managers should reduce resources for the indifference factors of the service relative to the resources for the expected factors, essential factors, and attractive factors [21], At the same time, managers should actively pay attention to consumer changes and make timely adjustments.
In cross-border e-commerce brand internationalization, managers should avoid negative factors, such as repeatedly inviting consumers to give good reviews, or the release of buyer’s shows, which can easily cause consumers to dislike the behavior, and, thus, leading to a decline in satisfaction. Rather than encouraging consumers to buy back through repeated invitations and repurchase offers, managers should improve product quality and service quality and praise consumers spontaneously to win more consumers to repurchase.

5.3. Limitations and Future Research

Since consumer groups with different consumption levels have different evaluations of products, and comment panels cannot obtain specific information from consumers, future research on the internationalization of cross-border e-commerce brands should distinguish between comment groups. At the same time, this study only captured the comment information of clothing products, and the index system could be extended to other commodity fields in the future to identify the problems existing in the internationalization of cross-border e-commerce brands in those fields.

Author Contributions

Conceptualization, M.F.; Data curation, Z.T. and Q.M.; Formal analysis, Z.T.; Investigation, Z.T. and S.A.Q.; Methodology, S.A.Q. and K.T.; Project administration, M.F.; Software, A.B.; Supervision, M.F.; Validation, Q.M.; Visualization, K.T. and A.B.; Writing—original draft, S.A.Q. All authors have read and agreed to the published version of the manuscript.

Funding

This study is supported by the National Social Science Fund of China (22BGL102) and the 21st Batch of Student Scientific Research Project of Jiangsu University (21C196).

Institutional Review Board Statement

Not applicable.

Informed Consent Statement

Not applicable.

Data Availability Statement

Data will be available on request from the authors.

Conflicts of Interest

The authors declare that they have no competing interest.

References

  1. Oláh, J.; Kitukutha, N.; Haddad, H.; Pakurár, M.; Máté, D.; Popp, J. Achieving Sustainable E-Commerce in Environmental, Social and Economic Dimensions by Taking Possible Trade-Offs. Sustainability 2019, 11, 89. [Google Scholar]
  2. Escursell, S.; Llorach-Massana, P.; Roncero, M.B. Sustainability in e-commerce packaging: A review. J. Clean. Prod. 2021, 280, 124314. [Google Scholar] [CrossRef]
  3. Al-Chalabi, M.; Banister, D. The Missing Link? Insights from an Innovative Feedback Exercise for Household Electricity and Travel Behaviour. Sustainability 2022, 14, 9115. [Google Scholar]
  4. Zhai, Z. Application Research on Brand Evaluation Method—Based on Interbrand Model; Inner MongoliaAgricultural University: Hohhot, China, 2016. [Google Scholar]
  5. Hoeffler, S.; Keller, K.L. Building Brand Equity Through Corporate Societal Marketing. J. Public Policy Mark. 2002, 21, 78–89. [Google Scholar]
  6. Keller, K.L. Strategic Brand Management: Building, Measuring, and Managing Brand Equity. J. Consum. Mark. 2008, 17, 263–272. [Google Scholar]
  7. Longwell, G.J. Managing brand equity: Capitalizing on the value of a brand name: David A. Aaker, The Free Press, New York (1991). J. Bus. Res. 1994, 29, 247–248. [Google Scholar]
  8. Chen, Q. Improvement and Empirical Research for Brand Equity Ten Model Based on Consumer Perspective. Value Eng. 2014, 33, 7–11. [Google Scholar] [CrossRef]
  9. Wei, F. Global Branding: Model Selection & Evaluation. J. Tianjin Univ. Commer. 2001, 27–30. [Google Scholar] [CrossRef]
  10. Song, Y. The market choice mode of Chinese brand internationalization. Commer. Res. 2003, 13, 148–149. [Google Scholar] [CrossRef]
  11. Wang, D. Research on the Brand Internationlization of Chinese EnterPrises. Master’s Thesis, Sichuan University, Chengdu, China, 2006. [Google Scholar]
  12. Whitelock, J.; Fastoso, F. Understanding international branding: Defining the domain and reviewing the literature. Int. Mark. Rev. 2007, 24, 252–270. [Google Scholar]
  13. Christodoulides, G.; Cadogan, J.W.; Veloutsou, C. Consumer-based brand equity measurement: Lessons learned from an international study. Int. Mark. Rev. 2015, 32, 307–328. [Google Scholar]
  14. Zhang, X. A Review of Research on Cross-border E-commerce Brand Internationalization. Southwest Financ. 2021, 3–19. [Google Scholar]
  15. Bi, J.W.; Liu, Y.; Fan, Z.P.; Cambria, E. Modelling customer satisfaction from online reviews using ensemble neural network and effect-based Kano model. Int. J. Prod. Res. 2019, 57, 7068–7088. [Google Scholar]
  16. Kim, T.; Yoo, T. Methodology for extracting the delighter in Kano model using big data analysis. Total Qual. Manag. Bus. Excell. 2018, 31, 654–665. [Google Scholar]
  17. Chiang, C.-F.; Chen, W.-Y.; Hsu, C.-Y. Classifying technological innovation attributes for hotels: An application of the Kano model. J. Travel Tour. Mark. 2019, 36, 796–807. [Google Scholar]
  18. Suh, Y.; Woo, C.; Koh, J.; Jeon, J. Analysing the satisfaction of university–industry cooperation efforts based on the Kano model: A Korean case. Technol. Forecast. Soc. Change 2019, 148, 119740. [Google Scholar]
  19. Dou, R.; Huang, R.; Nan, G.; Liu, J. Less diversity but higher satisfaction: An intelligent product configuration method for type-decreased mass customization. Comput. Ind. Eng. 2020, 142, 106336. [Google Scholar]
  20. Zhao, S.; Zhang, Q.; Peng, Z.; Fan, Y. Integrating customer requirements into customized product configuration design based on Kano’s model. J. Intell. Manuf. 2020, 31, 597–613. [Google Scholar]
  21. Kano, N.; Seraku, N.; Takahashi, F.; Tsuji, S. Attractive Quality and Must-Be Quality. J. Jpn. Soc. Qual. Control. 1984, 14, 147–156. [Google Scholar]
  22. Zhou, F.; Lim, M.K.; He, Y.; Pratap, S. What attracts vehicle consumers’ buying: A Saaty scale-based VIKOR (SSC-VIKOR) approach from after-sales textual perspective? Ind. Manag. Data Syst. 2019, 120. Ahead of print. [Google Scholar]
  23. Costea, A.; Ferrara, M.; Şerban, F. An integrated two-stage methodology for optimising the accuracy of performance classification models. Technol. Econ. Dev. Econ. 2017, 23, 111–139. [Google Scholar]
  24. Khan, W.A.; Chung, S.H.; Awan, M.U.; Wen, X. Machine learning facilitated business intelligence (Part I): Neural networks learning algorithms and applications. Ind. Manag. Data Syst. 2019, 120, 164–195. [Google Scholar]
  25. Koehn, D.; Lessmann, S.; Schaal, M. Predicting Online Shopping Behaviour from Clickstream Data using Deep Learning. Expert Syst. Appl. 2020, 150, 113342. [Google Scholar]
  26. Qin, W.; Lv, H.; Liu, C.; Nirmalya, D.; Jahanshahi, P. Remaining useful life prediction for lithium-ion batteries using particle filter and artificial neural network. Ind. Manag. Data Syst. 2019, 7, 54843–54854. [Google Scholar]
  27. Vanstone, B.J.; Gepp, A.; Harris, G. Do news and sentiment play a role in stock price prediction? Appl. Intell. 2019, 49, 3815–3820. [Google Scholar]
  28. Huang, X.; Liu, G.; Liu, X.; Yang, A. Sentiment classification depth model based on word2vec and bi-directional LSTM. Appl. Res. Comput. 2019, 36, 6. [Google Scholar]
  29. Zhang, Z.; Xu, B. Research on E-commerce Logistics Service Quality Problem Based on Electronic Word-of Mouth Data Mining. China Bus. Mark. 2019, 33, 43–55. [Google Scholar] [CrossRef]
  30. Blei, D.M.; Ng, A.Y.; Jordan, M.I.; Lafferty, J. Latent Dirichlet Allocation. J. Mach. Learn. Res. 2003, 3, 4–5. [Google Scholar]
  31. Cui, N. Research on Online Commodity Review Based on LDA Topic Model and Partial Order Set. Inf. Res. 2021, 12, 6. [Google Scholar]
  32. Chen, J. Research on the Application of Online Comments Based on Text Mining; Hubei University of Technology: Wuhan, China, 2020. [Google Scholar]
  33. Zhang, Y. Research on Mining and Application of Supply Chain Management Intelligence Based on Social Media Analytics. Doctoral Thesis, South-Central University for Nationalities, Wuhan, China, 2020. [Google Scholar]
  34. Li, R. Application of Data Mining Technology Based on TF-IDF Algorithm and LDA Topic Model in Power Customer Complaint Text. Tech. Autom. Appl. 2018, 37, 5. [Google Scholar]
  35. Zhang, M.; Li, Y. Research on the effectiveness of ethnic minority literature based on web crawlers. J. Southwest Minzu Univ. Nat. Sci. Ed. 2019, 45, 173–177. [Google Scholar]
  36. Abadi, M.; Barham, P.; Chen, J.; Chen, Z.; Zhang, X. TensorFlow: A system for large-scale machine learning. In Proceedings of the 12th USENIX Conference on Operating Systems Design and Implementation, Savannah, GA, USA, 2–4 November 2016; USENIX Association: Berkeley, CA, USA, 2016. [Google Scholar]
  37. Gerber, C.; Terblanche-Smit, M.; Crommelin, T. Brand recognition in television advertising: The influence of brand presence and brand introduction: Original research. Prof. Account. 2014, 14, 182–189. [Google Scholar]
  38. Zhang, X.D.; Pan, H.E. Study on the Influence Mechanism of Consumer’s Brand Preference in Cross-border E-commerce. Consum. Econ. 2018, 34, 82–89. [Google Scholar]
  39. Wei, P.Q. Countermeasures for the Development of Cross-border E-commerce with the Strategic Benefits Brought by the Belt and Road Initiative. China Bus. Mark. 2017, 31, 62–70. [Google Scholar]
Figure 1. Kano model and its basic categories.
Sustainability 14 13127 g001
Figure 2. LSTM unit.
Sustainability 14 13127 g002
Figure 3. Research technique.
Sustainability 14 13127 g003
Figure 4. Cross-border e-commerce brand internationalization evaluation index system.
Sustainability 14 13127 g004
Figure 5. Visual display of topic distribution results.
Sustainability 14 13127 g005
Figure 6. Loss function curve.
Sustainability 14 13127 g006
Figure 7. Cross-border e-commerce brand international demand hierarchy tower.
Sustainability 14 13127 g007
Table 1. Cross-border e-commerce brand internationalization evaluation index.
DimensionIndexIndex Model SourceMeaning
Brand perceptionBrand recognitionBrand affinity dimension of the Brand Equity Engine model (RI, Research International)Consumer familiarity with the brand
Personality and valueBrand association and differentiation assessment dimensions in the ten-factor model of brand value (Aaker, 1996)Brand style and personality
Social recognitionBrand affinity dimension of the Brand Equity Engine model (RI, Research International)Brand prestige, acceptability, and expert recognition
Product QualityPerceived qualityBrand recognition and leadership brand assessment dimensions in the ten-factor model of brand value (Aaker, 1996)Quality, reliability, durability, serviceability, etc.
Use conditionBrand connotation dimension of the CBBE model (Kevin Lane Keller, 1993)Conditions of use of the product
Basic characteristicsMaterial, size, and other basic characteristics
Service qualityPurchasing channelBrand connotation dimension of the CBBE model (Kevin Lane Keller, 1993)Online and offline logistics services
Active serviceProactive and timely service
Service qualityProfessionalismBrand connotation dimension of the CBBE model (Kevin Lane Keller, 1993)Service Accuracy and Service Quality
Brand responseBrand feelingBrand response dimension of the CBBE model (Kevin Lane Keller, 1993)Consumers’ emotional behavior towards brands
Brand judgmentConsumer perceptions of brands
Price recognitionBrand function dimension of the Brand Equity Engine model (RI, Research International)Consumer purchase scope and consumption status
Brand loyaltyBehavioral loyaltyBrand relationship dimension of the CBBE model (Kevin Lane Keller, 1993)Frequency and number of repeat purchases
Emotional loyaltyPromote recommendations to friends and family
Table 2. Keywords.
Table 2. Keywords.
Keywords
adorecorresponditemlovepointsstretch
babydeliveryknowmaterialpricesummer
bitdesignlengthmediumproducttell
bodydressletnightpurchasewait
buyexpectedlightorderqualitywant
colorfitlikephotorecommendway
comegirllittlepicturerobewear
commenthavenlookpiecesizeworth
Table 3. TF-IDF value summary of keywords.
KeywordsTF-IDFKeywordsTF-IDFKeywordsTF-IDFKeywordsTF-IDF
Love0.097326wear0.025837adore0.012926light0.008977
Dress0.066268bit0.021895little0.012577length0.008608
Like0.065825haven0.021681way0.012265worth0.008270
Color0.058223order0.021332photo0.012239know0.007219
Fit0.052249recommend0.020610price0.010752delivery0.007135
Size0.046912wait0.019275girl0.010705tell0.006603
material0.046672correspond0.018663purchase0.010301expected0.006359
quality0.036686robe0.017813design0.009887medium0.006190
Come0.035358buy0.017298summer0.009585night0.006010
Look0.033117body0.015106want0.009328comment0.004532
product0.028983item0.015005let0.009209piece0.004330
picture0.026911stretch0.013428points0.009208baby0.004202
Table 4. Sentiment score summary of keywords.
KeywordsSentiment ScoreKeywordsSentiment ScoreKeywordsSentiment ScoreKeywordsSentiment Score
Worth0.399592 love0.241536 stretch0.205409 correspond0.159499
Summer0.310285 wait0.237577 expected0.203665 piece0.156292
Body0.310125 size0.236279 color0.201062 comment0.145778
recommend0.288341 look0.235422 product0.199910 come0.139282
Quality0.271432 photo0.234686 wear0.199646 haven0.133495
Picture0.271370 price0.230433 purchase0.190643 night0.128962
Material0.268868 light0.229739 like0.188349 tell0.122779
Fit0.265906 order0.228460 bit0.187483 let0.117547
Item0.252854 delivery0.227039 buy0.180309 want0.114215
Adore0.252587 design0.224869 length0.179461 medium0.089820
Robe0.248265 way0.212290 points0.178449 know0.055849
Dress0.243322 little0.210801 girl0.165146 baby0.055284
Table 5. Classification and calculation of keywords.
IndexKeywordsTF-IDFSentiment Score
Brand recognitiondress, item, product0.036752 0.232029
Personality and valuebody, design0.012496 0.267497
Social recognitioncorrespond, fit, medium, tell0.020926 0.159501
Perceived qualitylight, material, quality, stretch0.026441 0.243862
Use conditionnight, size, summer, way0.018693 0.221954
Basic characteristicsbit, color, length, little, piece, robe0.020574 0.197227
Purchasing channeldelivery, haven0.014408 0.180267
Active servicecome, let, wait0.021281 0.164802
Professionalismpoints0.009208 0.178449
Brand feelingadore, photos, pictures0.017359 0.252881
Brand judgmentcomment, expected, know, look, recommend, want0.013527 0.173878
Price recognitionprice, worth0.009511 0.315013
Behavioral loyaltybuy, order, purchase, wear0.018692 0.199765
Emotional loyaltybaby, girl, like, love0.044515 0.162579
Table 6. Index Kano Category Division.
IndexTF-IDFSentiment ScoreKano Category
Brand recognition0.036752 0.232029 Expected factor
Personality and value0.012496 0.267497 Attractive factor
Social recognition0.020926 0.159501 Essential factor
Perceived quality0.026441 0.243862 Expected factor
Use condition0.018693 0.221954 Attractive factor
Basic characteristics0.020574 0.197227 Essential factor
Purchasing channel0.014408 0.180267 Indifference factor
Active service0.021281 0.164802 Essential factor
Professionalism0.009208 0.178449 Indifference factor
Brand feeling0.017359 0.252881 Attractive factor
Brand judgment0.013527 0.173878 Indifference factor
Price recognition0.009511 0.315013 Attractive factor
Behavioral loyalty0.018692 0.199765 Negative factor
Emotional loyalty0.044515 0.162579 Essential factor
Publisher’s Note: MDPI stays neutral with regard to jurisdictional claims in published maps and institutional affiliations.

