
Impacted Application of Water-Hyacinth-Derived Biochar and Organic Manures on Soil Properties and Barley Growth
 ,
,  ,
,  and
and
Abstract
:1. Introduction
2. Materials and Methods
2.1. Collection and Characterization of Samples
2.2. Soil and Organic Amendments Analyses
2.3. Experimental Setup and Procedure
2.4. Statistical Analysis
3. Results
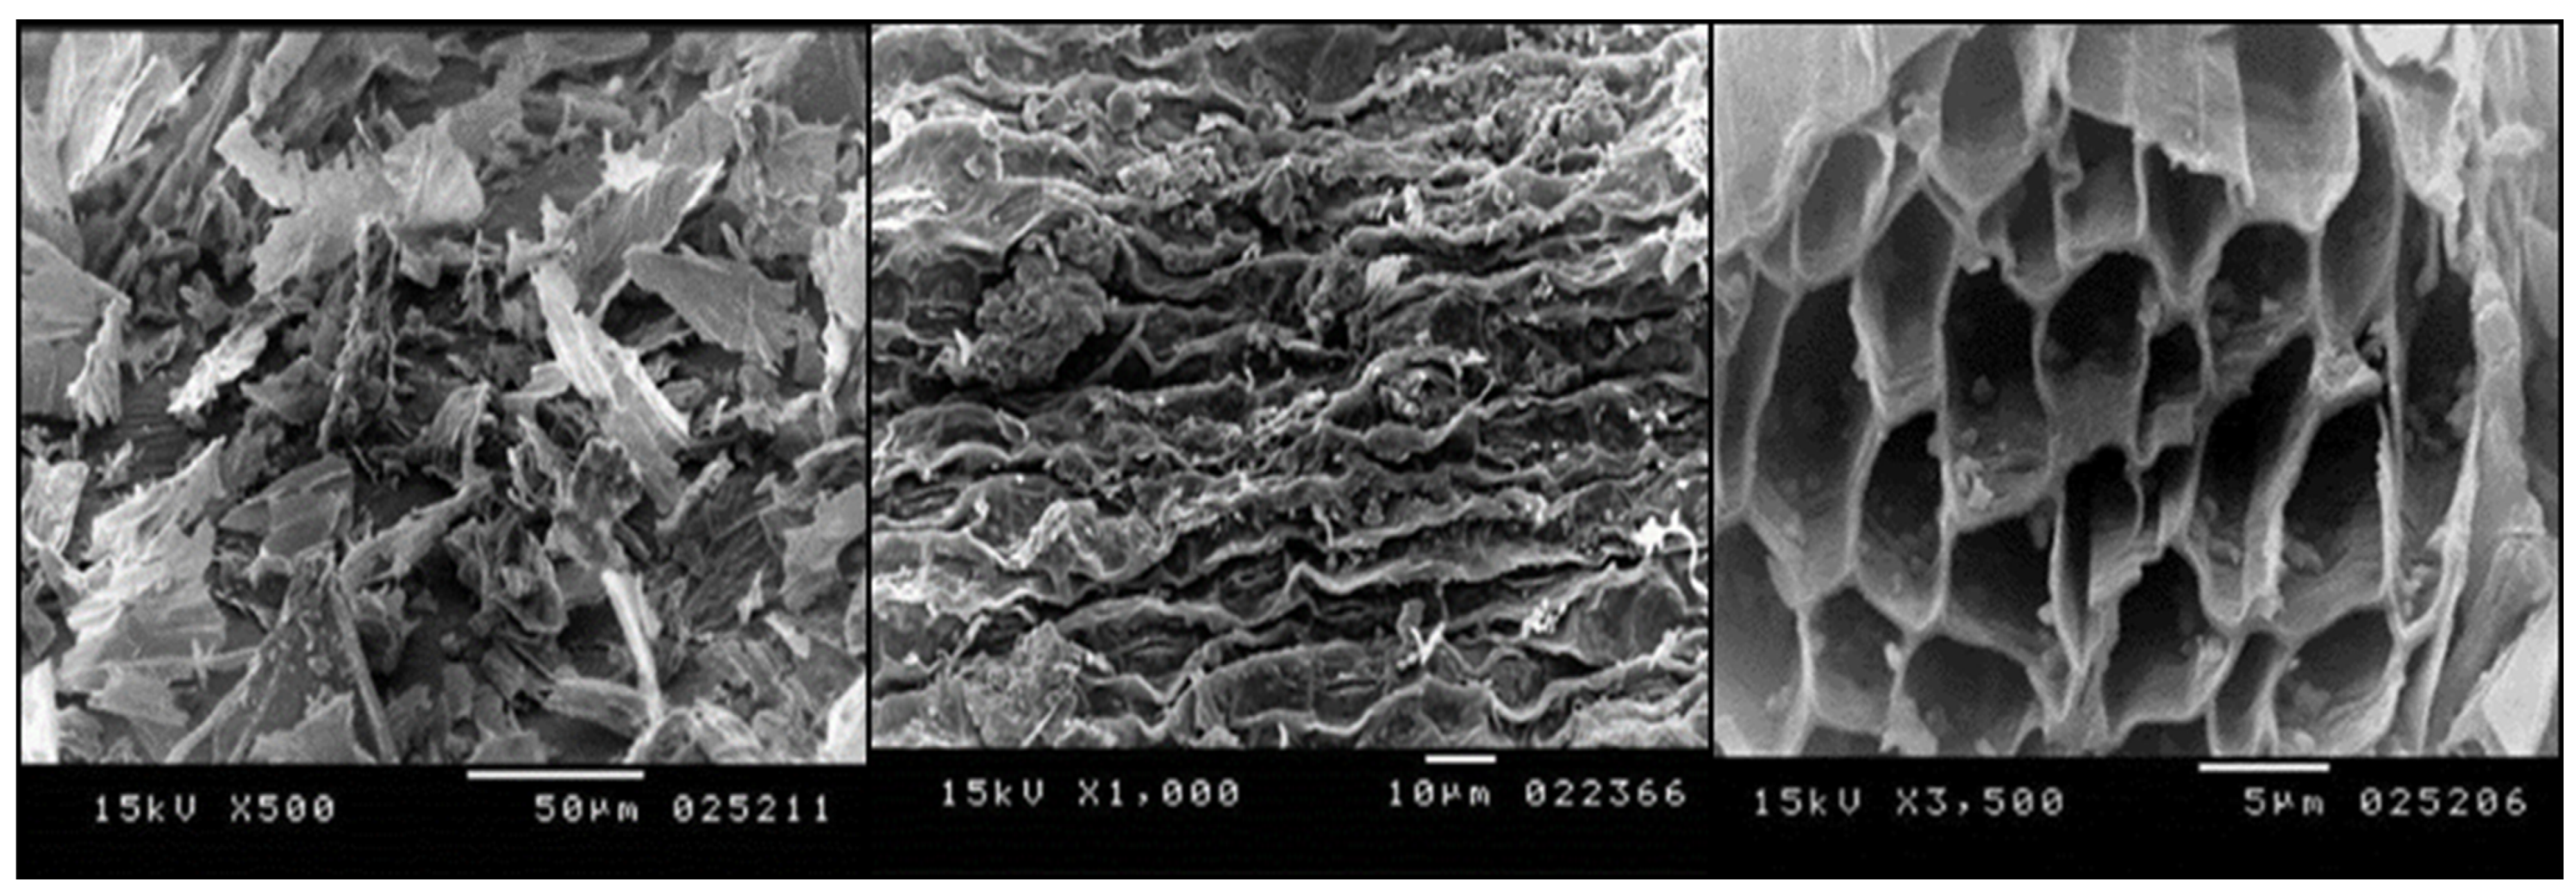
3.1. Surface Morphology of Water Hyacinth Biochar (WHB)
3.2. Effect of Biochar and Its Combined Application with FM and PM on Soil pH
3.3. Effect of Different Treatments on the Stability of Soil Structure
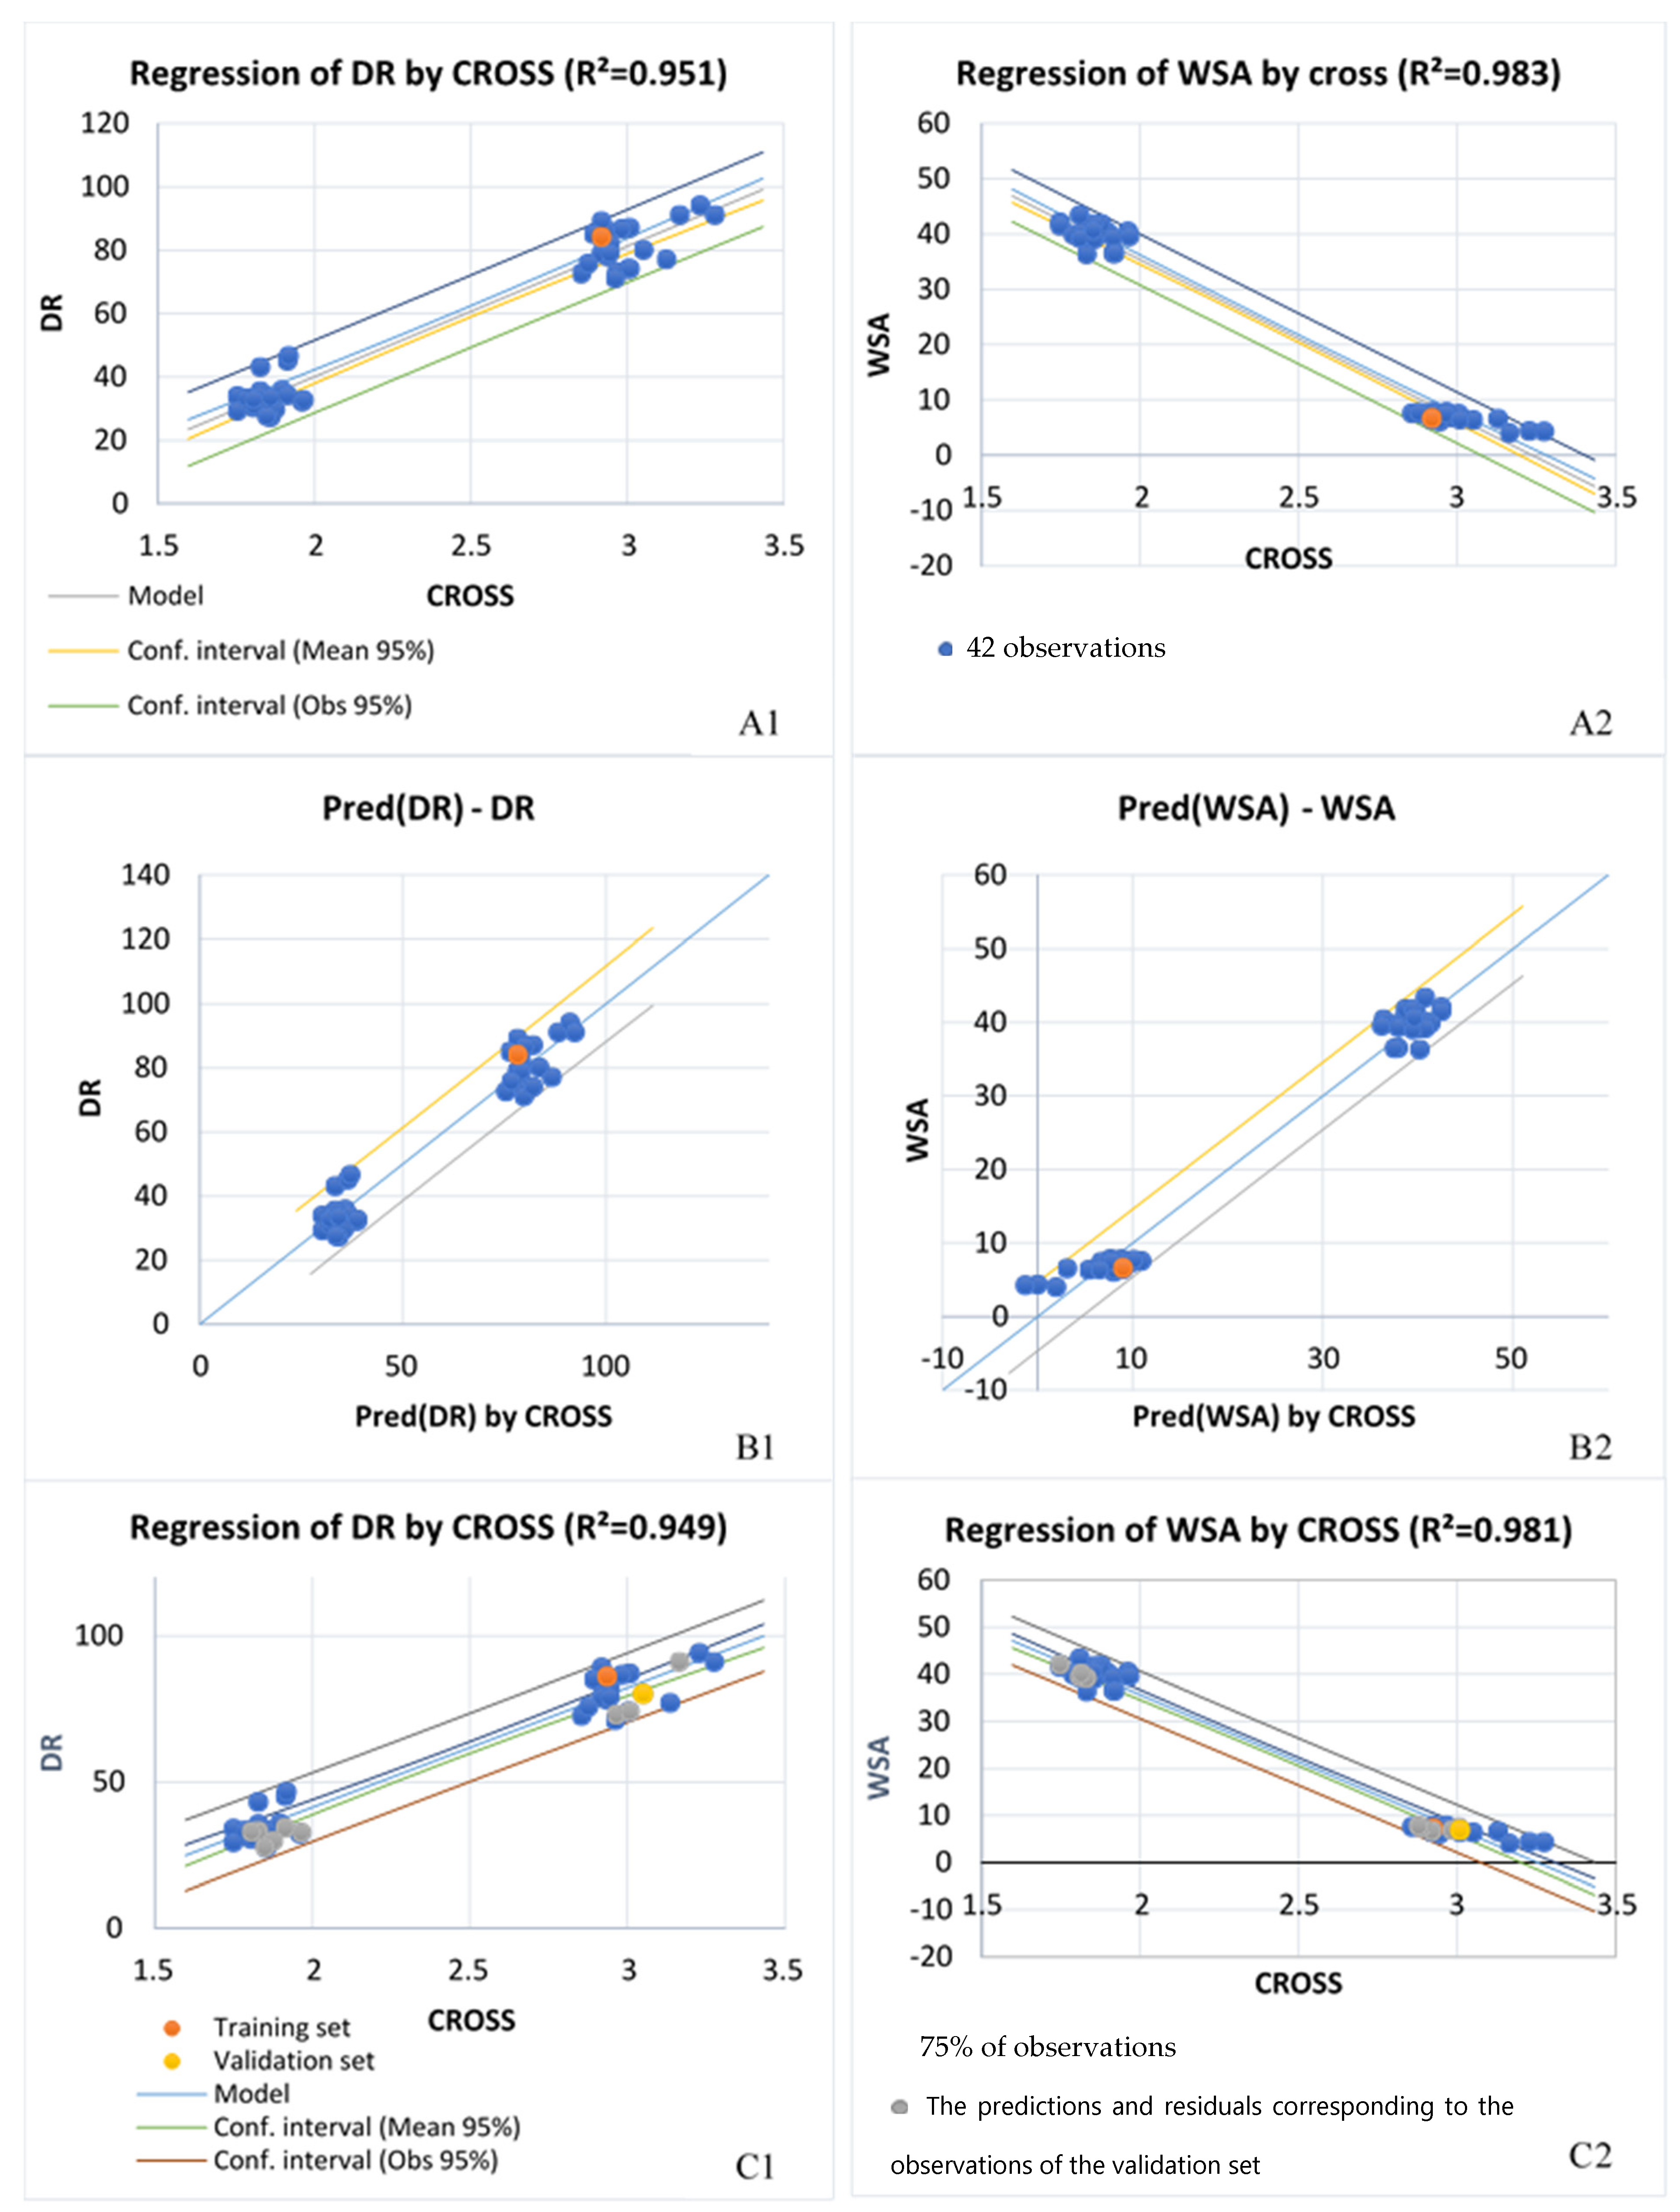
3.3.1. Dispersion Ratio (DR)
3.3.2. Cation Ratio of Soil Structural Stability (CROSS)
3.3.3. Water-Stable Aggregate (WSA)
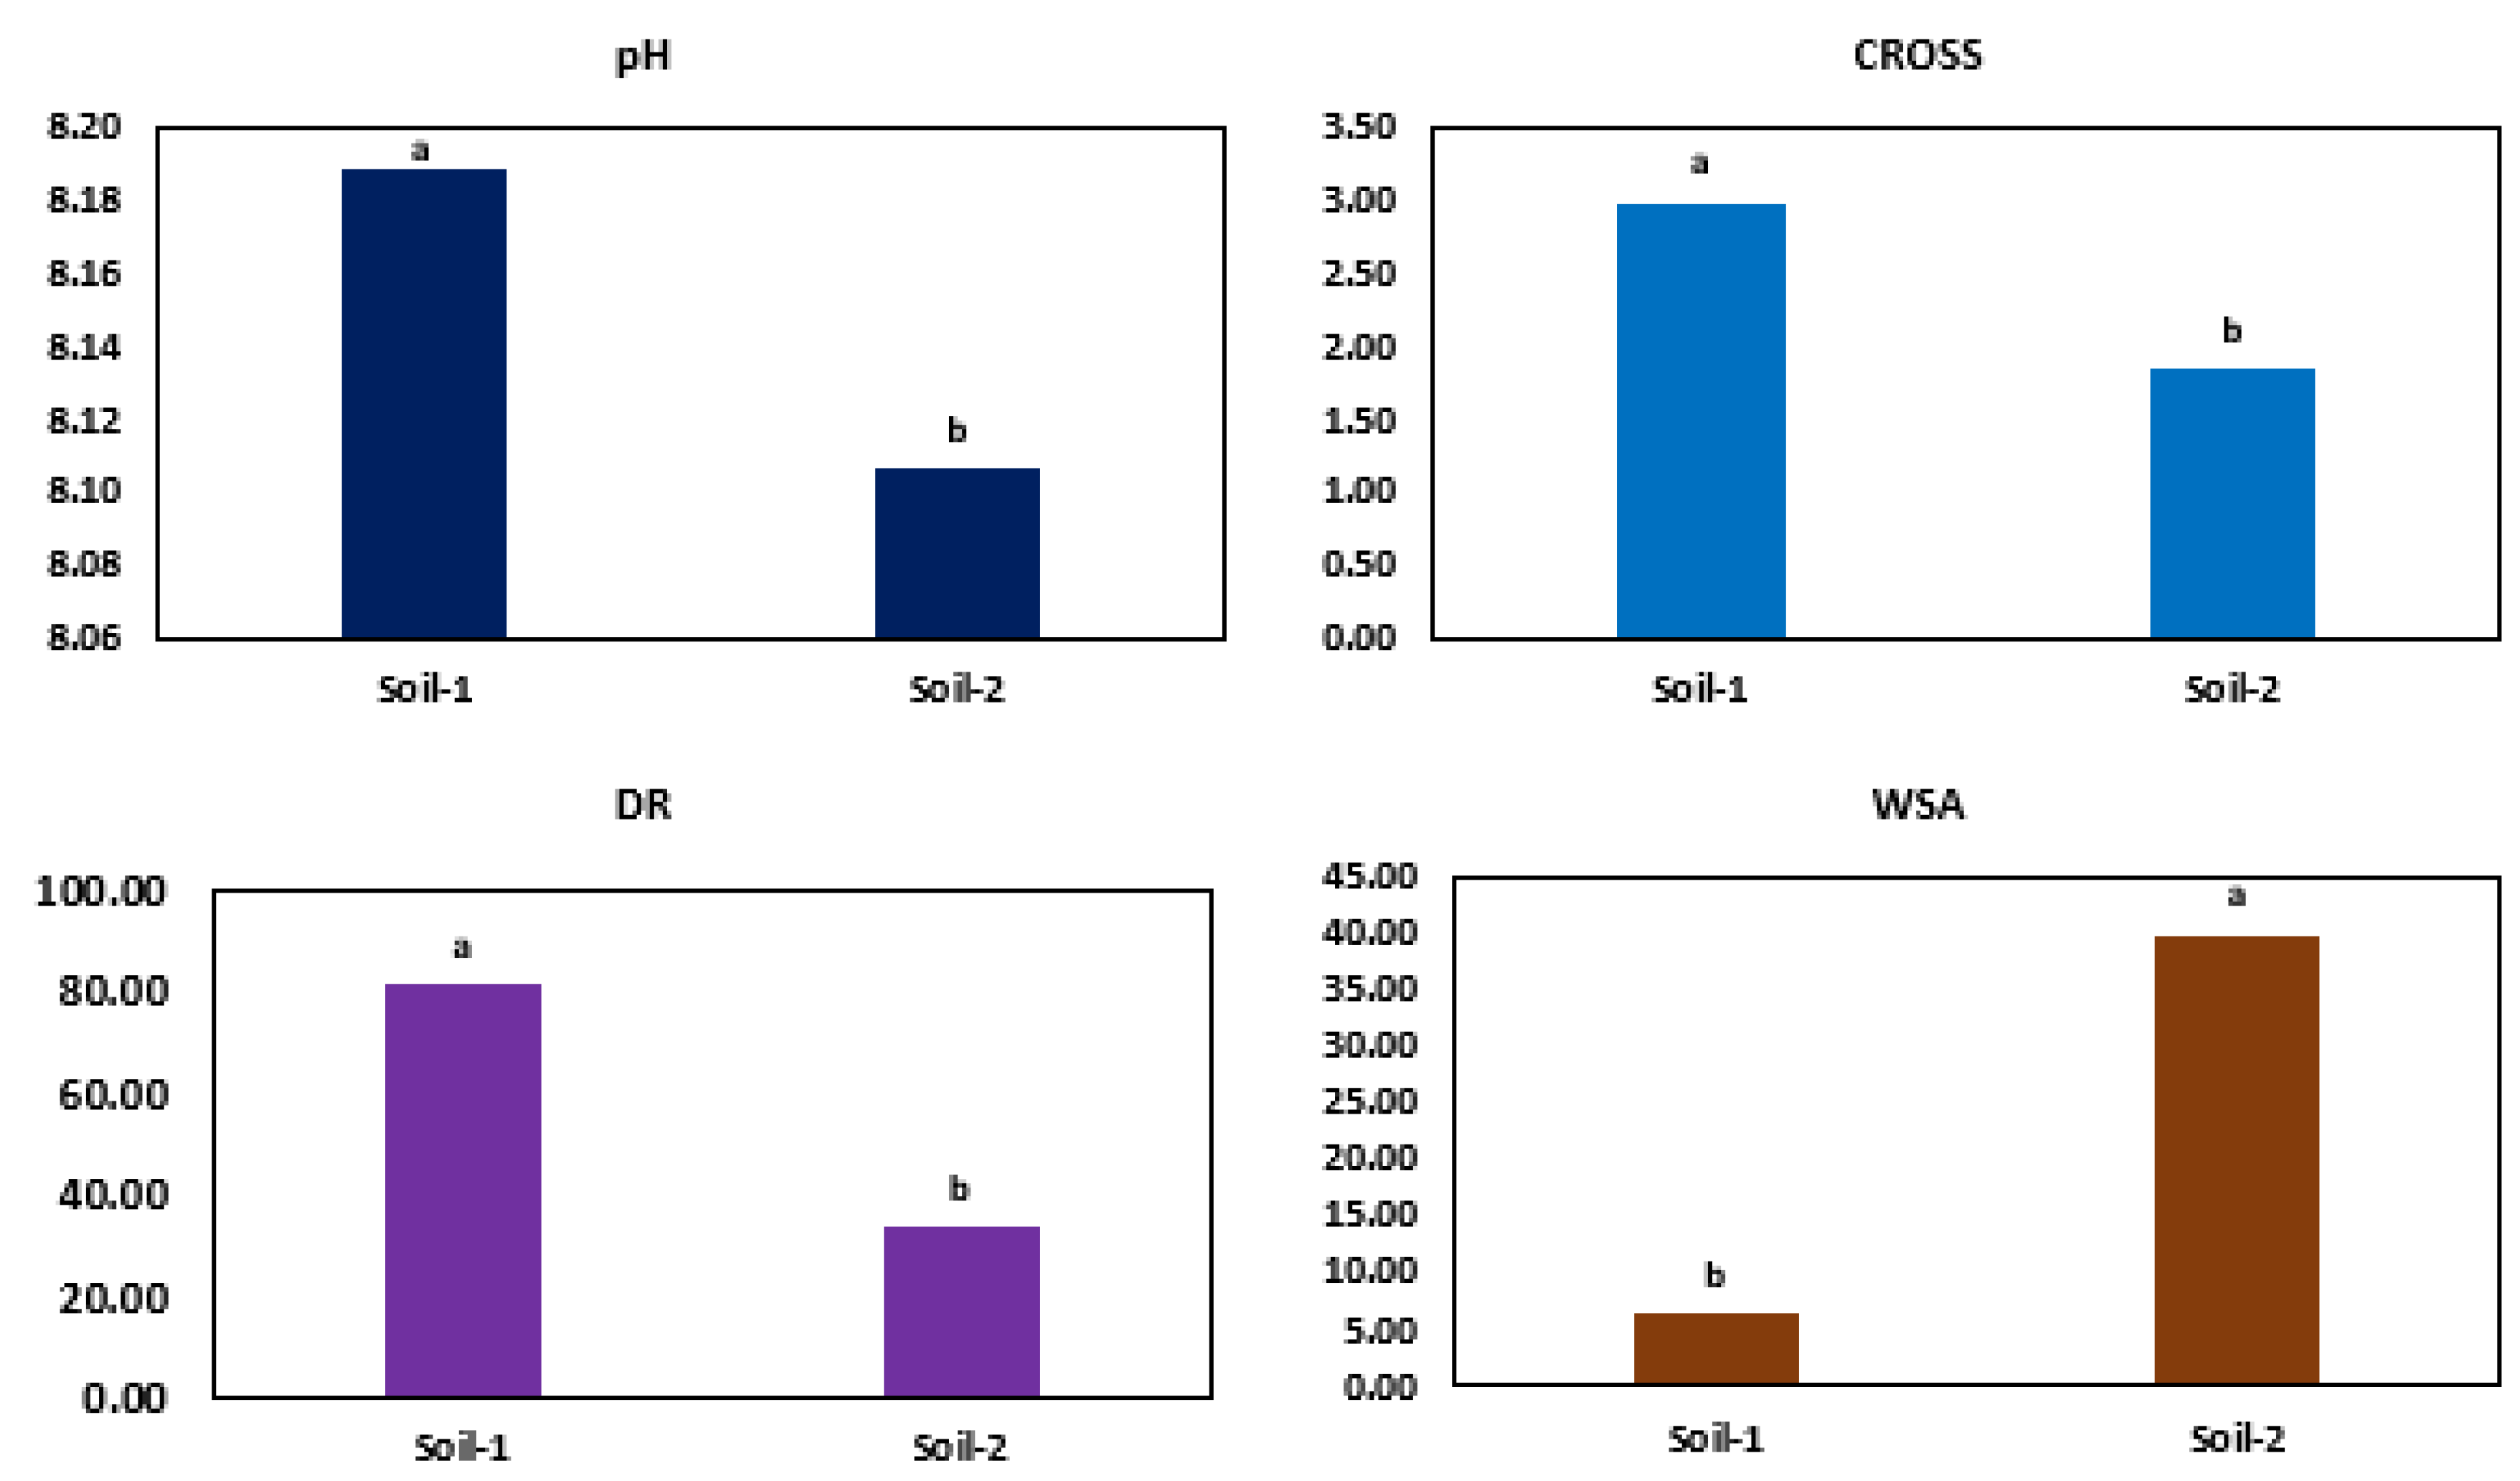
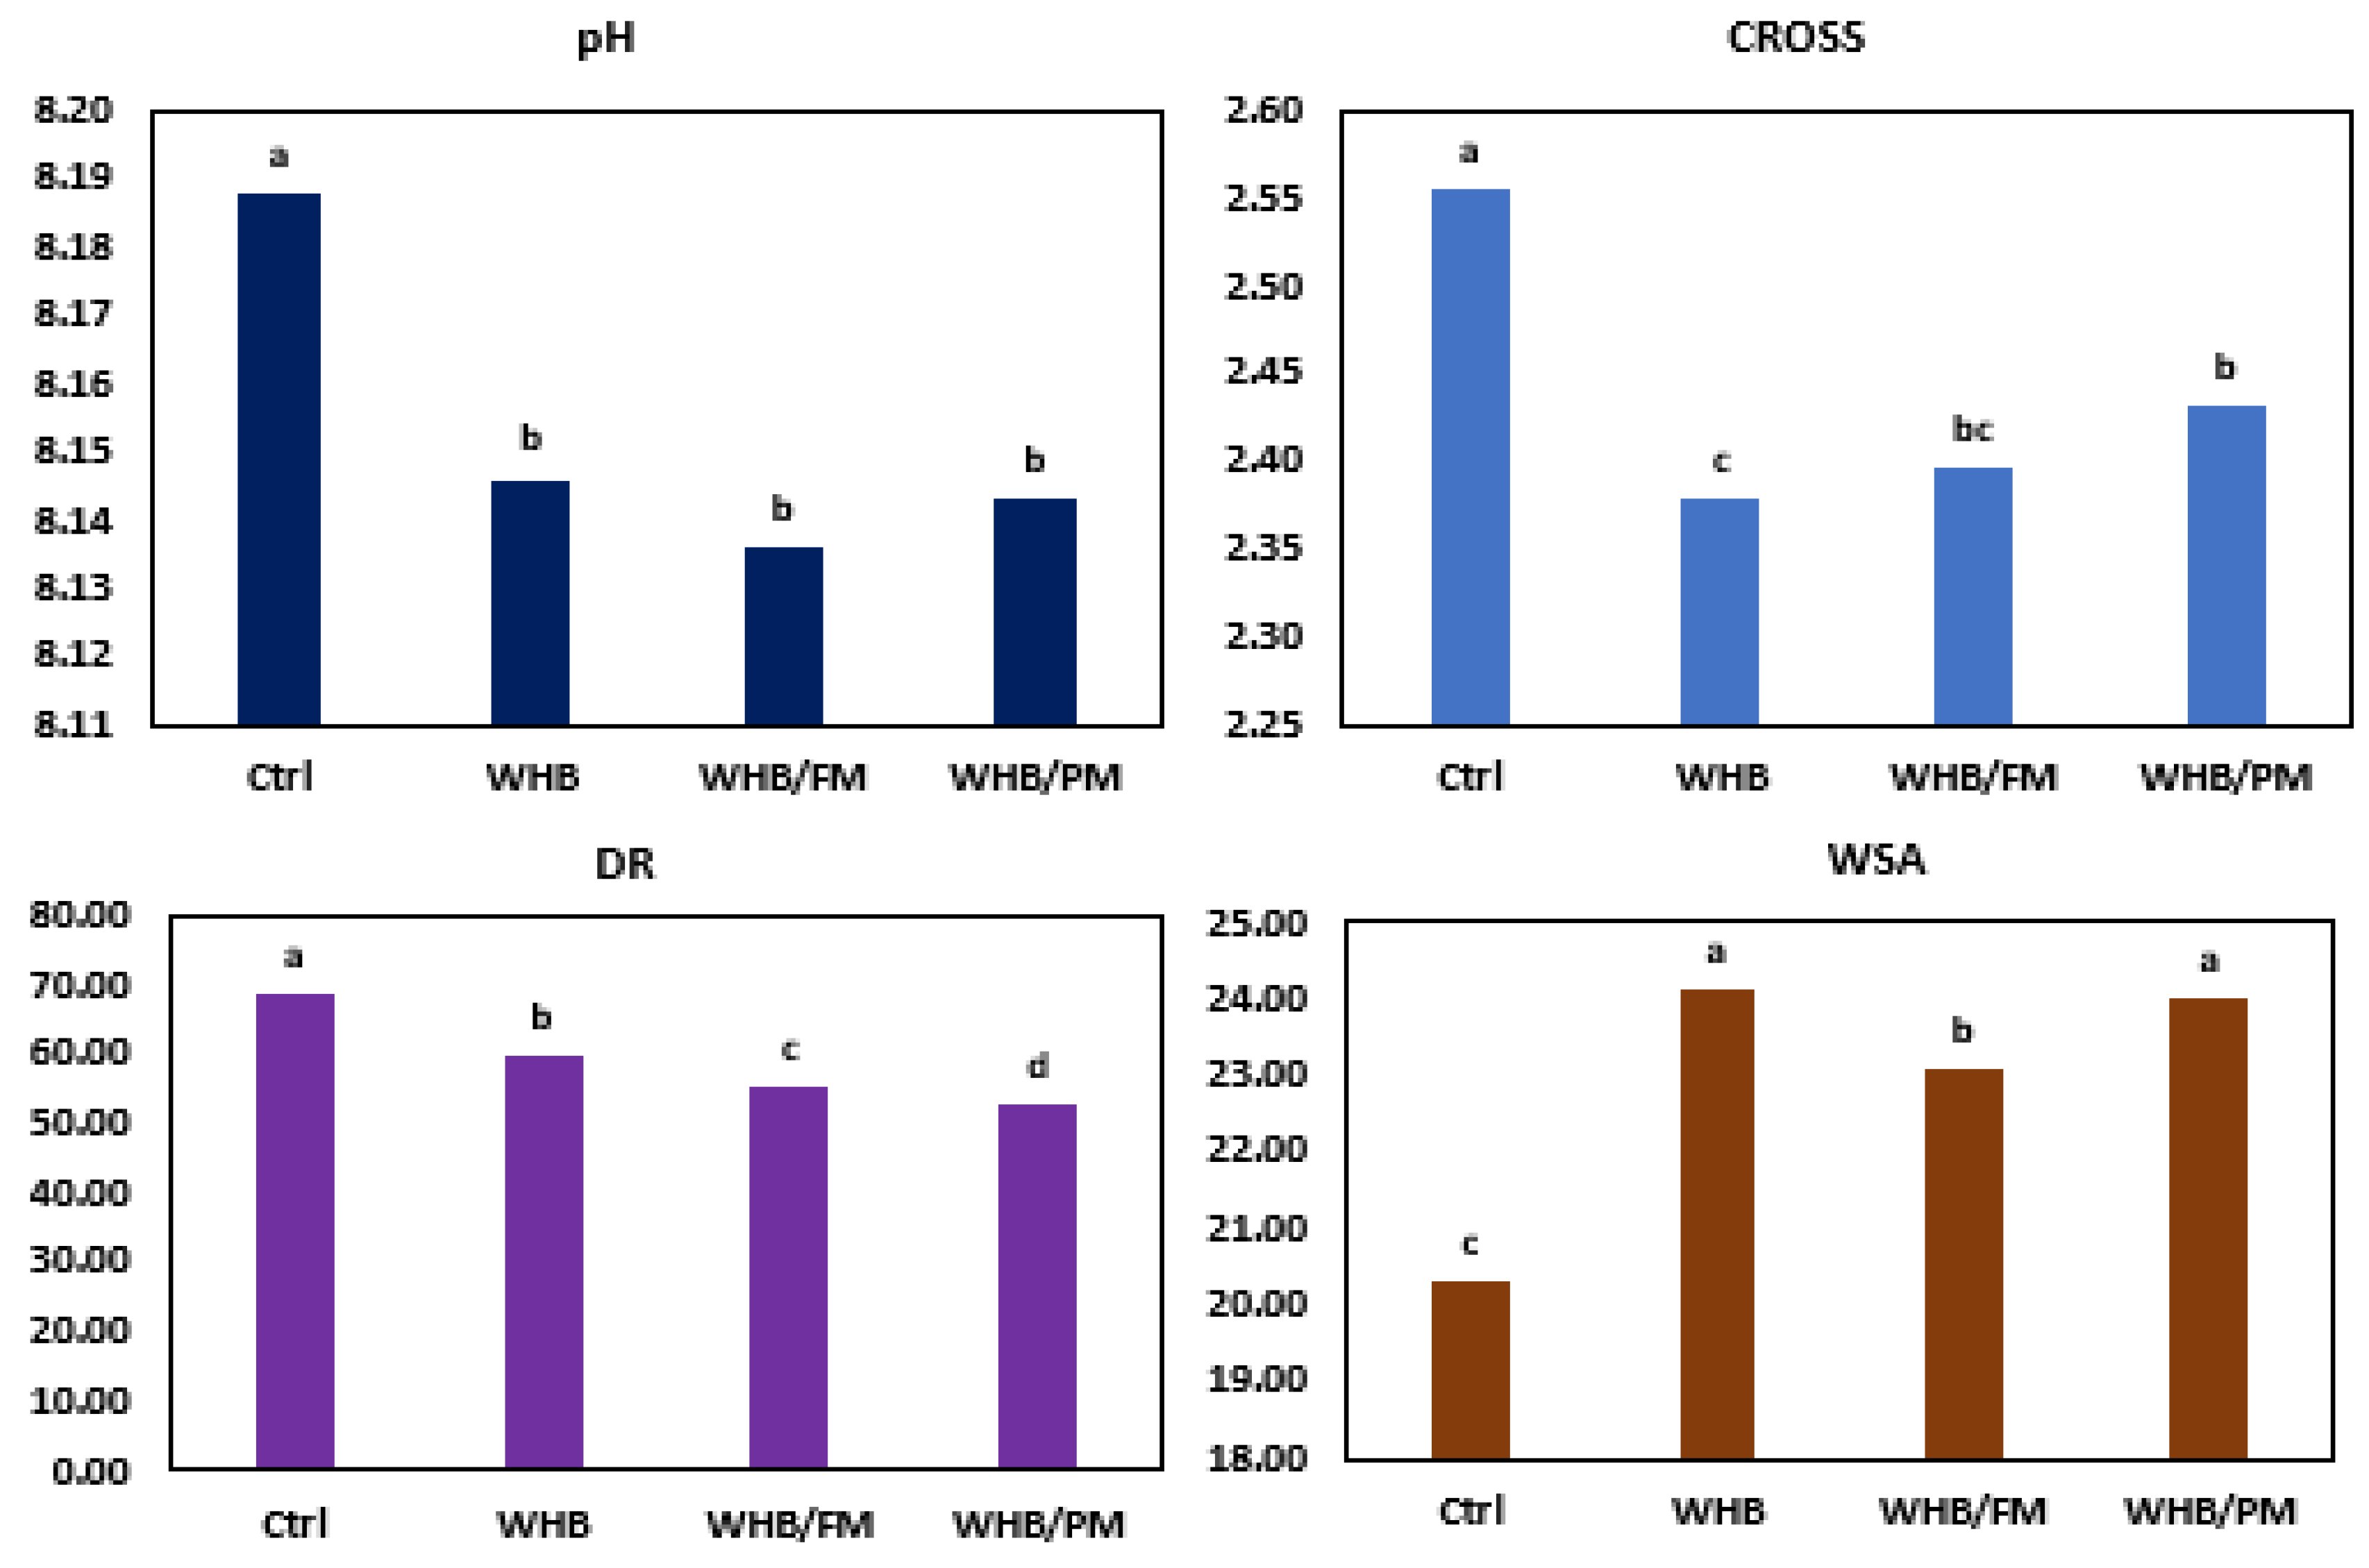
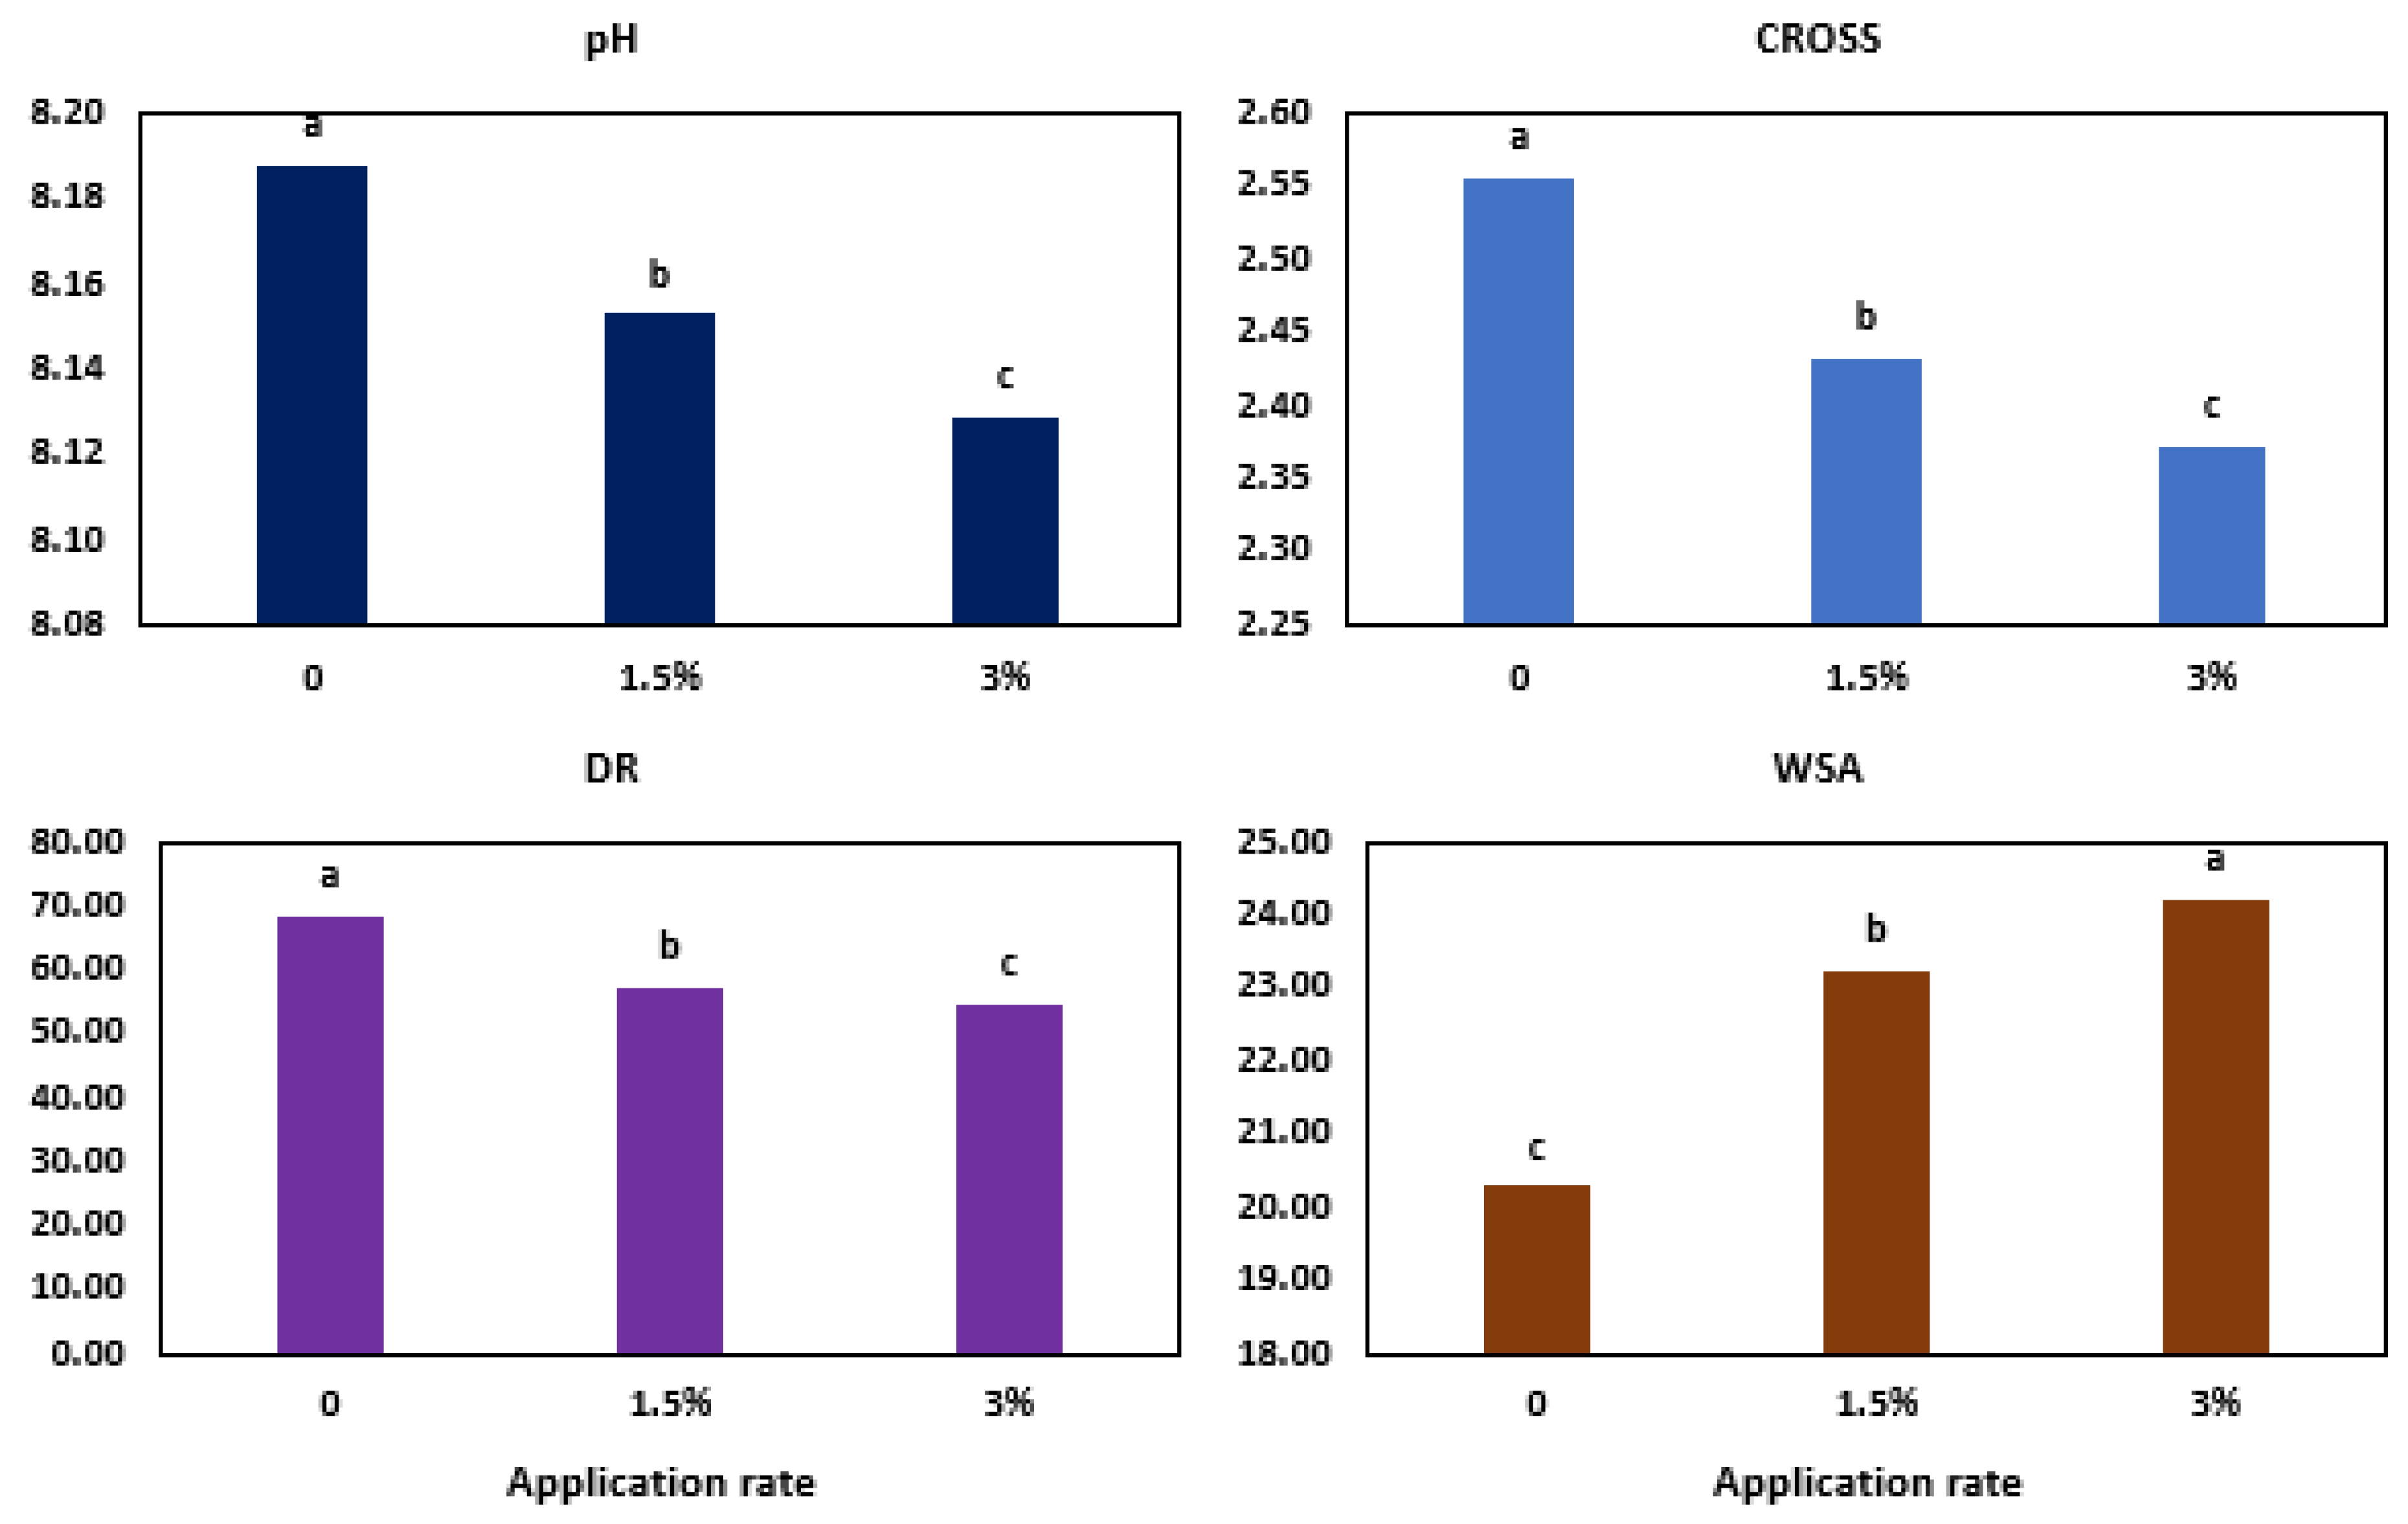
3.4. The Effects of Soil Texture, Amendment Type, and the Application Rate of Amendment on pH, CROSS, DR, and WSA
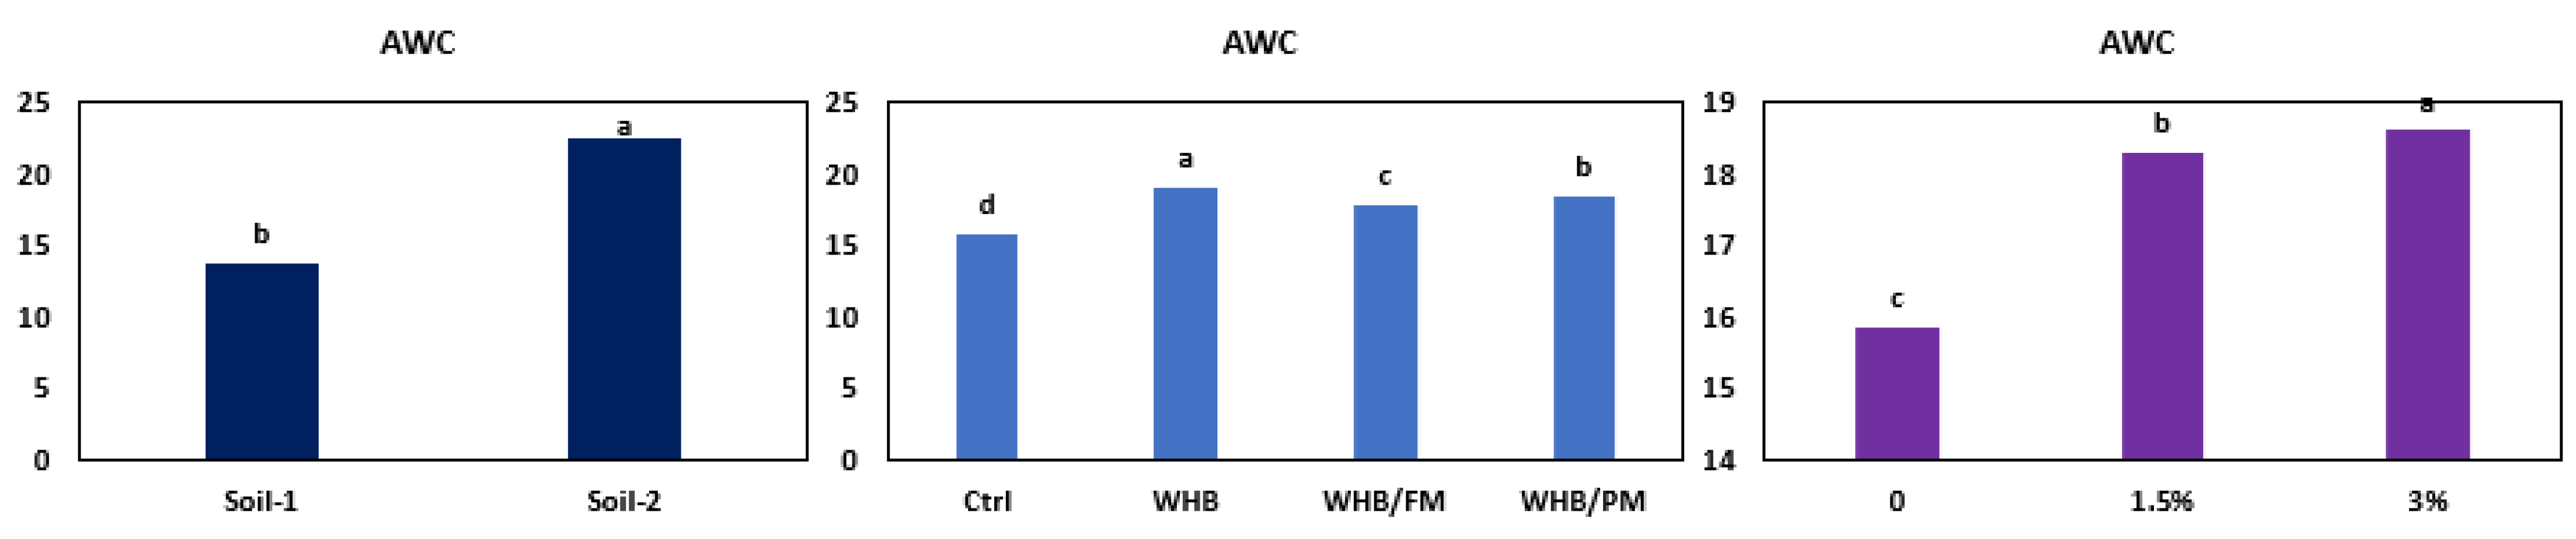
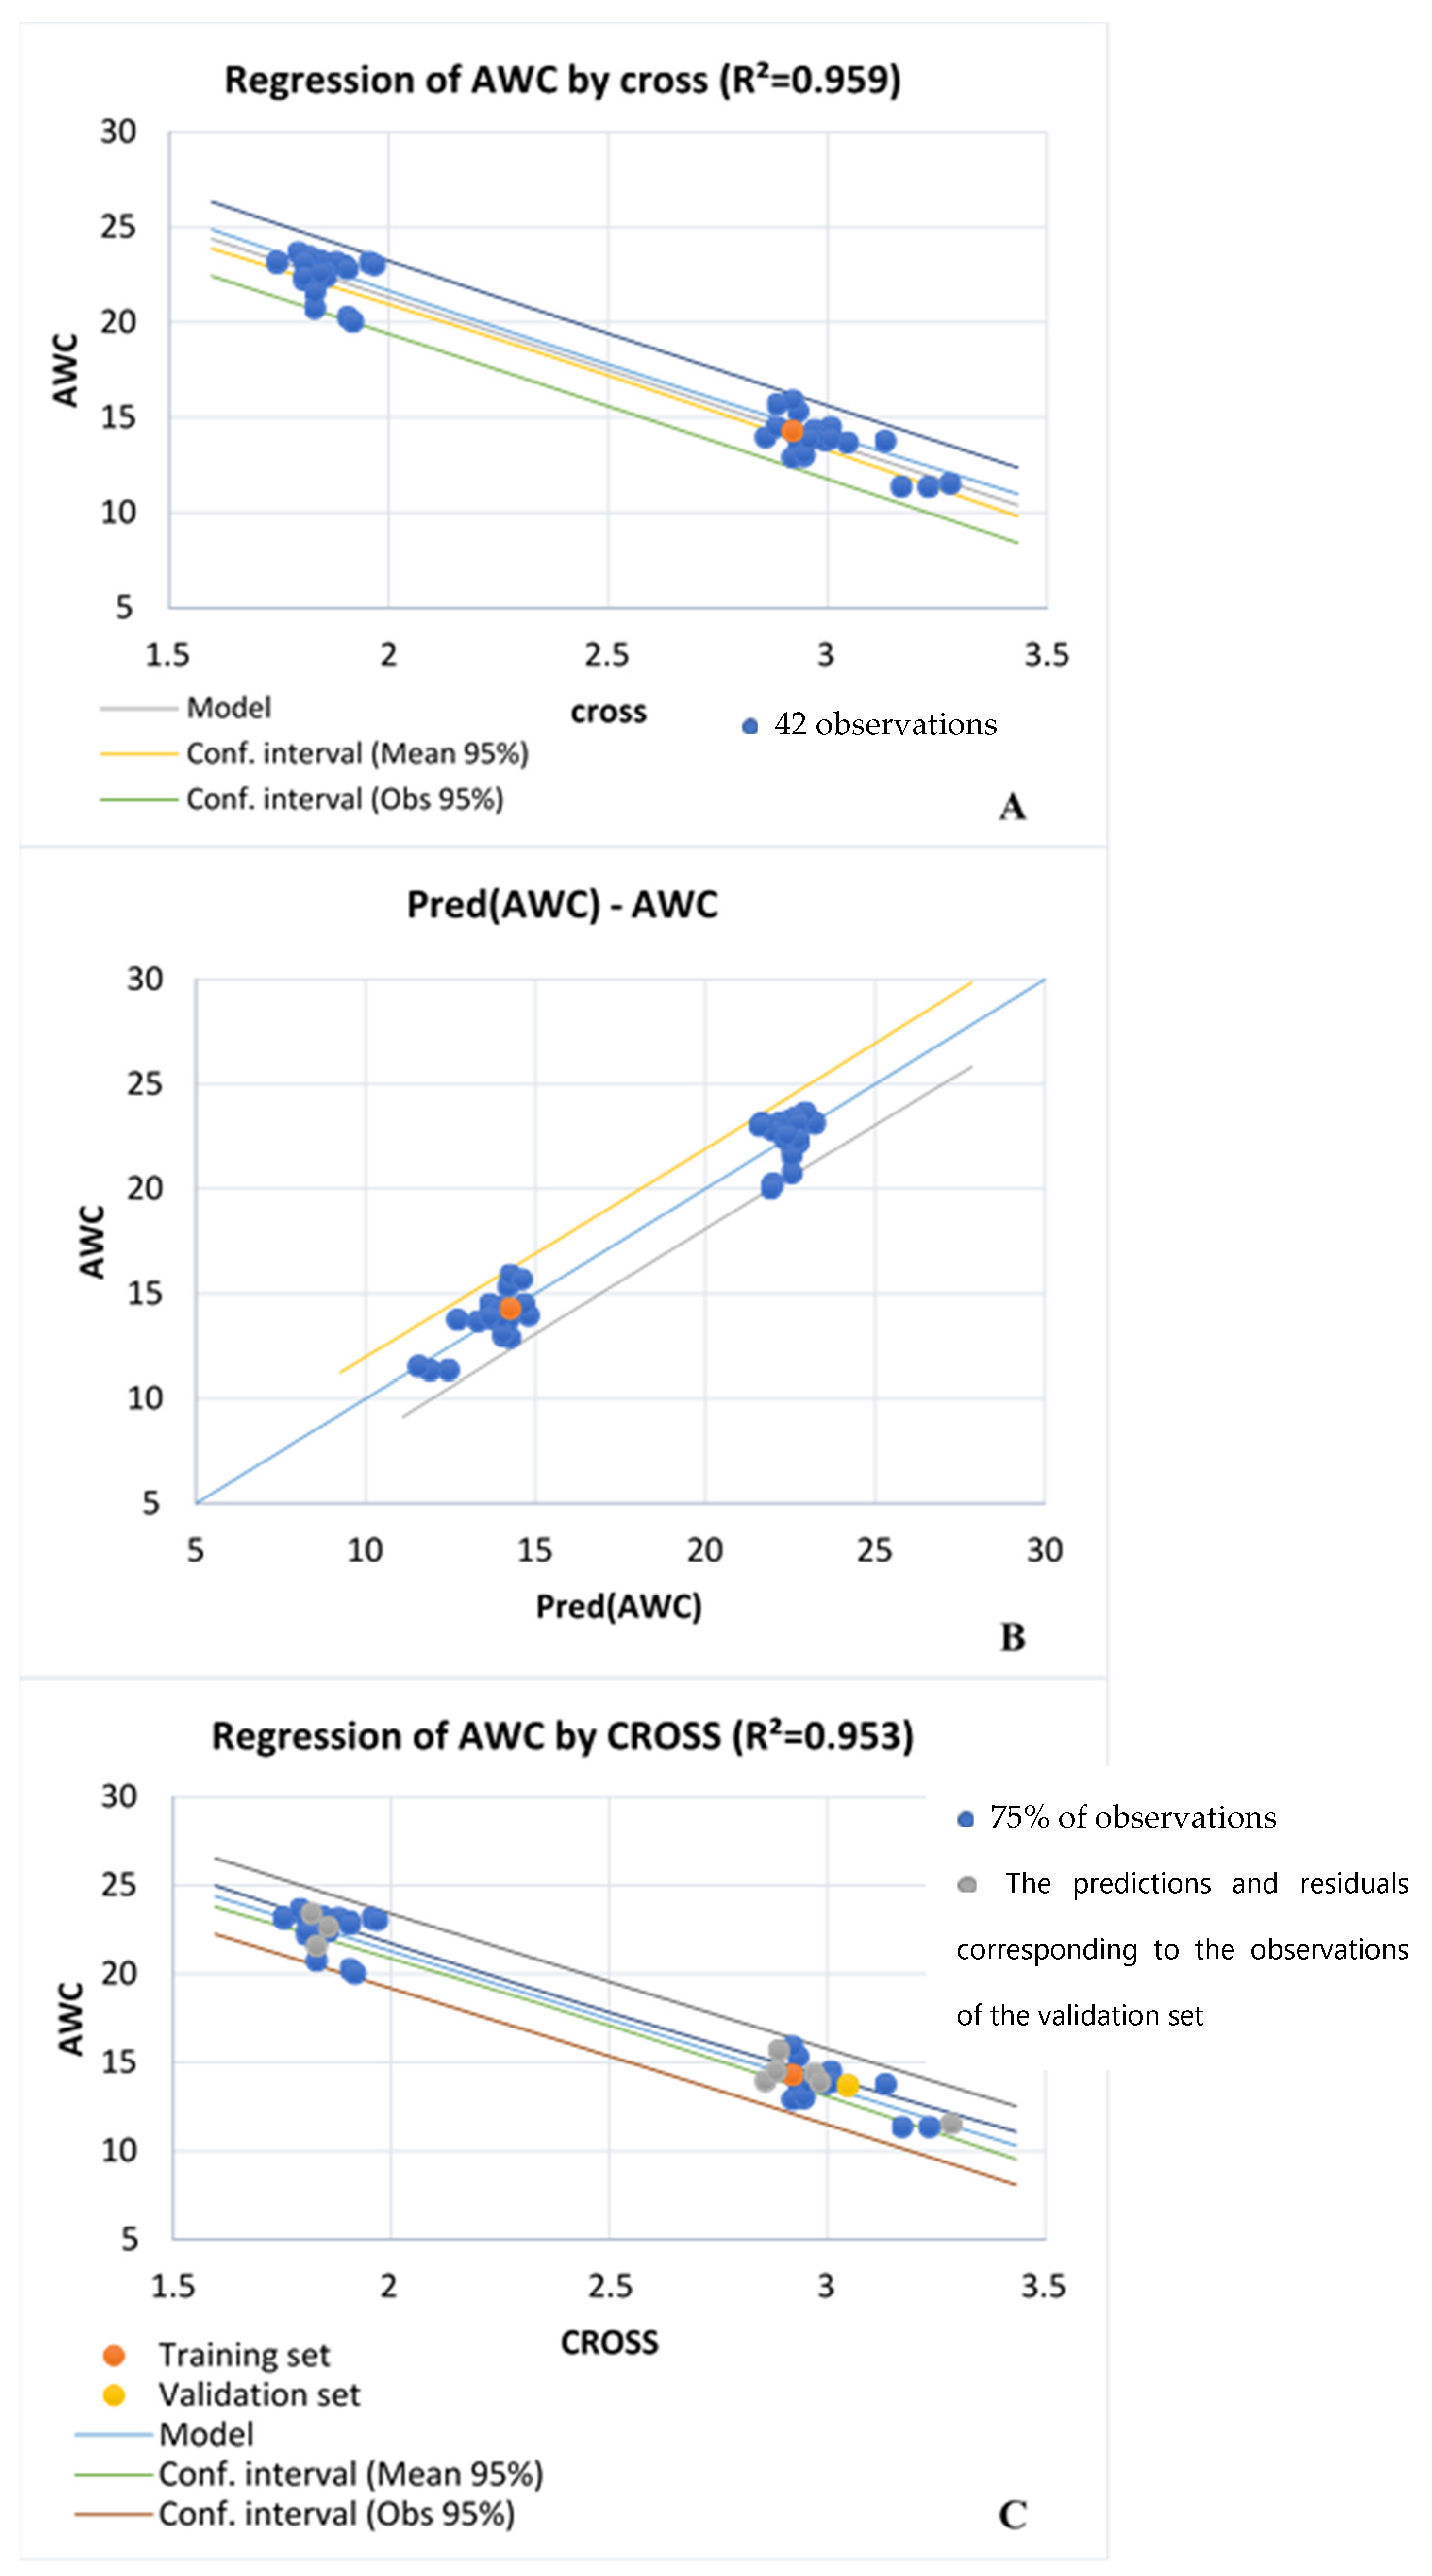
3.5. Effect of Treatments on Available Water Content (AWC)
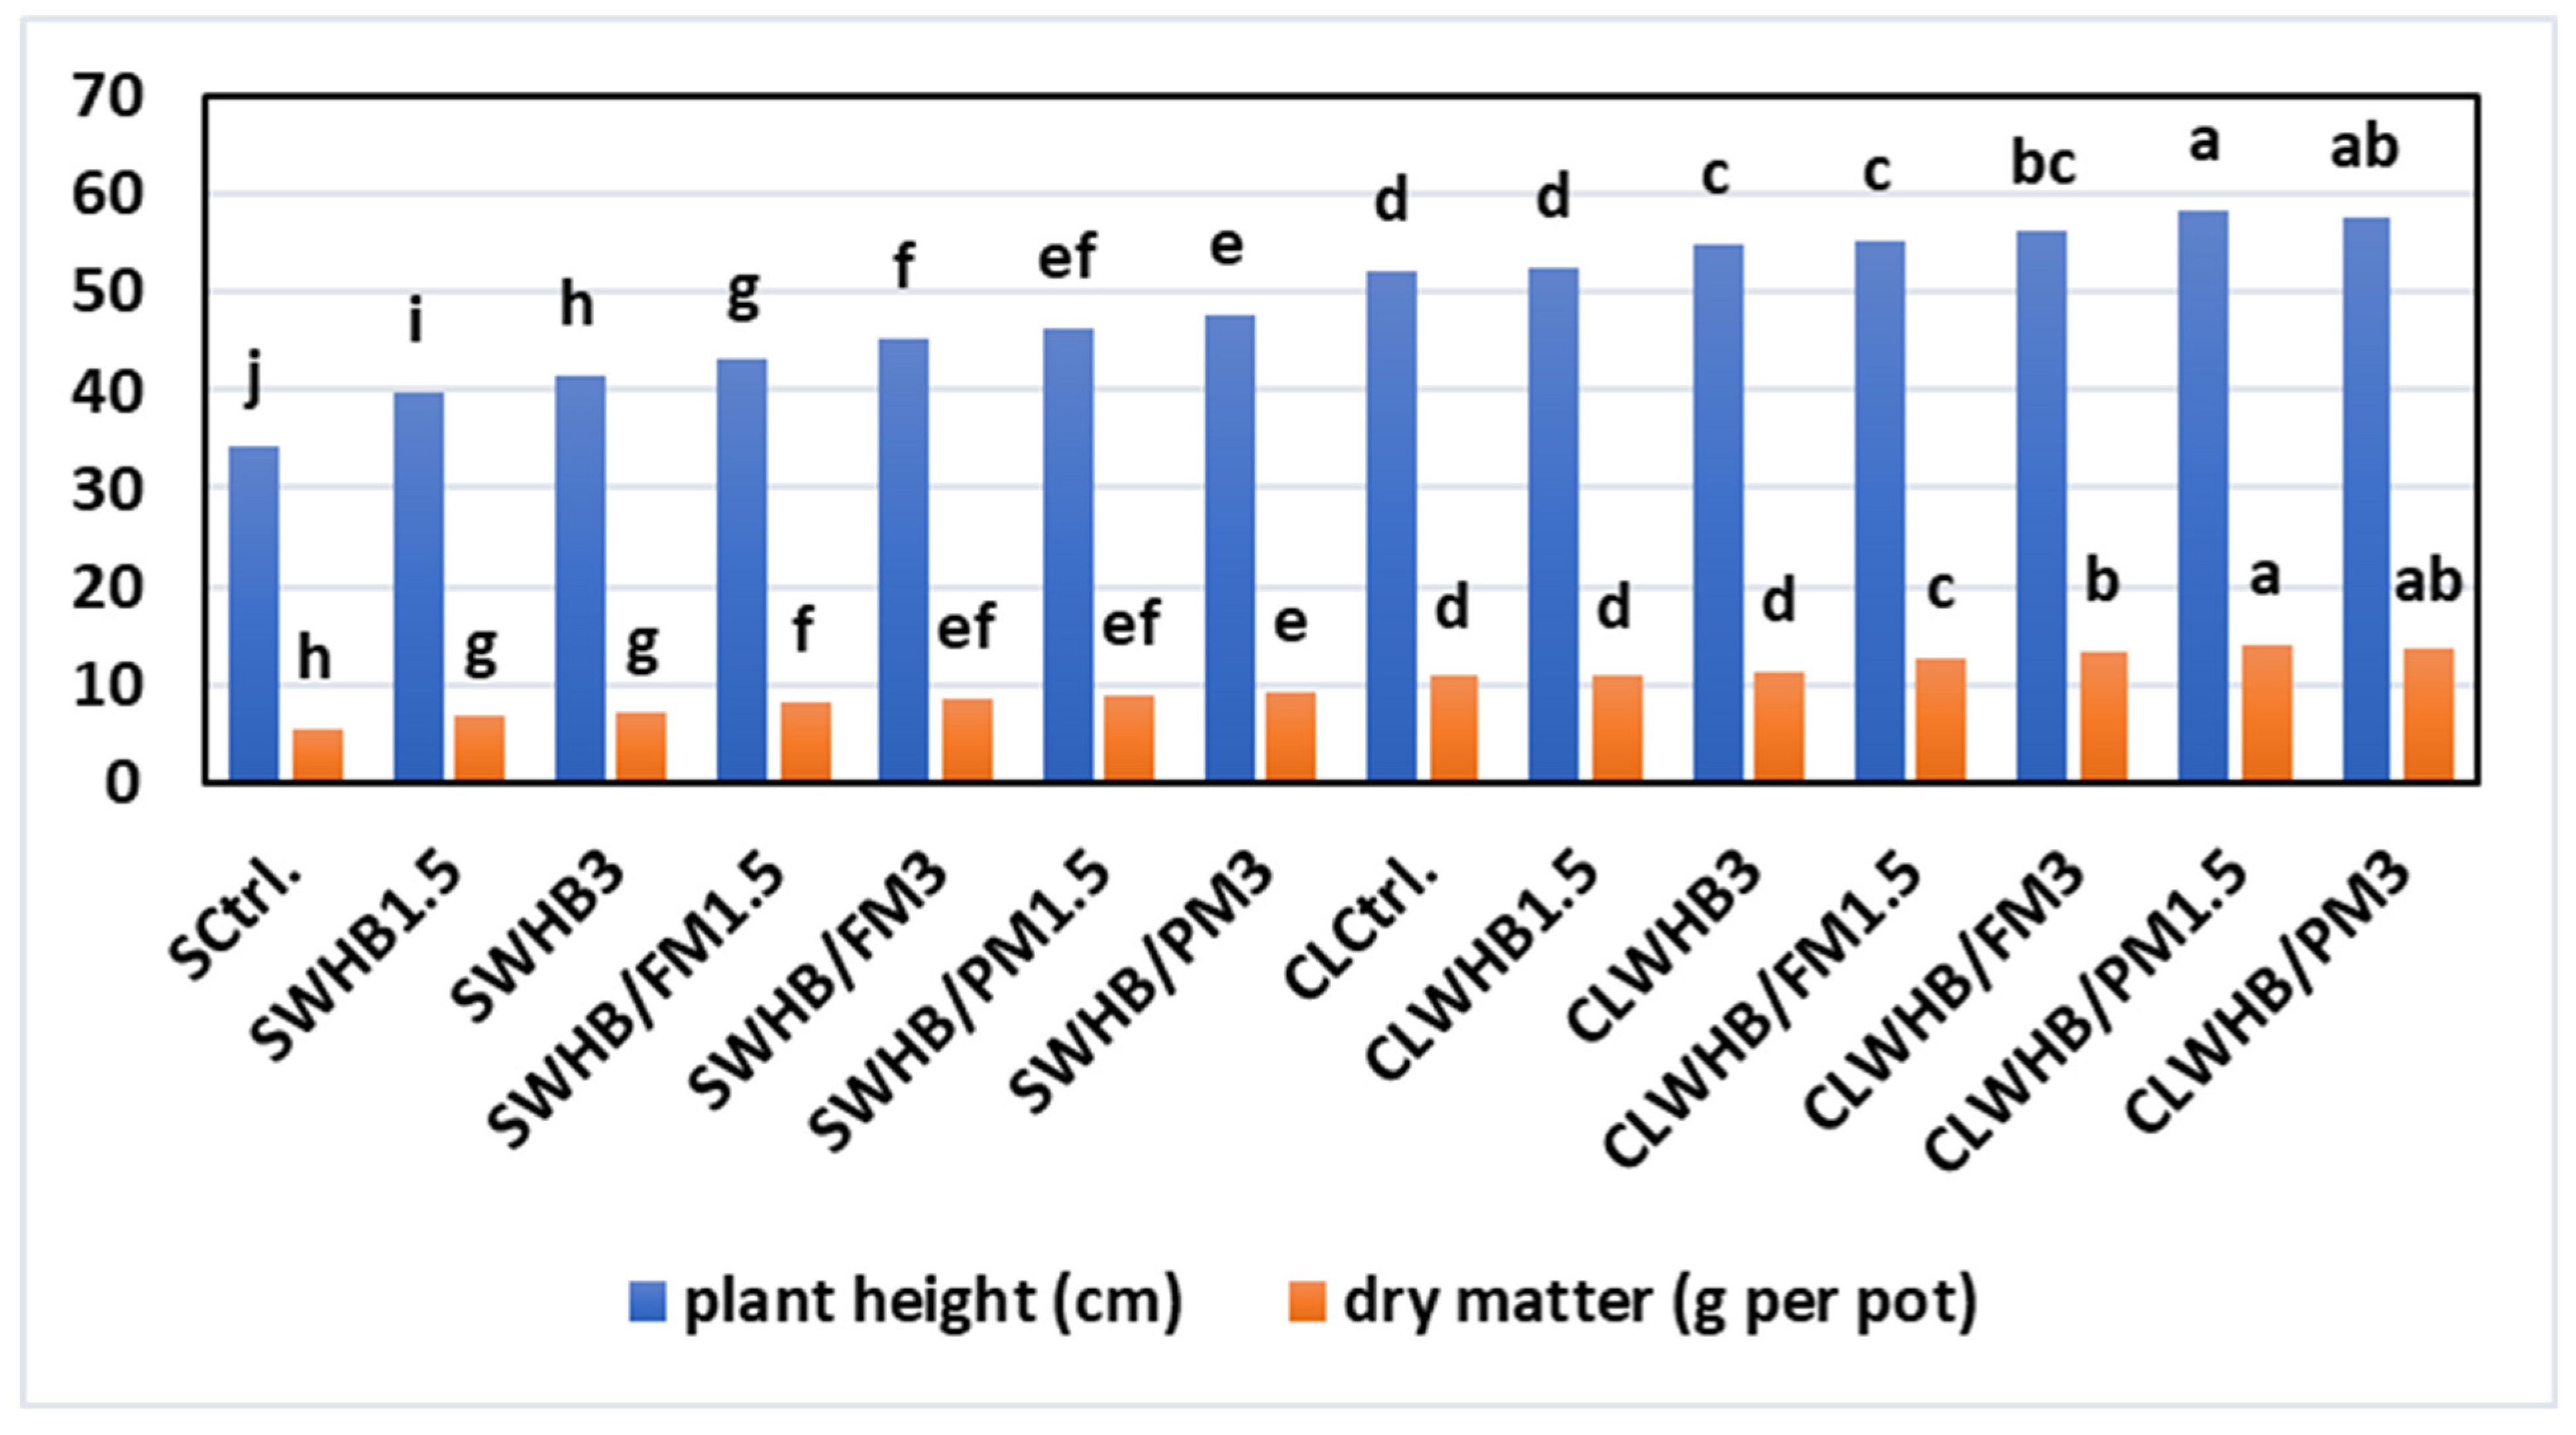
3.6. The Effect on Barley’s Growth Parameters
3.7. Statistical Findings
4. Discussion
5. Conclusions
Author Contributions
Funding
Data Availability Statement
Conflicts of Interest
References
- Muñoz-Rojas, M.; Abd-Elmabod, S.K.; Zavala, L.M.; De la Rosa, D.; Jordán, A. Climate change impacts on soil organic carbon stocks of s agricultural areas: A case study in Northern Egypt. Agric. Ecosyst. Environ. 2017, 238, 142–152. [Google Scholar] [CrossRef]
- Abd-Elmabod, S.K.; Bakr, N.; Munoz-Rojas, M.; Pereira, P.; Zhang, Z.; Cerda, A. Assessment of soil suitability for improvement of soil factors and agricultural management. Sustainability 2019, 11, 1588. [Google Scholar] [CrossRef] [Green Version]
- Abd-Elmabod, S.K.; Muñoz-Rojas, M.; Jordán, A.; Anaya-Romero, M.; Phillips, J.D.; Jones, L.; Zhang, Z.; Pereira, P.; Fleskens, L.; van der Ploeg, M.; et al. Climate change impacts on agricultural suitability and yield reduction in a Mediterranean region. Geoderma 2020, 374, 114453. [Google Scholar] [CrossRef]
- Lychuk, T.E.; Izaurralde, R.C.; Hill, R.L.; McGill, W.B.; Williams, J.R. Biochar as a global change adaptation: Predicting biochar impacts on crop productivity and soil quality for a tropical soil with the Environmental Policy Integrated Climate (EPIC) model. Mitig. Adapt. Strat. Glob. Chang. 2015, 20, 1437–1458. [Google Scholar] [CrossRef]
- Hammam, A.; Mohamed, E. Mapping soil salinity in the East Nile Delta using several methodological approaches of salinity assessment. Egypt. J. Remote Sens. Space Sci. 2020, 23, 125–131. [Google Scholar] [CrossRef]
- Abu-Hashim, M.; Mohamed, E.; Belal, A.-E. Identification of potential soil water retention using hydric numerical model at arid regions by land-use changes. Int. Soil Water Conserv. Res. 2015, 3, 305–315. [Google Scholar] [CrossRef] [Green Version]
- Said, M.E.S.; Ali, A.M.; Borin, M.; Abd-Elmabod, S.K.; Aldosari, A.A.; Khalil, M.M.N.; Abdel-Fattah, M.K. On the Use of Multivariate Analysis and Land Evaluation for Potential Agricultural Development of the Northwestern Coast of Egypt. Agronomy 2020, 10, 1318. [Google Scholar] [CrossRef]
- Abd-Elmabod, S.K.; Fitch, A.C.; Zhang, Z.; Ali, R.R.; Jones, L. Rapid urbanisation threatens fertile agricultural land and soil carbon in the Nile delta. J. Environ. Manag. 2019, 252, 109668. [Google Scholar] [CrossRef]
- Abd-Elmabod, S.K.; Mansour, H.; El-Fattah Hussein, A.A.; Zhang, Z.; Anaya-Romero, M.; de la Rosa, D.; Jordan, A. Influence of irrigation water quantity on the land capability classification. Plant Arch. 2019, 2, 2253–2561. [Google Scholar]
- Abdel-Fattah, M.K.; Abd-Elmabod, S.K.; Aldosari, A.A.; Elrys, A.S.; Mohamed, E.S. Multivariate Analysis for Assessing Irrigation Water Quality: A Case Study of the Bahr Mouise Canal, Eastern Nile Delta. Water 2020, 12, 2537. [Google Scholar] [CrossRef]
- Lehmann, J.; Joseph, S. Biochar for environmental management: An introduction. In Biochar for Environmental Management: Science and Technology; Routledge: Oxfordshire, UK, 2009; pp. 1–12. [Google Scholar]
- Barrow, C.J. Biochar: Potential for countering land degradation and for improving agriculture. Appl. Geogr. 2012, 34, 21–28. [Google Scholar] [CrossRef]
- Roy, R.; Núñez-Delgado, A.; Sultana, S.; Wang, J.; Munir, A.; Battaglia, M.L.; Sarker, T.; Seleiman, M.F.; Barmon, M.; Zhang, R. Additions of optimum water, spent mushroom compost and wood biochar to improve the growth performance of Althaea rosea in drought-prone coal-mined spoils. J. Environ. Manag. 2021, 295, 113076. [Google Scholar] [CrossRef] [PubMed]
- Lehmann, J. Bio-energy in the black. Front. Ecol. Environ. 2007, 5, 381–387. [Google Scholar] [CrossRef] [Green Version]
- Gopinath, K.P.; Vo, D.-V.N.; Prakash, D.G.; Joseph, A.A.; Viswanathan, S.; Arun, J. Environmental applications of carbon-based materials: A review. Environ. Chem. Lett. 2020, 19, 557–582. [Google Scholar] [CrossRef]
- Arun, J.; Gopinath, K.P.; Vigneshwar, S.S.; Swetha, A. Sustainable and eco-friendly approach for phosphorus recovery from wastewater by hydrothermally carbonized microalgae: Study on spent biochar as fertilizer. J. Water Process Eng. 2020, 38, 101567. [Google Scholar] [CrossRef]
- Al-Wabel, M.I.; Hussain, Q.; Usman, A.R.; Ahmad, M.; Abduljabbar, A.; Sallam, A.S.; Ok, Y.S. Impact of biochar properties on soil conditions and agricultural sustainability: A review. Land Degrad. Dev. 2017, 29, 2124–2161. [Google Scholar] [CrossRef]
- Hammam, A.; Mohamed, W. Impacts of Biochar in Different Sizes on Sandy Soil Physical and Biological Properties. J. Soil Sci. Agric. Eng. 2018, 9, 119–126. [Google Scholar] [CrossRef]
- Rehman, M.Z.U.; Waqar, M.; Bashir, S.; Rizwan, M.; Ali, S.; Baroudy, A.A.E.F.E.; Khalid, H.; Ayub, M.A.; Usman, M.; Jahan, S. Effect of biochar and compost on cadmium bioavailability and its uptake by wheat–rice cropping system irrigated with untreated sewage water: A field study. Arab. J. Geosci. 2021, 14, 135. [Google Scholar] [CrossRef]
- Masiello, C.; Dugan, B.; Brewer, E.C.; Spokas, K. Biochar effects on soil hydrology. In Biochar for Environmental Management, 2nd ed.; Lehmann, J., Joseph, S., Eds.; Earthscan: Oxfordshire, UK, 2015; pp. 541–560. [Google Scholar]
- Méndez, A.; Gómez, A.; Paz-Ferreiro, J.; Gascó, G. Effects of sewage sludge biochar on plant metal availability after application to a Mediterranean soil. Chemosphere 2012, 89, 1354–1359. [Google Scholar] [CrossRef]
- Lehmann, J.; Joseph, S. Biochar for Environmental Management: Science, Technology and Implementation; Routledge: Oxfordshire, UK, 2015. [Google Scholar]
- Hale, S.E.; Nurida, N.L.; Jubaedah; Mulder, J.; Sørmo, E.; Silvani, L.; Abiven, S.; Joseph, S.; Taherymoosavi, S.; Cornelissen, G. The effect of biochar, lime and ash on maize yield in a long-term field trial in a Ultisol in the humid tropics. Sci. Total Environ. 2020, 719, 137455. [Google Scholar] [CrossRef]
- Alkharabsheh, H.M.; Seleiman, M.F.; Battaglia, M.L.; Shami, A.; Jalal, R.S.; Alhammad, B.A.; Almutairi, K.F.; Al–Saif, A.M. Biochar and Its Broad Impacts in Soil Quality and Fertility, Nutrient Leaching and Crop Productivity: A Review. Agronomy 2021, 11, 993. [Google Scholar] [CrossRef]
- El-Azeim, M.M.A.; Salah, Z.M.; Hammam, A.A. Assessment of Water Hyacinth Biochar as a Soil Amendment for Sandy Soils. J. Soil Sci. Agric. Eng. 2021, 12, 431–444. [Google Scholar] [CrossRef]
- Akhil, D.; Lakshmi, D.; Kartik, A.; Vo, D.-V.N.; Arun, J.; Gopinath, K.P. Production, characterization, activation and environmental applications of engineered biochar: A review. Environ. Chem. Lett. 2021, 19, 2261–2297. [Google Scholar] [CrossRef]
- Anal, M. Organic materials and soil productivity in the Near East. FAO Soil Bull. 1992, 45, 279. [Google Scholar]
- Hati, K.M.; Swarup, A.; Dwivedi, A.; Misra, A.; Bandyopadhyay, K. Changes in soil physical properties and organic carbon status at the topsoil horizon of a vertisol of central India after 28 years of continuous cropping, fertilization and manuring. Agric. Ecosyst. Environ. 2007, 119, 127–134. [Google Scholar] [CrossRef]
- Mohamed, W.S.; Hammam, A.A. Poultry manure-derived biochar as a soil amendment and fertilizer for sandy soils under arid conditions. Egypt. J. Soil Sci. 2019, 59, 1–14. [Google Scholar] [CrossRef]
- Six, J.; Elliott, E.; Paustian, K. Soil macroaggregate turnover and microaggregate formation: A mechanism for C sequestration under no-tillage agriculture. Soil Biol. Biochem. 2000, 32, 2099–2103. [Google Scholar] [CrossRef]
- Whalen, J.K.; Chang, C. Macroaggregate Characteristics in Cultivated Soils after 25 Annual Manure Applications. Soil Sci. Soc. Am. J. 2002, 66, 1637–1647. [Google Scholar] [CrossRef] [Green Version]
- Mekail, M. Integrated supply system of nitrogen for wheat grown in the newly reclaimed sandy soils of West El-Minia: Efficiency and economics of the system. Minia J. Agric. Res. Dev. 2006, 26, 101–103. [Google Scholar]
- Kukreti, A.; Kurmanchali, N.; Rawat, L. Organic Farming and Biochar; Agrobios Research: Jodhpur, India, 2021; pp. 141–153. [Google Scholar]
- Obeng, A.; Byalebeka, J.; Murongo, M.; Ssekandi, J.; Noel, G.L. Effect of co-applied corncob biochar with farmyard manure and NPK fertilizer on tropical soil. Resour. Environ. Sustain. 2021, 5, 100034. [Google Scholar]
- Aruna Olasekan, A.; Agbede, T.M.; Aboyeji, C.M.; Dunsin, O.; Simeon, V.T. Effects of biochar and poultry manure on soil characteristics and the yield of radish. Sci. Hortic. 2019, 243, 457–463. [Google Scholar]
- Agbede, T.M.; Odoja, A.S.; Bayode, L.N.; Omotehinse, P.O.; Adepehin, I. Effects of biochar and poultry manure on soil properties, growth, yield and quality of cocoyam (Xanthosoma sagittifolium Schott) grown in sandy soil. Commun. Soil Sci. Plant Anal. 2020, 51, 932–994. [Google Scholar] [CrossRef]
- Liu, J.; Schulz, H.; Brandl, S.; Miehtke, H.; Huwe, B.; Glaser, B. Short-term effect of biochar and compost on soil fertility and water status of a Dystric Cambisol in NE Germany under field conditions. J. Plant Nutr. Soil Sci. 2012, 175, 698–707. [Google Scholar] [CrossRef]
- Agegnehu, G.; Bird, M.; Nelson, P.; Bass, A. The ameliorating effects of biochar and compost on soil quality and plant growth on a Ferralsol. Soil Res. 2015, 53, 1–12. [Google Scholar] [CrossRef]
- Wang, Y.; Villamil, M.B.; Davidson, P.C.; Akdeniz, N. A quantitative understanding of the role of co-composted biochar in plant growth using meta-analysis. Sci. Total Environ. 2019, 685, 741–752. [Google Scholar] [CrossRef] [PubMed]
- Antonangelo, J.A.; Sun, X.; Zhang, H. The roles of co-composted biochar (COMBI) in improving soil quality, crop productivity, and toxic metal amelioration. J. Environ. Manag. 2021, 277, 111443. [Google Scholar]
- Jatav, H.S.; Rajput, V.D.; Minkina, T.; Singh, S.K.; Chejara, S.; Gorovtsov, A.; Barakhov, A.; Bauer, T.; Sushkova, S.; Mandzhieva, S.; et al. Sustainable Approach and Safe Use of Biochar and Its Possible Consequences. Sustainability 2021, 13, 10362. [Google Scholar] [CrossRef]
- Sharma, A.; Aggarwal, N.K. Water Hyacinth: A Potential Lignocellulosic Biomass for Bioethanol; Springer: Cham, Switzerland, 2020. [Google Scholar]
- Batanouny, K.; El-Fiky, A. The water hyacinth (Eichhornia crassipes solms) in the Nile system, Egypt. Aquat. Bot. 1975, 1, 243–252. [Google Scholar] [CrossRef]
- Masto, R.E.; Kumar, S.; Rout, T.; Sarkar, P.; George, J.; Ram, L. Biochar from water hyacinth (Eichornia crassipes) and its impact on soil biological activity. Catena 2013, 111, 64–71. [Google Scholar] [CrossRef]
- Yargicoglu, E. Characterization and Surface Analysis of Commercially Available Biochars for Geoenvironmental Applications; Geotechnical Special Publication: London, UK, 2015; pp. 2637–2646. [Google Scholar]
- Scheldrick, B. Particle size distribution. In Soil Sampling and Methods of Analysis; Routledge: Oxfordshire, UK, 1993; pp. 499–512. [Google Scholar]
- Piccolo, A. Humus and soil conservation. In Humic Substances in Terrestrial Ecosystems; Elsevier: Amsterdam, The Netherlands, 1996; pp. 225–264. [Google Scholar]
- Bremner, J.; Keeney, D. Steam distillation methods for determination of ammonium, nitrate and nitrite. Anal. Chim. Acta 1965, 32, 485–495. [Google Scholar] [CrossRef]
- Page, A.L.; Keeney, D. Methods of Soil Analysis; American Society of Agronomy: Madison, WI, USA, 1982. [Google Scholar]
- Avery, B.W.; Bascomb, C.L. Soil Survey Laboratory Methods; Rothamsted Experimental Station: Harpenden, UK, 1974. [Google Scholar]
- Black, C.A. Methods of soil analysis: Physical and mineralogical properties, including statistics of measurement and sampling. Part 2. Chemical and microbiological properties. Agronomy 1965, 9, 1387–1388. [Google Scholar]
- Poorter, H.; Fiorani, F.; Stitt, M.; Schurr, U.; Finck, A.; Gibon, Y.; Usadel, B.; Munns, R.; Atkin, O.; Tardieu, F.; et al. The art of growing plants for experimental purposes: A practical guide for the plant biologist. Funct. Plant Biol. 2012, 39, 821–838. [Google Scholar] [CrossRef] [Green Version]
- Dane, J.; Hopmans, J. Water retention and storage Part. 4. In Methods of Soil Analysis; Soil Science Society of America: Madison, WI, USA, 2002; pp. 671–717. [Google Scholar]
- International Society of Soil Science; West-European Working Group on Soil Structure; de Boodt; Marcel Florent Louis Philippe. West European Methods for Soil Structure Determination: Index; State Faculty of Agricultural Sciences: Corvallis, OR, USA, 1967. [Google Scholar]
- Kemper, W.D.; Rosenau, R.C. Aggregate stability and size distribution. In Methods of Soil Analysis; American Society of Agronomy: Madison, WI, USA, 1986; pp. 425–442. [Google Scholar]
- Gee, G.W.; Bauder, J.W. Particle size analysis klute a methods of soil analysis. Part 1: Physical and mineralogical methods. In Methods of Soil Analysis; Physical and Mineralogical Methods; American Society of Agronomy: Madison, WI, USA, 1986; Volume 9, pp. 825–844. [Google Scholar]
- Rengasamy, P.; Marchuk, A. Cation ratio of soil structural stability (CROSS). Soil Res. 2011, 49, 280–285. [Google Scholar] [CrossRef]
- Chen, B.; Zhou, D.; Zhu, L. Transitional adsorption and partition of nonpolar and polar aromatic contaminants by biochars of pine needles with different pyrolytic temperatures. Environ. Sci. Technol. 2008, 42, 5137–5143. [Google Scholar] [CrossRef]
- Tomczyk, A.; Sokołowska, Z.; Boguta, P. Biochar physicochemical properties: Pyrolysis temperature and feedstock kind effects. Rev. Environ. Sci. Bio/Technol. 2020, 19, 191–215. [Google Scholar] [CrossRef] [Green Version]
- Huang, H.; Reddy, N.G.; Huang, X.; Chen, P.; Wang, P.; Zhang, Y.; Huang, Y.; Lin, P.; Garg, A. Effects of pyrolysis temperature, feedstock type and compaction on water retention of biochar amended soil. Sci. Rep. 2021, 11, 7419. [Google Scholar] [CrossRef]
- Nelson, P.N.; Su, N. Soil pH buffering capacity: A descriptive function and its application to some acidic tropical soils. Soil Res. 2010, 48, 201–207. [Google Scholar] [CrossRef]
- Adekiya, A.O.; Agbede, T.M.; Ejue, W.S.; Aboyeji, C.M.; Dunsin, O.; Aremu, C.O.; Owolabi, A.O.; Ajiboye, B.O.; Okunlola, O.F.; Adesola, O.O. Biochar, poultry manure and NPK fertilizer: Sole and combine application effects on soil properties and ginger (Zingiber officinale Roscoe) performance in a tropical Alfisol. Open Agric. 2020, 5, 30–39. [Google Scholar] [CrossRef] [Green Version]
- Lal, R. Soil Erosion by Wind and Water: Problems and Prospects. In Soil Erosion Research Methods; Routledge: Oxfordshire, UK, 2017; pp. 1–10. [Google Scholar]
- Olakayode, A.O.; Akinde, B.P.; Egbebi, I.A. Effect of biochar application on selected soil properties in Southwestern Nigeria. J. Soil Sci. Environ. Manag. 2020, 11, 108–112. [Google Scholar] [CrossRef]
- Usman, A.R.; Abduljabbar, A.; Vithanage, M.; Ok, Y.S.; Ahmad, M.; Ahmad, M.; Elfaki, J.; Abdulazeem, S.S.; Al-Wabel, M.I. Biochar production from date palm waste: Charring temperature induced changes in composition and surface chemistry. J. Anal. Appl. Pyrolysis 2015, 115, 392–400. [Google Scholar] [CrossRef]
- Ibrahim, A.; Marie, H.A.M.; Elfaki, J. Impact of biochar and compost on aggregate stability in loamy sand soil. Agric. Res. J. 2021, 58, 34–44. [Google Scholar] [CrossRef]
- Burrell, L.D.; Zehetner, F.; Rampazzo, N.; Wimmer, B.; Soja, G. Long-term effects of biochar on soil physical properties. Geoderma 2016, 282, 96–102. [Google Scholar] [CrossRef]
- Chan, K.Y.; Van Zwieten, L.; Meszaros, I.; Downie, A.; Joseph, S. Agronomic values of greenwaste biochar as a soil amendment. Soil Res. 2007, 45, 629–634. [Google Scholar] [CrossRef]
- Kalus, K.; Koziel, J.A.; Opaliński, S. A Review of Biochar Properties and Their Utilization in Crop Agriculture and Livestock Production. Appl. Sci. 2019, 9, 3494. [Google Scholar] [CrossRef] [Green Version]
- Hossain, M.F.; Piash, M.; Parveen, Z. Effect of biochar and fertilizer application on the growth and nutrient accumulation of rice and vegetable in two contrast soils. Acta Sci. Agric. 2019, 3, 74–83. [Google Scholar]
- Agbede, T.M. Effect of tillage, biochar, poultry manure and NPK 15-15-15 fertilizer, and their mixture on soil properties, growth and carrot (Daucus carota L.) yield under tropical conditions. Heliyon 2021, 7, e07391. [Google Scholar] [CrossRef]
- Zhang, Z.; Dong, X.; Wang, S.; Pu, X. Benefits of organic manure combined with biochar amendments to cotton root growth and yield under continuous cropping systems in Xinjiang, China. Sci. Rep. 2020, 10, 4718. [Google Scholar] [CrossRef] [Green Version]
- Liu, L.; Li, J.; Wu, G.; Shen, H.; Fu, G.; Wang, Y. Combined effects of biochar and chicken manure on maize (Zea mays L.) growth, lead uptake and soil enzyme activities under lead stress. PeerJ 2021, 9, e11754. [Google Scholar] [CrossRef]
- Mohamed, E.S.; Baroudy, A.A.; El-beshbeshy, T.; Emam, M.; Belal, A.A.; Elfadaly, A.; Aldosari, A.A.; Ali, A.M.; Lasaponara, R. Vis-nir spectroscopy and satellite landsat-8 oli data to map soil nutrients in arid conditions: A case study of the northwest coast of Egypt. Remote Sens. 2020, 12, 3716. [Google Scholar] [CrossRef]
- El Nahry, A.H.; Mohamed, E.S. Potentiality of land and water resources in African Sahara: A case study of south Egypt. Environ. Earth Sci. 2011, 63, 1263–1275. [Google Scholar] [CrossRef]
- Hendawy, E.; Belal, A.A.; Mohamed, E.S.; Elfadaly, A.; Murgante, B.; Aldosari, A.A.; Lasaponara, R. The prediction and assessment of the impacts of soil sealing on agricultural land in the North Nile Delta (Egypt) using satellite data and GIS modeling. Sustainability 2019, 11, 4662. [Google Scholar] [CrossRef]


| Characteristic | Soil-1 | Soil-2 | Biochar (300 °C) | Farmyard Manure | Poultry Manure |
|---|---|---|---|---|---|
| Coarse sand (%) | 48.3 | 21.2 | --- | --- | --- |
| Fine sand (%) | 38.7 | 9.8 | --- | --- | --- |
| Silt (%) | 3.9 | 28.8 | --- | --- | --- |
| Clay (%) | 9.1 | 39.2 | --- | --- | --- |
| Texture class | Sand | Clay loam | --- | --- | --- |
| pH (water) * | 8.3 | 8.15 | 6.31 | 7.91 | 6.76 |
| ECw (dSm−1) * | 1.98 | 1.43 | 3.58 | 3.2 | 5.81 |
| CEC (cmol (+) kg−1) * | 6.8 | 47.56 | 45.27 | 35.62 | 39.17 |
| OC% * | 0.19 | 0.91 | 27.58 | 25.83 | 31.19 |
| CaCO3% | 2.8 | 1.96 | --- | --- | --- |
| Dp Mg m−3 * | 2.62 | 2.55 | --- | --- | --- |
| Dd Mg m−3 * | 1.57 | 1.26 | --- | --- | --- |
| Total N% * | --- | --- | 1.03 | 1.05 | 2.95 |
| Total P% * | --- | --- | 0.37 | 0.41 | 1.62 |
| Total K% * | --- | --- | 0.68 | 0.98 | 2.21 |
| Total Ca% * | --- | --- | 0.95 | 2.01 | 2.63 |
| Total Mg% * | --- | --- | 0.38 | 0.38 | 0.51 |
| Total Na% * | --- | --- | 0.07 | 0.62 | 0.69 |
| No. | Soil | WHB * (%) | WHB/FM * (%) | WHB/PM * (%) | Abbreviation |
|---|---|---|---|---|---|
| 1 | Sand | 0 | 0 | 0 | SCtrl. |
| 2 | Sand | 1.5 | 0 | 0 | SWHB1.5 |
| 3 | Sand | 3 | 0 | 0 | SWHB3 |
| 4 | Sand | 0 | 1.5 | 0 | SWHB/FM1.5 |
| 5 | Sand | 0 | 3 | 0 | SWHB/FM3 |
| 6 | Sand | 0 | 0 | 1.5 | SWHB/PM1.5 |
| 7 | Sand | 0 | 0 | 3 | SWHB/PM3 |
| 8 | Clay loam | 0 | 0 | 0 | CLCtrl. |
| 9 | Clay loam | 1.5 | 0 | 0 | CLWHB1.5 |
| 10 | Clay loam | 3 | 0 | 0 | CLWHB3 |
| 11 | Clay loam | 0 | 1.5 | 0 | CLWHB/FM1.5 |
| 12 | Clay loam | 0 | 3 | 0 | CLWHB/FM3 |
| 13 | Clay loam | 0 | 0 | 1.5 | CLWHB/PM1.5 |
| 14 | Clay loam | 0 | 0 | 3 | CLWHB/PM3 |
| Treatments | pH | Soluble Cations (mol m−3) | CROSS (mol m−3)0.5 | DR% | WSA% | |||
|---|---|---|---|---|---|---|---|---|
| Na+ | K+ | Ca++ | Mg++ | |||||
| SCtrl | 8.25 a ± 0.04 | 10.00 c ± 0.22 | 6.03 b ± 0.40 | 29.00 e ± 0.38 | 9.00 e ± 0.63 | 3.23 a ± 0.06 | 92.0 a ± 1.73 | 4.15 e ± 0.19 |
| SWHB1.5 | 8.20 bc ± 0.02 | 10.13 c ± 0.18 | 6.42 b ± 0.27 | 35.21 d ± 0.55 | 12.62 d ± 0.45 | 2.97 c ± 0.05 | 85.9 b ± 1.63 | 6.74 c ± 0.13 |
| SWHB3 | 8.18 bcd ± 0.02 | 10.26 bc ± 0.17 | 7.68 a ± 0.17 | 41.55 b ± 0.91 | 13.94 c ± 0.45 | 2.91 c ± 0.02 | 86.7 b ± 2.08 | 7.32 b ± 0.15 |
| SWHB/FM1.5 | 8.21 b ± 0.02 | 10.11 c ± 0.16 | 7.32 a ± 0.14 | 39.58 c ± 0.47 | 11.79 d ± 0.51 | 2.94 c ± 0.02 | 80.0 c ± 1.76 | 6.26 d ± 0.21 |
| SWHB/FM3 | 8.14 d ± 0.01 | 10.52 b ± 0.14 | 7.45 a ± 0.29 | 40.55 bc ± 0.59 | 14.28 bc ± 0.37 | 2.96 c ± 0.04 | 74.3 d ± 3.51 | 7.55 ab ± 0.19 |
| SWHB/PM1.5 | 8.19 bcd ± 0.02 | 10.94 a ± 0.13 | 7.68 a ± 0.47 | 40.58 bc ± 0.40 | 14.94 b ± 0.65 | 3.06 b ± 0.06 | 77.0 cd ± 3.00 | 6.41 d ± 0.11 |
| SWHB/PM3 | 8.16 cd ± 0.03 | 10.49 b ± 0.19 | 7.84 a ± 0.31 | 42.89 a ± 0.90 | 16.00 a ± 0.30 | 2.90 c ± 0.06 | 73.7 d ± 1.66 | 7.67 a ± 0.13 |
| CLCtrl | 8.13 a ± 0.03 | 8.53 c ± 0.09 | 4.55 e ± 0.37 | 48.00 e ± 0.58 | 35.00 f ± 0.71 | 1.89 ab ± 0.05 | 44.8 a ± 1.76 | 36.42 e ± 0.11 |
| CLWHB1.5 | 8.11 a ± 0.02 | 8.79 abc ± 0.07 | 4.93 de ± 0.46 | 55.85 d ± 0.66 | 38.87 d ± 0.70 | 1.84 b ± 0.06 | 34.3 b ± 1.29 | 40.07 cd ± 0.17 |
| CLWHB3 | 8.10 a ± 0.04 | 9.03 ab ± 0.16 | 5.13 cde ± 0.28 | 65.47 b ± 0.72 | 36.55 e ± 0.67 | 1.80 b ± 0.05 | 32.1 bc ± 1.47 | 42.27 a ± 0.28 |
| CLWHB/FM1.5 | 8.11 a ± 0.02 | 9.18 a ± 0.22 | 5.50 bcd ± 0.39 | 63.58 c ± 0.70 | 40.21 c ± 0.55 | 1.85 ab ± 0.05 | 34.1 bc ± 1.30 | 39.34 d ± 0.16 |
| CLWHB/FM3 | 8.09 a ± 0.03 | 8.98 ab ± 0.36 | 5.77 bc ± 0.27 | 64.02 c ± 1.00 | 41.1 c ± 0.39 | 1.83 b ± 0.03 | 32.2 bc ± 1.69 | 39.21 d ± 0.21 |
| CLWHB/PM1.5 | 8.12 a ± 0.02 | 9.01 ab ± 0.30 | 5.91 b ± 0.28 | 55.24 d ± 0.68 | 42.55 b ± 0.55 | 1.94 a ± 0.05 | 31.43 c ± 1.61 | 40.57 bc ± 0.45 |
| CLWHB/PM3 | 8.11 a ± 0.02 | 8.63 bc ± 0.17 | 6.93 a ± 0.51 | 67.50 a ± 0.54 | 44.89 a ± 0.68 | 1.82 b ± 0.06 | 27.97 d ± 1.08 | 41.29 ab ± 0.57 |
| Treatments | Moisture Retention Contents (MRC) (%) | AWC * (%) | ||
|---|---|---|---|---|
| −0.01 (Mpa) | −0.03 (Mpa) | −1.5 (Mpa) | ||
| SCtrl. | 26.4 f ± 0.44 | 17.1 e ± 0.25 | 5.7 d ± 0.20 | 11.4 e ± 0.10 |
| SWHB1.5 | 30.9 d ± 0.76 | 21.1 b ± 0.25 | 6.9 b ± 0.13 | 14.2 b ± 0.30 |
| SWHB3 | 35.6 a ± 0.53 | 22.9 a ± 0.19 | 7.3 a ± 0.14 | 15.6 a ± 0.29 |
| SWHB/FM1.5 | 29.3 e ± 0.29 | 19.3 d ± 0.18 | 6.3 c ± 0.21 | 13.0 d ± 0.10 |
| SWHB/FM3 | 33.2 c ± 0.36 | 20.5 c ± 0.24 | 6.7 b ± 0.18 | 13.8 c ± 0.08 |
| SWHB/PM1.5 | 30.1 d ± 0.25 | 20.1 c ± 0.26 | 6.3 c ± 0.24 | 13.8 c ± 0.11 |
| SWHB/PM3 | 34.2 b ± 0.27 | 21.1 b ± 0.17 | 6.8 b ± 0.15 | 14.3 b ± 0.28 |
| CLCtrl. | 35.2 e ± 0.12 | 28.5 d ± 0.20 | 8.2 c ± 0.20 | 20.3 d ± 0.36 |
| CLWHB1.5 | 41.1 c ± 0.23 | 33.1 a ± 0.19 | 9.7 ab ± 0.20 | 23.3 a ± 0.35 |
| CLWHB3 | 43.3 a ± 0.30 | 33.2 a ± 0.20 | 10.1 a ± 0.19 | 23.2 a ± 0.07 |
| CLWHB/FM1.5 | 39.9 d ± 0.18 | 31.8 c ± 0.26 | 9.5 b ± 0.22 | 22.3 bc ± 0.47 |
| CLWHB/FM3 | 41.6 b ± 0.17 | 31.6 c ± 0.27 | 9.6 b ± 0.22 | 22.1 c ± 0.43 |
| CLWHB/PM1.5 | 40.1 d ± 0.28 | 32.6 b ± 0.35 | 9.5 b ± 0.27 | 23.1 a ± 0.08 |
| CLWHB/PM3 | 41.9 b ± 0.30 | 32.8 ab ± 0.21 | 10.0 a ± 0.12 | 22.8 ab ± 0.32 |
| Plant Height (cm) | Dry Matter per Pot (g) | |
|---|---|---|
| Soil texture effect | ||
| Sand soil | 42.59 b | 7.76 b |
| Clay loam soil | 55.29 a | 12.35 a |
| Amendment type effect | ||
| Ctrl | 43.23 d | 8.16 d |
| WHB | 47.20 c | 8.99 c |
| WHB/FM | 49.99 b | 10.71 b |
| WHB/PM | 52.49 a | 11.40 a |
| Application rate effect | ||
| 0 | 43.23 c | 8.16 b |
| 1.5% | 49.27 b | 10.25 a |
| 3% | 50.52 a | 10.48 a |
| Variables | pH | Na | K | Ca | Mg | CROSS | DR | WSA | MRC0.01 | MRC0.03 | MRC1.5 | AWC |
|---|---|---|---|---|---|---|---|---|---|---|---|---|
| pH | 1.00 | |||||||||||
| Na | 0.66 | 1.00 | ||||||||||
| K | 0.46 | 0.78 | 1.00 | |||||||||
| Ca | −0.84 | −0.74 | −0.44 | 1.00 | ||||||||
| Mg | −0.83 | −0.88 | −0.62 | 0.93 | 1.00 | |||||||
| CROSS | 0.84 | 0.92 | 0.71 | −0.92 | −0.98 | 1.00 | ||||||
| DR | 0.86 | 0.85 | 0.62 | −0.94 | −0.99 | 0.98 | 1.00 | |||||
| WSA | −0.82 | −0.91 | −0.71 | 0.91 | 0.99 | −0.99 | −0.98 | 1.00 | ||||
| MRC0.01 | −0.86 | −0.73 | −0.45 | 0.95 | 0.90 | −0.90 | −0.91 | 0.90 | 1.00 | |||
| MRC0.03 | −0.84 | −0.86 | −0.63 | 0.94 | 0.98 | −0.98 | −0.97 | 0.98 | 0.95 | 1.00 | ||
| MRC1.5 | −0.84 | −0.84 | −0.58 | 0.95 | 0.96 | −0.96 | −0.95 | 0.96 | 0.96 | 0.99 | 1.00 | |
| AWC | −0.83 | −0.86 | −0.65 | 0.93 | 0.98 | −0.98 | −0.97 | 0.98 | 0.94 | 1.00 | 0.98 | 1.00 |
| Soil | Y | X | Equation | R2 | Adjusted R2 | p-Value | Validation (75%) | |
|---|---|---|---|---|---|---|---|---|
| R2 | Adjusted R2 | |||||||
| Both soils | DR | CROSS | 0.951 | 0.950 | <0.0001 | 0.949 | 0.948 | |
| WSA | 0.983 | 0.982 | <0.0001 | 0.981 | 0.980 | |||
| AWC | 0.959 | 0.958 | <0.0001 | 0.953 | 0.951 | |||
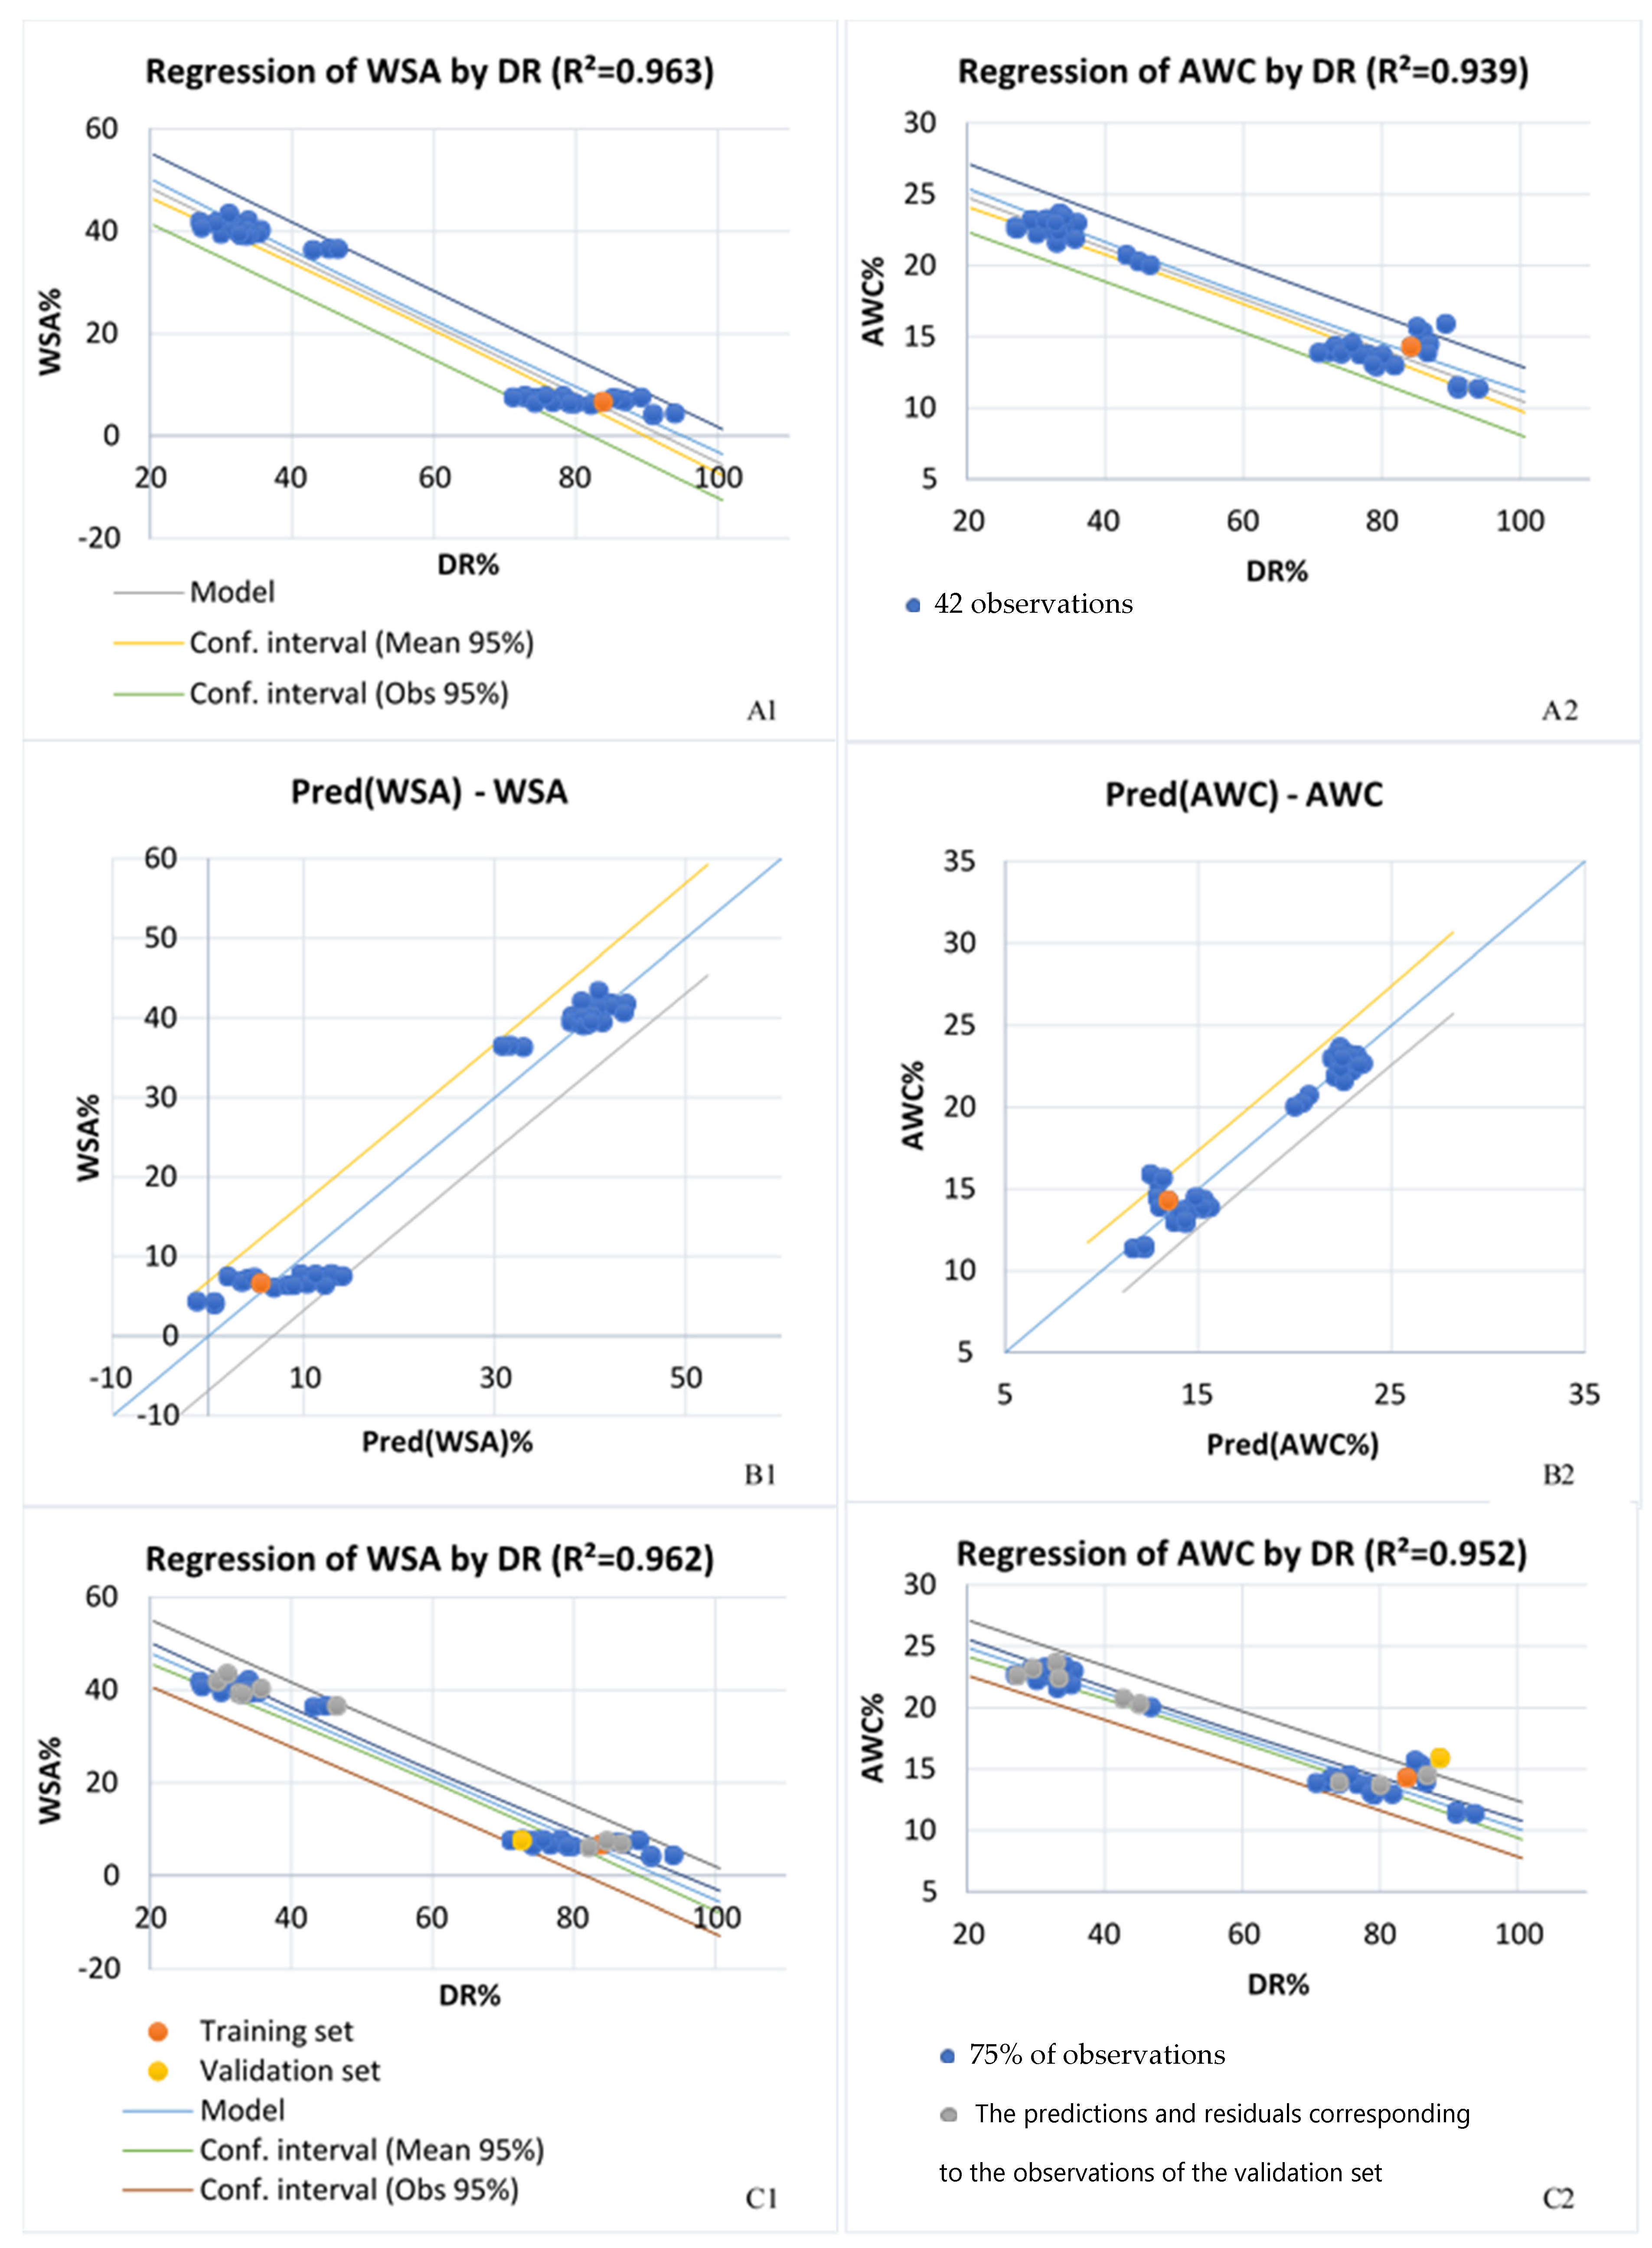
| WSA | DR | 0.963 | 0.962 | <0.0001 | 0.962 | 0.961 | ||
| AWC | 0.939 | 0.937 | <0.0001 | 0.952 | 0.950 | |||
Publisher’s Note: MDPI stays neutral with regard to jurisdictional claims in published maps and institutional affiliations. |
© 2022 by the authors. Licensee MDPI, Basel, Switzerland. This article is an open access article distributed under the terms and conditions of the Creative Commons Attribution (CC BY) license (https://creativecommons.org/licenses/by/4.0/).
Share and Cite
Hammam, A.A.; Mohamed, E.S.; El-Namas, A.E.; Abd-Elmabod, S.K.; Badr Eldin, R.M. Impacted Application of Water-Hyacinth-Derived Biochar and Organic Manures on Soil Properties and Barley Growth. Sustainability 2022, 14, 13096. https://doi.org/10.3390/su142013096
Hammam AA, Mohamed ES, El-Namas AE, Abd-Elmabod SK, Badr Eldin RM. Impacted Application of Water-Hyacinth-Derived Biochar and Organic Manures on Soil Properties and Barley Growth. Sustainability. 2022; 14(20):13096. https://doi.org/10.3390/su142013096
Chicago/Turabian StyleHammam, Amr A., Elsayed Said Mohamed, Ashraf E. El-Namas, Sameh Kotb Abd-Elmabod, and Rasha M. Badr Eldin. 2022. "Impacted Application of Water-Hyacinth-Derived Biochar and Organic Manures on Soil Properties and Barley Growth" Sustainability 14, no. 20: 13096. https://doi.org/10.3390/su142013096