Article

Determinants of Regional Economic Resilience to Economic Crisis: Evidence from Chinese Economies

School of Economics, Lanzhou University, Lanzhou 730000, China
*
Author to whom correspondence should be addressed.
Sustainability 2022, 14(2), 809; https://doi.org/10.3390/su14020809
Submission received: 17 December 2021 / Revised: 6 January 2022 / Accepted: 7 January 2022 / Published: 12 January 2022
(This article belongs to the Special Issue Economic Inequality, Regional Disparities and Sustainable Development)

Abstract

:
The severity of the 2007–2008 economic crisis and the spatial heterogeneity of its impact have accelerated the study of regional economic resilience. The economic crisis has affected most parts of the world, and its impact is highly heterogeneous within China. The aim of this study was to explore the determinants of regional economic resilience across 284 Chinese cities from 2003–2018. Both nation-based and province-based regional economic resilience were examined. A multilevel logistic regression model was established, finding a disparity of provincial effects on regional performance during the economic crisis. Regional economic resilience is significantly affected by provincial trajectories, economy size, and resources. There are five significant determinants of economic resilience: income inequality, innovation, government intervention, human capital, and financial development. The results provide evidence for the government to design region-based policies, taking into consideration the size and the resources of the region’s economy to build a resilient wall to defend against external shocks and to form a basis for sustainable development.

1. Introduction

In December 2007, the economic crisis broke out from the United States, which affected the global economy, ending in June 2009 [1]. Although the crisis affected most parts of the world, its impact was highly heterogeneous across countries. Moreover, the impact within countries was also heterogeneous, and the ability of regions to resist and recover from the crisis was different. This geographical heterogeneity of regions facing economic downturn is considered as a way to test whether a region is resilient [2]. According to Martin (2012), an economic recession may permanently damage productivity and employment opportunities [3]. The severity of an economic crisis and the spatial heterogeneity of its impact accelerate the study of regional economic resilience.
For regional research, the analysis of labor, work, and skills is crucial to the development of a new path which could reintegrate innovation and production into economic development strategies, so as to reduce inequality, improve productivity, and build resilient regional economies [4]. Some countries and organizations have already accelerated the construction of resilient cities, such as the 100 Resilient Cities Program launched by the Rockefeller Foundation and the 2030 Sustainable Development Goals (SDGs) issued by the United Nations [5,6]. As the largest developing country in the world, China has accelerated pace in the urbanization process since the reform and opening up, so as to build resilient cities [7]. However, only a few Chinese cities have achieved the building of high-level resilient cities [8,9]. In China, the progress of building resilient cities is complex and involves various influencing factors [10,11].
The ability of a region to withstand and recover from external shocks has been linked to both soft (social capital) and hard determinants (human capital and infrastructure), as well as network exploitation and economy agglomeration [12]. Similarly to previous studies [12,13,14], this study focused on exploring the comprehensive understanding of factors influencing regional economic resilience. Currently, the research on how pre-crisis determinants impact reaction and recovery faced during an economic crisis is still scarce. Moreover, there is little research focus on how determinants, such as income inequality and government intervention, impact regional economic resilience in a large developing country. In this study, we aimed to fill this gap.
This study aimed to explore how regions react facing economic crisis, and it empirically discussed the determinants of regional economic resilience. Firstly, this study describes the changes in employment of the regional economy and indicates the internal connection between the period of growth and recession. Moreover, this study adopted resilience perspectives at provincial and national levels to provide systematic evidence for the asymmetric impact of the economic crisis on Chinese economies. Thirdly, we examined how the pre-crisis (2003–2007) determinants impact post-crisis (2008–2018) performance. Taking into account the city size (relatively small and large economies) and the resource hierarchy (resource-based and synthetic economies), we compared the differences between small and large economies as well as resource-based and synthetic economies. This research investigated cities in China, providing evidence that regional heterogeneity exists within a large economy; this can contribute to the resilience literature in developing countries. Good governance is important to strengthen regional economic resilience [15]; thus, we aimed to provide evidence for governments to conduct effective and regional-based policies and to contribute to sustainable development.
This article is structured as follows: Section 2 focuses on data selection, resilience definition and its determinants, resilience indicator measurement, determinants of regional resilience, and analytical methods; Section 3 presents and discusses the empirical results; Section 4 concludes the article.

2. Methods

2.1. Data

There are 34 provincial administrative regions in China, including 23 provinces, five autonomous regions, four municipalities directly under the central government, and two special administrative regions. This study selected 22 provinces (excluding Taiwan due to a lack of data), four autonomous regions (excluding the Tibet Autonomous Region due to a lack of data), and four municipalities directly under the central government, yielding a total of 30 provincial administrative regions as the sample of this study. Prefecture-level cities are relatively independent and complete regional units of administrative divisions in China. According to the data released by the National Bureau of Statistics in China, 2020, there are 293 prefecture-level cities and four municipalities directly under the central government (Beijing, Tianjin, Shanghai, and Chongqing). In order to maintain the continuity of the data analyzed in this study, we excluded two kinds of regions: those lacking relevant data (Lhasa) and those cities that were not established as prefecture-level cities until 2010 (such as Shigatse, Changdu, Nyingchi, Shannan, Naqu, Sansha, Danzhou, Haidong, Tulufan, Hami, Tongren, and Bijie). This study selected 284 prefecture-level and above-prefecture-level cities (nested in 30 provincial administrative regions) in China from 2003 to 2018. The data of this study were acquired from the China City Statistical Yearbook, the China Statistical Yearbook for Regional Economy, and the National Bureau of Statistics in China [16,17].
According to the city-size division standard published by the State Council of China in 2014, the 284 cities were divided into relatively large economies and small economies according to their permanent population. Large economies had a population size ≥ 5 million, and small economies had a population size < 5 million [18]. According to this division standard, there were 102 large economies and 182 small economies included in this study. Furthermore, the State Council of the People’s Republic of China identified a total of 262 resource-based cities in the “national sustainable development plan for resource-based cities (2013–2020)” in 2013 [18]. This study included 108 resource-based cities and 176 synthetic cities.

2.2. Resilience and Its Determinants

The concept of resilience is becoming more and more popular in economics, especially in urban and regional economics and economic geography [19]. It was first proposed and applied in ecosystems by Holling (1973), who identified resilience and stability as two aspects of a system’s response to shocks [20]. Holling (1973) defined resilience as the ability of a system to absorb the changes of state variables, driving variables, and parameters and keep them unchanged. Stability is the ability of a system to return to the original equilibrium after being temporarily disturbed [20]. Relevant studies have identified three different methods to conceptualize the regional resilience framework, namely, engineering, ecology, and evolution [3]. Engineering resilience focuses on the resistance of a system to shocks and its ability to go back to the original equilibrium during the pre-crisis period. Ecological resilience is defined as the absorption ability of a system before changing its structure and building a new equilibrium. Evolution refers to the ability of a region to “rebound forward”, i.e., to respond to shocks by adjusting and changing its functions. In this case, resilience does not necessarily mean returning to the original status, but it is possible to reach a new equilibrium [21,22].
Generally speaking, disparity of resilience is the reason why economies perform differently within a country [3,23]. Some researchers defined resilience as the ability of a region or an economy to maintain or restore its original status facing external shocks [24]. The affected areas are considered resilient if they at least return to their previous growth path within 4 years, and vice versa. Other researchers believe that resilience refers to the “ability to resist or recover from market, competition, and environmental shocks” of a regional economy [19]. They believe that the recovered economic system may not return to the status before the shock [3,25]. Therefore, resilience could be addressed as a process with four procedures: vulnerability (the sensitivity of workers and companies to external shocks), resistance (the initial effect of the shock on an economy), robustness (how workers and companies adjust and adapt to shocks), and recoverability (the extent, nature, and path of recovery for a region’s economy) [19].
There are several kinds of external shocks: emergencies, macroeconomic fluctuations, and structural changes [26,27]. Among them, macroeconomic resilience has actually been the central issue of most studies on regional economic resilience published so far: how regions are affected by and recover from the recession. How territories differ in terms of economic resilience within and across countries have attracted the interests of researchers. In regional studies, identifying the influencing factors of regional employment growth and the growth path is essential.
Severe inequality is considered to be the structural cause of great recessions [28,29,30,31]. In addition, severe inequality also reduces an economy’s ability to resist recession. Although researchers have focused on the role of income inequality in economic growth [32,33,34], the research on the role of income inequality in economic resilience and stability is limited. So far, there is little research that focused on the relationship between inequality and resilience. Lewin et al. (2018) examined the data of 639 urban areas in the United States and found that, after the economic crisis, counties with higher inequality were more likely to fall into recession [35]. Rahe (2019) extended this study to all counties in the United States and found that a higher degree of income inequality led to a higher unemployment rate in densely populated areas [36].
The global economic crisis in 2008 had heterogeneous impacts on the economic structure of various regions, leading to a unique local knowledge space [37,38]. Under this circumstance, the technological coherence and resilience of a region may determine, to a certain extent, the severity of impact on the economy and the time required for the economy to return to the original level of innovation, employment, and prosperity. Moreover, human capital provides the basis for generating new knowledge and innovation and for creating new market opportunities, which contribute to overcoming the crisis. Acs et al. (2006) tested the relationship between regional human capital and the survival rate of new enterprises in the labor market of the United States. They found that the impact of human capital on the survival rate of enterprises in the period of economic recession is weaker than that in the period of growth [39]. Wolman et al. (2017) analyzed 361 cities in the United States for more than 40 years and put forward specific suggestions on how to strengthen regional resilience. In the medium term, economies facing economic difficulties need to diversify their economies and support innovation and entrepreneurship. In the long run, metropolitan areas such as Detroit and Cleveland need to invest in human capital [40].
Government intervention may negatively affect regional recovery from the crisis. In the long run, it may cause regional dependence on fiscal expenditure and weaken viability under the crisis. There is little research focusing on how government intervention impacts economic resilience. Guo and Xu (2019) found a negative relationship between government intervention and regional resilience [41]. When entering the adjustment period, the reallocation of production resources and the transformation and upgrading of industrial structure are inseparable from the support of the financial sector [19]. Eraydin (2015) indicated the positive relationship between financial development and resilience by testing Turkish regions [42]. Du et al. (2019) examined cities in the Pearl River Delta of China and also found a positive impact of financial development on economic resilience [43].
The previous evidence lacks consensus on the direction and strength of the determinants of regional economic resilience; to the best of our knowledge, there is no study that focused on the pre-crisis determinants of regional economic resilience in 284 Chinese cities using a nested dataset. This study attempts to fill this gap by presenting and comparing the results of Chinese cities. The research question of this study was whether pre-crisis determinants such as income inequality, innovation, government intervention, human capital, and financial development impact regional economic resilience. The main hypothesis was that the lower the income inequality and government intervention, the greater the ability of an economy to resist and recover from an external shock. Another hypothesis was that the higher innovation, human capital, and financial development, the stronger the regional economic resilience. The difference of city size and resource endowment makes the capability of economies to withstand and recover from external impact differently. Some researcher suggest relatively large economies may perform better when facing external shocks because of agglomeration economies [44], while resource-based economies with a singular industrial structure may have lower economic resilience [45]. Thus, this study also focused on the question whether the response of Chinese economies to the 2008 economic crisis can be influenced by differences in the size and the resources of economies.

2.3. Resilience Indicator

Previous studies used a variety of methods and indicators to illustrate regional economic resilience [46]. In fact, there is no unified method to measure resilience, and the increasing diversity of indicators may further weaken the clarity and practicability of the concept of resilience [19,47]. The existing indices have not been confirmed to a large extent, and the past indices have proved inaccurate in predicting the resilience of economies to the recent economic crisis [48]. So far, most of the achievements of economic geography and regional economics depend on traditional economic indicators, such as employment and per capita gross domestic product [3,49,50,51]. Therefore, this study set out to test regional economic resilience from the perspective of the employment growth rate, in line with previous studies [13,51,52].
Following Faggian et al. (2018), Giannakis and Bruggeman (2020, 2021), and Lagravinese (2015), national-based regional economic resilience can be expressed as follows [51,52,53]:
RN = [(ERt − ERt−1)/ERt−1 − (ENt − ENt−1)/ENt−1]/|(ENt − ENt−1)/ENt−1|,
where R represents regional economic resilience, ER represents employment at the regional level, EN represents employment at the national level, t − 1 is the first year of the economic crisis (2008), and t represents the last year of the economic recovery period (2018).
If RN is positive, the relative employment loss of the region is smaller (or the relative employment gain is higher) and/or the recovery speed is faster than the average employment change of the whole country, i.e., the economic resilience of the region is higher than the national average. If RN is negative, it means that the regional economic resilience is lower than the national average.
Province-based regional economic resilience can be expressed as follows:
RP = [(ERt − ERt−1)/ERt−1 − (EPt − EPt−1)/EPt−1]/|(EPt − EPt−1)/EPt−1|,
where EP represents employment at the provincial level. Similar to RN, a positive RP represents a smaller employment loss of the region (or higher employment gain) and/or a faster recovery speed than the provincial average, i.e., the province-based regional economic resilience is higher than the provincial average. If RP is negative, it means that the regional economic resilience of the region is lower than the provincial level.

2.4. Determinants of Regional Economic Resilience

Referring to the relevant literature on regional economic resilience, this study indicates the determinants of disparity in resisting and recovering from the impact of recession in different cities of China. Regional resilience is affected by the inherent characteristics that support its previous growth path [19]. According to Giannakis and Bruggeman (2020), temporary fluctuations, such as droughts, may affect agricultural regions [52]. Therefore, this study computed the average value of all influencing factors from 2003–2007. The discussion of how pre-crisis determinants impact regional performance is useful to understand the heterogeneous response of different regions during and after the crisis [54]. Based on previous studies, income inequality was measured by the Gini coefficient (GINI). We selected fiscal expenditure for science and technology as a measurement of innovation. Government intervention was measured by the ratio of public finance expenditure (excluding fiscal expenditure for science and technology) divided by the gross regional product. According to our hypothesis, economies with higher human capital and financial development are better able to resist and recover following the crisis. We used the number of students in colleges and universities per 10,000 people to measure human capital, and we used the ratio of balance of bank deposits and loans/gross regional product to measure financial development. The growth rate of total industrial output was used to measure manufacturing, and the ratio of investment in fixed assets/gross regional product was used to measure investment in fixed assets that can express the ability of governance. The share of the population older than 65 years was used to measure the population structure, and the percentages of employment in the urban individual economy and the private economy were used to measure entrepreneurship. Table 1 shows the descriptive statistics of all determinants.

2.5. Analytical Methods

National-level factors affect regional economic resilience [55,56]; thus, a multilevel logistic regression was used in this study to assess determinants of regional economic resilience and regional resilience variance caused by disparities between provinces. This study used a nested structure, i.e., 284 cities (level 1) nested within 30 provinces (level 2). The independent variables were assumed to be statistically significant at the 10% level. All calculations were performed using the STATA 15 econometric software package and HLM 6.08. All figures were portrayed using ArcGIS 10.5 (ESRI, Redlands, CA, USA).
The dependent variable, regional economic resilience, was assumed as a dichotomous dependent variable.
Yij = 1, if RN ≥ 0,
Yij = 0, if RN < 0.
A two-level logistic regression model was constructed as follows:
(a) Null model:
Prob (Yij = 1) = pij,
Log (pij/(1 − pij)) = γ00 + u0j,
(b) Full model:
Log (pij/(1 − pij)) = β0j + βijXqij,
β0j = γ00 + γij + u0j,
where pij is the probability of Yij = 1, Xqij is the predictor q for city i in province j, and u0j is the level 1 random effect; here, we assumed that the random term u0j~N (0, σ2).
The between-group variation can be measured by the intraclass correlation coefficient (ICC) [57]. For a logistic regression model, σ2 is π2/3. Thus, Equation (6) simply states that the intraclass correlation is the proportion of group-level variance compared to the total variance.
ICC = σb2/(σb2 + σ2),
where σ2 represents the within-group variance, and σb2 indicates the between-group variance. ICC < 0.059 represents low within-group correlation; 0.059 < ICC < 0.138 represents moderate within-group correlation; ICC > 0.138 represents high within-group correlation, which indicates the necessity of conducting multilevel regression [58].
A second analysis was applied for province-based regional economic resilience. A logistic model was constructed to account for the effects of the independent variables on regional resilience to the crisis using 25 provinces and 279 cities (Beijing, Shanghai, Chongqing, Tianjin, and Qinghai were excluded as each consisted of only one city).
A third analysis was applied for large and small cities to capture the impacts of the size of regions. As discussed previously, 284 cities were divided into two groups: large (102) and small (182) economies. Two multilevel logistic regressions were applied using national-based resilience.
Finally, a multilevel logistic analysis was applied for resource-based economies and synthetic economies to capture the impacts of the resources of regions. This study divided the 284 cities into two groups: 108 resource-based economies and 176 synthetic economies. Two multilevel logistic regressions were also applied using national-based resilience.
In order to examine multicollinearity of the predictor variables, this study used the variance inflation factor (VIF). VIF < 5 denotes that the model has no multicollinearity and that the model is well constructed, and vice versa [59].

3. Results and Discussion

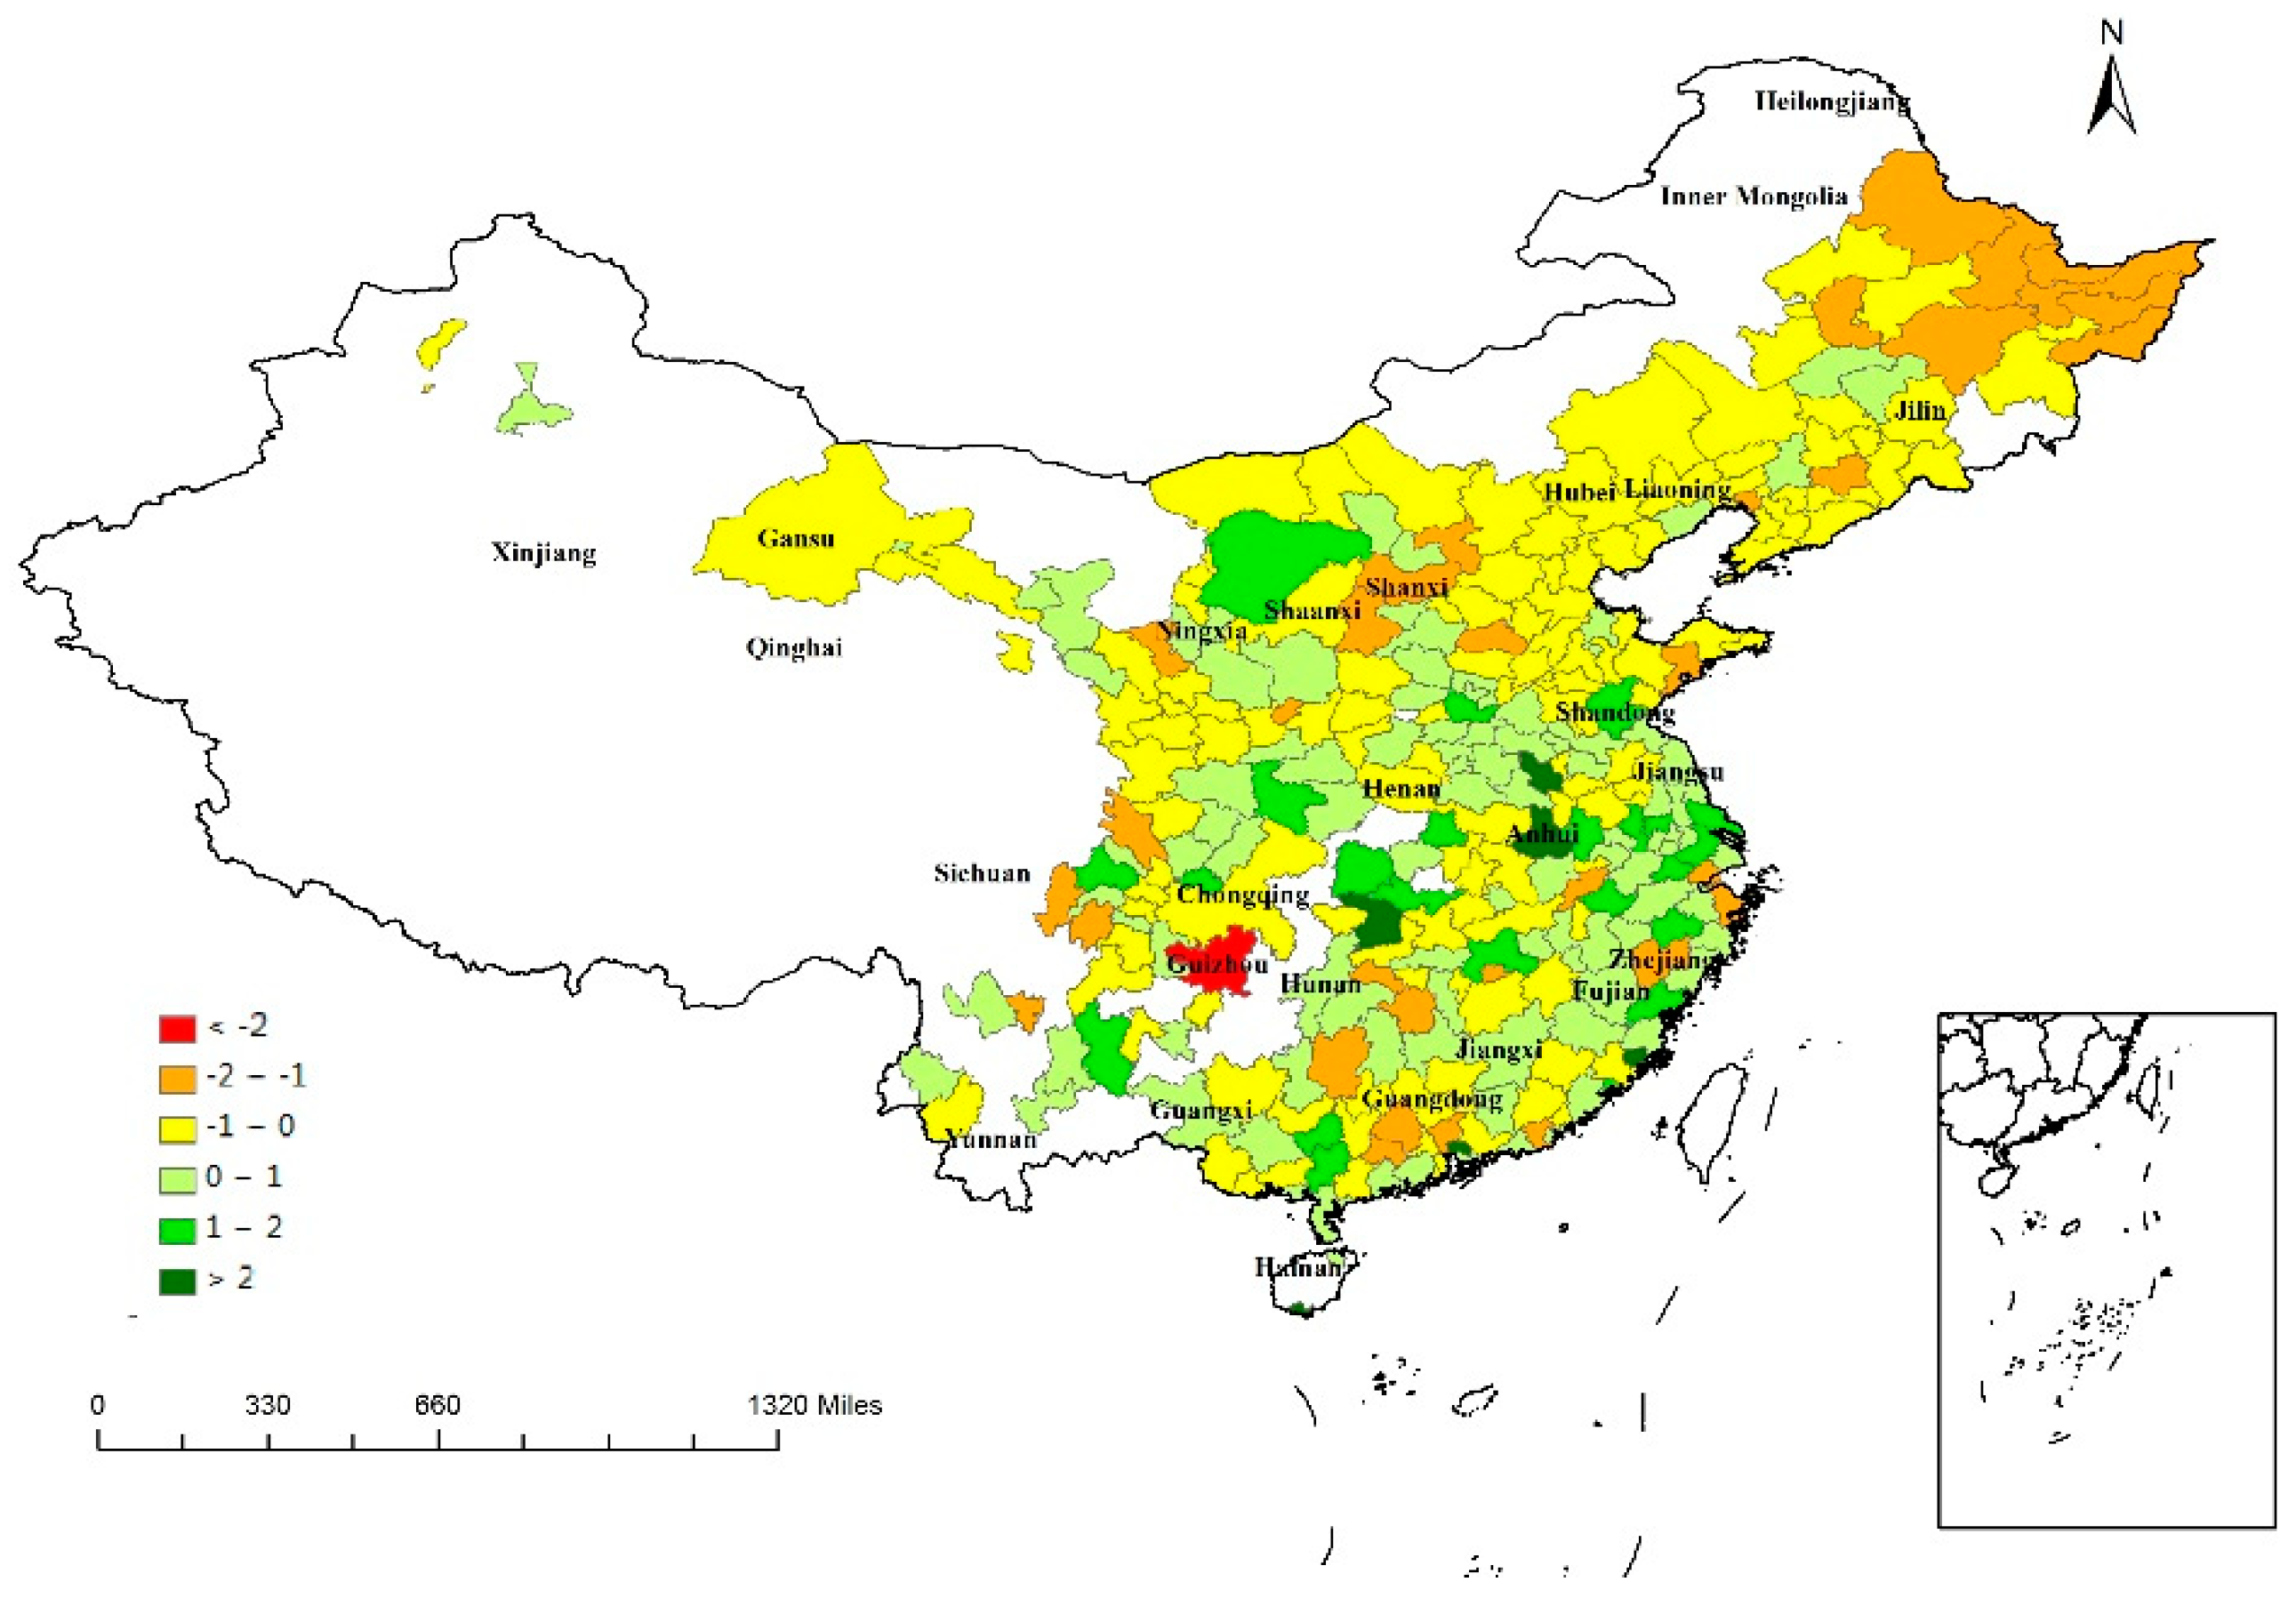
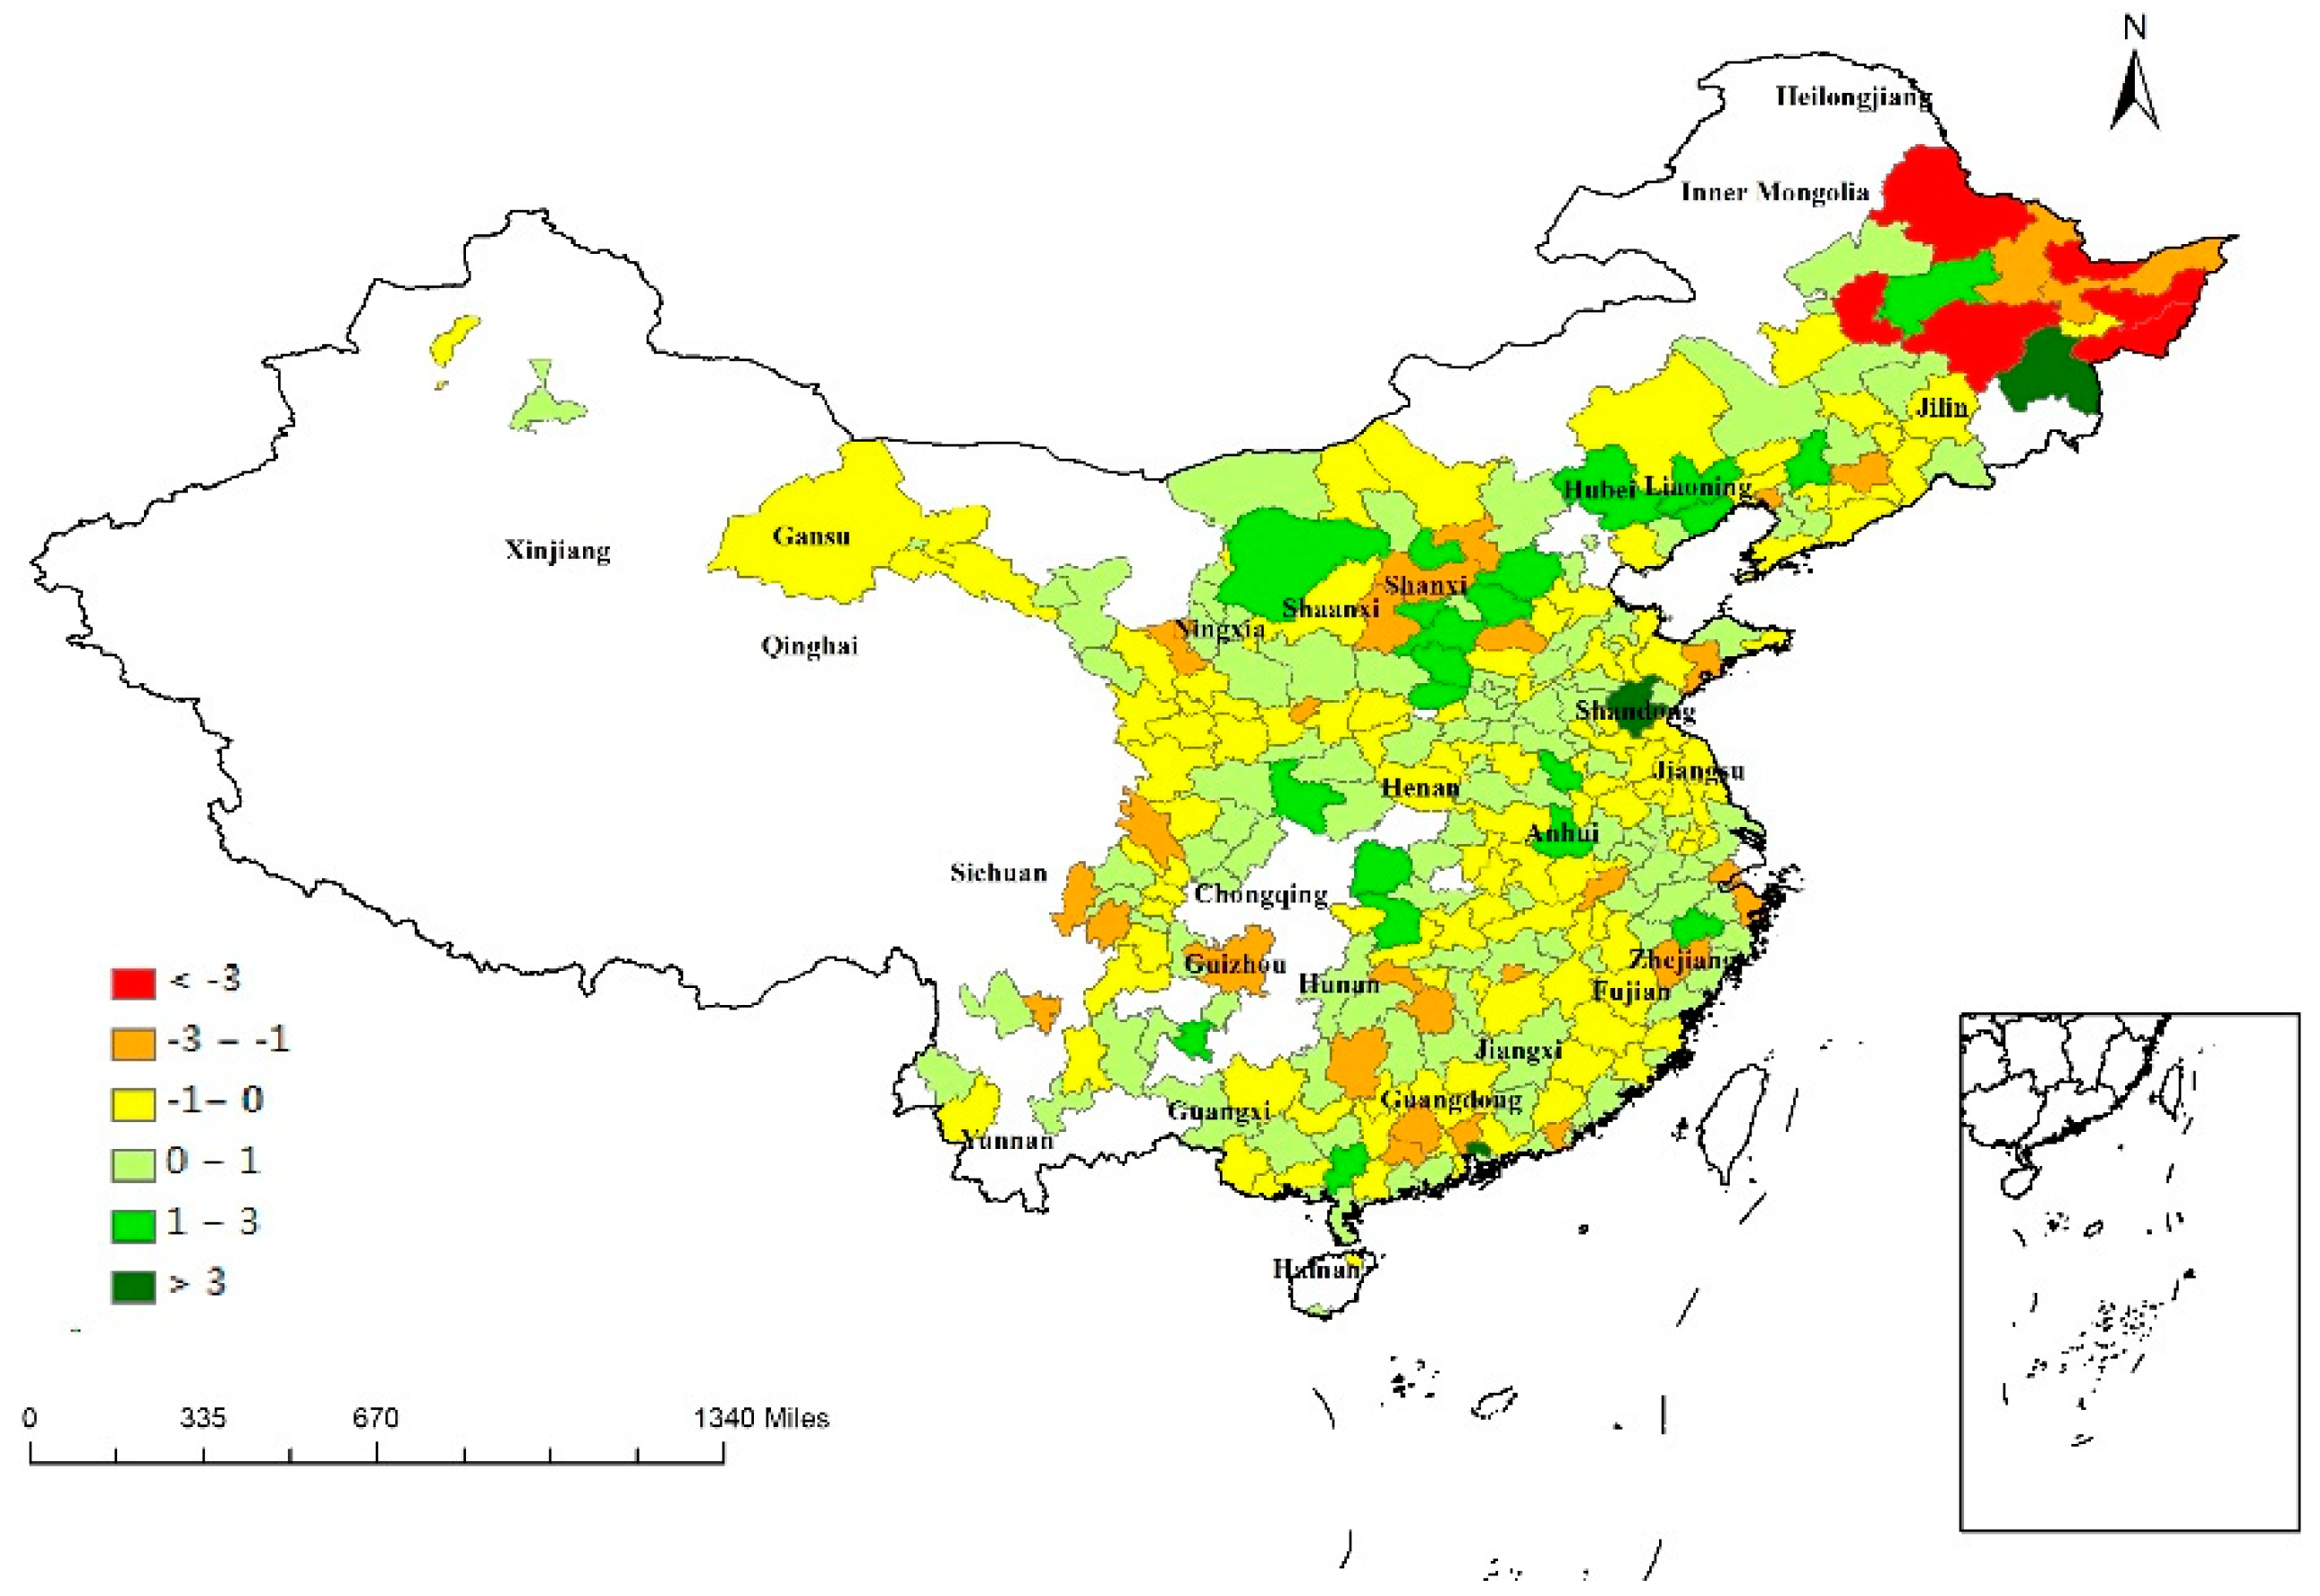
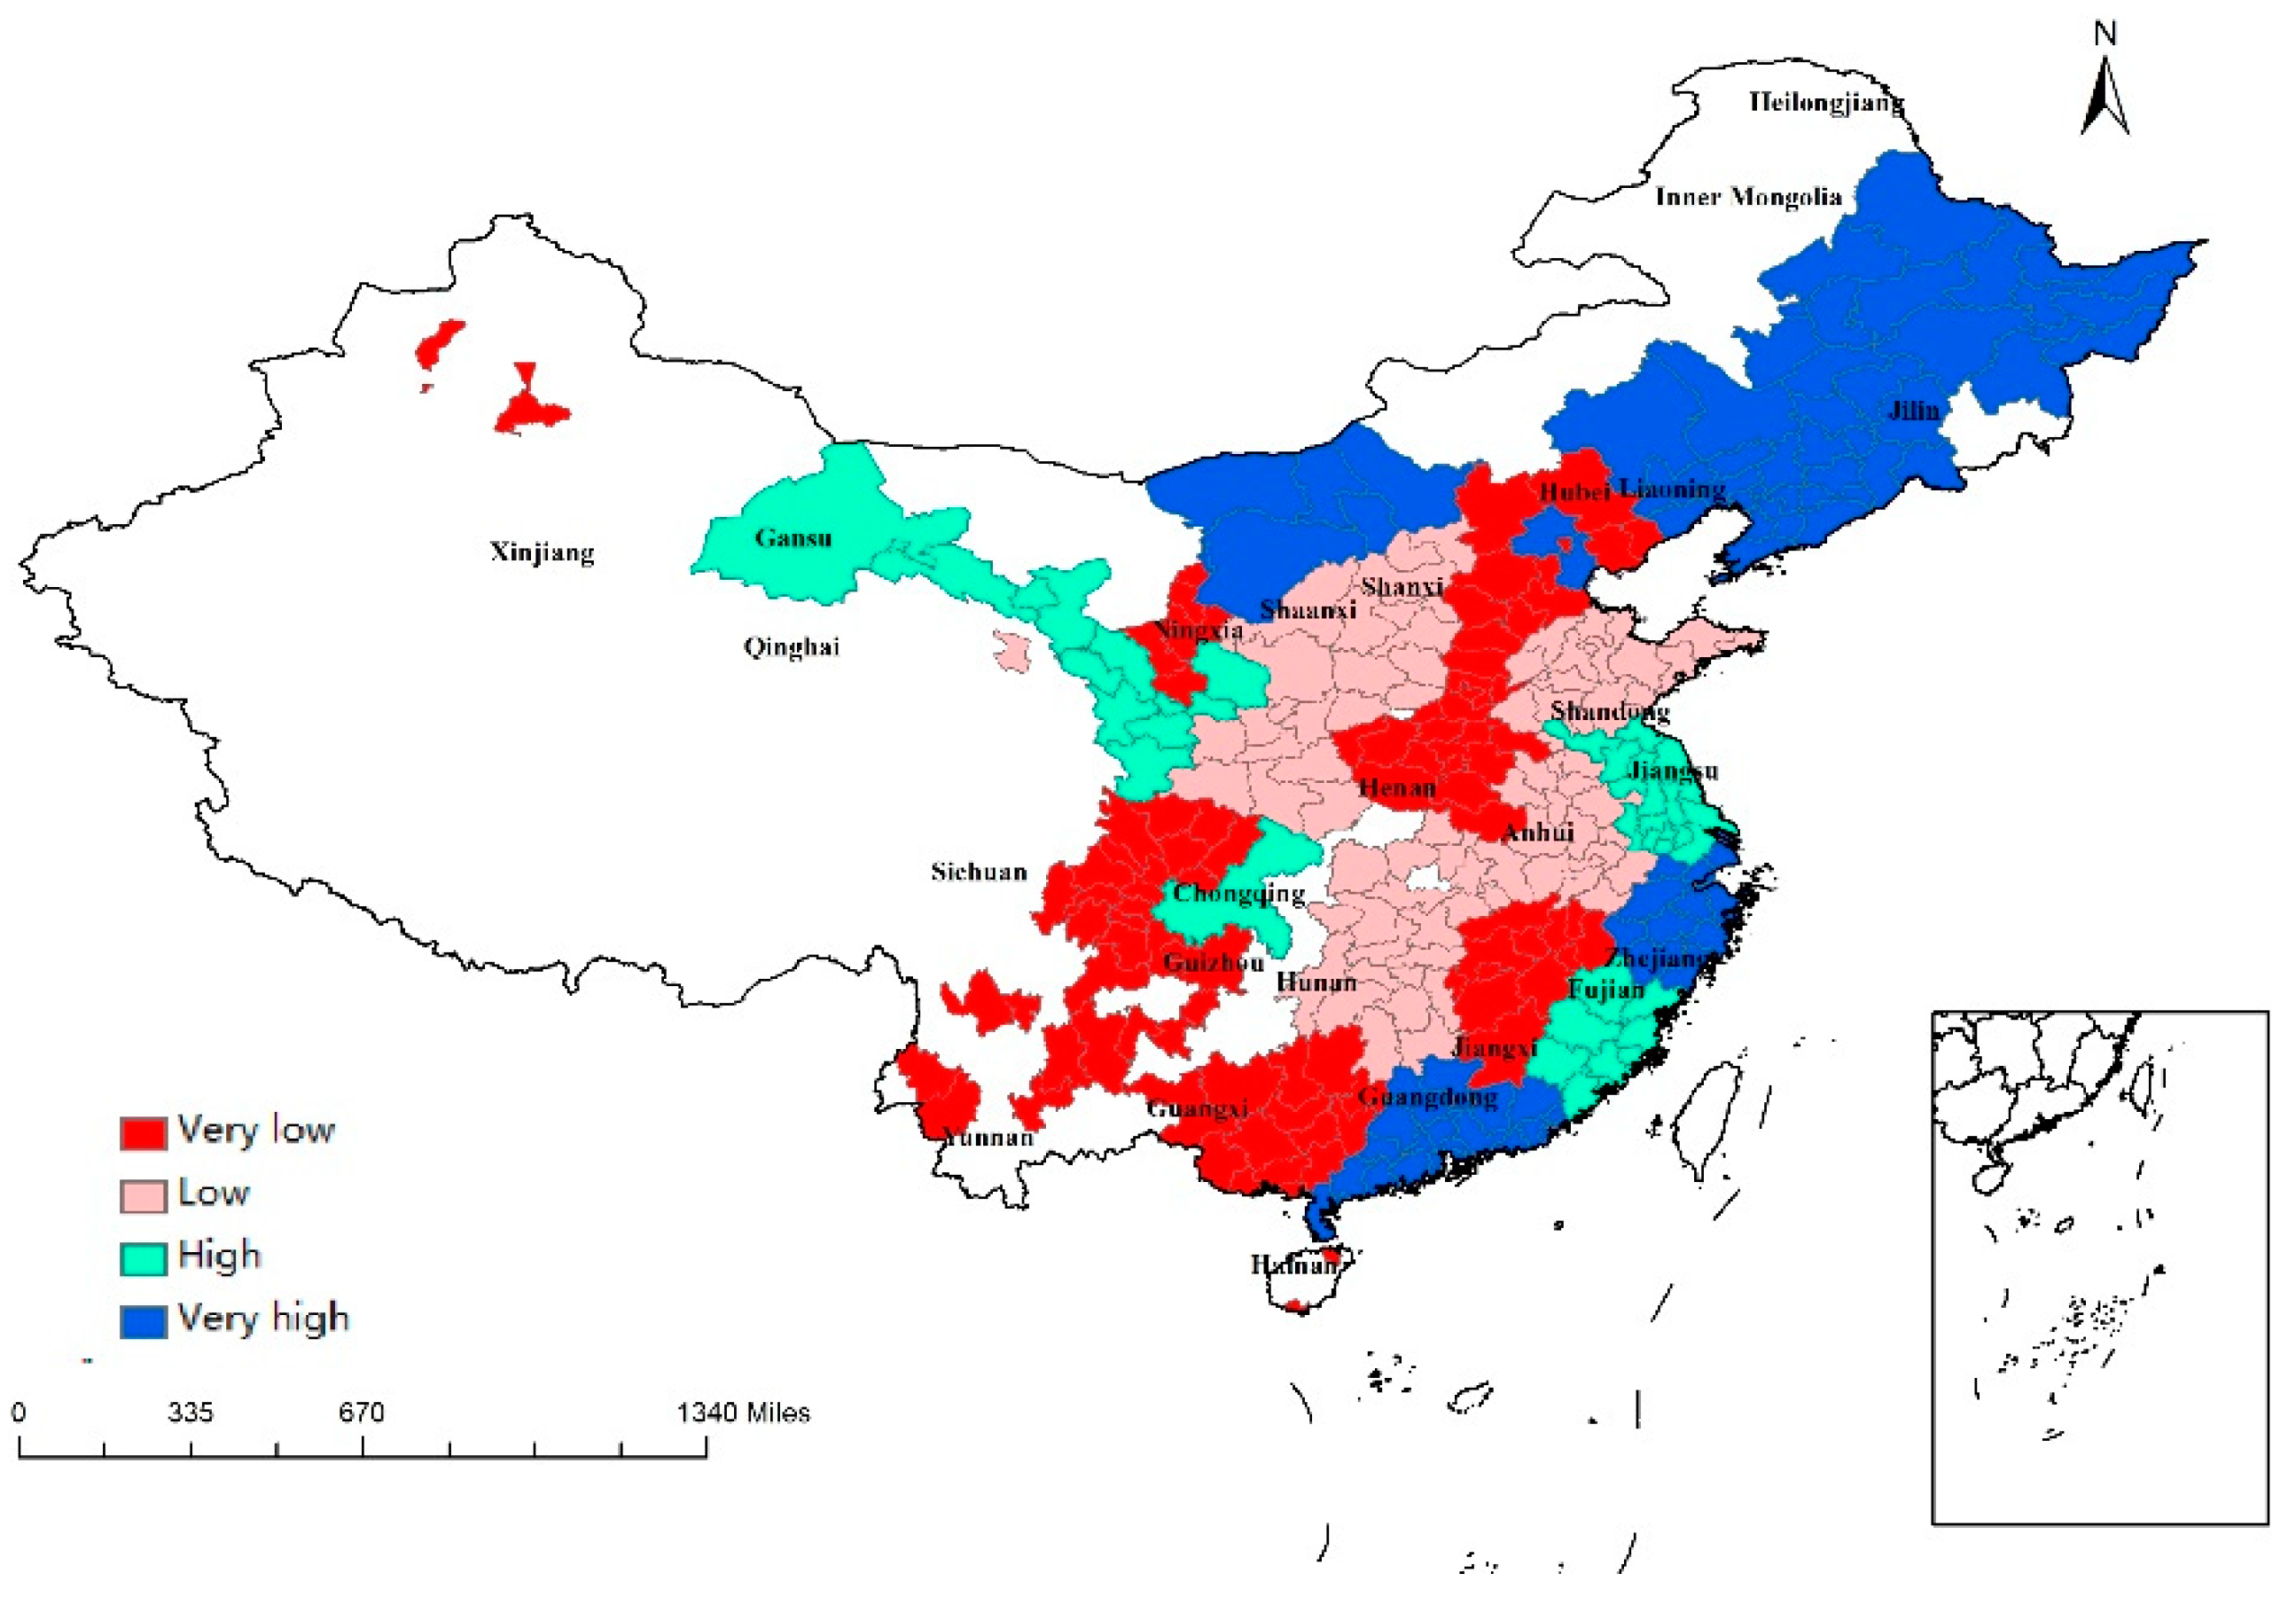
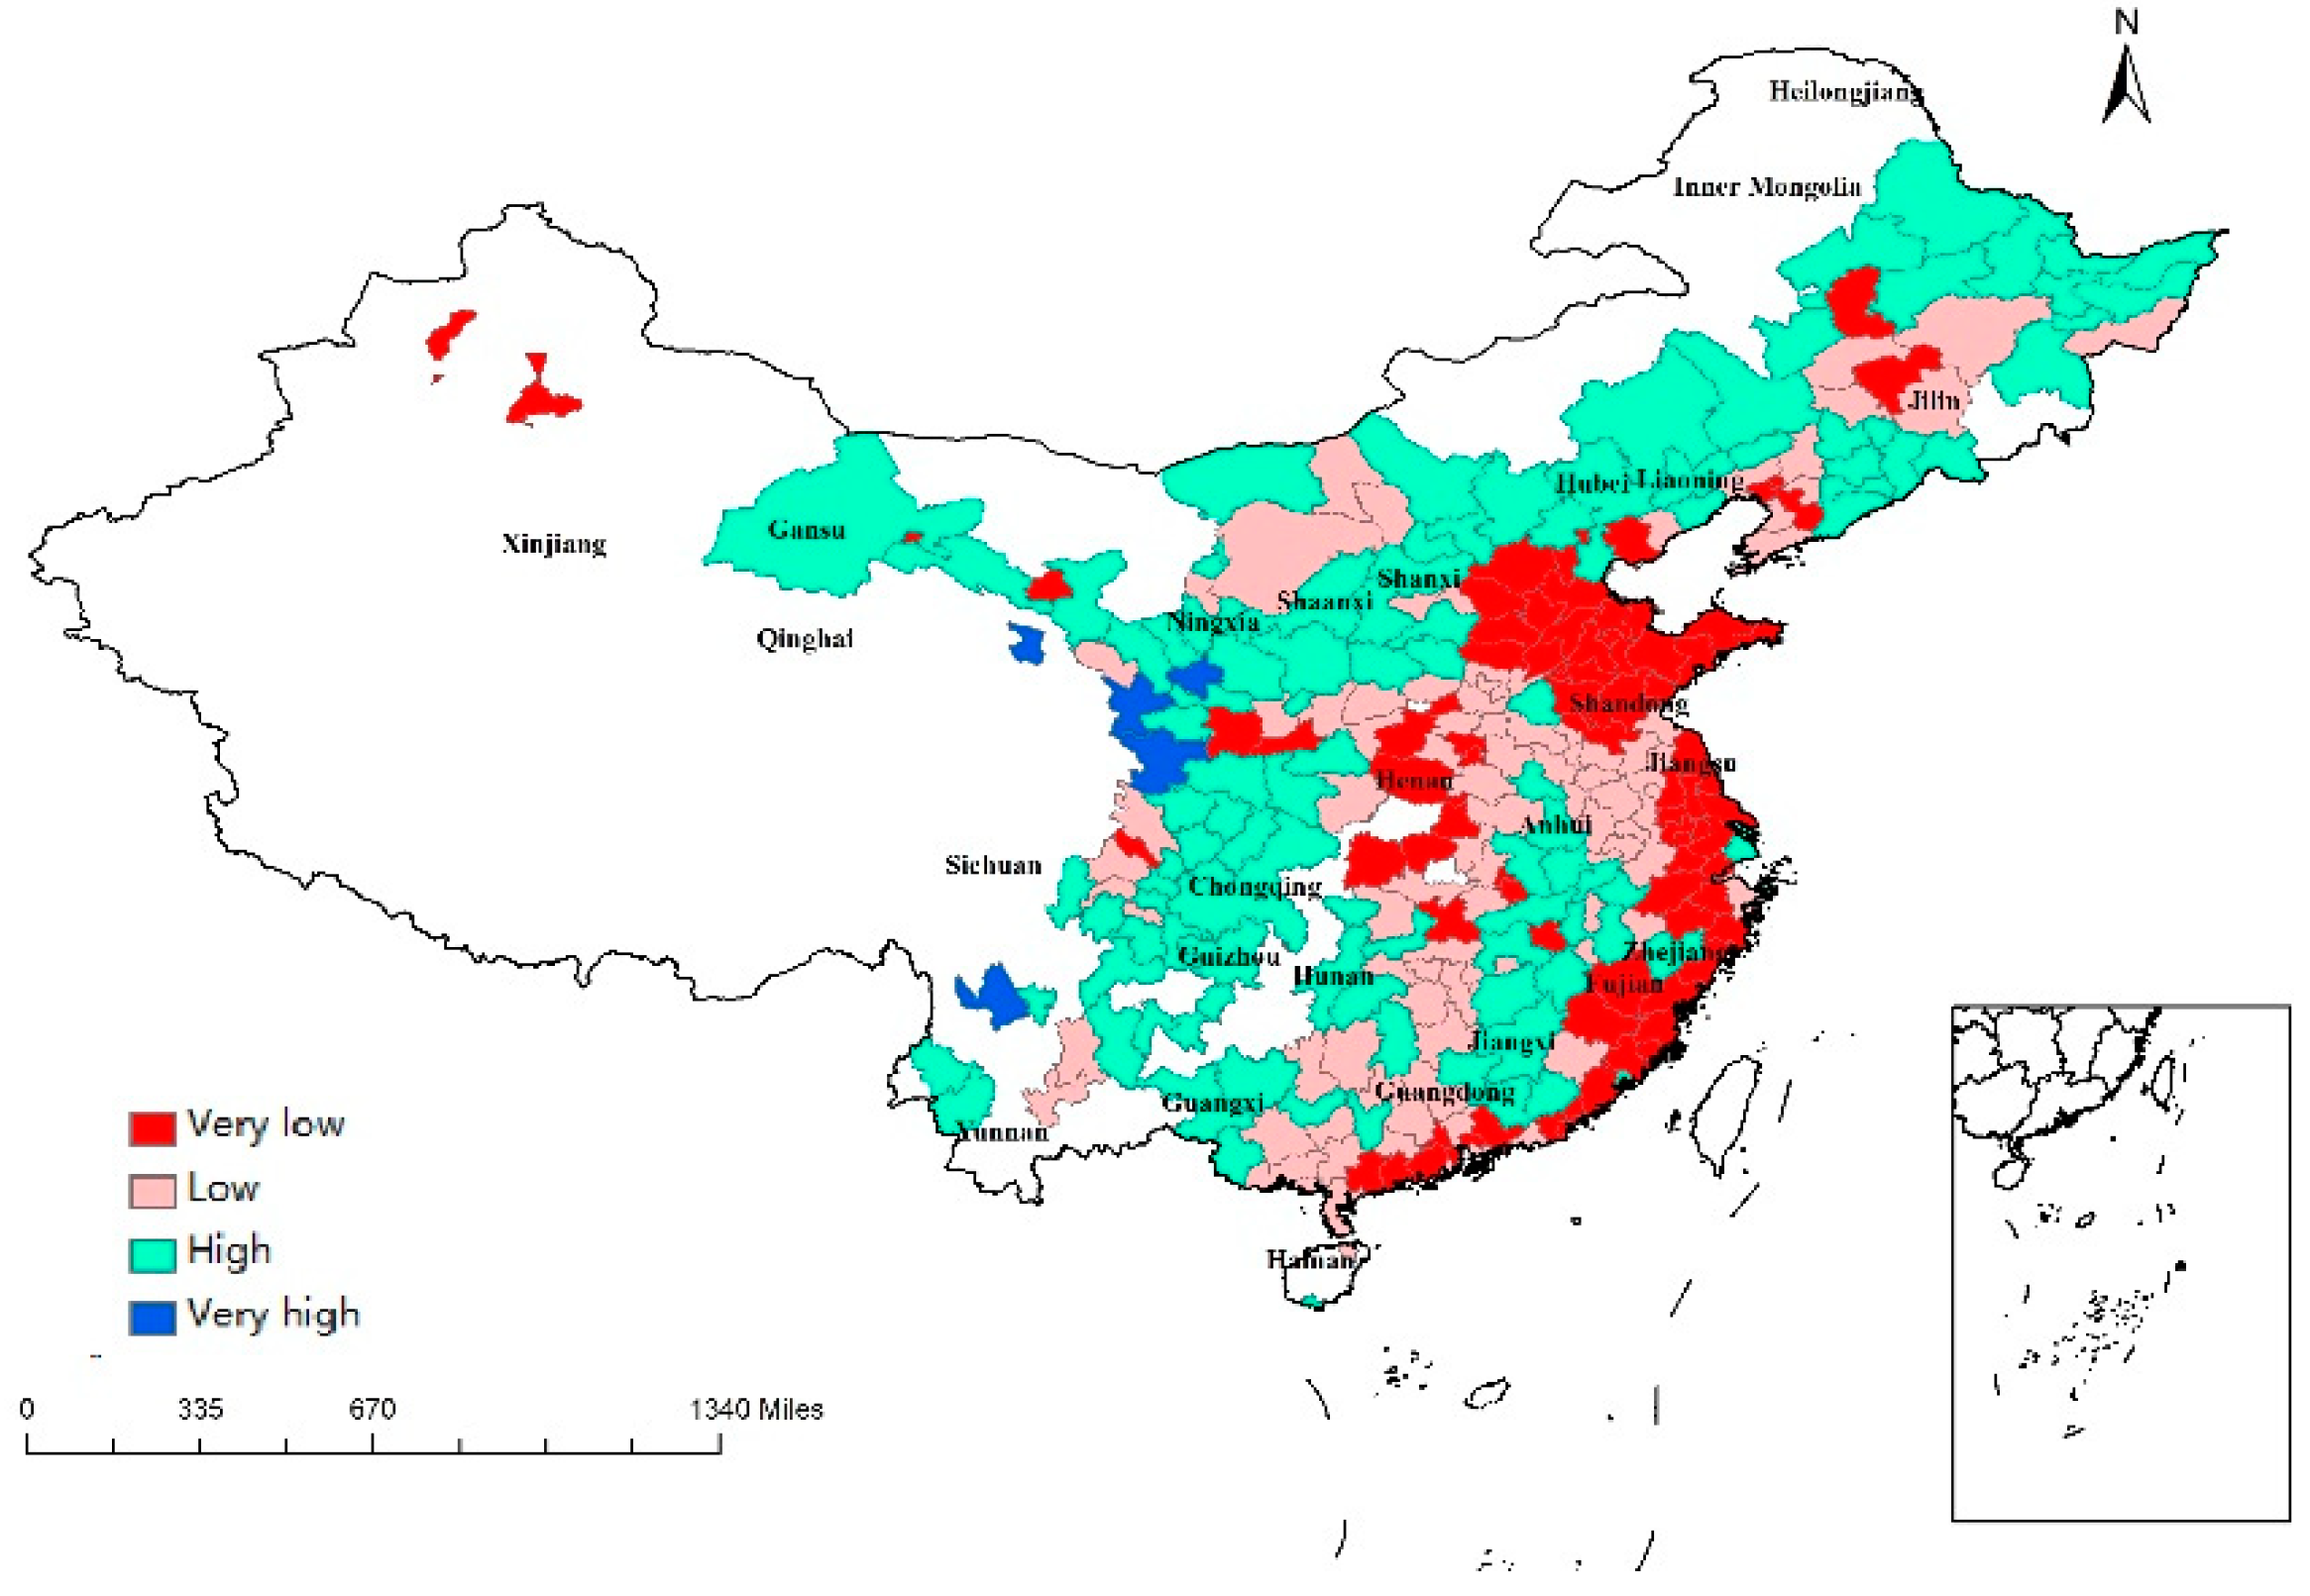
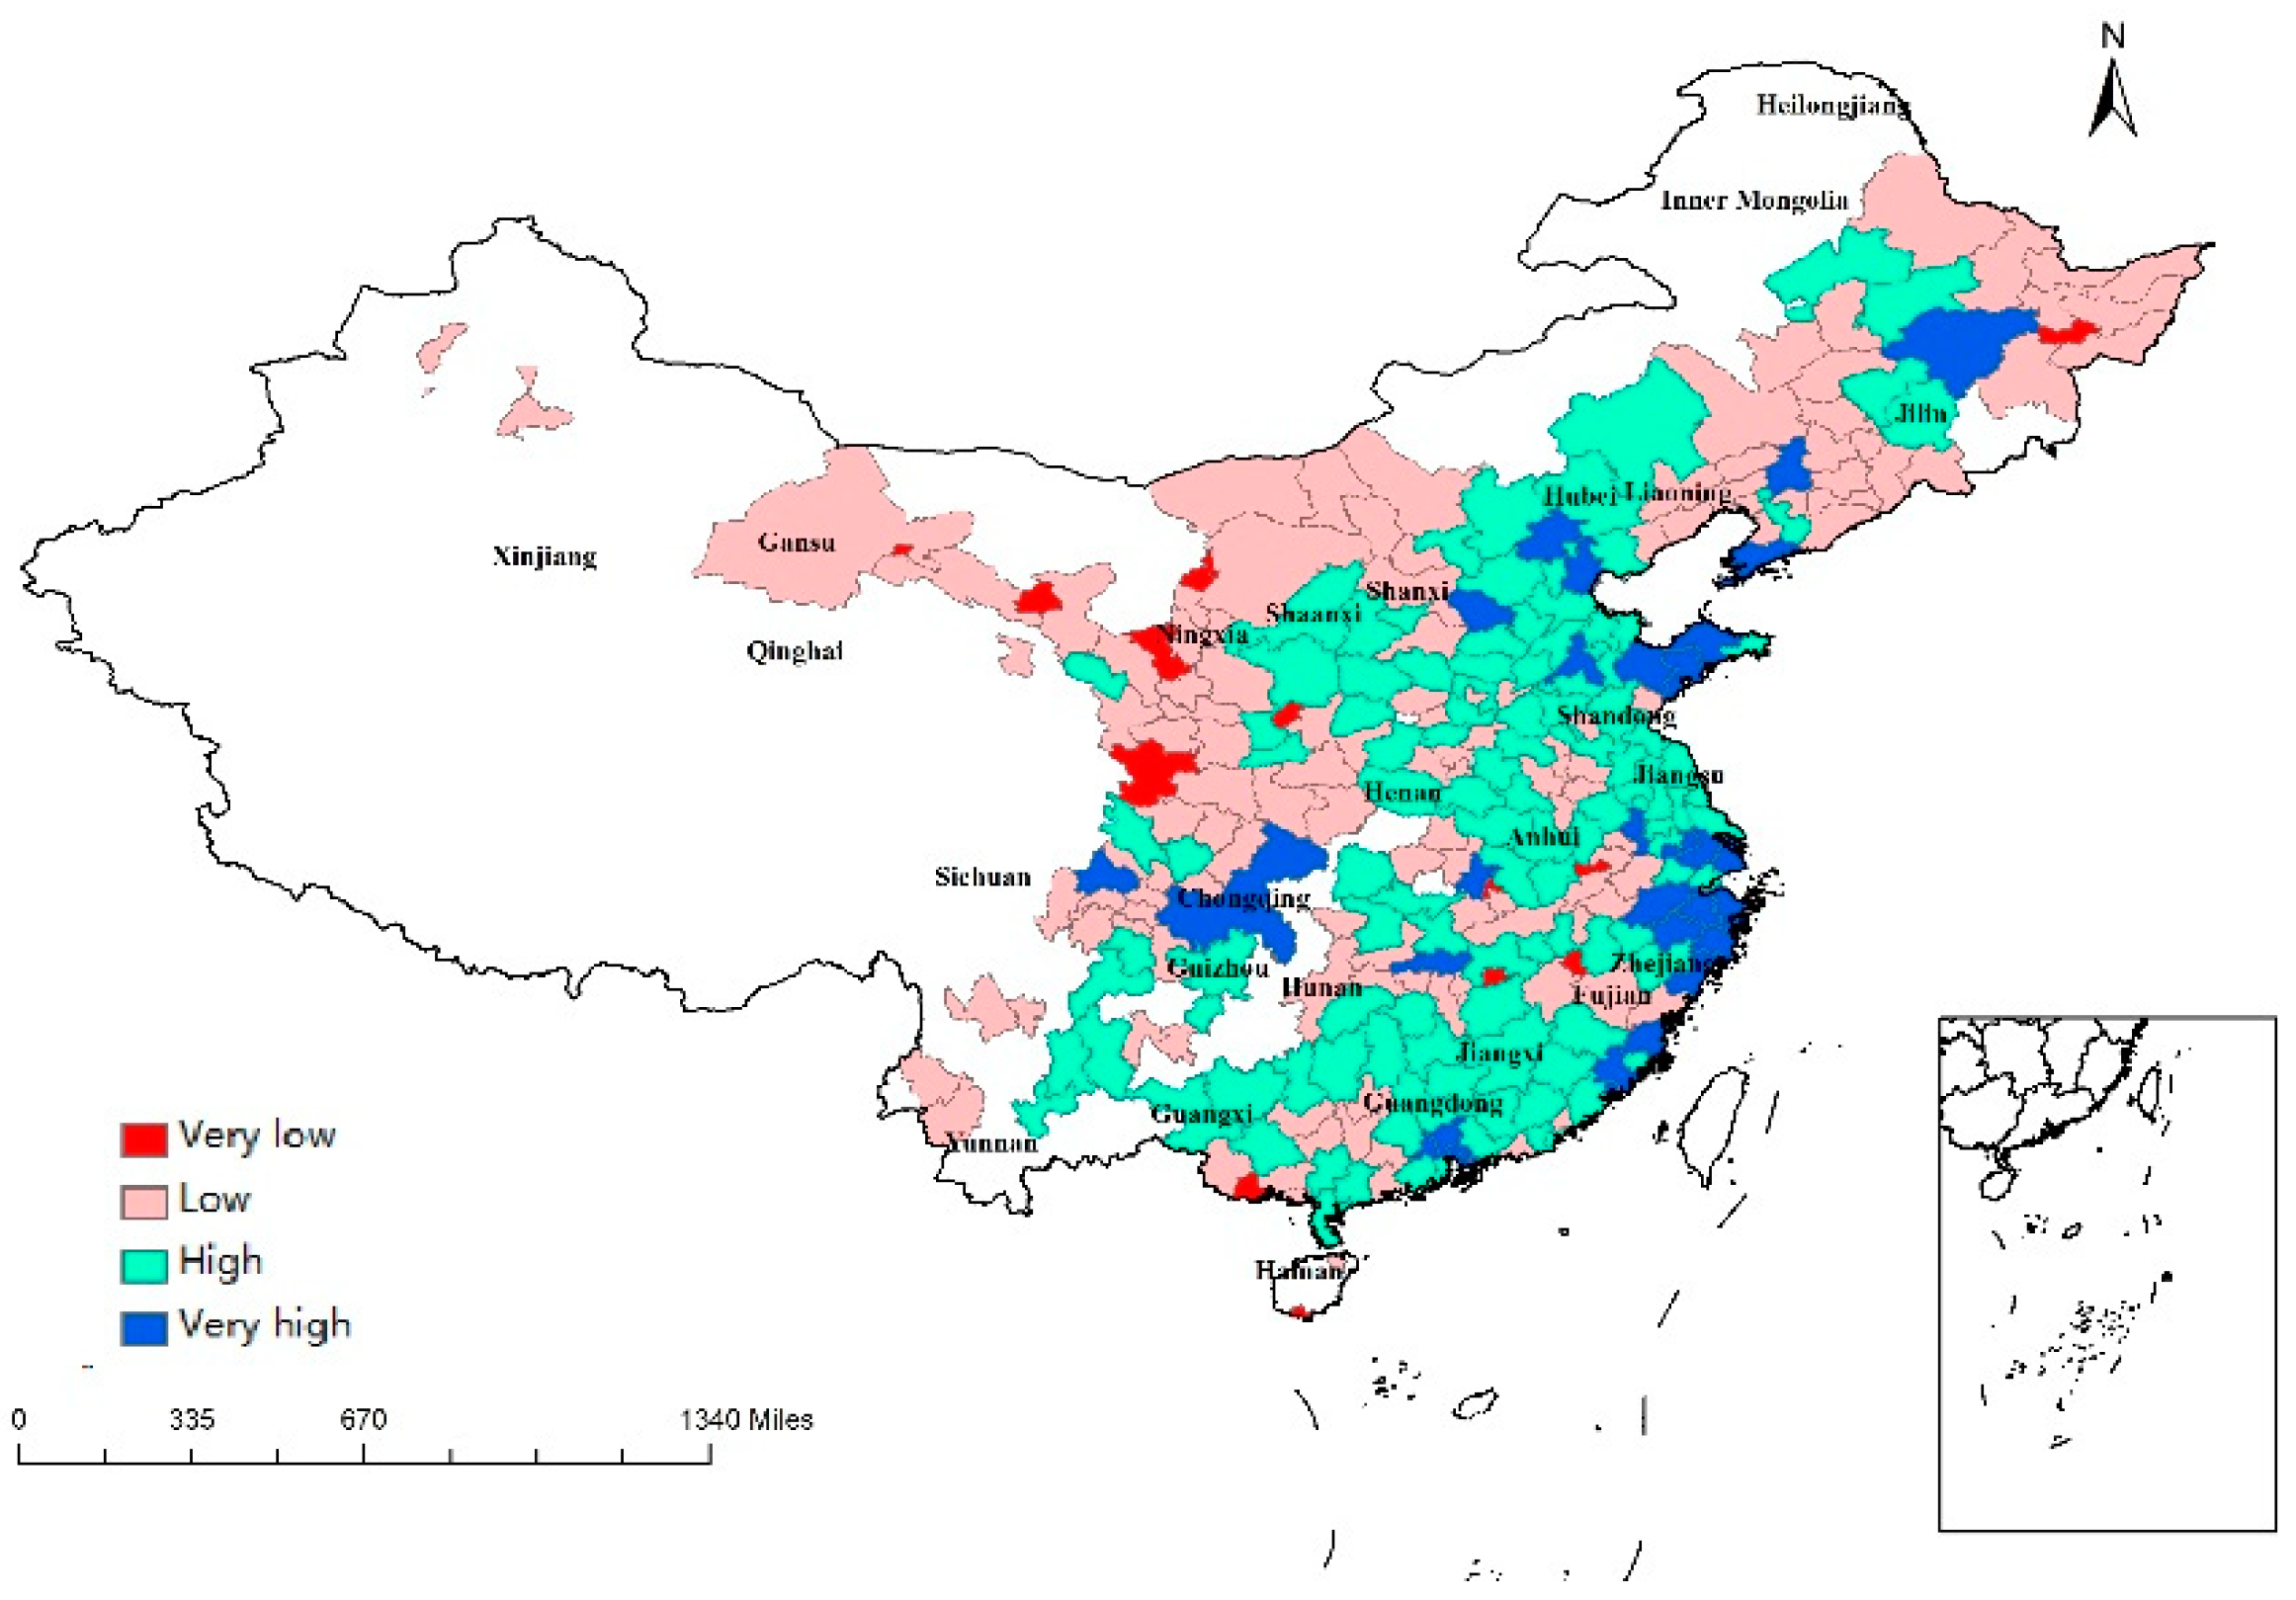
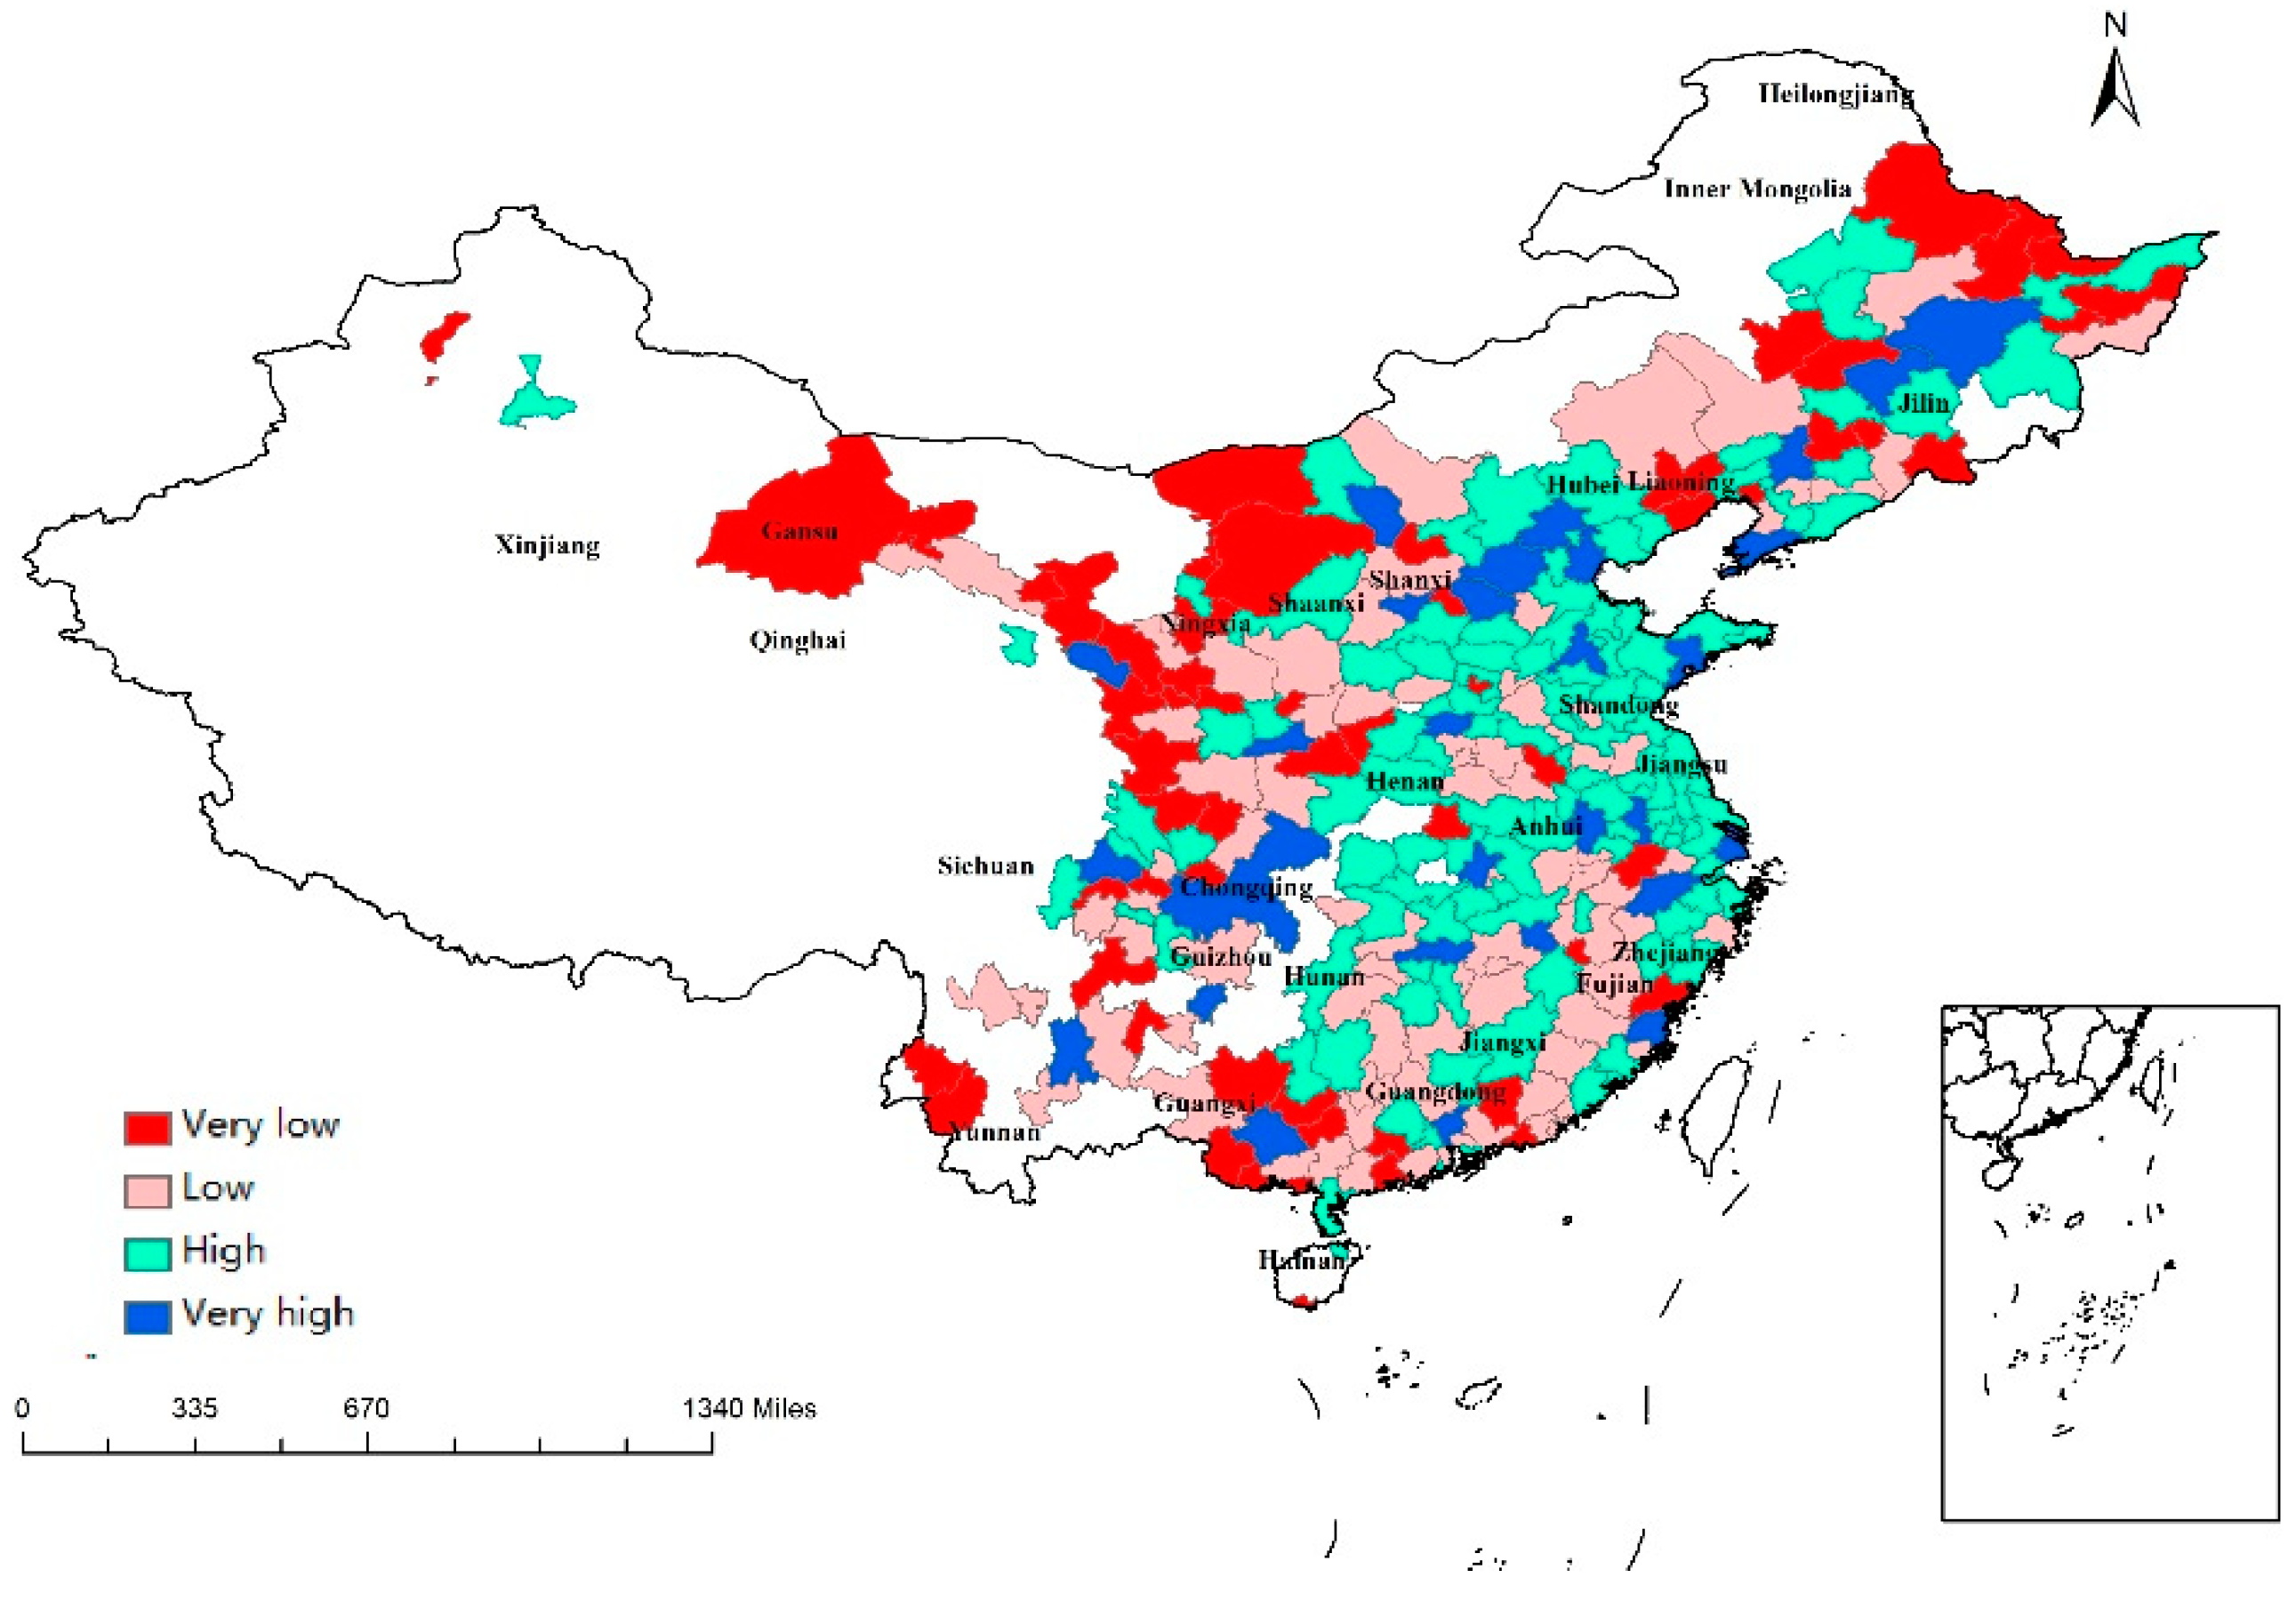
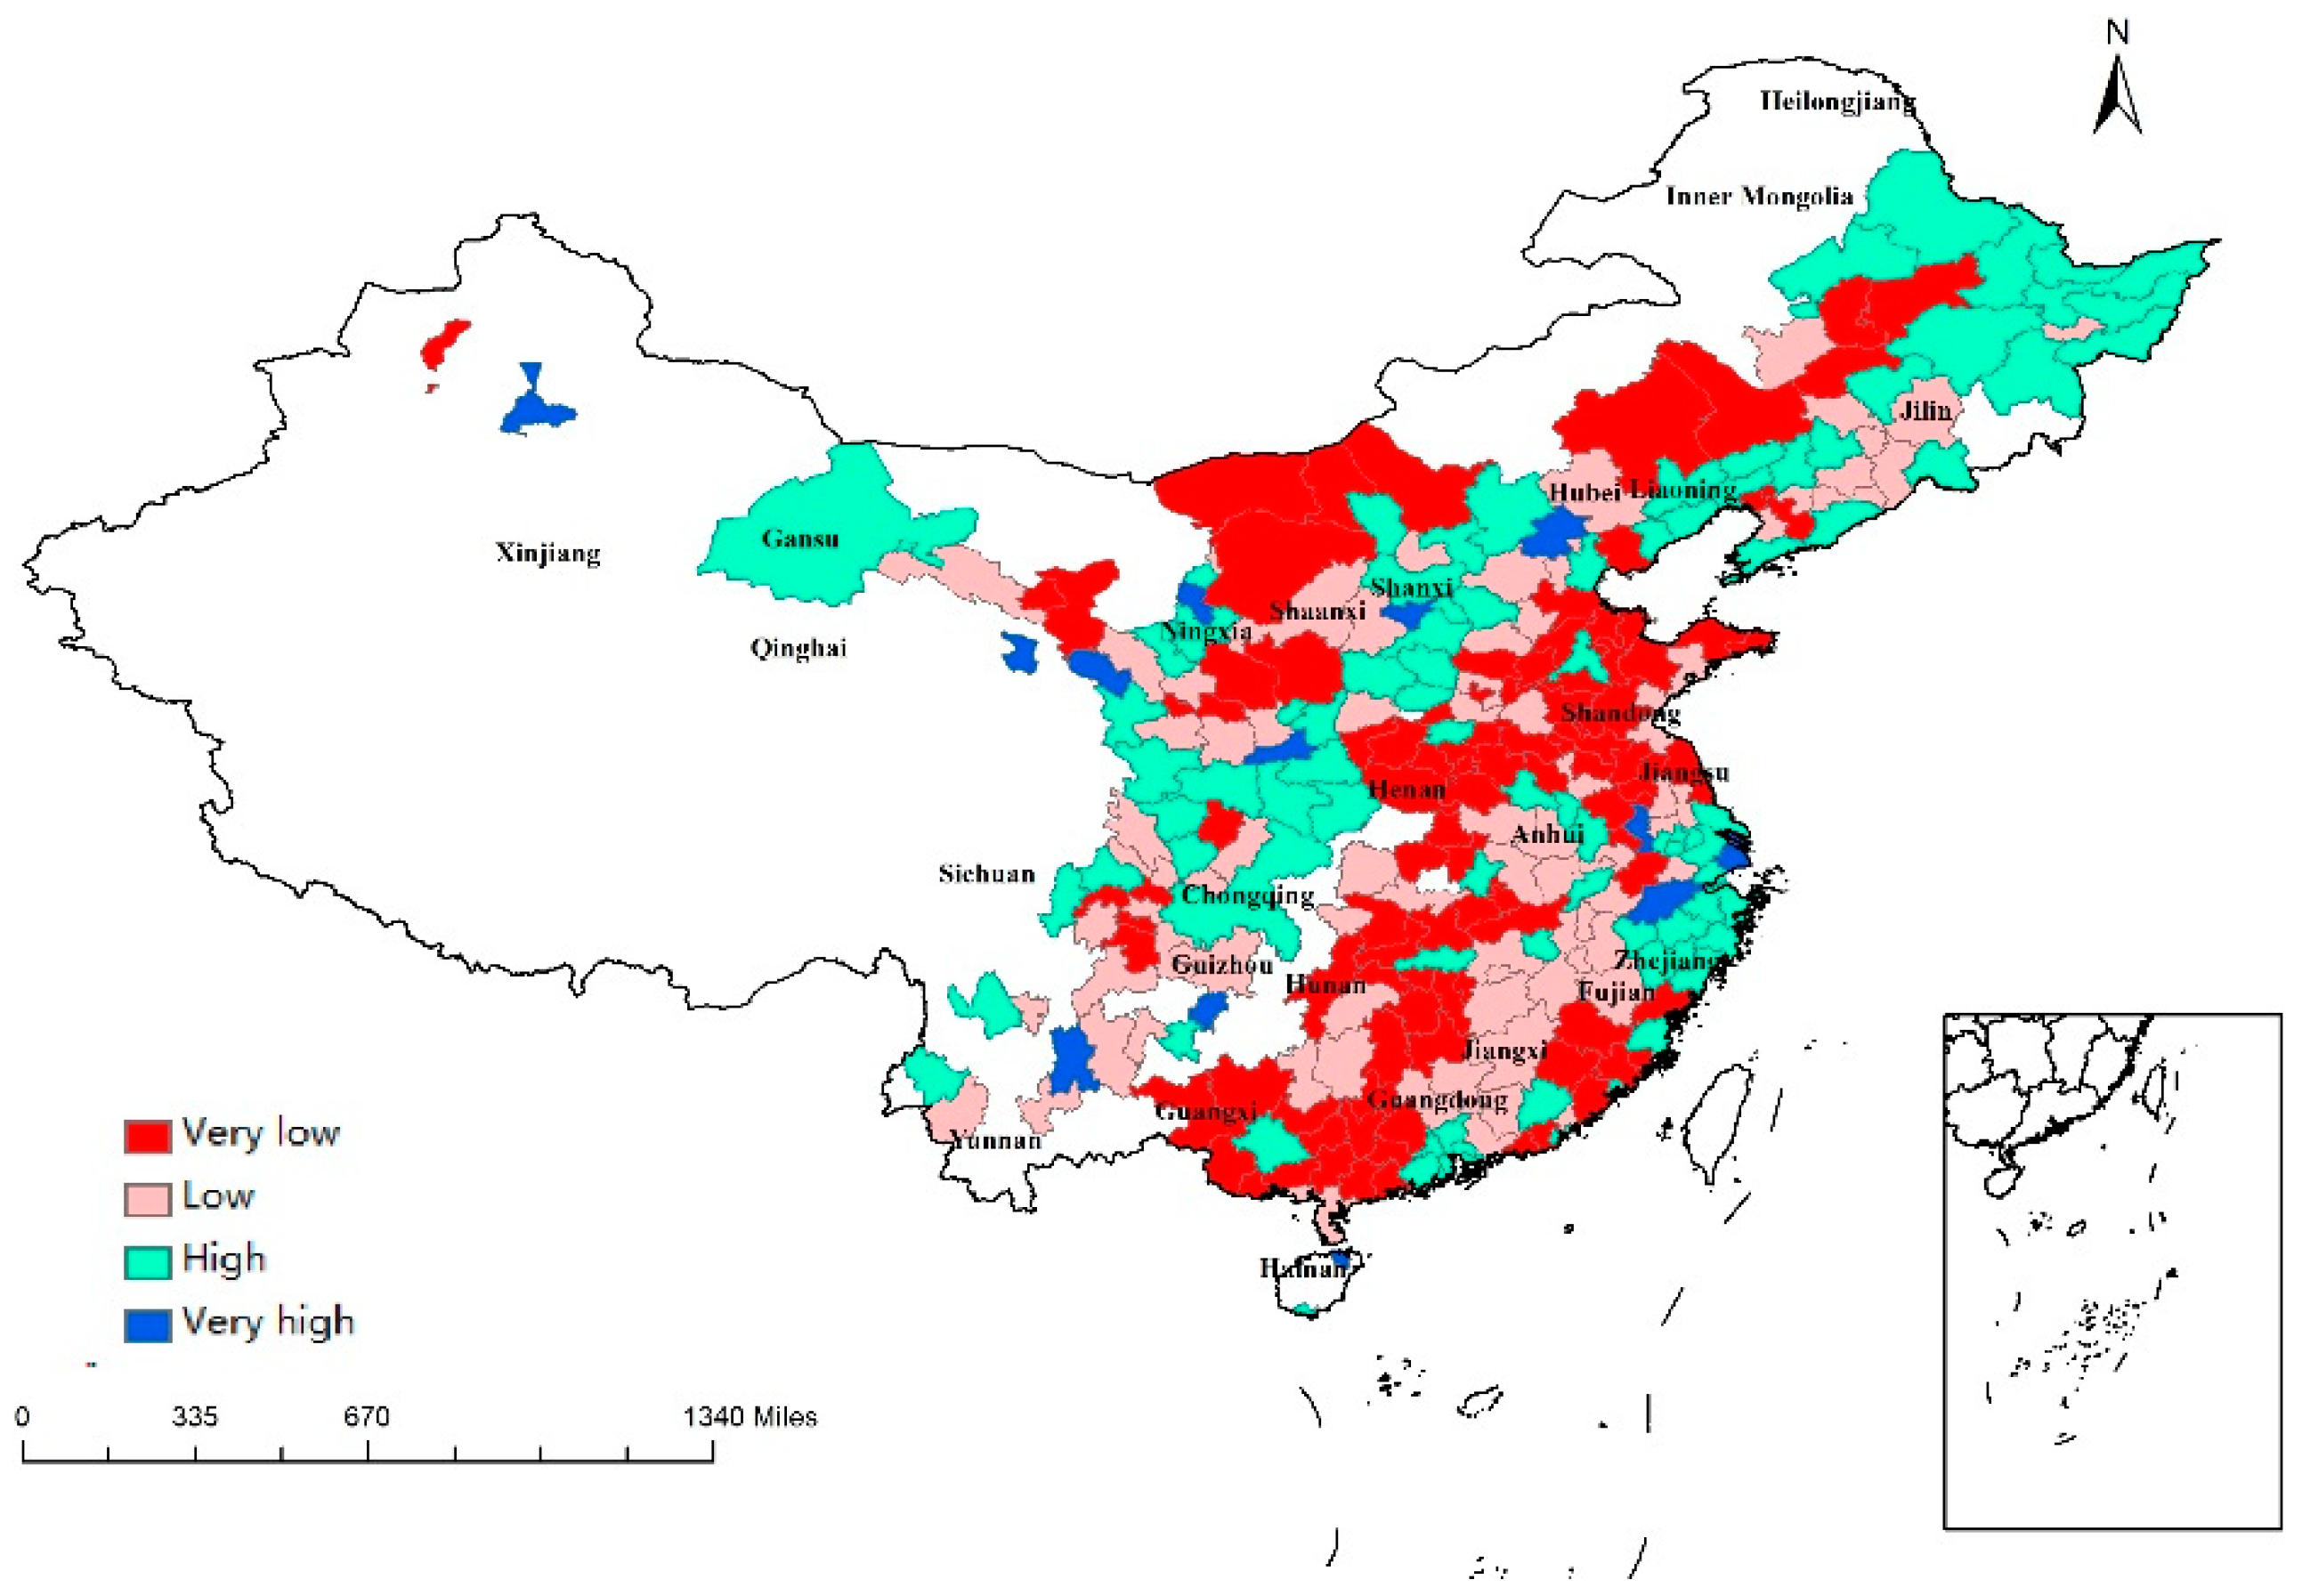
3.1. National- and Province-Based Regional Economic Resilience

This study computed the national-based and province-based regional economic resilience of 284 cities (As shown in Table A1 in Appendix A.1). The average national-based resilience was −0.02. For small cities, the average resilience (−0.11) was lower than that of large cities (0.14). The average resilience of resource-based economies was 0.05, while the average resilience of synthetic economies was −0.06. The spatial distribution of national-based regional economic resilience is portrayed in Figure 1, which illustrates the disparity in the ability of regions to resist and recover from the economic crisis. The regional economic resilience was clearly affected by provincial patterns. Significant differences were indicated between eastern and northeastern China. More precisely, most cities in Zhejiang, Jiangsu, Fujian, and Shandong were resilient to recession. Conversely, most cities in Heilongjiang, Jilin, and Liaoning were not resilient to economic crisis. Furthermore, a heterogeneity of resilience could be observed within provinces, such as Guangdong, Anhui, and Hunan. Guangdong was the province with the highest dispersion of resilience to economic downturn; resilience ranged from Dongguan (7.12) to Jieyang (−1.31). However, a homogeneous pattern existed in some provinces, such as Heilongjiang and Liaoning.
Figure 2 shows the geographical distribution of province-based regional economic resilience. Heilongjiang was the province with the widest dispersion of resilience; resilience ranged from 3.44 (Mudanjiang) to −4.43 (Hegang). Eighteen of the 25 provincial capital cities were more resilient to recession than their provincial average, indicating their improved capabilities to withstand and recover from external shocks.

3.2. Determinants of Regional Economic Resilience

The results of multilevel logistic regression models are presented in Table 2, Table 3 and Table 4. This study accounted for the multicollinearity problem and found no multicollinearity between variables. This study also computed the ICC as discussed in the previous section. The ICC for all regions was 0.22 (0.18 for small regions and 0.20 for large regions); the values being above 0.059 indicated the need for multilevel regression.
Table 2 presents a negative relationship between income inequality (GINI) and regional economic resilience in the multilevel logistic regression model and the logit model. A 1% increase in GINI could decrease resilience 0.015 times in the multilevel logistic regression model and 0.224 times in the logit model. This result supports the findings by Lewin et al. (2018) indicating that income inequality has a negative impact on regional resilience according to 639 US urban counties from 2006 to 2010 [35]. Rahe (2019) extended this study to all counties in the United States and considered unemployment [36]. They found that high income inequality may increase the unemployment rate in counties with a large population and reduce the unemployment rate in the smallest counties. Severe income inequality decreases a region’s ability to withstand recession. As income inequality intensifies, income is largely concentrated in the hands of high-income families. The overall marginal propensity of an economy to consume is expected to decline; thus, the recession may be exacerbated and lead to a lower resilience [35]. The highest GINI was found in eastern, western, and northeastern China, such as Heilongjiang, Beijing, Guangdong, and Zhejiang (Figure 3).
Table 2 shows a negative relationship between government intervention (GOV) and regional resilience in both models, supporting the earlier findings by Guo and Xu (2019). Guo and Xu (2019) found a negative relationship between GOV and regional resilience using data from 27 provinces in China between 2005 and 2016 [41]. The government has to provide financial assistance in the face of external shocks. Although this assistance may be effective in the recovery from crisis, in the long run, it may cause regional dependence on fiscal expenditure and weaken viability under the crisis. The regions with a low level of GOV were mainly located in the east of China, and the regions with a high level of GOV were found in the northern regions (Figure 4). The government has decided to first develop eastern China since reform and opening-up in 1978. This policy has allowed great progress in east cities, along with less government intervention in more developed regions.
On the contrary, the results in Table 2 indicate a significant positive effect of innovation (INNO) in shaping regional resilience. Technology-driven innovation was expressed by the fiscal expenditure for science and technology (support for science and technology activities) in this study. Zeng (2018) suggested that the relationship between innovation and regional resilience is positive according to a study of 31 provinces of China from 2006 to 2015 [60], while Bristow and Healy (2018) also found a positive relationship between innovation capacity and regional resilience using the data of European regions between 2001 and 2011 [61]. Innovation is an essential factor to enhance the competitiveness and resilience of regions [62,63]. Technology-driven innovation may help regions to break negative path dependence, promote industrial transformation and upgrading, and build ability to deal with economic crisis. The innovation process changes the dynamic ability of firms; thus, regions with more innovative entrepreneurs are more resilient [19]. The geographical distribution of INNO is portrayed in Figure 5. Cities in eastern China also had a higher level of innovation due to the “reform and opening-up” policy.
Furthermore, this study found a significant positive relationship between human capital (HUMCAP) and regional resilience (Table 2). Investments in education may improve human resources and increase productivity, which may explain differences across regions during growth and crisis periods [64]. Di Caro (2015) used years of education attainment to measure human capital from 1992 to 2012 in Italy and found a positive relationship between human capital and economic resilience [65]. Crescenzi et al. (2016) also took human capital into account and found a positive relationship between human capital and regional resilience by studying NUTS 2 regions of European countries from 2004 to 2010 [62], while Östh (2015) also found a positive relationship between education attainment and spatial economic resilience [66]. Generally speaking, cities with high human capital and knowledge production may have high productivity and high return on skills, which makes these areas more attractive to companies and labor. In addition, the concentration of people with high human capital is conducive to the growth of consumption facilities [67]. This in turn further attracts human capital and talent [68]. The geographical distribution of HUMCAP is portrayed in Figure 6. Similar to the geographical distribution of INNO, due to a higher level of development, talented people were more likely to agglomerate in high-technology cities, mostly located in eastern China.
In addition, there was a significantly positive relationship between financial-development level (FIN) and the ability of cities to resist and recover from the economic crisis in both models. More precisely, the odds of regions with a high financial-development level to resist and recover from the recession were 2.73 times greater than of those with a poor financial-development level for all regions in the multilevel logistic model. This result is consistent with a previous study by Eraydin (2015) indicating a positive relationship between the financial-development level and regional performance to resist and recover from economic downturn according to Turkish regions [42]. Moreover, Du et al. (2019) adopted data from the Pearl River Delta of China from 2008–2016 and found that FIN has a positive impact on regional resilience [43]. After entering the adjustment period, the reallocation of production resources and the transformation and upgrading of industrial structure are inseparable from the support of the financial sector [19]. In addition, Du et al. (2019) also suggested that regions with more bank deposits and loans may perform better during and after the financial crisis [43]. The geographical distribution of FIN is portrayed in Figure 7. In order to test the robustness of the above results, this study provided robust test by changing measurement of economic resilience in Table A2 in Appendix A.2.
In order to explore whether the size of an economy may influence regional economic resilience, this study divided the sample into small and large economies to run a multilevel logistic regression model. The relationship between GINI and resilience was negative in both models. However, the relationship between INNO and resilience was weak in both cases, with only the value in small regions being significant at the 10% level. There was a significantly negative relationship between GOV and regional resilience for both small economies and large economies. According to Table 3, HUMCAP had a statistically significant impact on regional resilience in both cases. Table 3 also shows the highly positive contribution of FIN for both small and large economies, supporting the earlier findings by Du et al. (2019) and Eraydin (2015) [42,43]. Large regions with a high manufacturing industry (INDO) were more resilient to economic downturn than regions with low manufacturing shares, which is consistent with the studies by Brown and Greenbaum (2016), Su and Zhao (2020), and Di Caro and Fratesi (2018) [54,69,70]. Above all, the GINI, GOV, HUMCAP, and FIN of cities of different sizes had a significant impact on regional economic resilience. Large economies were more sensitive to GINI, FIN, and INDO, whereas small economies were more sensitive to INNO and HUMCAP. This may be because large economies usually take advantage of agglomeration economies, whereas small economies need more innovation and human capital to promote their development.
In addition, this study further analyzed whether the resource hierarchy influences post-crisis performance. According to Table 4, the relationship between GINI and resilience was negative for both resource-based economies and synthetic economies. In particular, INNO, as one of the most important determinants of regional economic resilience, had a highly significant positive impact on resilience for both resource-based economies and synthetic economies. Moreover, the impact of INNO on the resilience of synthetic economies was higher than that of resource-based economies. GOV had a negative impact on regional performance for both economies, but this was only significant for synthetic economies. For synthetic economies, the relationship between FIN and resilience was positive. However, FIN had a negative impact on resilience for resource-based economies unlike the other models. This may be because resource-based economies primarily rely on exploitation and processing of natural resources, and they may have been influenced by international resource price fluctuation due to the financial crisis [45]. Thus, the cost of resource-based economies is higher. Furthermore, this study found a positive effect of investment in fixed assets (FASSE) on regional economic resilience for synthetic economies, which is consistent with the previous findings [45,71]. For resource-based cities with a singular industrial structure, governments should promote their development by getting rid of the inertia of resource dependence. Thus, building a diversified regional system could improve the correlation and adhesion between enterprises and promote the spillover of knowledge and innovation.
This study analyzed determinants of regional economic resilience from 2003–2018, which included the 2008 financial crisis. The government issued four trillion CNY to boost the economy in 2010. With the implementation of this policy, China’s economy maintained a high growth rate in the short term, such that most China’s cities showed strong resilience. However, this policy caused negative effects as well, such as a waste of resources, increased government liabilities, overcapacity, and a high leverage of enterprise. With the Chinese government’s economic growth target lowered year by year, the government gradually turned to the “new normal” stage in 2011, focusing on the quality of growth rather than speed. Regions located in the south and east of China are more developed than regions located in the west and northeast of China. As we discussed above, eastern China performed better during and after financial crisis, while Western China encountered a deeper recession. Thus, in order to build resilient cities, decreasing the level of income inequality and government intervention and increasing innovation, human capital agglomeration, and financial development are important for the long-term development of economies.
Building on previous research, this study explored how pre-crisis determinants impact post-crisis performance that may contribute to mitigate short-term recession of regional economies. Firstly, this study divided the period to pre-crisis and post-crisis, which could unveil the connection between the pre-crisis path and the capability of an economy to resist and recover from shocks. Besides, the methodology of this study was a multilevel logistic regression by using nested data (284 cities nested in 30 provinces), which was more appropriate for exploring both provincial and regional effects. Due to different specialization of cities and province-based policy, it is important to take both provincial and regional influencing factors into account. Moreover, this study also considered the size of economies and the resource hierarchy, which may contribute to developing policies according to the characteristics of economies. Finally, this study analyzed 284 cities in China, which could contribute to the resilience literature in developing counties.
The limitations of our study consist in the fact that the models lack attention paid to spatial and dynamic factors. Martin (2012) suggests that a dynamic rather than a static fashion may further improve resilience [3]. Further, the measurement of resilience was limited. Although we provided a robust test by replacing the measurement of resilience, there are emerging index and research methods to play roles in resilience. Additionally, the models did not contain policy factors. Strengthening regional-based policy is important to balance the capability of a region to resist and recover from external shocks. Finally, this study did not consider the renewal and reorientation ability. According to the concept of resilience, adjustment and path orientation are important to the sustainable development of economies.

4. Conclusions

This study analyzed regional economic resilience against the background of the 2008 financial crisis. According to the nested data for 284 Chinese prefecture-level and above prefecture-level cities from 2003 to 2018, combined with relevant studies, this article built an empirical analysis of the factors influencing regional economic resilience. The aim of this study was to find the internal connection between the period of growth (pre-crisis) and the recession (post-crisis). Thus, the results shown above indicated this connection. The results showed that pre-crisis determinants such as income inequality, innovation, government intervention, human capital, and financial development had a significant effect on regional economic resilience. The model results revealed that the financial-development level is the factor with the greatest positive impact on economic resilience, while government intervention had a strong negative impact on economic resilience. The positive impact of financial development was highest for large and synthetic economies, whereas the negative impact of government intervention was highest for small and resource-based economies. Improvements in the financial-development level across Chinese cities can help economies to build greater resilience. Less government intervention may reduce regional dependence on fiscal expenditure and enhance the viability of regional economies under the crisis.
We also found statistically significant differences for both national-based resilience and province-based resilience. Due to the development strategy built by the government, large economies and synthetic economies are mostly located in eastern and coastal China. Economies in eastern and coastal (such as Fujian, Zhejiang) China were more resilient when facing external shocks, which may be related to their lower income inequality and government intervention as well as their higher innovation, human capital, and financial-development level.
Taking into account the diversity of regions, this study provided evidence for the government to design region-based policies that could determine and develop high-quality governance and improve the efficiency of regional response mechanisms to build a resilient wall to defend against external shocks and to form a basis for sustainable development. Regional policies could target areas more prone to recession and could introduce structural policies to alleviate labor-market friction in these areas.
Future studies could further investigate the renewal and reorientation ability and could emphasize the long-term process of realizing the adjustment and path orientation of regional economic systems. Therefore, in the future, researchers could expand the data and optimize index selection by different means to deeply analyze the long-term evolution and influencing factors of regional economic resilience. Moreover, the impact of regional development policies on regional resilience should not be ignored. Future resilience evaluation frameworks should include policy factors, and innovative research should be conducted with diversified research perspectives and emerging research data and research methods.

Author Contributions

Conceptualization, X.W. and M.L.; methodology, X.W. and M.L.; software, X.W. and M.L.; formal analysis, X.W. and M.L.; data curation, M.L.; writing—original draft preparation, X.W. and M.L.; writing—review and editing, X.W. and M.L.; supervision, X.W.; funding acquisition, M.L. All authors have read and agreed to the published version of the manuscript.

Funding

This work was supported by the Fundamental Research Funds for the Central Universities (No. 18LZUJBWYJ059).

Institutional Review Board Statement

Not applicable.

Informed Consent Statement

Not applicable.

Data Availability Statement

The data used in this study are openly available from the National Bureau of Statistics in China and the “China Statistical Yearbook for Regional Economy” databases.

Conflicts of Interest

The authors declare no conflict of interest.

Appendix A

Appendix A.1. National- and Province-Based Regional Economic Resilience

Table A1. National- and province-based regional economic resilience of 284 cities.
CityidCityProvinceRNRP
1BeijingBeijing−0.11109
2TianjinTianjin−0.5843
3ShijiazhuangHebei−0.256771.463781
4TangshanHebei−0.87254−0.57746
5QinghuangdaoHebei−0.451490.818291
6HandanHebei−0.95008−0.83451
7XingtaiHebei−1.54113−2.79384
8BaodingHebei−0.20541.634082
9ZhangjiakouHebei−0.666890.104271
10ChengdeHebei−0.322091.24727
11CangzhouHebei−0.93111−0.77162
12LangfangHebei−0.692890.018063
13HengshuiHebei−0.88639−0.62338
14TaiyuanShanxi0.1464821.404865
15DatongShanxi−1.48236−2.01179
16YangquanShanxi−0.516640.013896
17ChangzhiShanxi0.1628841.43927
18JinchengShanxi0.0286961.157797
19SuzhouShanxi0.2227031.564746
20JinzhongShanxi0.0987381.304717
21YunchengShanxi−0.96673−0.9302
22YizhouShanxi−1.31885−1.66882
23LinfenShanxi−0.376070.308768
24LvliangShanxi−1.50201−2.05301
25HuhehaoteInner Mongolia0.6471020.792586
26BaotouInner Mongolia−0.36959−0.31391
27WuhaiInner Mongolia−0.32789−0.26852
28ChifengInner Mongolia−0.34386−0.28591
29TongliaoInner Mongolia−0.030960.054636
30ErdorsInner Mongolia1.3520741.559825
31HailaerInner Mongolia−0.46514−0.4179
32BayanzhuoerInner Mongolia−0.047040.037131
33WulanchadeInner Mongolia−0.78522−0.76625
34ShenyangLiaoning0.1222881.644333
35DalianLiaoning−0.94366−0.86726
36AnshanLiaoning−0.263150.736152
37FushunLiaoning−1.23556−1.55503
38BenxiLiaoning−0.5994−0.05611
39DandongLiaoning−0.9087−0.78487
40JinzhouLiaoning−0.631−0.13056
41YingkouLiaoning−0.57080.011278
42FuxinLiaoning−0.86719−0.68706
43LiaoyangLiaoning−0.83911−0.62092
44PanjinLiaoning−1.13943−1.32853
45TielingLiaoning−0.430920.340866
46ZhaoyangLiaoning−0.023191.301552
47HuludaoLiaoning0.1776661.774813
48ChangchunJilin0.2885440.521485
49JilinJilin−0.32835−0.20693
50SipingJilin−0.85818−0.83254
51LiaoyuanJilin−0.77109−0.72971
52TonghuaJilin−0.89205−0.87253
53BaishanJilin−0.04210.131073
54SongyuanJilin0.4828410.750907
55BaichengJilin−0.46179−0.3645
56HaerbinHeilongjiang−1.57353−3.63828
57QiqihaerHeilongjiang−0.618370.755532
58JixiHeilongjiang−1.63553−3.9235
59HegangHeilongjiang−1.74667−4.43474
60ShuangyashanHeilongjiang−1.59252−3.72567
61DaqingHeilongjiang−1.4787−3.20207
62YichunHeilongjiang−1.05992−1.27564
63JiamusiHeilongjiang−1.00658−1.03028
64QitaiheHeilongjiang−0.81709−0.15858
65MudanjiangHeilongjiang−0.034573.44108
66HeiheHeilongjiang−1.46661−3.14645
67NeihuaHeilongjiang−0.274082.339288
68ShanghaiShanghai0.300459
69NanjingJiangsu1.5642610.412132
70WuxiJiangsu0.565437−0.13792
71XuzhouJiangsu0.461362−0.19523
72ChangzhouJiangsu0.301605−0.28321
73SuzhouJiangsu1.3731440.306884
74NantongJiangsu1.7962830.539905
75LianyungangJiangsu0.206234−0.33573
76HuaianJiangsu−0.12028−0.51554
77YanchengJiangsu0.164331−0.35881
78YangzhouJiangsu0.445947−0.20372
79ZhenjiangJiangsu1.0067410.105107
80TaizhouJiangsu0.720402−0.05258
81SuqianJiangsu−0.00178−0.45028
82HangzhouZhejiang0.7577830.657364
83NingboZhejiang−1.44516−1.41973
84WenzhouZhejiang0.2268930.156803
85JiaxingZhejiang−1.41941−1.39545
86HuzhouZhejiang1.117460.996493
87ShaoxingZhejiang0.1959930.127668
88JinhuaZhejiang1.3261051.193218
89QuzhouZhejiang0.9254760.815477
90ZhoushanZhejiang−0.19715−0.24302
91TaizhouZhejiang0.4047640.324512
92LishuiZhejiang−1.51561−1.48615
93HefeiAnhui1.088040.304413
94WuhuAnhui0.7019840.063241
95BengbuAnhui−0.58168−0.73868
96HuainanAnhui−0.46929−0.66846
97MaanshanAnhui0.7050130.065134
98HuaibeiAnhui−0.58149−0.73855
99TonglingAnhui−0.12867−0.45568
100AnqingAnhui0.476086−0.07788
101HuangshanAnhui1.0708050.293646
102ChuzhouAnhui−0.10749−0.44244
103FuyangAnhui0.9541130.220748
104SuzhouAnhui0.8901610.180797
105LiuanAnhui5.2681232.915741
106HaozhouAnhui2.3421631.087873
107ChizhouAnhui−1.57333−1.35817
108XuanchengAnhui0.7611450.1002
109FuzhouFujian0.8043−0.01145
110XiamenFujian1.4986960.369002
111PutianFujian2.5973350.970932
112SanmingFujian0.552555−0.14938
113QuanzhouFujian−0.00554−0.45515
114ZhangzhouFujian0.9324250.05875
115NanpingFujian0.586125−0.13098
116LongyanFujian−0.10543−0.50988
117NingdeFujian1.8752160.575293
118NanchangJiangxi0.5472590.215881
119JingdezhenJiangxi−0.307−0.45542
120PingxiangJiangxi−0.40354−0.53129
121JiujiangJiangxi−0.0971−0.29048
122XinyuJiangxi−1.07151−1.0562
123YingtanJiangxi0.721180.352553
124GanzhouJiangxi0.8256140.434621
125JianJiangxi−0.56886−0.6612
126YichunJiangxi1.4627790.935323
127FuzhouJiangxi−0.00998−0.22202
128ShangraoJiangxi0.225931−0.03663
129JinanShandong−0.66993−0.38758
130QingdaoShandong−1.43154−1.80071
131ZiboShandong−0.47438−0.02474
132ZaozhuangShandong−0.49694−0.06659
133DongyingShandong−0.67694−0.40058
134YantaiShandong−0.430250.057156
135WeifangShandong−0.6611−0.37118
136JiningShandong−0.362470.182921
137TaianShandong−0.276690.342082
138WeihaiShandong−0.55127−0.1674
139RizhaoShandong−0.370250.168486
140LinyiShandong1.8314044.253566
141DezhouShandong−0.315760.269583
142LiaochengShandong−0.293850.310232
143BinzhouShandong0.0408360.931233
144HezeShandong0.0702610.985831
145ZhengzhouHenan0.545240.282566
146KaifengHenan0.2693640.053586
147LuoyangHenan0.4152530.174676
148PingdingshanHenan−0.21199−0.34594
149AnyangHenan0.5917320.321155
150HebiHenan0.3061260.084099
151XinxiangHenan1.3004940.909436
152JiaozuoHenan−0.70323−0.75368
153PuyangHenan−0.42632−0.52384
154XuchangHenan0.057256−0.12247
155LuoheHenan0.3375410.110174
156SanmenxiaHenan−0.17706−0.31695
157NanyangHenan−0.23032−0.36116
158ShangqiuHenan0.5946040.323539
159XinyangHenan−0.10897−0.26044
160ZhoukouHenan0.072022−0.11021
161ZhumadianHenan0.4356570.191611
162WuhanHubei−0.20812−0.30838
163HuangshiHubei0.3807380.20592
164ShiyanHubei0.1632610.015978
165YichangHubei1.6291161.296238
166XiangfanHubei0.388120.212367
167EzhouHubei−0.42163−0.49486
168JinmenHubei0.4092570.230828
169XiaoganHubei−0.62101−0.66899
170JingzhouHubei1.1806860.904585
171HuanggangHubei−0.29478−0.38407
172XianningHubei−0.45912−0.5276
173SuizhouHubei1.1305190.860769
174ChangshaHunan0.8906770.869584
175ZhuzhouHunan0.181130.167953
176XiangtanHunan−0.92194−0.92282
177HengyangHunan−1.62677−1.61978
178ShaoyangHunan0.3975150.381923
179YueyangHunan−0.1575−0.1669
180ChangdeHunan2.0084141.974851
181ZhangjiajieHunan−0.52758−0.53285
182YiyangHunan−0.74386−0.74671
183ChenzhouHunan0.3590880.343925
184YongzhouHunan0.4740480.457603
185HuaihuaHunan0.3817260.366311
186LoudiHunan−1.51698−1.51121
187GuangzhouGuangdong−1.21975−1.23501
188ShaoguanGuangdong−0.50528−0.47093
189ShenzhenGuangdong0.4365370.536262
190ZhuhaiGuangdong−0.72095−0.70158
191ShantouGuangdong0.115970.193442
192FoshanGuangdong−0.40845−0.36739
193JiangmenGuangdong0.282940.372002
194ZhanjiangGuangdong0.2508710.337707
195MaomingGuangdong−0.17425−0.11692
196ZhaoqingGuangdong−1.22821−1.24405
197HuizhouGuangdong−0.53061−0.49802
198MeizhouGuangdong−0.45549−0.41769
199ShanweiGuangdong0.5357520.642365
200HeyuanGuangdong0.3795860.475357
201YangjiangGuangdong0.010070.08019
202QingyuanGuangdong−0.27257−0.22207
203DongguanGuangdong7.1234927.687429
204ZhongshanGuangdong−0.57192−0.5422
205ChaozhouGuangdong−0.038410.028346
206JieyangGuangdong−1.31475−1.3366
207YunfuGuangdong−1.20414−1.21831
208NanningGuangxi0.1380940.028772
209LiuzhouGuangxi0.4630530.322516
210GuilinGuangxi−1.11879−1.10738
211WuzhouGuangxi−0.14081−0.22334
212BeihaiGuangxi0.8008930.627905
213FangchenggangGuangxi−0.09698−0.18372
214QinzhouGuangxi−0.20268−0.27927
215GuigangGuangxi1.1896210.979292
216YulinGuangxi1.3977791.167455
217BaiseGuangxi0.2778510.155104
218HezhouGuangxi−0.3003−0.36751
219HechiGuangxi−0.37315−0.43337
220LaibinGuangxi−0.08068−0.16899
221ChongzuoGuangxi−0.18622−0.26439
222HaikouHainan0.756012−0.10631
223SanyaHainan2.0805340.567777
224ChongqingChongqing−0.0118
225ChengduSichuan1.3877730.847688
226ZigongSichuan0.3461220.041645
227PanzhihuaSichuan−1.07356−1.05692
228LuzhouSichuan0.6819120.301484
229DeyangSichuan0.169929−0.0947
230MianyangSichuan−1.40085−1.31018
231GuangyuanSichuan−0.31248−0.46799
232SuiningSichuan−0.2908−0.45121
233NeijiangSichuan−0.59552−0.68701
234LeshanSichuan−1.27323−1.21143
235NanchongSichuan0.6814860.301154
236MeishanSichuan0.5977250.236339
237YibinSichuan−0.61184−0.69964
238GuanganSichuan1.5352550.96181
239DazhouSichuan0.7166450.328361
240YaanSichuan−1.44421−1.34373
241BazhongSichuan0.5435640.194429
242ZiyangSichuan−0.2715−0.43628
243GuiyangGuizhou−0.3080.267204
244LiupanshuiGuizhou−0.101590.645183
245ZunyiGuizhou−2.29372−1.36893
246AnshunGuizhou0.5486631.835948
247KunmingYunnan0.007942−0.14291
248QujingYunnan1.0384970.733414
249YuxiYunnan0.306010.110551
250BaoshanYunnan0.4836550.26161
251ShaotongYunnan−0.54346−0.61179
252LijiangYunnan0.9633030.669473
253SimaoYunnan0.2126450.031159
254LincangYunnan−0.11591−0.24823
255XianShaanxi0.1210280.211093
256TongchuanShaanxi−1.02695−1.02912
257BaojiShaanxi−0.10214−0.03001
258XianyangShaanxi−0.87945−0.86977
259WeinanShaanxi−0.82571−0.8117
260YananShaanxi0.2643790.365962
261HanzhongShaanxi0.0327310.115703
262YulinShaanxi−0.10492−0.033
263AnkangShaanxi1.1140781.283927
264ShangluoShaanxi0.6788290.813709
265LanzhouGansu0.6777630.515168
266JiayuguanGansu0.9065220.721757
267JinchangGansu0.3430990.212937
268BaiyinGansu−0.20667−0.28355
269TianshuiGansu−0.18993−0.26844
270WuweiGansu0.2259930.107179
271ZhangyeGansu−0.469−0.52046
272PingliangGansu−0.11815−0.20362
273JiuquanGansu−0.04386−0.13652
274QingyangGansu0.4889240.344629
275DingxiGansu−0.7664−0.78904
276LongnanGansu−0.89582−0.90592
277XiningQinghai−0.18809
278YinchuanNingxia−0.041790.059206
279ShizuishanNingxia−0.066510.031879
280WuzhongNingxia0.2170870.345368
281GuyuanNingxia−0.11229−0.01872
282ZhongweiNingxia−1.14909−1.16481
283UrumqiXinjiang0.2988190.130162
284KelamayiXinjiang−0.55072−0.60906
Source: calculated by using data from the National Bureau of Statistics: 2004–2019.

Appendix A.2. Robust Test

In order to test the robustness of the results, this study changed the calculation method of regional economic resilience. We followed Martin et al. (2016) [72] and used a counterfactual indicator to measure resilience.
( Δ E i t ) c = g N t , t 1 E i t 1
where g N t , t 1 is the national employment growth rate, E i t represents the employment rate of region i, t − 1 is the turning year into economic crisis (2008), and t represents the end year of the economic recovery period (2018). Then, the measurement of counterfactual resilience is as follows:
R C = [ ( Δ E i t ) ( Δ E i t ) c ] / | ( Δ E i t ) c |
The result shown in Table A1 is consistent with the baseline results above (Table 2), which shows that the baseline estimation in this study is robust.
Table A2. Odds ratios of pre-crisis (2003–2007) determinants of counterfactual resilience using a multilevel logistic regression model.
Two-Level Logistic Model
GINI0.011 *
INNO2.102 ***
GOV0.030 ***
HUMCAP1.624 **
FIN2.316 ***
INDO1.014
FASSE1.940
AGE651.280
ENTR0.876
Constant0.002 **
Log likelihood−386.885
p-value0.000
No of obs284
*** significant at the 0.01 level (2-tailed). ** significant at the 0.05 level (2-tailed). * significant at the 0.1 level (2-tailed). Source: calculated by using data from the National Bureau of Statistics: 2004–2019.

References

  1. NBER. Business Cycle Dating Committee. 2010. Available online: http://www.nber.org/cycles/sept2010.html (accessed on 9 July 2021).
  2. Han, Y.; Goetz, S.J. The Economic Resilience of U.S. Counties during the Great Recession. Rev. Reg. Stud. 2015, 45, 131–149. [Google Scholar] [CrossRef]
  3. Martin, R.L. Regional economic resilience, hysteresis and recessionary shocks. J. Econ. Geogr. 2012, 12, 1–32. [Google Scholar] [CrossRef]
  4. Clark, J.; Bailey, D. Labour, work and regional resilience. Reg. Stud. 2018, 52, 741–744. [Google Scholar] [CrossRef] [Green Version]
  5. Acuti, D.; Bellucci, M.; Manetti, G. Company disclosures concerning the resilience of cities from the Sustainable Development Goals (SDGs) perspective. Cities 2020, 99, 102608. [Google Scholar] [CrossRef]
  6. Croese, S.; Green, C.; Morgan, G. Localizing the Sustainable Development Goals Through the Lens of Urban Resilience: Lessons and Learnings from 100 Resilient Cities and Cape Town. Sustainability 2020, 12, 550. [Google Scholar] [CrossRef] [Green Version]
  7. Ma, F.; Wang, Z.; Sun, Q.; Yuen, K.F.; Zhang, Y.; Xue, H.; Zhao, S. Spatial–Temporal Evolution of Urban Resilience and Its Influencing Factors: Evidence from the Guanzhong Plain Urban Agglomeration. Sustainability 2020, 12, 2593. [Google Scholar] [CrossRef] [Green Version]
  8. Zhai, G.; Li, S.; Chen, J. Reducing Urban Disaster Risk by Improving Resilience in China from a Planning Perspective. Hum. Ecol. Risk Assess. Int. J. 2015, 21, 1206–1217. [Google Scholar] [CrossRef]
  9. Zhu, S.; Li, D.; Feng, H.; Gu, T.; Hewage, K.; Sadiq, R. Smart city and resilient city: Differences and connections. Wiley Interdiscip. Rev. Data Min. Knowl. Discov. 2020, 10, e1388. [Google Scholar] [CrossRef]
  10. Mera, A.P.; Balijepalli, C. Towards improving resilience of cities: An optimisation approach to minimising vulnerability to disruption due to natural disasters under budgetary constraints. Transportation 2019, 47, 1809–1842. [Google Scholar] [CrossRef]
  11. Moore, E.A.; Russell, J.D.; Babbitt, C.W.; Tomaszewski, B.; Clark, S.S. Spatial modeling of a second-use strategy for electric vehicle batteries to improve disaster resilience and circular economy. Resour. Conserv. Recycl. 2020, 160, 104889. [Google Scholar] [CrossRef]
  12. Fratesi, U.; Rodríguez-Pose, A. The crisis and regional employment in Europe: What role for sheltered economies? Camb. J. Reg. Econ. Soc. 2016, 9, 33–57. [Google Scholar]
  13. Faggian, A.; Gemmiti, R.; Jaquet, T.; Santini, I. Regional economic resilience: The experience of the Italian local labor systems. Ann. Reg. Sci. 2017, 60, 393–410. [Google Scholar] [CrossRef]
  14. Martin, R.; Gardiner, B. The resilience of cities to economic shocks: A tale of four recessions (and the challenge of Brexit). Pap. Reg. Sci. 2019, 98, 1801–1832. [Google Scholar] [CrossRef]
  15. Briguglio, L.; Cordina, G.; Farrugia, N.; Vella, S. Economic Vulnerability and Resilience: Concepts and Measurements. Oxf. Dev. Stud. 2009, 37, 229–247. [Google Scholar] [CrossRef]
  16. NBS. China Statistical Yearbook for Regional Economy. 2020. Available online: http://www.stats.gov.cn/tjsj/tjcbw/ (accessed on 3 November 2021).
  17. NBS. China City Statistical Yearbook. 2019. Available online: http://www.stats.gov.cn/tjsj/ (accessed on 3 November 2021).
  18. National Bureau of Statistics. Available online: http://www.stats.gov.cn/ (accessed on 3 November 2021).
  19. Martin, R.; Sunley, P. On the Notion of Regional Economic Resilience: Conceptualisation and Explanation. Pap. Evol. Econ. Geogr. 2015, 15, 1–42. [Google Scholar] [CrossRef] [Green Version]
  20. Holling, C.S. Resilience and Stability of Ecological Systems. Annu. Rev. Ecol. Syst. 1973, 4, 1–23. [Google Scholar] [CrossRef] [Green Version]
  21. Pendall, R.; Foster, K.A.; Cowell, M. Resilience and regions: Building understanding of the metaphor. Camb. J. Reg. Econ. Soc. 2009, 3, 71–84. [Google Scholar] [CrossRef] [Green Version]
  22. Pike, A.; Dawley, S.; Tomaney, J. Resilience, Adaptation and Adaptability. Camb. J. Reg. Econ. Soc. 2010, 3, 59–70. [Google Scholar] [CrossRef]
  23. Fingleton, B.; Garretsen, H.; Martin, R. Shocking aspects of monetary union: The vulnerability of regions in Euroland. J. Econ. Geogr. 2015, 15, 907–934. [Google Scholar] [CrossRef]
  24. Hill, E. Economic shocks and regional economic resilience. In Building Resilient Regions: Institute of Governmental Studies; University of California: Berkeley, CA, USA, 2012. [Google Scholar]
  25. Simmie, J.; Martin, R. The economic resilience of regions: Towards an evolutionary approach. Camb. J. Reg. Econ. Soc. 2010, 3, 27–43. [Google Scholar] [CrossRef] [Green Version]
  26. Oliva, S.; Lazzeretti, L. Adaptation, adaptability and resilience: The recovery of Kobe after the Great Hanshin Earthquake of 1995. Eur. Plan. Stud. 2017, 25, 1–21. [Google Scholar] [CrossRef]
  27. Rose, A. Economic resilience to natural and man-made disasters: Multidisciplinary origins and contextual dimensions. Environ. Hazards 2007, 7, 383–398. [Google Scholar] [CrossRef]
  28. Rajan, R.G. Fault Lines: How Hidden Fractures Still Threaten the World Economy; Economics Books; Princeton University Press: Princeton, NJ, USA, 2010; Volume 23, pp. 151–155. [Google Scholar]
  29. Brescia, R.H. The Cost of Inequality: Social Distance, Predatory Conduct, and the Financial Crisis. Soc. Sci. Electron. Publ. 2010, 66, 641. [Google Scholar]
  30. Martins, N.O. Globalisation, Inequality and the Economic Crisis. New Political Econ. 2011, 16, 1–18. [Google Scholar] [CrossRef]
  31. Tridico, P. Financial crisis and global imbalances: Its labour market origins and the aftermath. Camb. J. Econ. 2012, 36, 17–42. [Google Scholar] [CrossRef]
  32. Forbes, K.J. A Reassessment of the Relationship Between Inequality and Growth. Am. Econ. Rev. 2000, 90, 869–887. [Google Scholar] [CrossRef] [Green Version]
  33. Frank, M.W. Inequality and Growth in the United States: Evidence from A New State-Level Panel Of Income Inequality Measures. Econ. Inq. 2009, 47, 55–68. [Google Scholar] [CrossRef]
  34. Partridge, M.D. Does Income Distribution Affect U.S. State Economic Growth? J. Reg. Sci. 2010, 45, 363–394. [Google Scholar] [CrossRef]
  35. Lewin, P.A.; Watson, P.; Brown, A. Surviving the Great Recession: The influence of income inequality in US urban counties. Reg. Stud. 2017, 52, 781–792. [Google Scholar] [CrossRef]
  36. Rahe, M.; Weber, B.; Wu, X.; Fisher, M. Income Inequality and County Economic Resistance to Job Loss during the Great Recession. Rev. Reg. Stud. 2019, 49, 129–147. [Google Scholar] [CrossRef]
  37. Bathelt, H.; Munro, A.K.; Spigel, B. Challenges of Transformation: Innovation, Re-bundling and Traditional Manufacturing in Canada’s Technology Triangle. Reg. Stud. 2013, 47, 1111–1130. [Google Scholar] [CrossRef] [Green Version]
  38. Filippetti, A.; Archibugi, D. Innovation in times of crisis: National Systems of Innovation, structure, and demand. Res. Policy 2011, 40, 179–192. [Google Scholar] [CrossRef]
  39. Acs, Z.J.; Armington, C.; Zhang, T. The determinants of new-firm survival across regional economies: The role of human capital stock and knowledge spillover. Pap. Reg. Sci. 2007, 86, 367–391. [Google Scholar] [CrossRef]
  40. Wolman, H. Coping with Adversity: Regional Economic Resilience and Public Policy; Cornell University Press: Ithaca, NY, USA, 2017. [Google Scholar]
  41. Guo, J.; Xu, Z. Research on the influence of industrial related variety on regional economic resilience-Analysis of threshold effect based on regional innovation level. Sci. Technol. Prog. Policy 2019, 36, 39–47. [Google Scholar]
  42. Eraydin, A. Attributes and Characteristics of Regional Resilience: Defining and Measuring the Resilience of Turkish Regions. Reg. Stud. 2015, 50, 600–614. [Google Scholar] [CrossRef]
  43. Du, Z.; Zhang, H.; Ye, Y.; Jin, L.; Xu, Q. Urban shrinkage and growth: Measurement and determinants of economic resilience in the Pearl River Delta. J. Geogr. Sci. 2019, 29, 1331–1345. [Google Scholar] [CrossRef] [Green Version]
  44. Cuadrado-Roura, J.R.; Maroto, A. Unbalanced regional resilience to the economic crisis in Spain: A tale of specialisation and productivity. Camb. J. Reg. Econ. Soc. 2016, 9, 153–178. [Google Scholar] [CrossRef]
  45. Tan, J. Regional economic resilience of resourceSociety, 2016. n Spainuential factors during economic crises in China. Growth Change 2020, 51, 362–381. [Google Scholar] [CrossRef]
  46. Doran, J.; Fingleton, B. Employment Resilience in Europe and the 2008 Economic Crisis: Insights from Micro-Level Data. Reg. Stud. 2016, 50, 644–656. [Google Scholar] [CrossRef]
  47. Christopherson, S.; Michie, J.; Tyler, P. Regional resilience: Theoretical and empirical perspectives. Camb. J. Reg. Econ. Soc. 2010, 3, 3–10. [Google Scholar] [CrossRef]
  48. Briguglio, L. Conceptualising and Measuring Economic Resilience. Building the Economic Resilience of Small States; Briguglio, G.C.L., Kisanga, E.J., Eds.; Malta, Islands and Small States Institute of the University of Malta and London, Commonwealth Secretariat: London, UK, 2006. [Google Scholar]
  49. Cellini, R.; Torrisi, G. Regional Resilience in Italy: A Very Long-Run Analysis. Reg. Stud. 2014, 48, 1779–1796. [Google Scholar] [CrossRef] [Green Version]
  50. Fingleton, B.; Garretsen, H.; Martin, R. Recessionary shocks and regional employment: Evidence on the resilience of U.K. Regions. J. Reg. Sci. 2012, 52, 109–133. [Google Scholar] [CrossRef]
  51. LaGravinese, R. Economic crisis and rising gaps North-South: Evidence from the Italian regions. Camb. J. Reg. Econ. Soc. 2015, 8, 331–342. [Google Scholar] [CrossRef]
  52. Giannakis, E.; Bruggeman, A. Regional disparities in economic resilience in the European Union across the urban–rural divide. Reg. Stud. 2019, 54, 1200–1213. [Google Scholar] [CrossRef]
  53. Giannakis, E.; Papadas, C.T. Spatial Connectivity and Regional Economic Resilience in Turbulent Times. Sustainability 2021, 13, 11289. [Google Scholar] [CrossRef]
  54. Di Caro, P.; Fratesi, U. Regional determinants of economic resilience. Ann. Reg. Sci. 2017, 60, 235–240. [Google Scholar] [CrossRef] [Green Version]
  55. Cosci, S.; Sabato, V. Income and Employment Dynamics in Europe. Reg. Stud. 2007, 41, 295–309. [Google Scholar] [CrossRef]
  56. Ezcurra, R.; Rapún, M. Regional Disparities and National Development Revisited: The Case of Western Europe. Eur. Urban Reg. Stud. 2006, 13, 355–369. [Google Scholar] [CrossRef]
  57. Hox, J.J. Multilevel Analysis: Techniques and Applications, 2nd ed.; Quantitative methodology series; Marcoulides, G.A., Ed.; Routledge: New York, NY, USA, 2010. [Google Scholar]
  58. Cohen, J. Statistical Power Analysis for the Behavioral Sciences, 2nd ed.; Eribaum: Mahwah, NJ, USA, 1988; Volume 31, pp. 499–500. [Google Scholar]
  59. Montgomery, D.C.; Peck, E.A.; Vining, G.G. Introduction to Linear Regression Analysis; Wiley: New York, NY, USA, 2012. [Google Scholar]
  60. Zeng, B. Research on the influencing factors of China’s provincial economic resilience under the background of financial crisis. Financ. Theory Teach. 2018, 150, 78–93. [Google Scholar]
  61. Bristow, G.; Healy, A. Innovation and regional economic resilience: An exploratory analysis. Ann. Reg. Sci. 2017, 60, 265–284. [Google Scholar] [CrossRef] [Green Version]
  62. Crescenzi, R.; Luca, D.; Milio, S. The geography of the economic crisis in Europe: National macroeconomic conditions, regional structural factors and short-term economic performance. Camb. J. Reg. Econ. Soc. 2016, 9, 13–32. [Google Scholar] [CrossRef]
  63. Chapple, K.; Lester, T.W. The resilient regional labour market? The US case. Camb. J. Reg. Econ. Soc. 2010, 3, 85–104. [Google Scholar] [CrossRef] [Green Version]
  64. Rodríguez-Pose, A. Do Institutions Matter for Regional Development? Reg. Stud. 2013, 47, 1034–1047. [Google Scholar] [CrossRef] [Green Version]
  65. Di Caro, P. Testing and explaining economic resilience with an application to Italian regions. Pap. Reg. Sci. 2015, 96, 93–113. [Google Scholar] [CrossRef]
  66. Östh, J.; Reggiani, A.; Galiazzo, G. Spatial economic resilience and accessibility: A joint perspective. Comput. Environ. Urban Syst. 2015, 49, 148–159. [Google Scholar] [CrossRef]
  67. Shapiro, J.M. Smart Cities: Quality of Life, Productivity, and the Growth Effects of Human Capital. Rev. Econ. Stat. 2006, 88, 324–335. [Google Scholar] [CrossRef]
  68. Florida, R. Cities and the Creative Class; Routledge: New York, NY, USA; London, UK, 2005. [Google Scholar]
  69. Brown, L.; Greenbaum, R.T. The role of industrial diversity in economic resilience: An empirical examination across 35 years. Urban Stud. 2016, 54, 1347–1366. [Google Scholar] [CrossRef]
  70. Su, R.; Zhao, X. Research on Urban Manufacturing Development, Entrepreneurial Vitality and Economic Resilience. Financ. Econ. 2020, 9, 79–92. [Google Scholar]
  71. Tan, J.; Zhang, P.; Lo, K.; Li, J.; Liu, S. Conceptualizing and measuring economic resilience of resource-based cities: Case study of Northeast China. Chin. Geogr. Sci. 2017, 27, 471–481. [Google Scholar] [CrossRef] [Green Version]
  72. Martin, R. How Regions React to Recessions: Resilience and the Role of Economic Structure. Reg. Stud. 2016, 50, 561–585. [Google Scholar] [CrossRef] [Green Version]
Figure 1. National-based resilience across 284 cities.
Sustainability 14 00809 g001
Figure 2. Province-based resilience across 279 cities. Source: portrayed by using file from Ministry of Natural Resources, People’s Republic of China.
Sustainability 14 00809 g002
Figure 3. Regional values of GINI.
Sustainability 14 00809 g003
Figure 4. Regional values of GOV.
Sustainability 14 00809 g004
Figure 5. Regional values of INNO.
Sustainability 14 00809 g005
Figure 6. Regional values of HUMCAP.
Sustainability 14 00809 g006
Figure 7. Regional values of FIN, classified into four quartiles (very low to very high). Source: portrayed by using file from the Ministry of Natural Resources, People’s Republic of China.
Sustainability 14 00809 g007
Table 1. Descriptive statistics of nine explanatory variables used in regression models.
VariablesDefinitionMinimumMaximumAverage
GINIGini coefficient0.060.440.19
INNOLn (fiscal expenditure for science and technology)5.7513.269.51
GOV(Public finance expenditure—fiscal expenditure for science and technology)/gross regional product (%)0.040.490.11
HUMCAPLn (number of students in colleges and universities per 10,000)−3.774.190.64
FINBalance of bank deposits and loans/gross regional product0.736.581.86
INDOGrowth rate of total industrial output (%)4.70134.1260.51
FASSEInvestment in fixed assets/gross regional product (%)16.0093.4446.17
AGE65Share of population older than 65 years (%)8.6716.2012.33
ENTREmployment in urban individual economy and private economy/population (%)2.0021.006.29
Source: National Bureau of Statistics: 2004–2019.
Table 2. Odds ratios of pre-crisis (2003–2007) determinants of national-based resilience using a multilevel logistic regression model and a logistic model for province-based resilience.
Two-Level Logistic ModelLogit Model
GINI0.015 **0.224 *
INNO1.779 **1.444 *
GOV0.874 ***0.904 ***
HUMCAP1.657 **1.763 *
FIN2.731 ***3.059 ***
INDO1.0061.011
FASSE1.0001.003
AGE655.0360.916
ENTR0.9220.881
Constant0.007 *0.024 *
Log likelihood−411.004356.293
p-value0.0000.000
No. of obs.284279
*** significant at the 0.01 level (2-tailed). ** significant at the 0.05 level (2-tailed). * significant at the 0.1 level (2-tailed). Source: calculated by using data from the National Bureau of Statistics: 2004–2019.
Table 3. Odds ratios of pre-crisis (2003–2007) determinants of national-based regional economic resilience, using a multilevel logistic regression model for 182 small regional economies (left) and 102 large regional economies (right).
Small EconomiesLarge Economies
GINI0.015 *0.019 *
INNO1.944 *0.876
GOV0.889 **0.770 **
HUMCAP1.611 ***1.560 *
FIN2.502 ***5.776 ***
INDO0.9921.046 *
FASSE1.0090.990
AGE651.2833.275
ENTR0.9500.903
Constant0.001 **0.586
Log likelihood−266.506−146.468
p-value0.0180.018
No. of obs.182102
*** significant at the 0.01 level (2-tailed). ** significant at the 0.05 level (2-tailed). * significant at the 0.1 level (2-tailed). Source: calculated by using data from the National Bureau of Statistics: 2004–2019.
Table 4. Odds ratios of pre-crisis (2003–2007) determinants of national-based regional economic resilience, using a multilevel logistic regression model for 108 resource-based economies (left) and 176 synthetic economies (right).
Resource-Based EconomiesSynthetic Economies
GINI0.045 *0.026 *
INNO1.985 **2.065 **
GOV0.9680.752 ***
HUMCAP1.7491.507 ***
FIN0.267 *2.814 ***
INDO1.0190.990
FASSE0.9691.025 *
AGE655.4934.623
ENTR0.9050.944
Constant0.001 *0.005 *
Log likelihood−157.695−255.217
p-value0.0110.003
No. of obs.108176
*** significant at the 0.01 level (2-tailed). ** significant at the 0.05 level (2-tailed). * significant at the 0.1 level (2-tailed). Source: calculated by using data from the National Bureau of Statistics: 2004–2019.
Publisher’s Note: MDPI stays neutral with regard to jurisdictional claims in published maps and institutional affiliations.

