
A Way to Europe: New Refugees’ Migration Patterns Revealed


1
Department of Economic Informatics and Cybernetics, Bucharest University of Economic Studies, 010374 București, Romania
2
Department of Statistics and Econometrics, Bucharest University of Economic Studies, 010374 București, Romania
*
Author to whom correspondence should be addressed.
Sustainability 2022, 14(2), 748; https://doi.org/10.3390/su14020748
Submission received: 11 December 2021
/
Revised: 27 December 2021
/
Accepted: 8 January 2022
/
Published: 11 January 2022
(This article belongs to the Special Issue Sustainability of Labor Migration and Its Impact on Economic Development in Europe)
Abstract
:The final destination country for refugees heading to Europe may be a changing one depending on various factors, such as the relocation program at the EU level, their ability to make decisions, geographic factors, finances, available routes, visa options, networks, chance, labor markets, etc., but for many of them their choices are limited. The purpose of this paper is to show how refugees select their destination countries, by looking at similarities across European countries. We aim to explain how country-specific factors may relate to the magnitude of migration flows, employing cluster and network analysis, and connecting meso- and macro-levels. The variables considered in our analysis fall under the four types of factors for host countries described by Van Hear, Bakewell, and Long (2012). Our analysis reveals that host countries in Europe can be grouped into four clusters: (i) Top Destination Economically Performing Countries; (ii) Emergent Destination Countries; (iii) Periphery and Less Economically Performing Countries; and (iv) Outlier Countries.
1. Introduction
Wars and civil wars, human rights violations, environment and climate change, and economic hardship are factors that may drive a large group of forcibly displaced persons, which may be internally displaced, refugees, asylum seekers, or economic migrants. The latest migration crisis (from 2015 to 2016) has brought back questions, such as how many immigrants will come to the European Union, how many of them will be vulnerable, what will be the transit routes, who will need support from host countries, and who will these host countries be?
As we have learnt from the previous waves, recent refugee and asylum seekers represent only a small share of total migration. However, they may represent a valuable resource for sustainable economic development. In 2016, in Germany the share of refugees and asylum seekers was about 10.5 percent of the total immigrant population. Irregular border crossing into the European Union (EU) peaked in 2015 at 1.8 million people but decreased to more than one third of the immigrant population in 2016. Only part of the migrants received the refugee status, while the asylum rejection rate was at about 40 percent in 2016. In the past, refugees experienced smaller return rates than other migrants [1].
Labor markets are one of the main mechanisms inducing migration, caused by the differences in wage levels between different countries. But according to Stark and Bloom (1985) [2], the decision to migrate is not made considering isolated individual factors. Instead, the focus is on households, maximizing income and employment opportunities, and minimizing risk. In light of new economic theories on labor migration, the decision to migrate can be seen to depend on many other variables besides wages, such as unemployment benefits, health care, investment opportunities, credit, and loans [3,4].
In 2007, the European Commission introduced a comprehensive global approach to migration, a mobility partnership between EU member states and third countries [5]. This partnership enabled circular migration. Chou (2009) [6] found two dimensions to this strategy, a repressive one (enforced through measures such as visas and return clauses) and a progressive one (establishing authorized routes for the migrants).
Different regulations apply for migrants found in diverse situations or national contexts, but the consequences may be that some of the migrants are safe, while others are left vulnerable depending on the national context of the host country [7].
In this context, this paper focuses on vulnerable migration into the EU within the frame of the Horizon 2020 research project: “MIMY Empowerment through Liquid Integration of Migrant Youth in Vulnerable Conditions”, which aims to improve the situations of young migrants throughout Europe. The paper capitalizes on the results of the macro-economic analysis from the project report “MIMY Public Report on the Influence of Youth Migration on Macro-Economic and Social Development in Main Receiving European Countries” [8].
The purpose of the present article is to explain the selection of the destination countries by finding similarities among European host countries and considering as determinants relevant factors that might influence migration from third countries. By employing cluster analysis, we aim to explore how and what country-specific factors may relate to the magnitude of migration flows. More specifically, the research question is what factors drive third-country nationals to immigrate.
The novelty of the paper is twofold. Firstly, we aim to explore new patterns of immigration of third-country nationals to Europe using macro-data and a mixed methodology cluster analysis and social network analysis (SNA). Secondly, the study depicts and connects two levels of analysis: meso- and macro-levels. In this paper the meso-level regards forms of social organization (through SNA) and the macro-level regards factors of migration (through cluster analysis).
We use social network analysis (SNA) to understand and explain the intensity of the migration flows from third countries to the EU. SNA is a useful tool for considering the meso-level of analysis [9], but it is important to connect the meso-level with the wider macro-level. Using different combinations of methodologies (with the advantages, but also difficulties, of mixed methods) allows us to better map immigration to Europe.
2. Migration Factors in a Changing World
The theory of migration, developed strongly since Ravenstein (1885) [10], listed the first laws of migration (i.e., most migration is over short distances, migration occurs in steps, most migrants are adults, large towns grow more by migration than by natural increase, internal migration rates are higher for females, migration increases with economic development, and migration is mostly related to economic causes). Lee (1966) [11] stated that migration volumes vary with the diversity of people and with the fluctuations registered in the economy. Although de Haas (2010) [12] described migration as a complex process, he specified that this process is neither chaotic nor unpredictable, and that one theory alone could not explain and predict all migration events.
Many researchers analyzed the determinants of migrants’ destinations [13,14,15] using international macro-data panels, including variables such as unemployment rate, GDP, colonial ties, and language. Others [16,17,18] build their analysis on micro-data panels. Geiss et al. (2013) found that high levels of education and health systems attract migrants, while migrants are deterred by generous pension systems. Furthermore, numerous studies used qualitative approaches based on interviews or focus groups [19].
Mydral (1957) [20] employed cumulative causation to explain the migration flows with respect to a process of cause and effect between different factors inducing international movement and the actions of the migrants. Massey (1998) [3] studied immigrant-sending communities and linked processes at micro- and macro-levels, explaining the dynamics of international migration flows. According to Mydral (1957) [20], the main cause of regional disparities has been the strong backwash effect and weak spread effect of migration, which means the developed regions are developing at a faster rate at the cost of undeveloped regions. So, when the backwash effect dominates, divergence will be developed, and when spread effect dominates, convergence will be developed.
Migration may be forced or voluntary, but in some cases distinguishing between the two forms is difficult. Usually, based on the literature, the determining factors of migration are divided into push and pull factors, where push factors are causing the migrants to leave home countries and pull factors attract migrants to a host country [11,21]. As de Hass (2010) [12] mentioned, the push–pull model is still popular in the literature, although there are limitations, such as it being a static model, and because factors are mirrored in both destination and host countries.
The neo-classical economic theory of migration considers migration to be a result of differences in the relative scarcity of labor [22].
Van Hear, Bakewell, and Long (2012) [23] found that in 2003 the former Department for International Development of the United Kingdom (also known as UK Aid) defined the drivers of change as “the interaction between structural features, formal and informal institutions and individual agents”. The same authors studied the context in which these drivers operated and shaped both forced and voluntary migration.
Ocampo-Gonzales and González-Becerril (2018) [24] studied the key drivers of internal migration in Columbia using The Migration out of Poverty’s “Drivers of Migration” theory. As drivers of migration do not work in isolation to initiate movement, the model factor was complemented with their “driver complexes” (which are actually combined drivers). As predisposing factors, the authors considered the conflict, but also the quality-of-life index, the unemployment and population levels per socio-economic strata, and the proximate factors related to criminality, and the precipitating factors were split into two categories: social control and economic control, and, as the mediating factors, social networks were considered.
Starting from the work of Richmond et al. (1994) [25], which divided the determinants of migration into proactive and reactive factors, Van Hear, Bakewell, and Long (2012) [23] presented these factors as having a wide range of functions in the migration process and classified them into four categories: (1) Predisposing factors which offer a general context in which migration is likely, including economic and environmental disparities and geographical factors, such as income per capita, expenditures on health and education, and level of school enrolment. These factors are shaped by the global macro-political economy [26]. (2) Proximate factors have a more direct bearing on migration and are related to both countries of origin and to destination countries. For the countries of origin, factors such as the phase of the business cycle, low security, and human rights, etc., were considered. For the destination countries, the factors included were the economic upturn, new employment opportunities, the chance to set up a business, and educational opportunities. However, higher development levels in the countries of origin will initially increase people’s capabilities and aspirations to migrate [27]. (3) Precipitating factors usually occur in the country of origin, but to some extent also in the destination country. Financial collapse, financial systems, levels of health, and the educational system can be included among the precipitating factors. Usually, these factors are those triggering the departure. (4) Mediating factors, which are usually considered to accelerate or consolidate migration, are divided into facilitating and constraining factors. The implication of national and international organizations has a high impact on migration, being a mediating and enabling factor. Education, agriculture, rural development, welfare, and housing may be both enabling and constraining factors.
In line with this categorization of migration factors, we employ the same typology [23] and attach macro-economic indicators for each factor. These will be further used as grouping variables for a cluster analysis that will associate European countries in similar classes. Our research hypothesis is that the clusters developed may be associated with the magnitude of the migration stocks and flows. Additionally, there are changes in the components of the clusters between 2015 and 2018.
Regardless of the considered theoretical framework, the topic addressed by this article is quite challenging, as the existing literature on choosing the destination country mainly uses a qualitative approach, and there is a lack of reliable and adequate statistical micro-data. In addition, there are also other factors, such as geographical, political, or cultural considerations, that may influence the selection of the destination country.
3. Data and Methods
3.1. The Network Analysis
We applied a network analysis as an initial research step to understand the magnitude of the immigrant stock and the directions of migration flows. Using data provided by the United Nations on the total migrant stock at mid-year by origin and by country of destination for 2019, we considered the destinations to be the EU-28 countries (except for Cyprus) plus Switzerland, Iceland, and Norway. As origins, we selected only countries with low or medium levels of human development, in accordance with the classification used by Eurostat and based on UN Human Development Index (HDI) for 2013. As such, we selected 30 destination countries and 94 origin countries (124 countries (nodes) in total). In 2019, 17,186,921 immigrants from countries with low and medium HDI were estimated to live in the EU-28 countries (except for Cyprus) plus Switzerland, Norway, and Iceland. To map the immigration process from countries with low or medium HDI, we employed techniques from network science. For this purpose, the countries of origin were considered as being sources (94 countries) and the countries of destinations as targets (30 countries). The weights were based on the number of people from source countries living in target countries.
The degree of a vertex represents the number of edges connected to this vertex. In a social network this variable shows the influence of a node over that network. The limitation of this measure is that it does not consider the global structure of the network. If the network is directed, a node will have two different degrees: an in-degree (the total numbers of incoming edges) and an out-degree (the total numbers of outgoing edges).
The average degree is calculated as the ratio of the total number of edges to the total number of nodes [28], showing the average number of connections that a node has.
The degree centrality is expressed as the proportion of connections that a node has, meaning that we divide the degree N(i) by (n − 1), where n is the number of nodes in the network (so n − 1 is the maximum number of connections the node can have). The degree centrality is calculated as:
We consider un undirected graph, where E represent the edges set and V the vertices set. Let , a weight function, where is the set of non-negative rational numbers. The weighted degree of a vertex in G is defined as:
3.2. The Cluster Analysis
The cluster analysis, applied in this paper for grouping the destination countries, is a data classification methodology used to divide objects (in our case EU-28 countries plus Norway) into several groups, by using a set of clustering variables. Cluster analysis is one of the highest levels of descriptive models for the grouping of countries [29].
The purpose of cluster analysis is to segregate groups so that objects included in a group are more similar to those in the same group (therefore are homogenous) than to those in other groups, even if objects (countries in our case) assigned to a group do not necessarily have all the same attributes. Clusters are created using variables that are either active or illustrative input variables. The active variables are often (but not always) numeric variables, while the illustrative variables are used for understanding the characteristics on which the clusters are based and, hence, for their interpretation [30].
There are several techniques for clustering, such as hierarchical methods and non-hierarchical methods, including K-means clustering, density-based, grid-based, and others [31]. Hierarchical methods are based on a tree approach and the strategies for this type of clustering are divided into two categories: agglomerative (each observation has its own cluster at the beginning and then different clusters merge) and divisive (all observations are included in one cluster at the beginning and then the cluster is split into two different clusters and the algorithm performs recursively). The formation of clusters in the non-hierarchical method also involves merging or splitting clusters, but without using a tree structure. In this case the data is grouped considering a maximization or a minimization of some evaluation criteria. Some advantages of using non-hierarchical methods are that the clusters are more reliable, the algorithms perform rapidly, and it is a relatively stable technique; however, the results are easier to read when using hierarchical clusters.
Further on in our analysis we employed non-hierarchical methods, namely K-means clustering, as these partitioning techniques are more flexible and allow objects to change group membership through the cluster-formation process. This method consists of four steps, namely the determination of centers, assigning points to clusters which are outside of the centers according to distance between centers and points, calculation of new centers, and repeating the previous steps until obtaining final clusters. With the K-means partitioning method we try to minimize the sum of the within-cluster variances. The limit of this method is that the number of the clusters should be chosen at the beginning of the analysis and therefore the starting partition affects the results. Therefore, we tested different numbers of clusters, selecting the results with the best (minimum) variances inside the clusters. The results of our cluster analysis provide a descriptive perspective of the European countries, contributing to a better understanding of the attractiveness of various groups of countries.
The K-means criterion applies to a set of entities represented as m-dimensional space points [32].
When considering two clusters K , we may specify (i) either the centers of the two clusters, denoted by and , (ii) or the two cluster partitions on I, denoted by and , such as and , and (iii) using both (i) and (ii) [32].
The Euclidian distance used by this algorithm between entity point and the center of the cluster is:
The K-means square-error criterion is defined as being the sum of the distances between the entities and the centers of the clusters, as follows:
The smaller the value is, the better the clusterization is.
Let be a partition, then the optimal centers of the clusters , with in relation with (2) are calculated as the mean of the points from :
where is the number of elements in .
So, the mean can be viewed as the aggregate representation of the clusters and will be further referred to as centroids.
Given a set of centroids , , the optimal clusters are determined using the rule of the minimum distance, meaning that every entity will be included in the clusters having the centroid, such as:
If the two distances between the entity and a centroid are equal, then the allocation is arbitrary.
As countries are grouped in clusters based on their similarities across a profile of variables, and the results are sensitive to the considered indicators, the selection of variables is a crucial step in the analysis. Following the factors suggested by Van Hear, Bakewell, and Long (2012) [23], we have selected the following indicators: GDP per capita, GINI index, inflation rate and youth unemployment rate as predisposing factors; corruption index and business freedom as proximate factors; severe material deprivation as a mediating factor; and healthy life-years at birth as a precipitating factor (see Table A1 and Table A2). Variables considered in the cluster analysis are either active or illustrative input variables. In the current analysis, the active variables are previously described, while the illustrative variables are used only for interpreting the results and are related to immigration, such as young asylum seekers and immigration flows. The source of data was Eurostat.
The indicators were selected to capture all the four categories of factors described by Van Hear, Bakewell, and Long (2012) [23] and to use the variables adequately covered with data. The correlation analysis (see Table A3 and Table A4) for 2015 and 2018 do not show significant relationships between the considered factors. The highest correlation coefficient in the 2015 matrix is 0.7, between the corruption index and GDP per capita. The countries were grouped into clusters using the K-means method, which required us to carefully specify the number of clusters. When choosing too many clusters, some of them will contain only one or two countries; when choosing only few clusters, a single cluster will include different patterns. Because of this, we decided to test the method for three or four distinct clusters.
The selection of the factors used in the current analysis is also supported by other recent evidence. Using data from the European Social Survey for the 2008–2016 period, Kogan and Shen (2019) [33] studied how the economy, democracy, and the quality of public goods (such as health and education systems) in the receiving societies contribute to life satisfaction. Using the ordinary least squares (OLS) regression analysis, the authors found that migrants coming from countries with less well-functioning economies to countries with more favorable economic conditions displayed higher levels of perceived satisfaction with host-country economies, which considerably contributed to their overall life satisfaction. Haller and Hadler (2006) [34] found that welfare state expenditure and political freedom (not only GDP and economic growth) correlate with individual life satisfaction. The wealthier the country is, the more satisfied its citizens are because of the high quality of educational, health, and legal systems [35]. But for immigrants, Kogan et al. (2018) [36] found that a country’s wealth level is not correlated with life satisfaction, but that the level of human development plays a crucial role.
In the final report of the Migrare Project (2019) [37], a cluster analysis (using the K-means algorithm) was performed to provide a systematic mapping and classification of European regions and metropolitan areas/cities with respect to the refugee influx, and their potential for a successful reception and integration of asylum seekers and refugees. The purpose of the cluster analysis was to identify regional typologies according to their “absorption” potential of immigrants and refugees, using a set of socio-economic indicators (such as demographic, economic, and labor market indicators, etc.). The results show that European regions may be grouped into six clusters related to the migration trajectory of asylum seekers.
4. Results and Discussion
4.1. The Illustrative Variables Used in the Cluster Analysis
We considered the following illustrative variables: the total number of non-EU immigrants, young asylum seekers in EU countries, and estimated immigrant stock from countries of origin with low or medium HDI living in 2019 in the EU-28 countries, and in Norway, Iceland, and Switzerland.
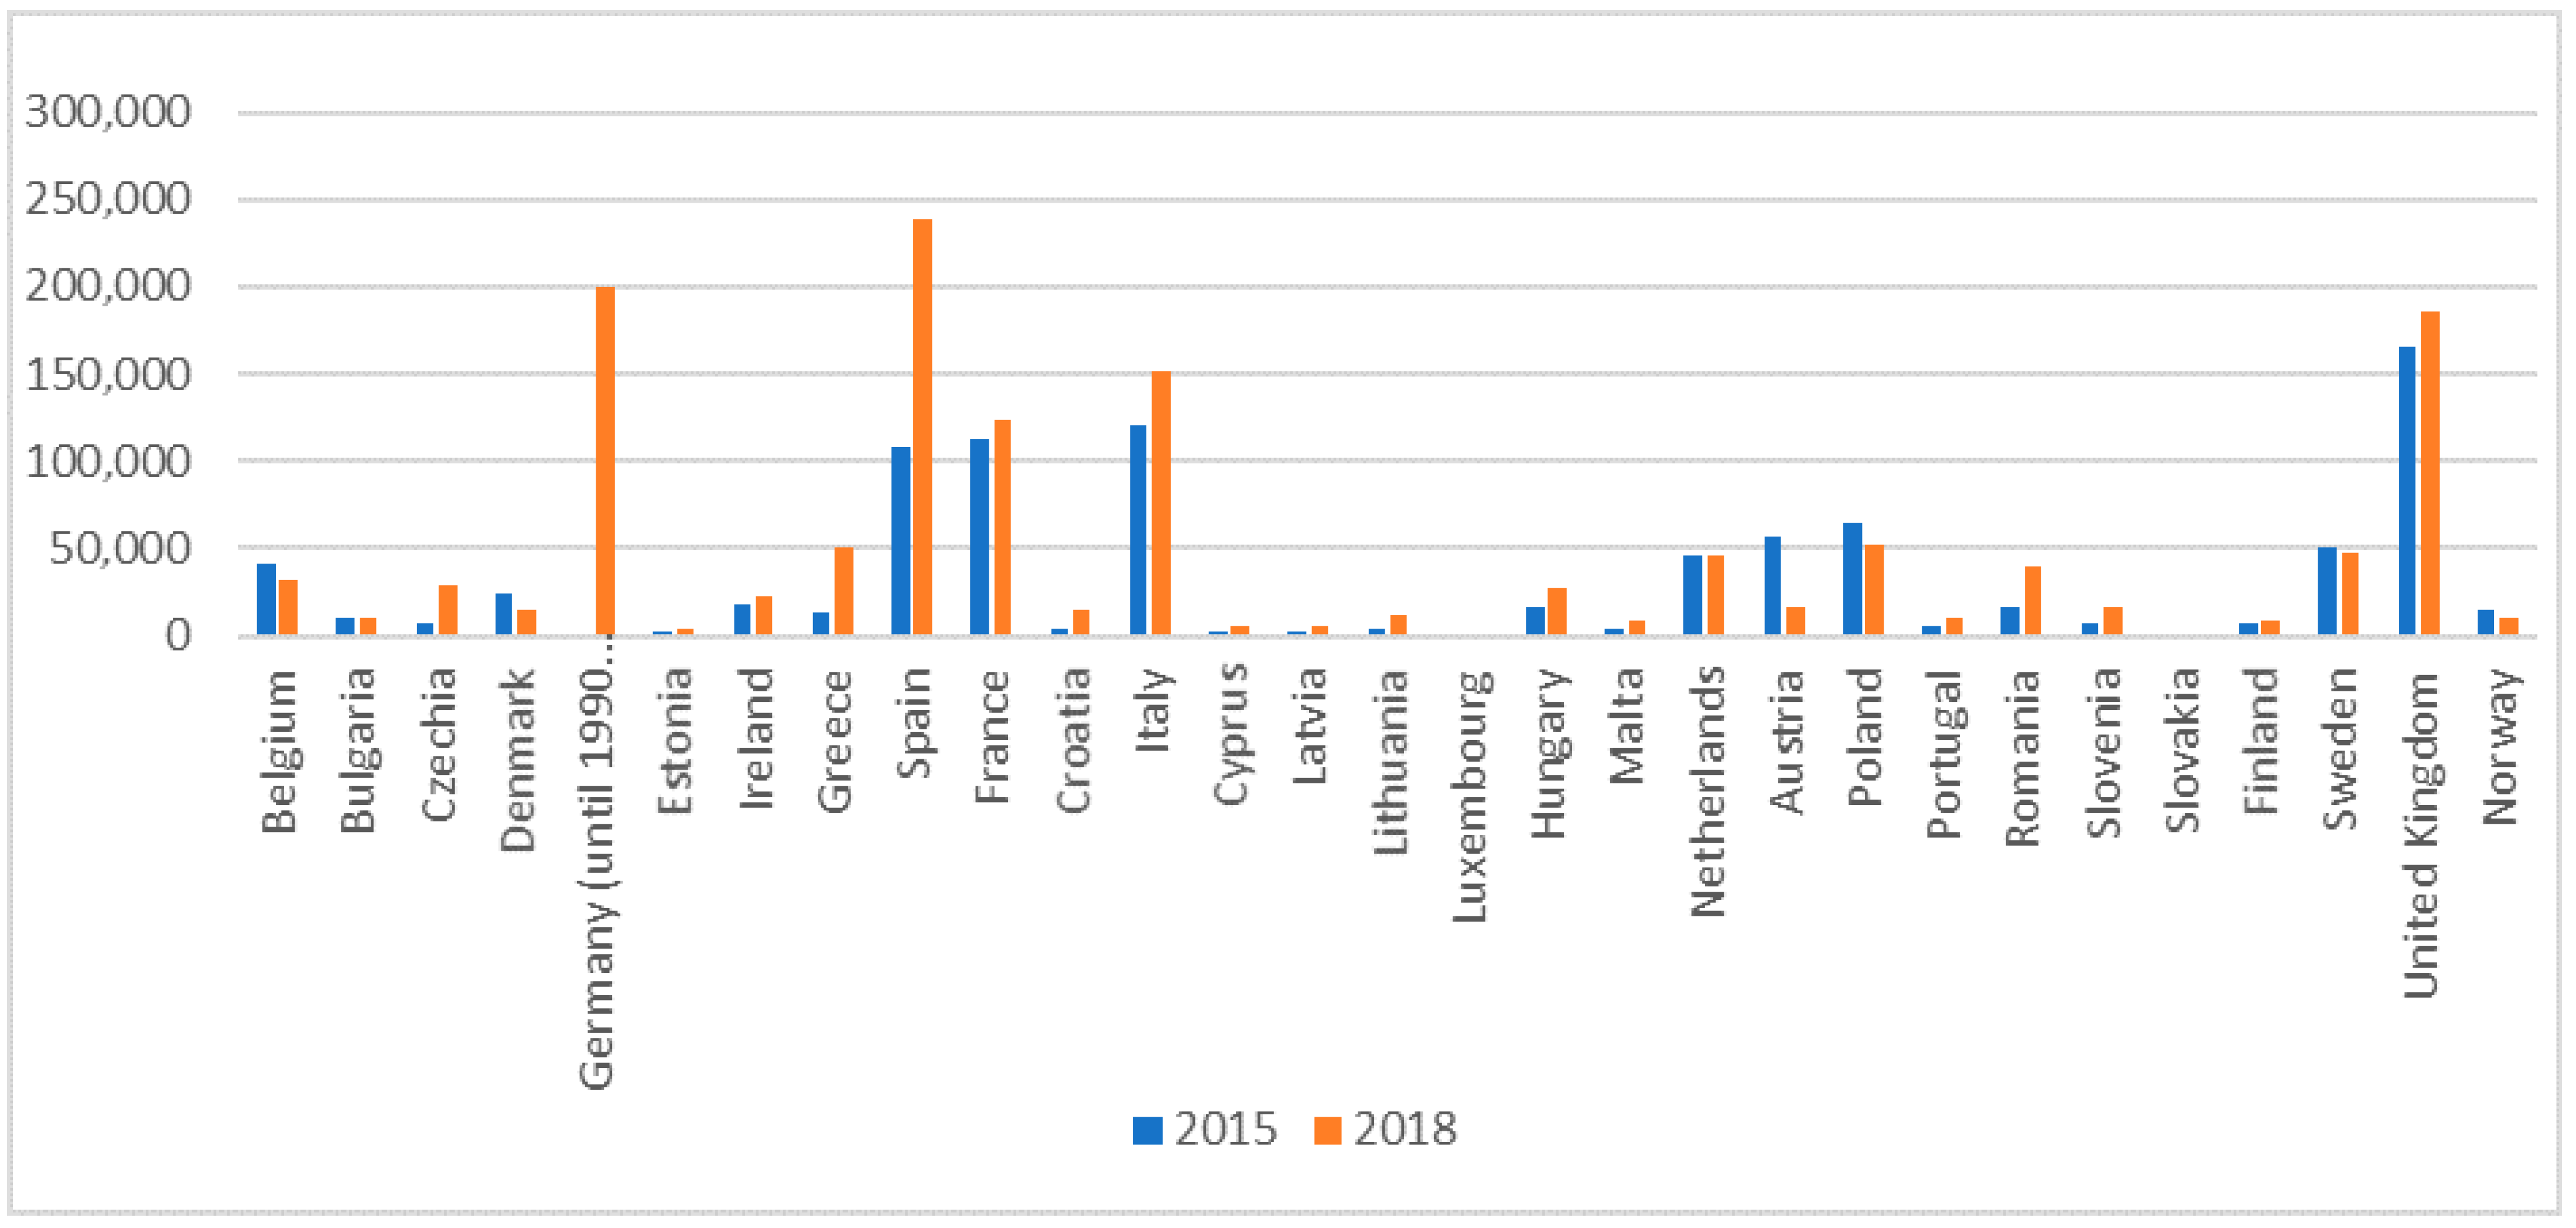
The total number of non-EU immigrants dropped about 14 percent in 2018 relative to 2015. The highest drop was registered in Germany (about 70%), followed by Austria (about 69%) and Norway (about 29%). But there are also countries where the number of immigrants from outside the EU increased, such as in the Czech Republic (about 3.98-fold), Croatia (about 3.97-fold), and Greece (about 3.66-fold); however, if we consider the absolute numbers, the highest increases are found in Spain, Italy, the Czech Republic, and the United Kingdom.
The top five destination countries in 2015 and 2018 are Germany, the United Kingdom, Italy, France, and Spain (see Figure 1, where the value for Germany in 2015 (677,381) was omitted from the chart, being an outlier).
Since 2010 the total number of asylum applications increased to more than double in EU-28 countries, with a peak in 2015 and 2016, registering an increase of almost five-fold. As the general trend of non-EU immigrants showed, more than one third of them were registered in Germany in 2015. In Italy, as well as in Romania, the peak was reached only in 2017. Some countries are having important shares of the total applications, such as Austria, the Netherlands, Sweden, and the United Kingdom. A special case is Hungary, a country found on the Syrian refugees’ path. In 2010, only 2095 applications for asylum were registered there, but in 2015 the number was of 177,135 applications.
As the asylum seekers are young persons (78.7% of asylum seekers in EU in 2020 were less than 35 years old and those in the age range 18–34 years were about 47.7% of all asylum seekers), we will concentrate on asylum seekers in the age range 18–34 years (as they choose their destination, usually the younger migrants follow their parents) and we found that the evolution follows the general trend. The peak was reached in 2015, when the application of the young immigrants represented about 53 percent of the total asylum applications. A third of them were reported in Germany, followed by Hungary (15%), Italy, and Sweden (each around 10%). About half of them are found in three countries, namely Germany, Italy, and Sweden. Hungary is found on the Syrian refugees’ path, but it is considered a transit country. As shown in Figure 2, significant variations in the numbers of young asylum seekers are found in the EU-28 countries and Norway.
4.2. Results from the Network Analysis
The network analysis provides a perspective of the intensity of the migration flows from third countries to the EU, valuable for understanding and explaining the results from the cluster analysis.
The receiving countries are shown in the center of Figure 3. These are the countries hosting immigrants from many origin countries, e.g., Italy (hosting immigrants from 92 countries), Sweden (91), France (91), Czech Republic (90), and the UK (90). In close vicinity to these countries, we find countries being less connected, like Germany (60), Hungary (70), and Portugal (51). The least connected countries are Slovakia (25), Malta (23), Romania (21), Croatia (19), Luxembourg (18), and Lithuania (12).
The origin countries most connected (having the highest values of out-degree) are China (immigrants from China chose 30 European countries as their destination), Egypt (30), India (29), Morocco (29), and the Republic of Moldova (29).
We group countries in three classes using the weighted degree; the results are presented in Table 1.
Out of the total number of immigrants whose countries of origin have low or medium HDI, the highest share went to the United Kingdom (22%), followed by France (16%), Italy (12.3%), Germany (12.1), and Spain (10). The lowest shares were found in Croatia, Lithuania, Slovenia, Estonia, Slovakia, Iceland, Latvia, Poland, Malta, Luxembourg, Bulgaria, Hungary, Ireland, Finland, Czech Republic, and Greece with less than 1 percent. Almost 40 percent of the immigrants from countries with low or medium HDI living in the United Kingdom are from India (23.7%) and Pakistan (15.6%). A total of 2,699,927 immigrants are living in France. The highest share there is from Morocco (37.7%), followed by immigrants from Vietnam (5.1%).
It is estimated that more than 2.1 million immigrants were living in Italy in 2019 coming from countries of origin with low or medium HDI. A total of 21.3% of them came from Morocco, 10.7% from China, 8.9% from the Republic of Moldova, 7.6% from India, 7.2% from Bangladesh, 5.7% from Egypt, and 5.3% from Pakistan.
More than 2 million immigrants from countries with small or medium HDI are living in Germany: 28% are from Syria, 9.9% are from Afghanistan, 9% are from Iraq, 5.6% are from China, 4.9% are from Vietnam, and 4.2% are from India. In 2019, 1.76 million immigrants coming from countries with low and medium HDI were living in Spain. Moroccans hold the highest share, more than 40%, followed by immigrants from the Dominican Republic (9.4%), China (9.3%), and Bolivia (8.5%).
The top five highest communities of immigrants living in an EU-28 country or in Norway, Iceland, or Switzerland are: Moroccans living in France (more than one million), followed by Indians in the United Kingdom (0.9 million), Moroccans in Spain (0.7 million), Pakistanis in the United Kingdom (0.6 million), and Syrians in Germany (0.58 million).
The largest diaspora in the considered destination countries consists of Moroccans (over 2.77 million, 88.8% from total diaspora, representing 16.1% of total immigrants from the countries considered in the study), followed by Indians (1.47 million, 8.4%, 8.6%), Chinese (1.14 million, 10.6%, 6.6%), and Syrians (1.05 million, 12.8%, 6.1%). Immigrants from the Republic of Moldova, the only origin country from Europe considered in the study are on the ninth position (0.47 million, 47%, 2.7%).
4.3. Results and Discussion of the Cluster Analysis
Cluster analyses were performed to group the EU-28 Countries and Norway; four distinct clusters were distinguished, using the factors that are influencing migration processes for two years between 2015 and 2018. The main aim of this analysis was to provide a systemic mapping and classification of the considered countries with respect to the predisposing, proximate, precipitating, and mediating factors for the host countries [23]. Therefore, we assess the attractiveness of each cluster for immigrants from third countries. The analysis was performed for both 2015 and 2018, to identify the potential changes over time within clusters. We selected 2015 because it was the year of the refugee crisis, while 2018 was the most recent year for which all the statistical data were available. Initially, all the EU-28 countries and Norway were considered for the analysis. However, we excluded Cyprus, Malta, and Luxembourg because of their small populations. To avoid a modelling bias caused by the special conditions of small countries, macro-economic analyses (on the national level) should mainly consider countries with a minimum of two million inhabitants [38].
If considering three clusters, we would have (1) countries with high numbers of young asylum applicants, such as Sweden, Germany, Italy, and Hungary; (2) countries with a medium number of applicants, such as Norway, Denmark, Finland, United Kingdom, Belgium, the Netherlands, and Bulgaria; and (3) countries with low numbers of applicants, such as Greece, Romania, Slovakia, the Czech Republic, Poland, Latvia, Lithuania, Estonia, Spain, Portugal, and Ireland.
At the European Union level (EU-28 and Norway), young asylum applicants are characterized by high heterogeneity in terms of origin country, so they may have different motivations to leave their home countries. Some of them are escaping wars (e.g., immigrants from Syria and Afghanistan) and others may be economic migrants in search of better living conditions. The top four countries of origin for young asylum seekers in 2015 and 2018 are Syria, Afghanistan, Pakistan, and Iraq. In 2015 these four countries accounted for half of asylum applications, and for a quarter of all young asylum in 2018.
Heterogeneity characterizes the citizenships of asylum seekers in the destination country as well. The Syrians’ destination countries are Germany, Belgium, Austria, Netherlands, Sweden, Norway, Denmark, or Cyprus, while Afghans seek for asylum in France, Slovakia, Hungary, and Bulgaria. In Poland, Estonia, and Lithuania the main citizenship of asylum seekers is Russian, while in Spain it is Venezuelan [39].
As the Eurostat data for the first quarter of the 2021 reveal, the number applicants decreased in most countries compared to the same period of the previous year. The highest decrease in percentage was registered in Hungary (85% fewer), Greece (77%), Finland (72%), Spain (66%), and Portugal (65%). By contrast, the highest increases were registered in Romania (151%) and Bulgaria (351%).
The results of the cluster analysis with four clusters provided the most promising and reliable results (as cluster analysis is a high-level descriptive method and it is an explorative analysis) for both 2015 and 2018. For the year 2018, the country distribution by clusters may be visualized in the following figure (Figure 4).
The four clusters are described and discussed in the remaining part of this section.
Cluster 1, called Top Destination Economically Performing Countries, includes France, Germany, Belgium, Sweden, Finland, Denmark, the United Kingdom, the Netherlands, Austria, and Norway.
Countries grouped in this cluster are the best economic performers, with high rates of GDP per capita, medium values for the Gini Index, high values of business freedom, low rates of severe material deprivation, small rates of youth unemployment rates in Germany and Belgium (and high for the rest), small values for “at-work poverty rate”, and the lowest rates on the corruption perception index.
This cluster absorbed about 74.5% of the total immigrants from outside the EU registered in the countries considered in the analysis in 2015 and 49.4% in 2018. In both 2015 and 2018, Germany registered the highest flow of youth immigrants in EU-28, followed by the United Kingdom.
It seems that countries in this cluster are not only the most desirable for migration [40], but they are also receiving immigrants from many home countries.
In 2015, except for France, Belgium, and the Netherlands, all the other countries grouped in this cluster registered high numbers of young asylum seekers (see Figure 3).
Except for Germany and Finland, the rest of the countries grouped together when using the weight degree method (see Table 1). Germany grouped in another cluster as immigrants from only 60 countries chose to live in Germany.
As reported by DG Migration (EC, 2015) [40], the most frequent destinations for smuggled migrants were Germany, Sweden, France, the United Kingdom, Austria, the Netherlands, Belgium, and Denmark, but their overriding aim was to make it “to Europe”. They considered a destination to be “a good country” if it offered favorable conditions for residence and work, as well as links to networks of relatives and compatriots.
The same cluster of countries are reported by Bellona (2015) [41] as being the most preferred by Eritrean migrants. Using a survey, the top destinations were found to be the Northern European countries.
Cluster 2, called Emergent Destination Countries includes the Czech Republic, Estonia, Spain, Italy, Latvia, Lithuania, Poland, Portugal, and Slovenia.
Countries in this cluster are characterized by medium levels of GDP per capita, Gini Index, corruption perception index, and business freedom. These countries are not among the most preferred third-country nationals’ destinations; however, the number of third-country nationals residing in Cluster 2 countries is increasing. If we consider only the flow of youth migration in Spain and Italy, we might expect to find these countries in the first cluster, but when also considering other socio-economic variables, Spain and Italy drop into the second cluster.
Except for Poland (which registered the lowest number of non-EU immigrants in 2017, and then increased this number), all the countries included in this cluster increased in the total amounts of immigration flow from non-EU countries. The non-EU immigrants included in this cluster stood for about 20% of the total number of the non-EU immigrants in the considered countries in 2015 and 37.5% in 2018. The Czech Republic and Lithuania had the highest increase in relative numbers, while Spain and Italy had the highest increase in absolute numbers.
When calculating the so-called “immigration surplus” for the Visegrad group, Balan (2016) [42] found that migration, although modest in its volume and scope, is very beneficial for the countries.
Skuflic et al. (2018) [43], when studying migration and the economic crisis using cluster analysis, found that Spain left the previous cluster due to negative growth rates in the pre-crisis period and due to rising unemployment rates. The paper also mentioned that Spain became a net emigration country in the same period. The same results were obtained by Manafi et al. (2017) [44], when the cluster analysis was employed to characterize the mobility trend in Europe using socio-economic macro-data. Izquierdo, Jimeno, and Lacuesta (2016) [45] found that Spain changed from being a destination country to a sending country after the economic crisis experienced in 2010.
When considering the weighted degree method (see Table 1), Spain and Italy grouped in the first cluster as immigrants from many countries chose to live in these two countries, and the previous trend is reflected in the total number of immigrants from older waves.
Cluster 3, called Periphery Countries/Less Economically Performing Countries (but on migration routes), includes Bulgaria, Greece, Croatia, Hungary, Romania, and Slovakia.
Countries grouped in this cluster are less economically performant than the countries included in the previous two clusters, having the lowest GDP per capita and business freedom values, the highest perceived corruption index, as well as the highest values of severe material deprivation.
The share of the non-EU immigrants included in this cluster increased from 3.8% in 2015 to 10.3% in 2018. The highest increase was registered in Greece, followed by Romania; Bulgaria saw a slight decrease, while in Slovakia the number of non-EU immigrants remained stable.
When considering the weighted degree method of grouping the countries (see Table 1), except for Greece, all the other countries grouped in the same cluster, but together with other countries included in the previous cluster of Emergent Destination Countries. One possible explanation is that the stock of immigrants includes immigrants from older waves and that the changes from the current new trend will only become apparent after some time.
Cluster 4, called “Outliers”, only includes one country: Ireland.
Ireland has an excellent economic performance, as a Celtic Tiger between 1994 and 2007, and registers the highest rate of GDP per capita, the smallest inflation rate, the second lowest in the at-work poverty rate (after Finland), and a high degree of business freedom. When analyzing the share of immigrants from countries with a small and medium HDI [40], Ireland registered a low share of TCN immigrants, although considering the economic conditions, it may be a top destination country; it might relate to a high in-flow of intra-EU movers.
The results of the country cluster analysis show that socio-economic characteristics of countries may explain the destination of the migrants. The analysis was conducted for both years (2015 and 2018), using a similar set of variables. For both years, the results were similar, except for Cluster 4, where in 2015, two outliers instead of one were included: Norway and Ireland.
5. Conclusions
The countries considered to be the final destination for a migrant change over time. The choice depends on various factors, some of them objective, others subjective, such as relocation programs at the EU level, decision-making abilities, geographic factors, finances, available routes, visa options, networks, chance, migrants’ knowledge of potential destinations, etc. Sometimes, when trying to escape difficult conditions, migrants have limited choices, or none in some cases. Van Hear (1988) [46] indicated a connection between micro-level social processes and macro-level structures, but crises were seen as periods of chaotic events. The social order typically refers to the macro-level, including economy, education, and politics, etc. [47]. Strangio and De Rose (2015) [48] anticipated new patterns of migration, with new sending and receiving countries, as well as a new order.
In this paper we both benefit from advantages and deal with the difficulties of mixing different methods (cluster analysis and SNA) and levels (meso and macro). However, using yearly macro-data provided by various statistical institutions, the study only partially captures the short time dynamics of the migratory movements, as the aggregated statistical data provide a broad picture of the phenomenon.
The cluster analysis performed in this paper grouped EU-28 countries and Norway into four groups, considering their macro-economic indicators as migration factors [23]. Firstly, Top Destination Economically Performing Countries, offering the most attractive conditions for immigrants and asylum-seeking youth in Europe; secondly, Emergent Destination Countries with medium economic wealth, social inequalities, and business freedom, including most of the countries of the former Communist Bloc (Poland, the Baltic countries, Czechia, and Slovenia), as well as Mediterranean countries such as Italy, Portugal, and Spain; thirdly, Periphery Countries, which are economically and/or politically less attractive for immigrants and asylum seekers (but on migration routes), such as Bulgaria, Greece, Croatia, Hungary, Romania, and Slovakia; and lastly, Ireland and Norway (only in 2015), which are Outlier Countries. The first cluster grouped countries considered to be Top Destination Economically Performing Countries, although they saw a decrease in immigration flow between 2015 and 2018. The second cluster grouped Emergent Destination Countries, which experienced an increase in immigrants’ flow and asylum applicants between 2015 and 2018. The third cluster includes Peripheral and Less Economically Performant Countries, while noting that some of them are on migration routes, while the final cluster includes one or two outliers, such as Ireland (both in 2015 and 2018) and Norway (only in 2015). The conclusion of this analysis is that the migration factors for host countries acted in a similar manner in shaping the migration flows both in 2015, the year of the refugee crisis, and in 2018. The top destinations were the same for both years considered in the analysis, and only the magnitude of the process changed. Although the countries of arrival and transit may change over time, the final destination countries seem to be more stable and selected in relation to economic and social criteria.
Most of the results of the cluster analysis are in line with those of the SNA. However, some countries (such as Spain, Italy, and Greece) grouped in different clusters when employing different methodologies at different levels (meso- and macro-level). A possible explanation for Spain is that this country changed from being a destination country to a source country [45]; at the same time, the variable referring to the stock of immigrants includes immigrants from older waves, and the change will be visible only after some time.
All the results in this paper are in line with the neo-classical economic theory of migration. More specifically, immigration is not influenced only by the wage levels in host countries, but also by other factors, such as GDP per capita, inflation rate, unemployment rate, business freedom, corruption index, and health, etc. Furthermore, the patterns revealed are generally in line with the theory of cumulative causation, as immigrants are in search of better lives in countries that have higher levels of economic development.
The results obtained show us that more research is needed and should be complemented by qualitative approaches, identifying new factors influencing immigration. A valuable perspective may be obtained when also integrating the micro-level. Moreover, more origin countries could be included to test whether the patterns obtained from the SNA are persistent.
Author Contributions
Conceptualization, I.M. and M.R.; methodology, M.R. and I.M.; software, I.M.; validation, M.R. and I.M.; formal analysis, M.R.; investigation, I.M.; resources, M.R.; data curation, I.M.; writing—original draft preparation, I.M.; writing—review and editing, M.R.; visualization, I.M.; supervision, M.R.; project administration, M.R. All authors have read and agreed to the published version of the manuscript.
Funding
This article was prepared under the MIMY project (EMpowerment through liquid Integration of Migrant Youth in vulnerable conditions). This project has received funding from the European Union’s Horizon 2020 research and innovation programme under grant agreement No 870700. The content provided in this article reflects the author’s views only. Neither the Research Executive Agency (REA) nor the European Commission are responsible for any use that may be made of the information it contains.
Data Availability Statement
All the data used in this paper are retrieved from public sources like the Eurostat Database and the United Nations.
Conflicts of Interest
The authors declare no conflict of interest. The funders had no role in the design of the study; in the collection, analyses, or interpretation of data; in the writing of the manuscript, or in the decision to publish the results.
Appendix A

Table A1.
Indicators grouped by factors.
| Indicator | Description |
|---|---|
| Predisposing factors | |
| GDP per capita in PPS | Gross domestic product (GDP) is a measure for economic activity. It is defined as the value of all goods and services produced, less the value of any goods or services used in their creation. |
| Gini coefficient | Gini coefficient represents the measurement of income inequalities within a nation and is based on levels of disposable income of a household. The disposable household income includes various income sources (such as income from salaries, investments and properties, transfers between households, and social transfers) received by all household members plus the income received at the household level. The Gini coefficient value has a range between 0 and 100, where 0 shows that there is perfect equality, and 100 shows the perfect inequality. |
| Inflation rate | Harmonized Indices of Consumer Prices (HICPs) are designed for international comparisons of consumer price inflation. |
| Youth unemployment rate | The youth unemployment ratio is the percentage of unemployed young people (i.e., people aged 15–24) in the total active population of this age group. |
| Proximate factors | |
| Business freedom | Business freedom is an overall indicator of the efficiency of government regulation of business. The quantitative score is derived from an array of measurements of the difficulty of starting, operating, and closing a business. |
| Corruption index | The indicator is a composite index based on a combination of surveys and assessments of corruption from 13 different sources, and it scores and ranks countries based on how corrupt a country’s public sector is perceived to be, with a score of 0 representing a very high level of corruption and a score of 100 representing a very clean country. |
| Precipitating factors | |
| Healthy life years | The indicator represents the number of years a person is expected to live healthy conditions. |
| Mediating factors | |
| Severe material deprivation | Severe material deprivation is defined as the share of people who have an enforced lack of at least four of the severe material deprivation items mentioned above for the indicator people at risk of poverty. |
Source: based on Eurostat metadata.
Table A2.
Descriptive statistics.
| Indicator | Year | Mean | Highest Values | Lowest Values |
|---|---|---|---|---|
| Predisposing factors | ||||
| GDP per capita in PPS | 2018 | 103.72 | LUX 1 (263), IRL (191), NOR (153), NLD (130), DNK (129), AUT (128) | BLG (51), HRV (63) ROU (66), GRK (69), HUN (71), POL (71) |
| 2015 | 103.069 | LUX (272), IRL (181), NOR (158), NLD (132), AUT (131), DNK (128) | BLG (48), ROU (57), HRV (60), POL (69), GRK (70), HUN (70) | |
| Gini coefficient | 2018 | 28.82 | BLG (39.6), LTU (36.9), LVA (35.6), ROU (35.1), GBR (33.5) | SVK (20.9), SLO (23.4), CZK (24), NOR (24.8) |
| 2015 | 30.17 | LTU (37.9), ROU (37.4), BLG (37), LVA (35.4), EST (34.8) | SVK (23.7), NOR (23.9), SLO (24.5), CZK (25) | |
| Inflation rate | 2018 | 1.95 | ROU (4.1), EST (3.4) NOR (3), HUN (2.9) | DNK (0.7), IRL (0.7), GRK (0.8), CYP (0.8) |
| 2015 | 0.006 | NOR (2), MLT (1.2), DEU (0.7) | CYP (−1.5), BLG (−1.1), GRK (−1.1), SLO (−0.8) | |
| Youth unemployment rate | 2018 | 5.85 | ESP (11.3), SWE (9.4), ITA (8.4), CYP (7.9) | CZK (2), BLG (3), HUN (3.4), SLO (3.4) |
| 2015 | 8.16 | ESP (16.8), HRV (14), GRK (12.9), CYP (12.4), | DEU (3.5), CZK (4.1), HUN (5.5), NOR (5.5) | |
| Proximate factors | ||||
| Business freedom | 2018 | 76.28 | DNK (92.5), GBR (91.1), NOR (90.4), FIN (89.9) | HRV (58.9), SVK (63.9), MLT (64), BLG (64.3) |
| 2015 | 78.96 | DNK (97.4), FIN (92.6), NOR (92.1), GBR (91.1) | HRV (55.8), MLT (61), POL (67.3), CZK (68.2) | |
| Corruption index | 2018 | 65.34 | DNK (88), FIN (85), SWE (85), NOR (84) | BLG (42), GRK (45), ROU (47), HRV (48) |
| 2015 | 66.34 | DNK (91), FIN (90), SWE (89), NOR (88) | BLG (41), ROU (46), GRK (46), HRV (51) | |
| Predisposing factors | ||||
| Healthy life years | 2018 | 62.12 | GBR (72.8), NLD (72.7), GRK (69.4) | LTV (52.3), EST (53.9), SVK (55.5) |
| 2015 | 61.65 | MLT (73.6), SWE (72.7), NOR (70.4) | LTV (53), SVK (54.9), EST (55), | |
| Severe material deprivation | 2018 | 6.46 | BLG (20.9), ROU (16.8), GRK (16.7), LTU (11.1) | LUX (1.3), SWE (1.6), NOR (2.1), NLD (2.4) |
| 2015 | 9.41 | BLG (34.2), ROU (22.7), GRK (22.2), HUN (19.4) | SWE (1.1), NOR (1.7), LUX (2), FIN (2.2) | |
1 Czech Republic (CZE), Norway (NOR), Malta (MLT), Luxembourg (LUX), Cyprus (CYP), Island (ISL), Turkey (TUR), Ireland (IRL), Sweden (SWE), Lithuania (LTU), Slovakia (SVK), Slovenia (SLO), Romania (ROU), Portugal (PRT), Poland (POL), Hungary (HUN), Croatia (HRV), France (FRA), Spain (ESP), Germany (DEU), Bulgaria (BGR), Finland (FIN), Latvia (LVA), Denmark (DNK), Switzerland (CHE), Great Britain (GBR), Austria (AUT), Netherlands (NLD), Italy (ITA), Greece (GRK), Malta (MLT).
Table A3.
Correlation matrix (2015).
| GDP per Capita in PPS | Gini | Inflation Rate | Corruption INDEX | In at Work Poverty Rate | Youth Unemploy Rate | Severe Material Deprivation | Healthy Life Years at Birth | Business Freedom | |
|---|---|---|---|---|---|---|---|---|---|
| GDP per capita in PPS | 1 | ||||||||
| Gini | −0.42 | 1 | |||||||
| Inflation Rate | 0.42 | −0.48 | 1 | ||||||
| Corruption Index | 0.70 | −0.49 | 0.52 | 1 | |||||
| In at Work poverty rate | −0.20 | 0.69 | −0.34 | −0.42 | 1 | ||||
| Youth unemployment rate | −0.12 | 0.18 | −0.36 | −0.12 | 0.15 | 1 | |||
| Severe material deprivation | −0.59 | 0.64 | −0.55 | −0.79 | 0.41 | 0.03 | 1 | ||
| Healthy life years at birth | 0.35 | −0.22 | 0.37 | 0.26 | −0.12 | 0.02 | −0.17 | 1 | |
| Business Freedom | 0.29 | −0.15 | 0.28 | 0.71 | −0.23 | −0.07 | −0.45 | 0.03 | 1 |
Table A4.
Correlation matrix (2018).
| GDP per Capita in PPS | Gini | Inflation Rate | Corruption Index | In at Work Poverty Rate | Youth Unemploy Rate | Severe Material Deprivation | Healthy Life Years at Birth | Business Freedom | |
|---|---|---|---|---|---|---|---|---|---|
| GDP per capita in PPS | 1 | ||||||||
| Gini | −0.15 | 1 | |||||||
| Inflation Rate | −0.19 | 0.17 | 1 | ||||||
| Corruption Index | 0.67 | −0.31 | −0.13 | 1 | |||||
| In at Work poverty rate | −0.03 | 0.68 | 0.27 | −0.29 | 1 | ||||
| Youth unemployment rate | 0.009 | 0.06 | −0.43 | 0.10 | 0.13 | 1 | |||
| Severe material deprivation | −0.57 | 0.61 | 0.20 | −0.75 | 0.41 | −0.03 | 1 | ||
| Healthy life years at birth | −0.18 | 0.07 | −0.02 | 0.04 | 0.03 | 0.15 | 0.04 | 1 | |
| Business Freedom | 0.35 | −0.21 | −0.21 | 0.82 | −0.33 | 0.15 | −0.47 | 0.19 | 1 |
References
- World Bank. Europe and Central Asia Economic Update: Migration and Mobility. 2017. Available online: http://hdl.handle.net/10986/28534 (accessed on 5 December 2020).
- Stark, O.; Bloom, D.E. The new economics of labor migration. Am. Econ. Rev. 1985, 75, 173–178. [Google Scholar]
- Massey, D.S.; Parrado, E.A. International migration and business formation in Mexico. Soc. Sci. Q. 1998, 79, 1–20. [Google Scholar]
- De Haas, H. Turning the tide? Why development will not stop migration. Dev. Chang. 2007, 38, 819–841. [Google Scholar] [CrossRef]
- European Commission. Communication from the Commission to the European Parliament, the Council, the European Economic and Social Committee and the Committee of the Regions on Circular Migration and Mobility Partnerships between the European Union and Third Countries. 2007. Available online: https://eur-lex.europa.eu/legal-content/EN/TXT/PDF/?uri=CELEX:52007DC0248&from=EN (accessed on 5 December 2020).
- Chou, M.H. European Union Migration Strategy towards West Africa: The Origin and Outlook of ‘Mobility Partnerships’ with Cape Verde and Senegal. In Proceedings of the EUSA Biennial International Conference “Information and Ideas on the European Union”, Los Angeles, CA, USA, 23–25 April 2009. [Google Scholar]
- UNHCR, Principles and Guidelines, Supported by Practical Guidance, on the Human Rights Protection of Migrants in Vulnerable Situation. 2017. Available online: PrinciplesAndGuidelines.pdf(ohchr.org) (accessed on 10 December 2020).
- Roman, M.; Cimpoeru, S.; Manafi, I.; Prada, E.; Messing, V. MIMY Deliver No 2,3. Public Report on the Influence of Youth Migration on Macro-Economic and Social Development in Main Receiving European Countries, Bucharest (Romania); Bucharest University of Economic Studies: Bucharest, Romania, 2021. [Google Scholar]
- Ryan, L.; D’Angelo, A. Changing times: Migrants’ social network analysis and the challenges of longitudinal research. Soc. Netw. 2018, 53, 148–158. [Google Scholar] [CrossRef]
- Ravenstein, E.G. The laws of migration. J. Stat. Soc. Lond. 1885, 48, 167–235. [Google Scholar] [CrossRef]
- Lee, E.S. A theory of migration. Demography 1966, 3, 47–57. [Google Scholar] [CrossRef]
- De Haas, H. The internal dynamics of migration processes: A theoretical inquiry. J. Ethn. Migr. Stud. 2010, 36, 1587–1617. [Google Scholar] [CrossRef]
- Mayda, A.M. International migration: A panel data analysis of the determinants of bilateral flows. J. Popul. Econ. 2010, 23, 1249–1274. [Google Scholar] [CrossRef]
- Beine, M.; Docquier, F.; Schiff, M. Brain drain and its Determinants: A Major Issue for Small States, 2008, Working Paper. Available online: https://ssrn.com/abstract=1294540 (accessed on 1 December 2021).
- Vojtovic, S.; Kordos, M. Trends in unemployment and emigration of labor force. In Proceedings of the Economics and Finance Conferences, Miami (No. 3205864); International Institute of Social and Economic Sciences: Prague, Czech Republic, 2016. [Google Scholar]
- Geis, W.; Uebelmesser, S.; Werding, M. How do migrants choose their destination country? An analysis of institutional determinants. Rev. Int. Econ. 2013, 21, 825–840. [Google Scholar] [CrossRef] [Green Version]
- Constant, A.F.; D’Agosto, E. Where do the brainy Italians go? In The Labour Market Impact of the EU Enlargement; Physica-Verlag HD: Heidelberg, Germany, 2010; pp. 247–271. [Google Scholar]
- Åslund, O. Now and forever? Initial and subsequent location choices of immigrants. Reg. Sci. Urban Econ. 2005, 35, 141–165. [Google Scholar] [CrossRef] [Green Version]
- Søholt, S.; Lynnebakke, B. Do immigrants’ preferences for neighbourhood qualities contribute to segregation? The case of Oslo. J. Ethn. Migr. Stud. 2015, 41, 2314–2335. [Google Scholar] [CrossRef]
- Myrdal, G. Rich Lands and Poor; Harper and Row: New York, NY, USA, 1957. [Google Scholar]
- Greenwood, M.J.; Mueser, P.R.; Plane, D.A.; Schlottmann, A.M. New directions in migration research. Ann. Reg. Sci. 1991, 25, 237–270. [Google Scholar] [CrossRef] [PubMed]
- Todaro, M.P. A model of labor migration and urban unemployment in less-developed countries. Am. Econ. Rev. 1969, 59, 138–148. [Google Scholar]
- Van Hear, N.; Bakewell, O.; Long, K. Drivers of Migration. 2012. Available online: https://assets.publishing.service.gov.uk/media/57a08a7fed915d622c000787/WP1_Drivers_of_Migration.pdf (accessed on 20 November 2020).
- Ocampo-González, M.; González-Becerril, J.G. Key drivers of migration due to violence in urban areas: A case of Medellin, Colombia. Pap. Población 2018, 24, 119–156. [Google Scholar] [CrossRef] [Green Version]
- Richmond, A.H.; Valtonen, K. Global apartheid: Refugees, racism, and the new world order. Refug. Can. J. Refug. 1994, 14, 25–28. [Google Scholar] [CrossRef]
- Carling, J.; Collins, F. Aspiration, desire and drivers of migration. J. Ethn. Migr. Stud. 2018, 44, 909–926. [Google Scholar] [CrossRef] [Green Version]
- De Haas, H.; Vezzoli, S.; Szczepanikova, A.; Van Criekinge, T. European Migrations: Dynamics, Drivers, and the Role of Policies; Publications Office of the European Union: Luxembourg, 2018. [Google Scholar]
- Newman, M.E.J. Networks: An Introduction, 1st ed.; Oxford University Press: New York, NY, USA, 2017. [Google Scholar]
- Gunderson, R.J.; Pinto, J.V.; Williams, R.H. Economic or amenity driven migration? A cluster-based analysis of county migration in the four corners states. J. Reg. Anal. Policy 2008, 38, 243–254. [Google Scholar]
- Mihailović, D.T.; Nikolić-Đorić, E.; Malinović-Milićević, S.; Singh, V.P.; Mihailović, A.; Stošić, T.; Stošić, B.; Drešković, N. The choice of an appropriate information dissimilarity measure for hierarchical clustering of river streamflow time series, based on calculated Lyapunov exponent and Kolmogorov measures. Entropy 2019, 21, 215. [Google Scholar] [CrossRef] [PubMed] [Green Version]
- Gülagiz, F.K.; Sahin, S. Comparison of hierarchical and non-hierarchical clustering algorithms. Int. J. Comput. Eng. Inf. Technol. 2017, 9, 6. [Google Scholar]
- Hennig, C.; Meila, M.; Murtagh, F.; Rocci, R. (Eds.) Handbook of Cluster Analysis; CRC Press: Boca Raton, FL, USA, 2015. [Google Scholar]
- Kogan, I.; Shen, J. It’s the economy! Life satisfaction of intra-European migrants in the aftermath of the economic crisis. Front. Sociol. 2019, 4, 42. [Google Scholar] [CrossRef] [Green Version]
- Haller, M.; Hadler, M. How social relations and structures can produce happiness and unhappiness: An international comparative analysis. Soc. Indic. Res. 2006, 75, 169–216. [Google Scholar] [CrossRef] [Green Version]
- Diener, E.; Suh, E.M. National differences in subjective well-being. In Well-Being: The Foundations of Hedonic Psychology; Kahneman, D., Diener, E., Schwarz, N., Eds.; Russel Sage Foundation: New York, NY, USA, 1999; pp. 434–450. [Google Scholar]
- Kogan, I.; Shen, J.; Siegert, M. What makes a satisfied immigrant? Host-country characteristics and immigrants’ life satisfaction in eighteen European countries. J. Happiness Stud. 2018, 19, 1783–1809. [Google Scholar] [CrossRef]
- Hausmer, P.; Samek, M.; Kraler, A.; Mijačić, D.; Kahanec, M.; Steenberghen, T. MIGRARE—Impacts of Refugee Flows to Territorial Development in Europe, ESPON. 2019. Available online: https://www.espon.eu/sites/default/files/attachments/MIGRARE_Final_Report.pdf (accessed on 20 April 2021).
- Sachs, J. Das Ende der Armut; Ein Ökonomisches Programm für Eine Gerechtere Welt: München, Germany, 2005. [Google Scholar]
- Roman, M.; Messing, V.; Cimpoeru, S.; Manafi, I.; Ságvári, B. D2.2. MIMY Public Report on Describing and Comparing the Dimension, Characteristics and Dynamics of Youth Migrants in European Countries, Bucharest (Romania); Bucharest University of Economic Studies: Bucharest, Romania, 2020. [Google Scholar]
- European Commission, DG Migration, A Study on Smuggling of Migrants Characteristics, Responses and Cooperation with third Countries. 2015. Available online: https://migrationnetwork.un.org/resources/study-smuggling-migrants-characteristics-responses-and-cooperation-third-countries (accessed on 6 January 2022).
- Belloni, M. Cosmologies of Destinations: Rootes and Routes of Eritrean Forced Migration towards Europe. Ph.D. Thesis, University of Trento, Trento, Italy, 2015. [Google Scholar]
- Bilan, Y.; Strielkowski, W. Migration in post-transition economies: Immigration surplus in Visegrad group countries. Int. J. Trade Glob. Mark. 2016, 9, 182–196. [Google Scholar] [CrossRef]
- Škuflić, L.; Krpan, M.; Žmuk, B. Migration and the economic crisis in the European Union member states: Cluster analysis. Entrep. Sustain. Issues 2018, 6, 979. [Google Scholar] [CrossRef]
- Manafi, I.; Marinescu, D.; Roman, M.; Hemming, K. Mobility in Europe: Recent trends from a cluster analysis. Amfiteatru Econ. 2017, 19, 711. [Google Scholar]
- Izquierdo, M.; Jimeno, J.F.; Lacuesta, A. Spain: From massive immigration to vast emigration? IZA J. Migr. 2016, 5, 1–20. [Google Scholar] [CrossRef] [Green Version]
- Van Hear, N. Refugees and Development in Africa; Nobel, P., Ed.; Scandinavian Institute of African Studies: Uppsala, Sweden, 1987; p. 121, ISBN 91 7106 272 6.-Directory of Current Research on Refugees and Other Forced Migrants. Refugee Studies Programme: Oxford, UK, 1987; p. 117. ISBN 0 9512260 0 2. Africa 1988, 58, 498–499. [Google Scholar] [CrossRef]
- Düvell, F. Shifts in the global migration order and migration transitions in Europe: The cases of Turkey and Russia. Comp. Migr. Stud. 2020, 8, 1–22. [Google Scholar] [CrossRef]
- Strangio, D.; De Rose, A. A new Italian migration toward Australia? Evidences from the last decades and associations with the recent economic crisis. In The History of Migration in Europe; Routledge: London, UK; New York, NY, USA, 2014; pp. 214–234. [Google Scholar]
Figure 1.
The total number of non-EU immigrants in EU-28 and Norway.

Figure 2.
Number of young asylum seekers in 2015. Source: own processing based on Eurostat data.

Figure 3.
The network of estimated immigrant stock whose countries of origins are with low or medium HDI living in 2019 in considered countries. Source: own processing based on UN Data. Retrieved data from: https://www.un.org/en/development/desa/population/migration/data/estimates2/estimates19.asp (accessed on 13 July 2021).

Figure 4.
Country clusters for 2018. Source: own processing based on Eurostat data.

Table 1.
Target countries considering the weighted degree.
| Countries with Weighted Degree > 11,000 | Countries with Weighted Degree in the Range 7000–11,000 | Countries with Weighted Degree < 7000 |
|---|---|---|
| Sweden, United Kingdom, Switzerland, Belgium, Austria, the Netherlands, Norway, Denmark, Italy, Spain, France | Czech Republic, Greece, Ireland, Finland, Poland, Portugal | Bulgaria, Hungary, Malta, Luxembourg, Germany, Romania, Estonia, Iceland, Slovenia, Latvia, Slovakia, Lithuania, Croatia |
Source: own processing based on UN data
Publisher’s Note: MDPI stays neutral with regard to jurisdictional claims in published maps and institutional affiliations. |
© 2022 by the authors. Licensee MDPI, Basel, Switzerland. This article is an open access article distributed under the terms and conditions of the Creative Commons Attribution (CC BY) license (https://creativecommons.org/licenses/by/4.0/).
Share and Cite
MDPI and ACS Style
Manafi, I.; Roman, M. A Way to Europe: New Refugees’ Migration Patterns Revealed. Sustainability 2022, 14, 748. https://doi.org/10.3390/su14020748
AMA Style
Manafi I, Roman M. A Way to Europe: New Refugees’ Migration Patterns Revealed. Sustainability. 2022; 14(2):748. https://doi.org/10.3390/su14020748
Chicago/Turabian StyleManafi, Ioana, and Monica Roman. 2022. "A Way to Europe: New Refugees’ Migration Patterns Revealed" Sustainability 14, no. 2: 748. https://doi.org/10.3390/su14020748
Note that from the first issue of 2016, this journal uses article numbers instead of page numbers. See further details here.