Article

The Stability and Suitability of the Bhasan Char Island as an Accommodation for the Forcibly Displaced Myanmar Nationals (FDMN)

by
Md. Yousuf Gazi
1,
A. S. M. Maksud Kamal
2,*,
Md. Nazim Uddin
1,
Md. Anwar Hossain Bhuiyan
1 and
Md. Zillur Rahman
2
1
Department of Geology, University of Dhaka, Dhaka 1000, Bangladesh
2
Department of Disaster Science and Management, University of Dhaka, Dhaka 1000, Bangladesh
*
Author to whom correspondence should be addressed.
Sustainability 2022, 14(2), 747; https://doi.org/10.3390/su14020747
Submission received: 26 November 2021 / Revised: 29 December 2021 / Accepted: 30 December 2021 / Published: 11 January 2022

Abstract

:
Assessing the dynamics of Bhasan Char is very crucial, as the Government of Bangladesh (GoB) has recently selected the island as the accommodation of the FDMN. This article critically evaluates the spatiotemporal morphological variations due to erosion, accretion, and subsurface deformation of the island through multi-temporal geospatial and geophysical data analysis, groundwater quality-quantity, and also determines the nature and rate of changes from 2003 to 2020. This is the first study in this island on which multi-temporal Landsat Satellite Imagery and seismic data have been used with geospatial techniques with Digital Shoreline Analysis System (DSAS) and petrel platform, respectively. The analysis of satellite images suggests that the island first appeared in 2003 in the Bay of Bengal, then progressively evolved to the present stable condition. Significant changes have taken place in the morphological and geographical conditions of the island since its inception. Since 2012, the island has been constantly accreted by insignificant erosion. It receives tidally influenced fluvial sediments from the Ganges-Brahmaputra-Meghna (GBM) river system and the sedimentary accretion, in this case, is higher than the erosion due to relatively weaker wave action and longshore currents. It has gained approximately 68 km2 area, mostly in the northern part and because of erosion in the south. Although the migration of the Bhasan Char was ubiquitous during 2003–2012, it has been concentrated in a small area to the east since 2018. The net shoreline movements (NSM) suggest that the length of the shoreline enlarged significantly by around 39 km in 2020 from its first appearance. Seismic and GPS data clearly indicate that the island is located on the crest of a slowly uplifting low-amplitude anticline, which may result in a stable landform around the island. Based on the analysis of historical data, it has been assessed that the current configuration of Bhasan Char would not be severely affected by 10–15-foot-high cyclone. Therefore, FDMN rehabilitation here might be safer that would be a good example for future geo-environmental assessment for any areas around the world for rehabilitation of human in remote and vulnerable island. The findings of this research will facilitate the government’s decision to rehabilitate FDMN refugees to the island and also contribute to future research in this area.

1. Introduction

Bangladesh is currently hosting over one million FDMN refugees [1] who fled from Myanmar’s Rakhine State to avoid genocide, war crimes, and serious crimes against humanity [2]. They are currently living in overcrowded, makeshift camps with an average density of 40,000/km2 in Cox’s Bazar district. The camps are highly vulnerable to landslides, cyclones, and flash flooding [3]. Besides, the FDMN are facing immense challenges to cope with the ongoing COVID-19 pandemic. All in all, their living conditions are deteriorating gradually. As one of the most populous countries in the world, there is no opportunity to increase the areal extent of asylum camps in Bangladesh. In addition, vulnerability to natural hazards like landslides, conflict with the host community, and rising concerns in providing safe water, sanitation, and hygiene (WaSH) made it difficult to lengthen their staying in the existing camp areas. Given the context, the GoB has recently decided to relocate 100,000 FDMN in the Bhasan Char to a remote and silted-up island floating in the Bay of Bengal (Figure 1). Therefore, a comprehensive study is very crucial concerning the geological and geomorphological stability of this island.
The environmental sustainability of an island depends on the vulnerability of different hazards and the threat to resources available there [4]. Island suitability and stability is closely connected to the environmental sustainability that is very crucial for habitation and development programs on an island [5]. Globally, several studies have already reported the linkage between environmental stability of an island and safe human habitation [6,7,8,9]. It is important to understand this relationship for relocating people from one place to another region to minimize environmental risks [10]. The policy makers, NGOs, and other stakeholder are only concerned with the island’s safety from coastal degradation, cyclone, and other geological hazards, and these are the prime concern of this present study.
Coastal areas including islands are vulnerable, as these are affected by several natural dynamic processes like waves, currents, storm surges, coastal erosion-accretion, cyclones, and also by many anthropogenic activities [11,12]. For assessing the stability and sustainability of an island, assessment of vulnerability to hazards (geological, geomorphological, and climatic hazards) is very crucial [13]. It is an important tool to link the physical, social, and policy system that minimizes the hazards and risks [14]. Evolution of the island landscape must be assessed to infer the sustainability and stability of an island, and this can be utilized as a basement for vulnerability index [15]. However, the present study evaluated the geo-environmental hazards by measuring the resilience to assist policymakers in their decision on FDMN rehabilitation. The southern part of Bangladesh is the most vulnerable region to the impacts of climate change in response to sea-level rise, cyclone, coastal erosion-accretion, and coastal dynamics [16,17]. These extreme natural events have impacted negatively on the livelihood of the coastal community [18]. In the years 1987, 1988, and 1998, flooding inundated 60% of the country [19], and the frequency of this natural calamity is very high. As Bangladesh is at high risk of inundation due to sea-level rise, it is anticipated that about 40% of the southern productive land of Bangladesh will become flooded by the year 2080 [20]. The area is highly vulnerable and subject to substantial morphological changes by simultaneous erosion and deposition. So, the suitability and stability of this island for the FDMN can only be assessed by considering the shoreline dynamics, geology, and other environmental hazards [8,21,22]. The morphology of the coastal area of Bangladesh is not still stable, but rather it is rapidly changing due to erosion-accretion processes [23]. Coastal geological studies indicate that offshore islands like Saint Martin’s, Sandwip, Hatiya, and Domar Char in Bangladesh are very prone to climatic and geo-environmental changes [24]. Massive sediment load transported by the river Ganges and Jamuna interacts with sea waves, thus islands of this zone in the Meghna estuary are extremely dynamic [25]. Currently, the Bhasan Char has drawn attention due to the urgency of FDMN’s rehabilitation from Cox’s Bazar camps to the island. It is very important to critically evaluate the dynamics of the island when considering relocating the FDMN there. Analysis of the stability of the Bhasan Char Island is equally important to develop the area for human habitation.
In the coastal setting, shoreline shifts frequently as a function of the land-water interface [26,27]. To protect life, environment, and property, precise shoreline mapping is therefore very crucial [28]. To understand the coastal dynamics and spatiotemporal planform of an island, time series analysis using multi-temporal satellite images is a good option. Monitoring the coastal dynamics requires spatial modeling utilizing geographic information systems (GIS) and remote sensing data [29,30]. Hence, understanding the spatiotemporal modification of the coastline is very important for managing coastal areas along with other environmental issues [31]. To extract the information regarding waterbody, spectral water index methods are used as a key option [32]. The normalized difference water index (NDWI) and the modified normalized difference water index (MNDWI) are also common indices.
Globally, several studies on shoreline analysis have been conducted. Dewidar and Frihy (2010) have delineated erosion-accretion trends along the Nile Delta coastline using multi-temporal images [33]. Mujabar and Chandrasekar (2011) analyzed shoreline movement along the Tamil Nadu coast employing Digital Shoreline Analysis System (DSAS) software [34]. Multi-temporal satellite images have been utilized to estimate continuous shoreline dynamics [35,36,37]. Kabuth et al. (2014) worked on multi-decadal shoreline change in Denmark [38]. Nandi et al. (2016) used remote sensing and GIS techniques to infer and predict the shoreline in the Sagar Island of India [12]. Thi et al. (2014) modeled long-term mangrove shoreline change using remote sensing and GIS [39]. In Bangladesh, some researchers carried out studies focusing on the shoreline shifting along with different parts of the coastal margin. Salauddin et al., (2018) used geospatial techniques and DSAS extension along with different statistical parameters to calculate the shoreline shifting of Domar Char Island, Noakhali district [40]. Kabir et al. (2020) utilized multiband satellite imageries to assess shoreline dynamics of Hatiya Island in Bangladesh [41]. Islam et al. (2015) have employed geospatial techniques for the assessment of the coastal vulnerability of Bhola Island in response to sea-level changes [42]. Emran et al. (2016) monitored the areal dynamics of Hatiya Island with the help of geospatial techniques [43].
To date, no study has been carried out to understand the morphological variations of the Bhasan Char Island. The present study aims to assess the spatiotemporal morphological change, pattern and rate of shoreline movements, and erosion-accretion scenarios of the island using a combined approach of remote sensing, GIS, seismic, and DSAS techniques. Results obtained from this study will help the policymakers of Bangladesh to address issues regarding the resettlement of FDMN in the Bhasan Char Island as their new home. Furthermore, the results of the study will be useful in the academia for conducting further research and undertaking future land use planning on the island.

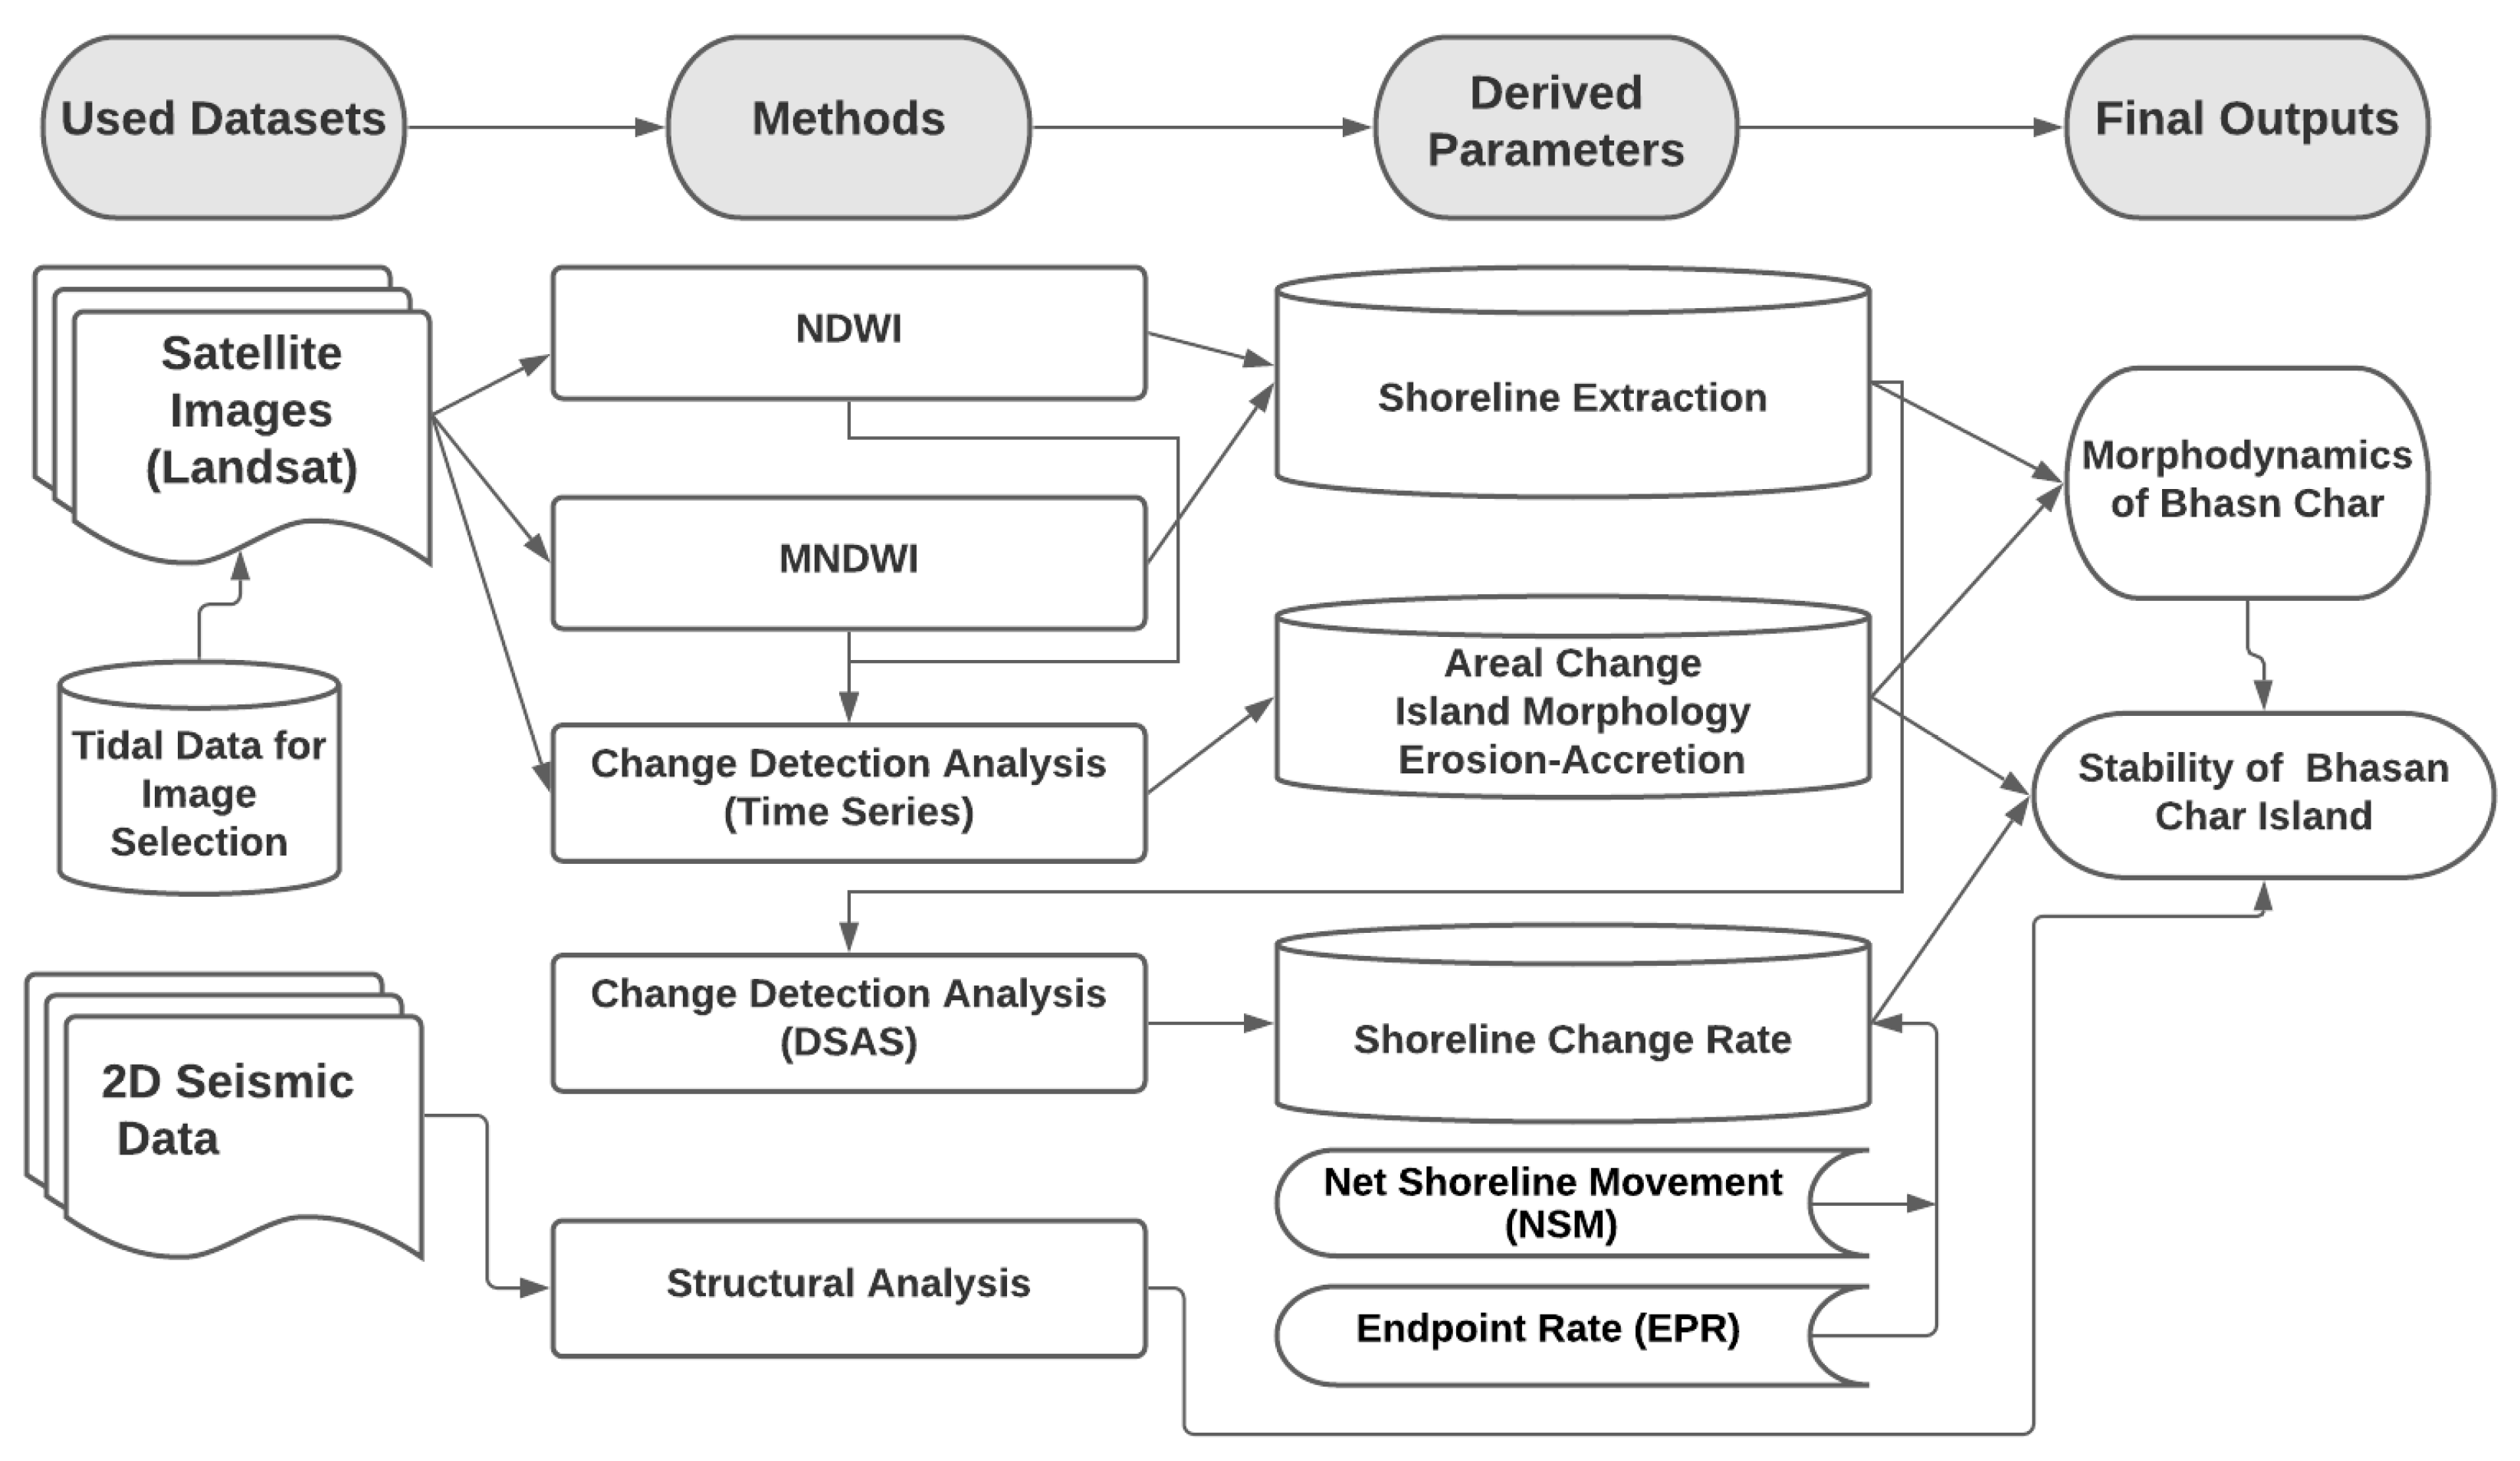
2. Materials and Methods
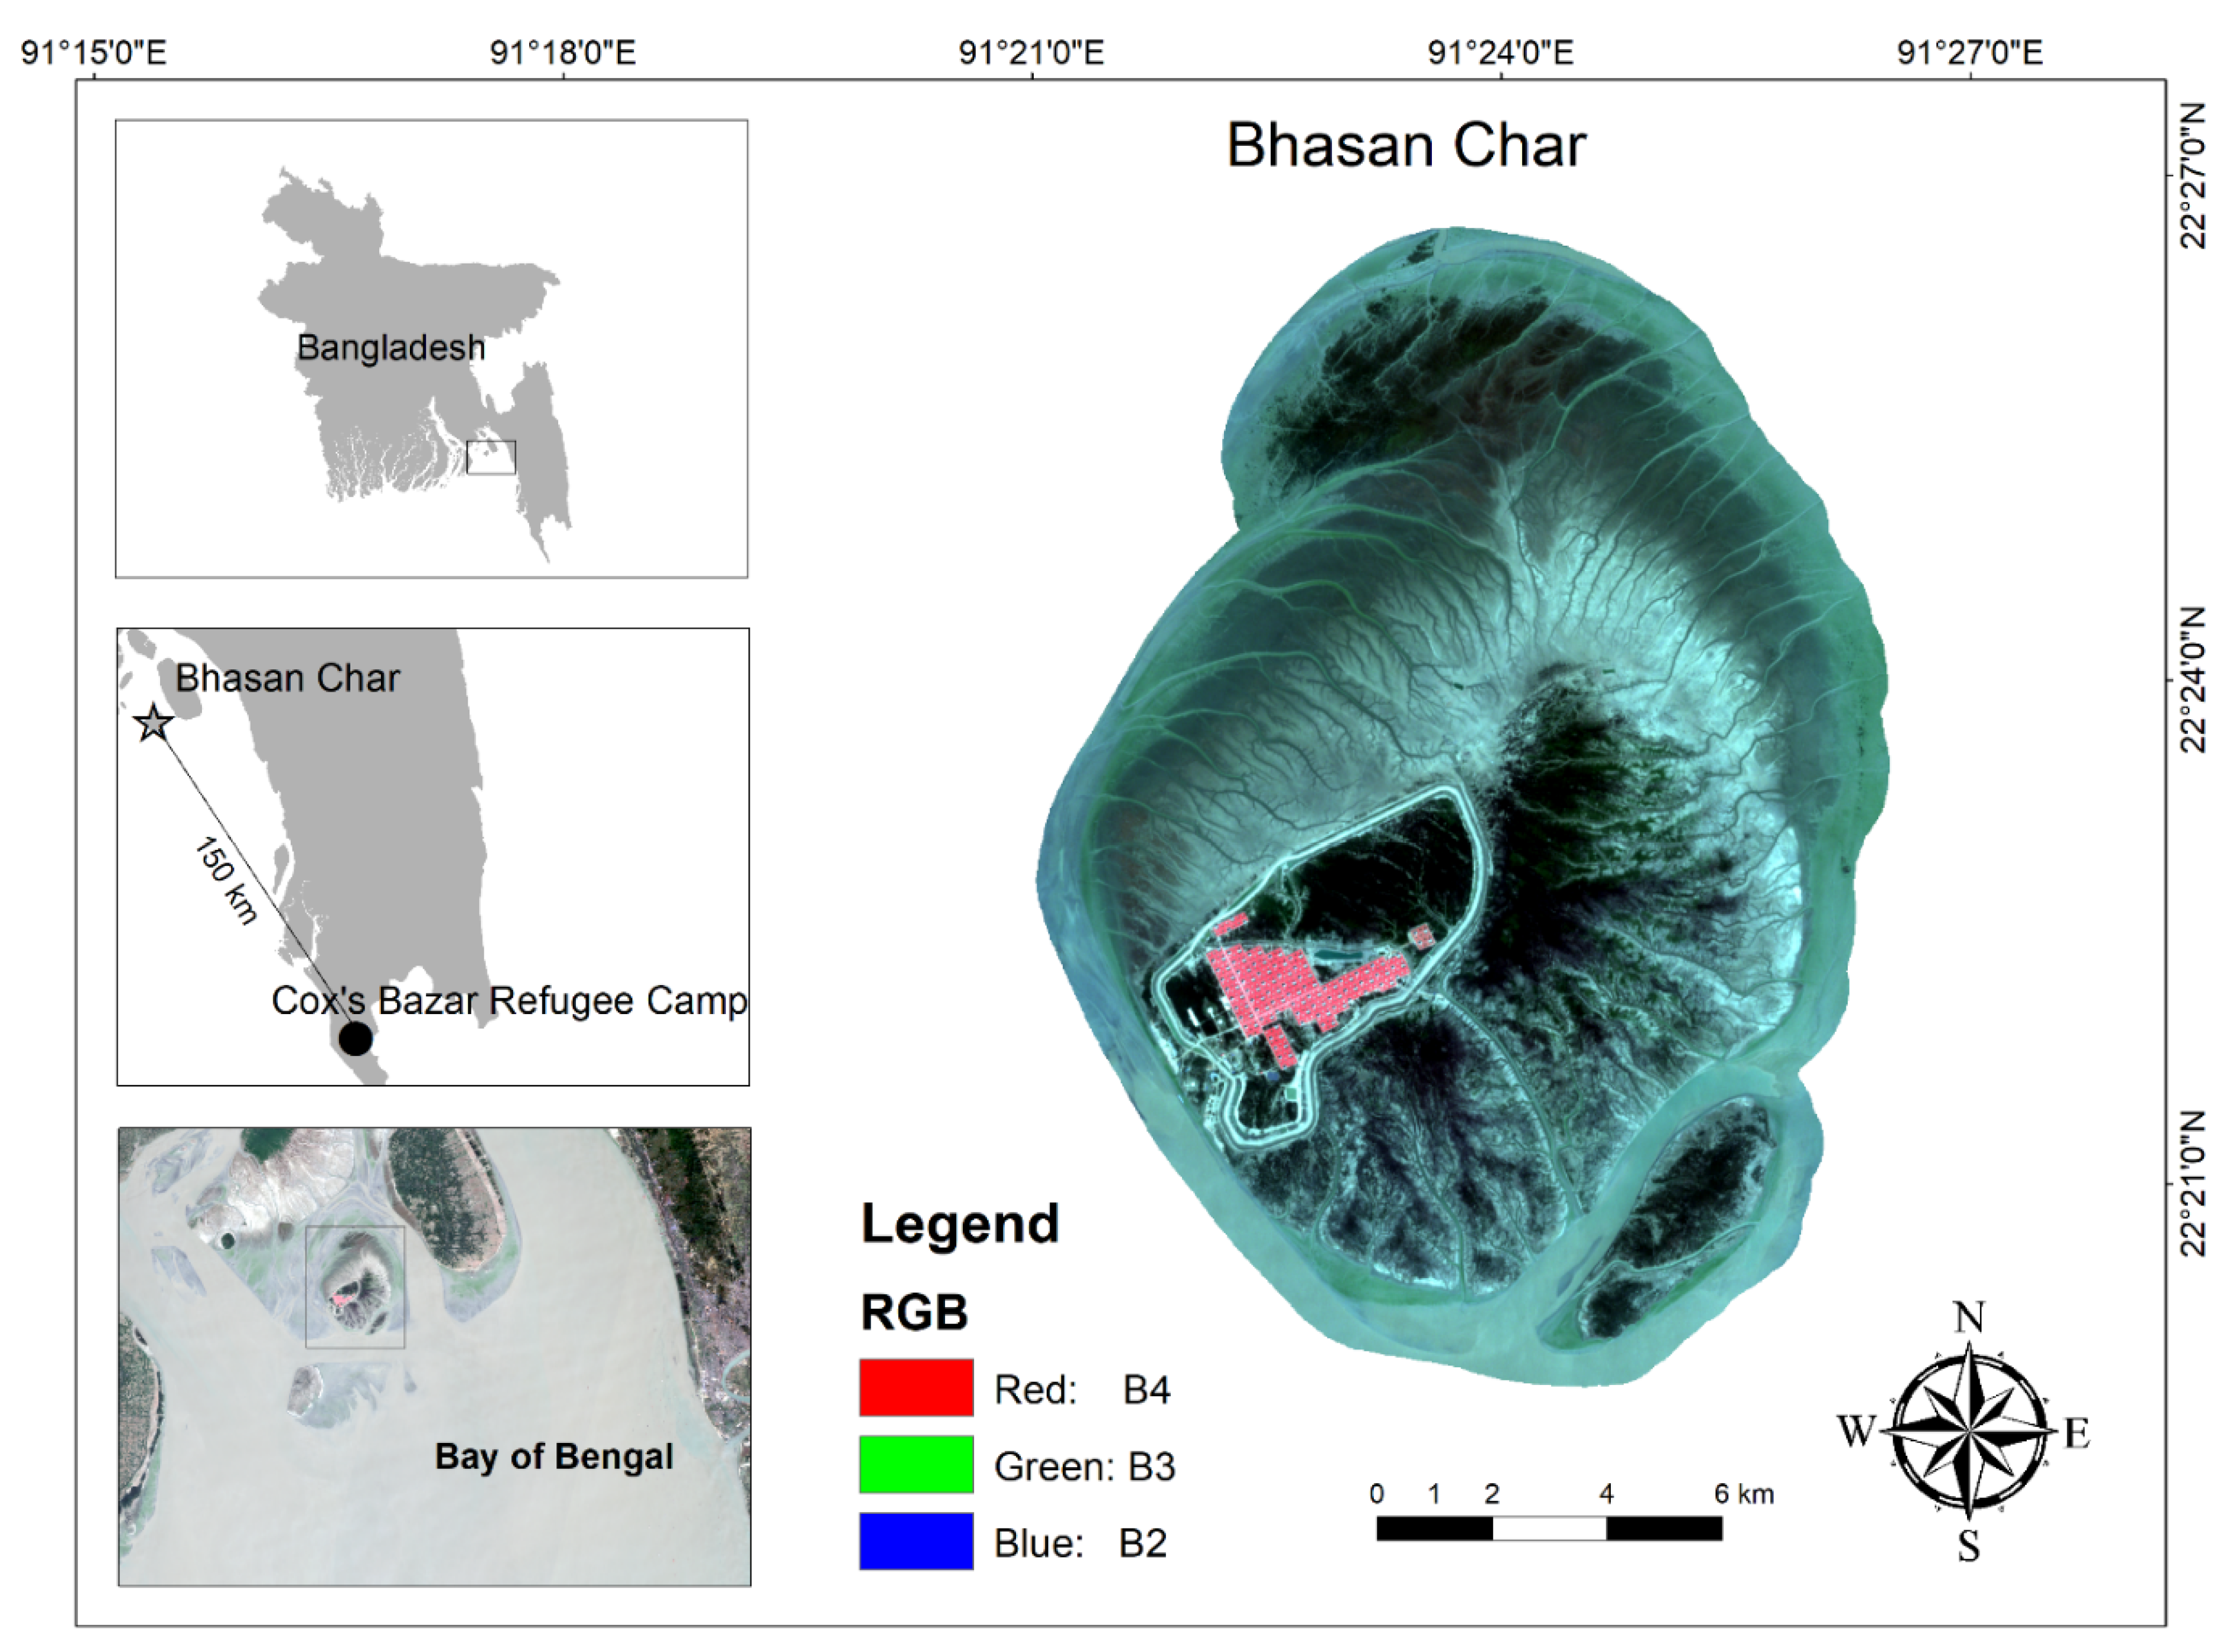
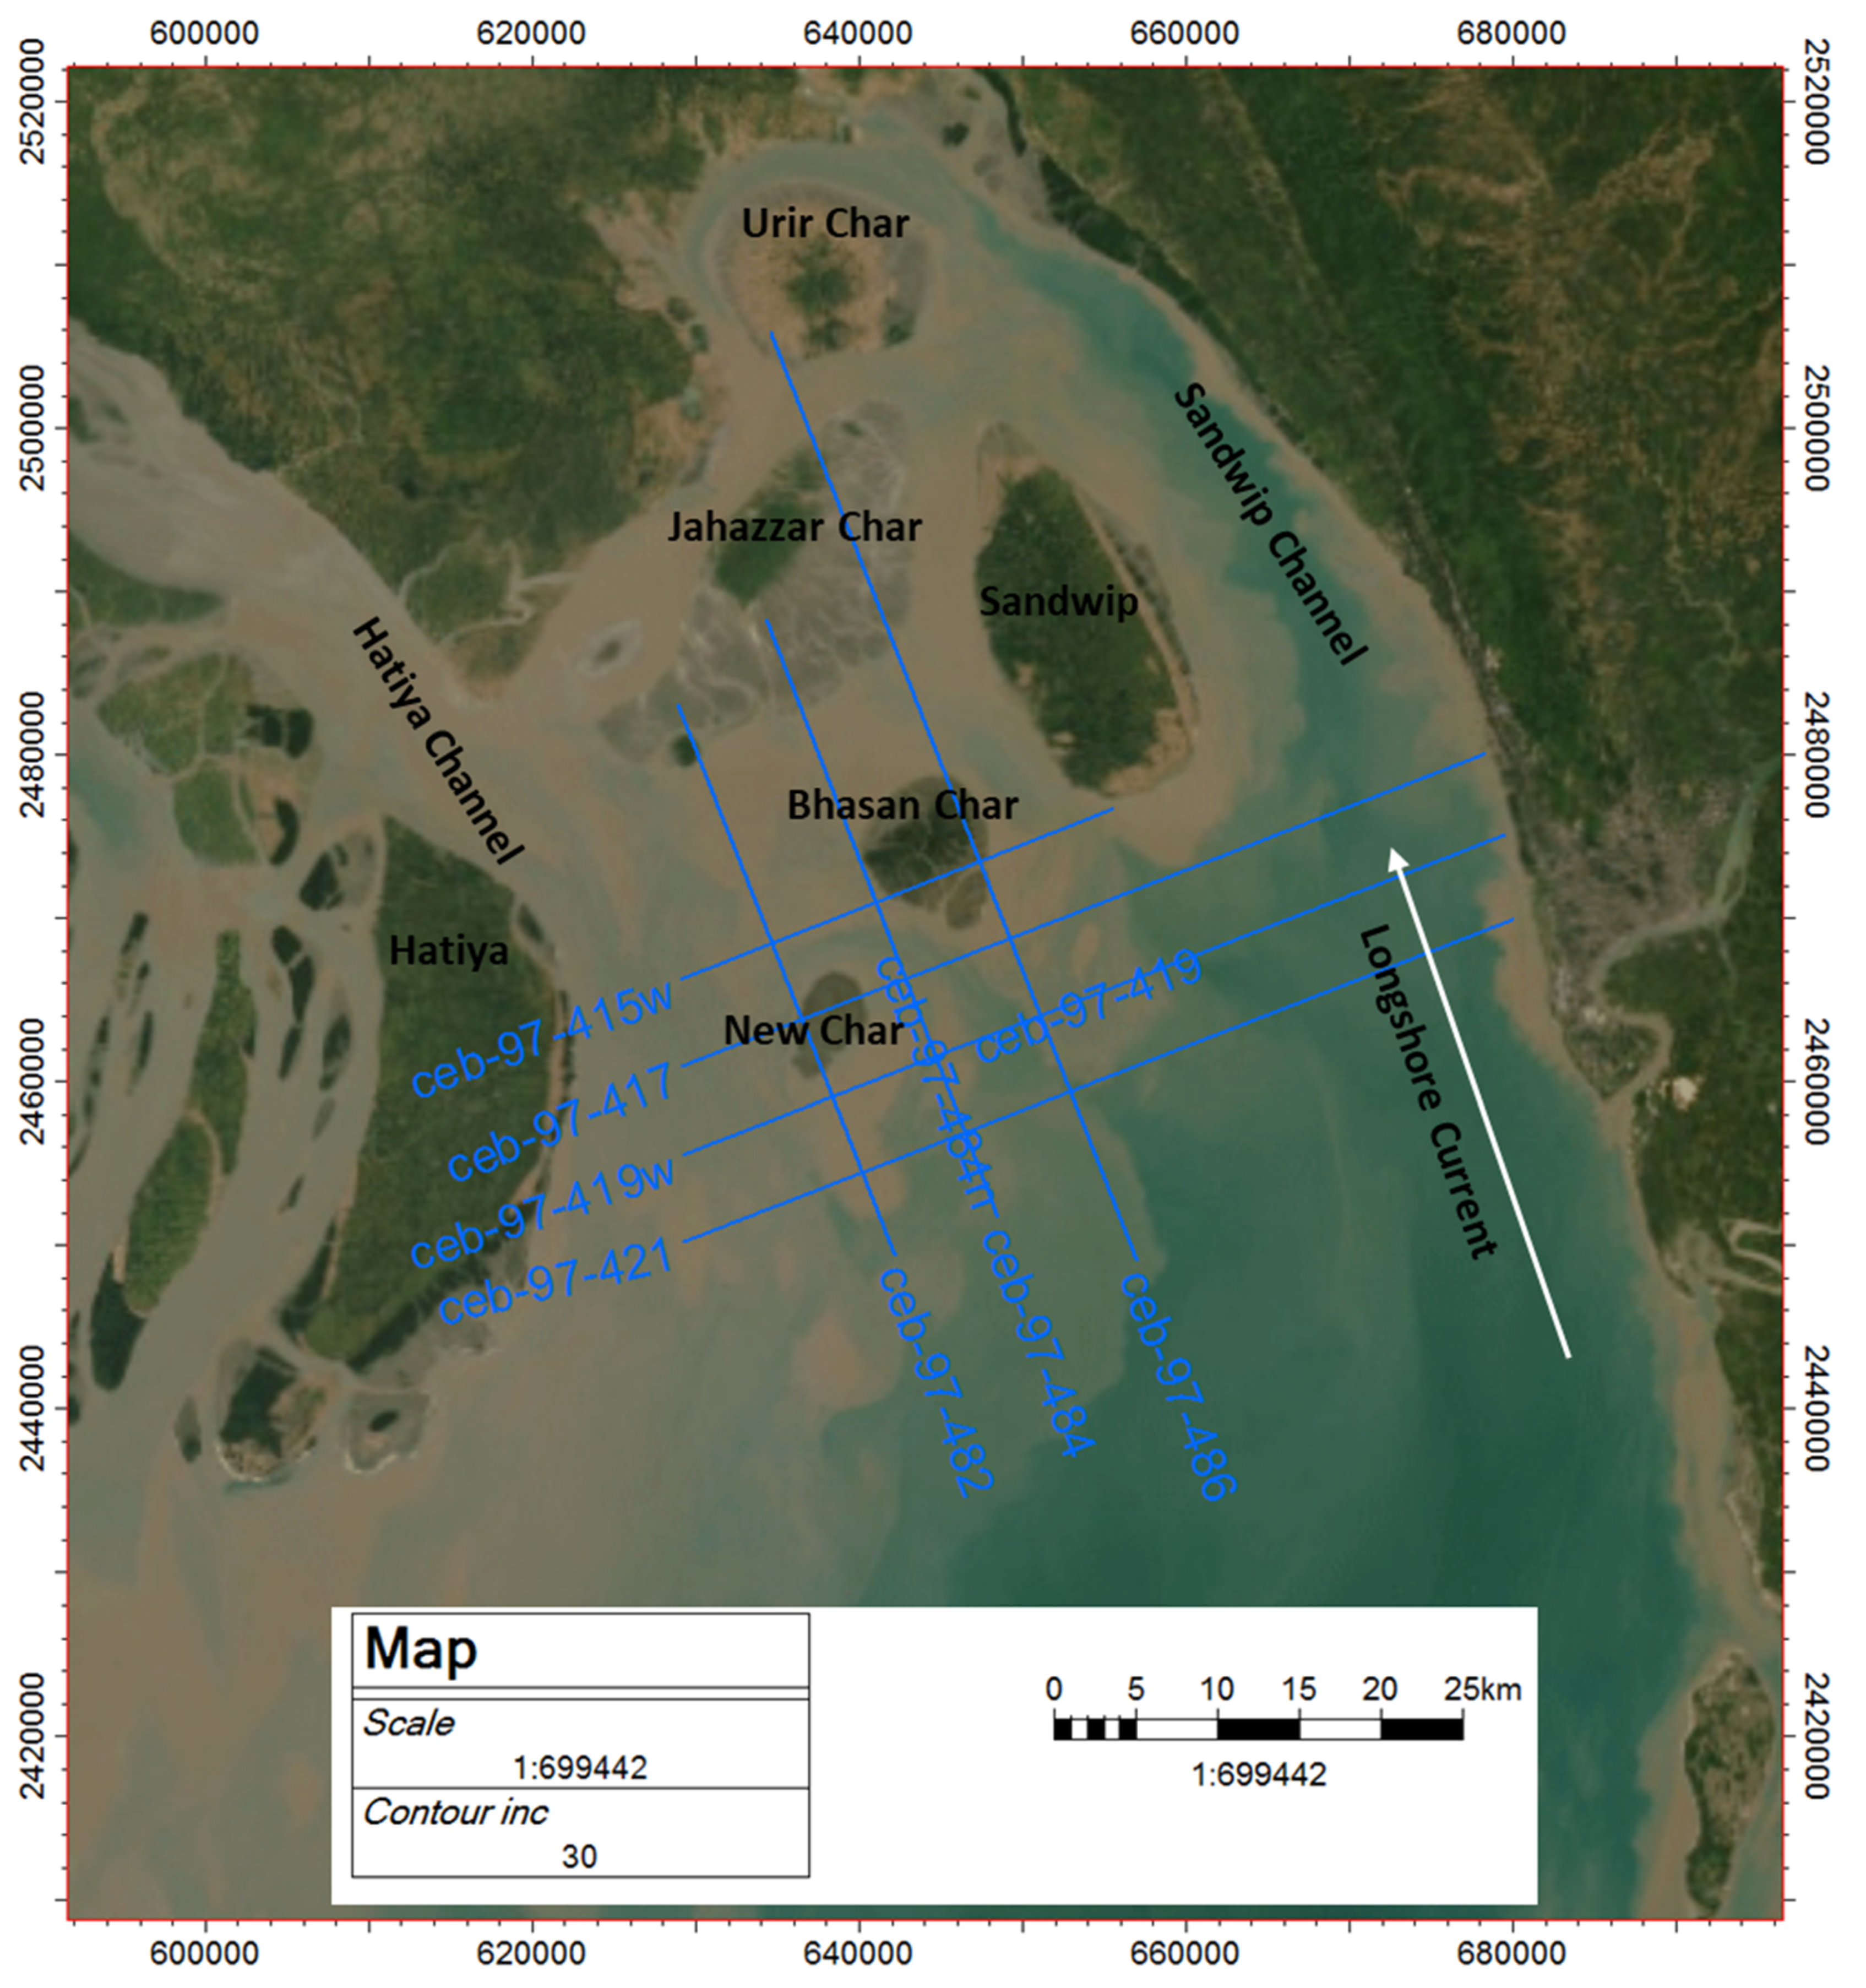
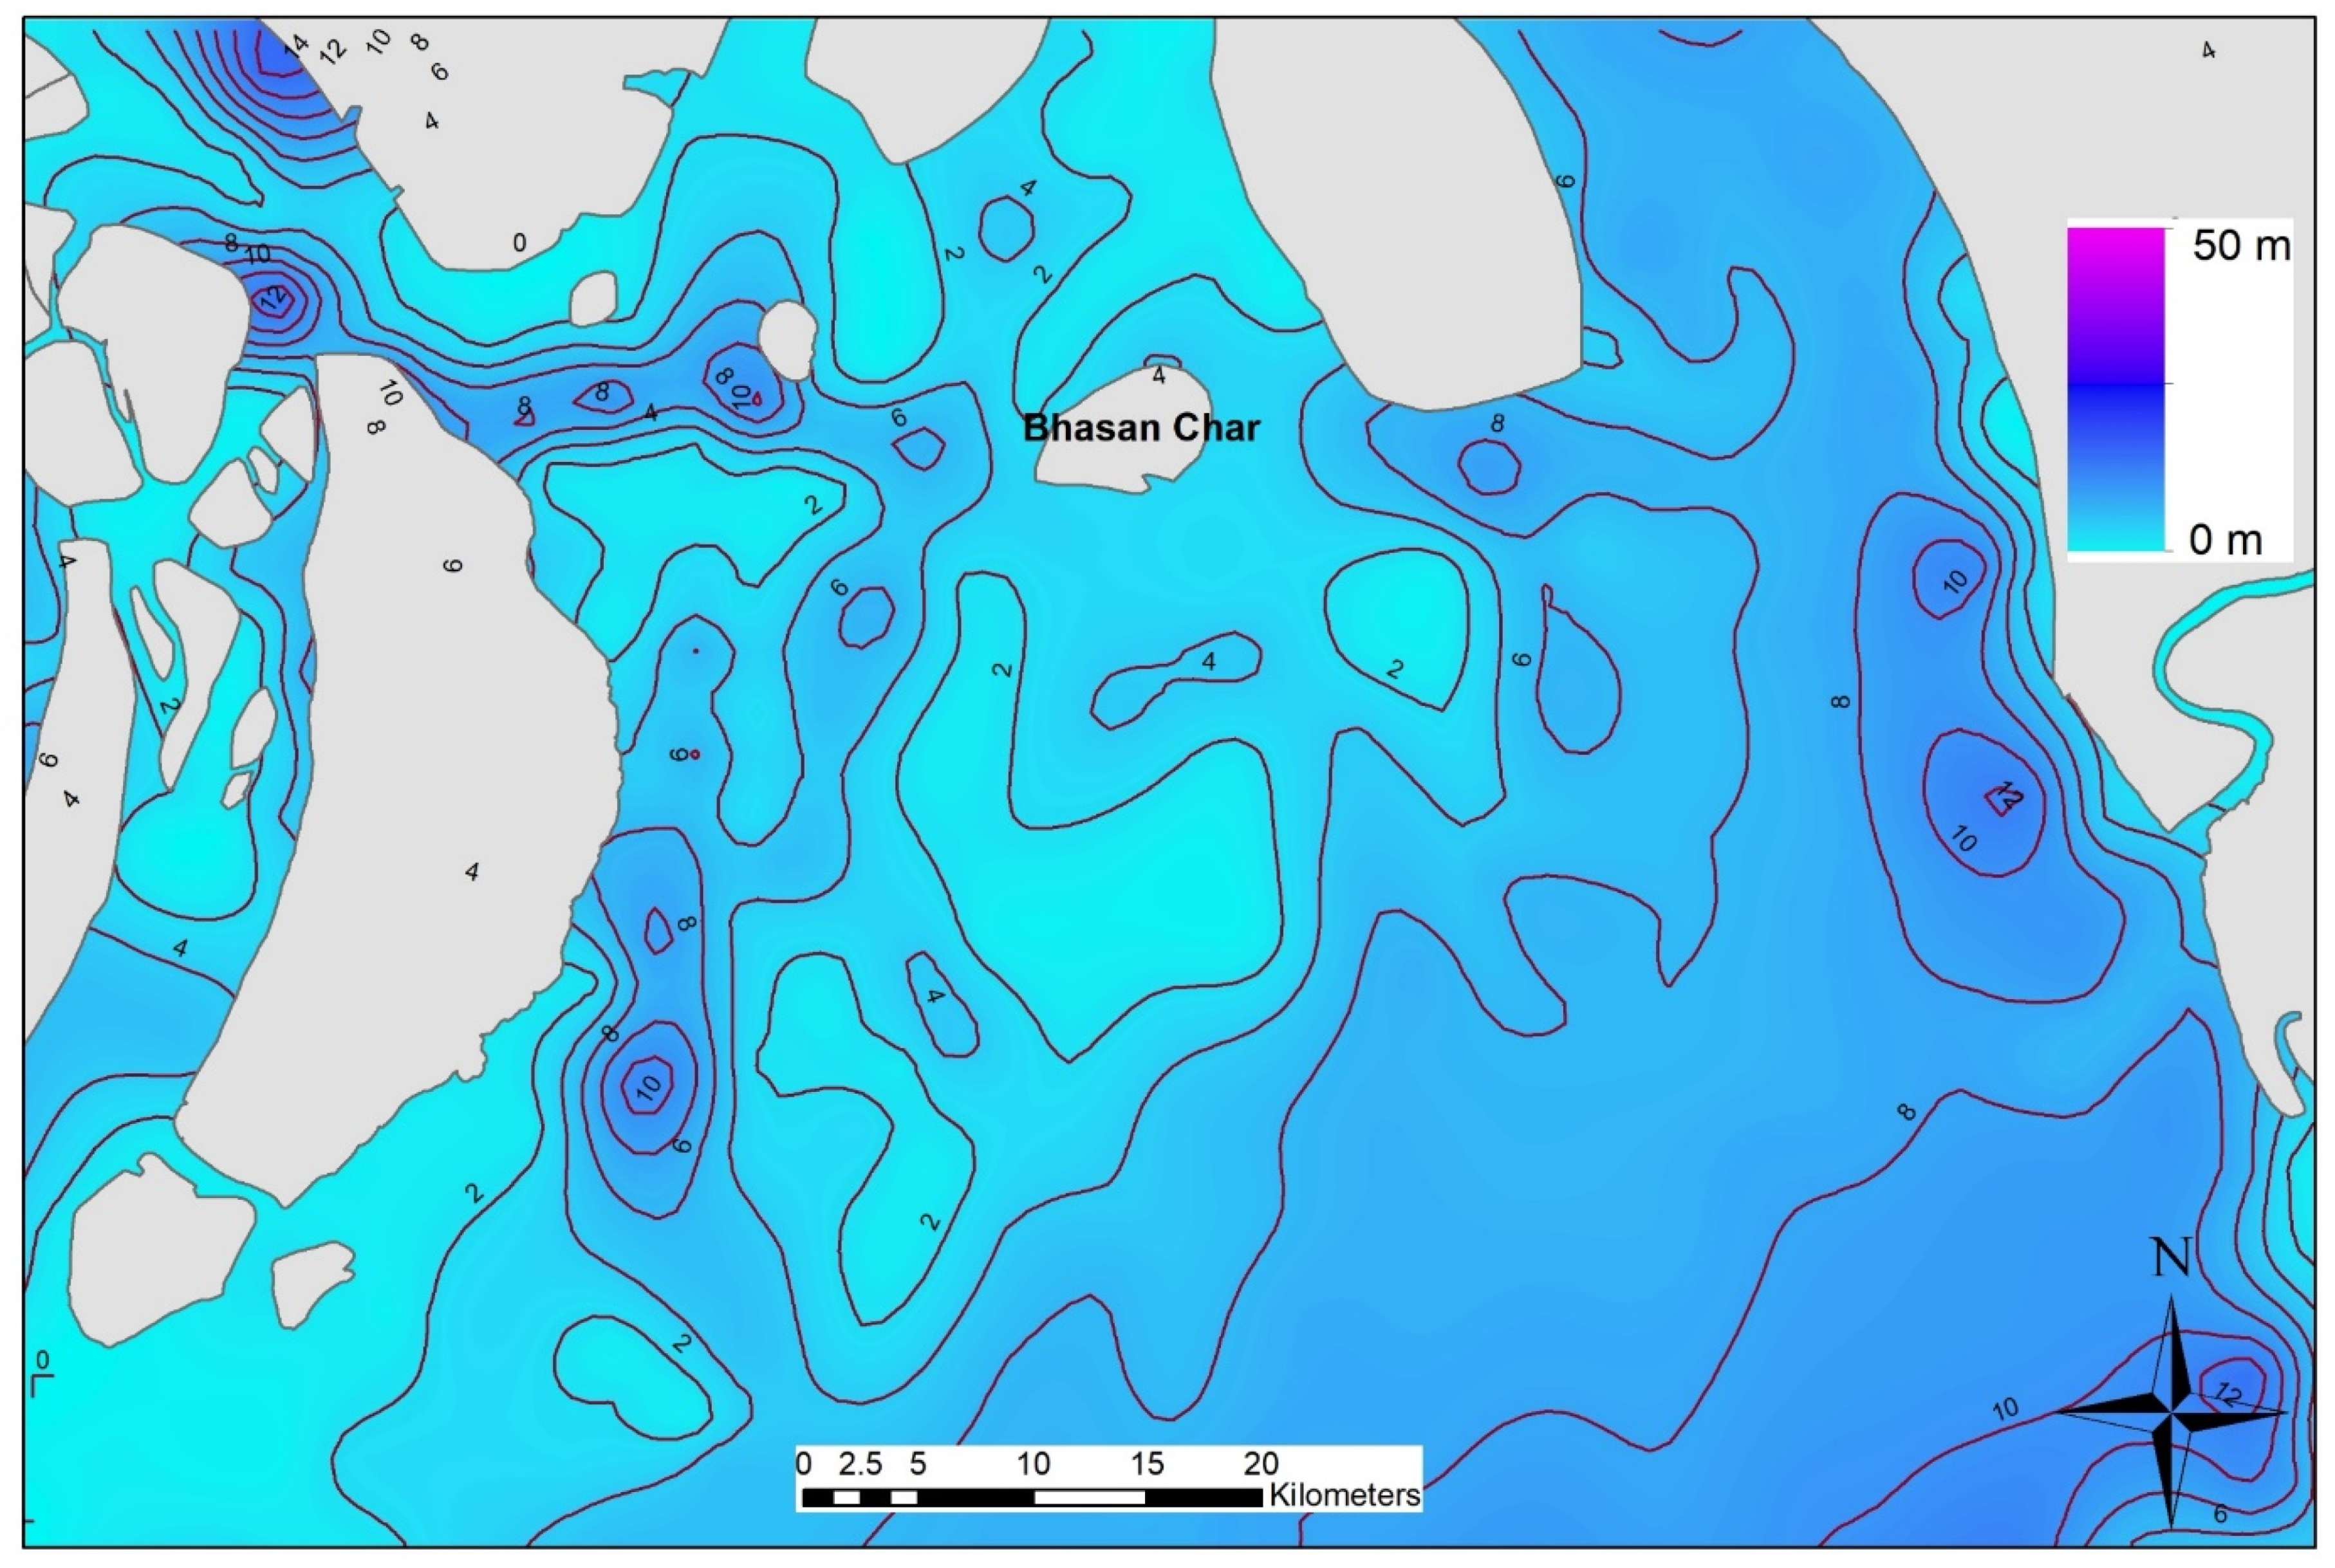
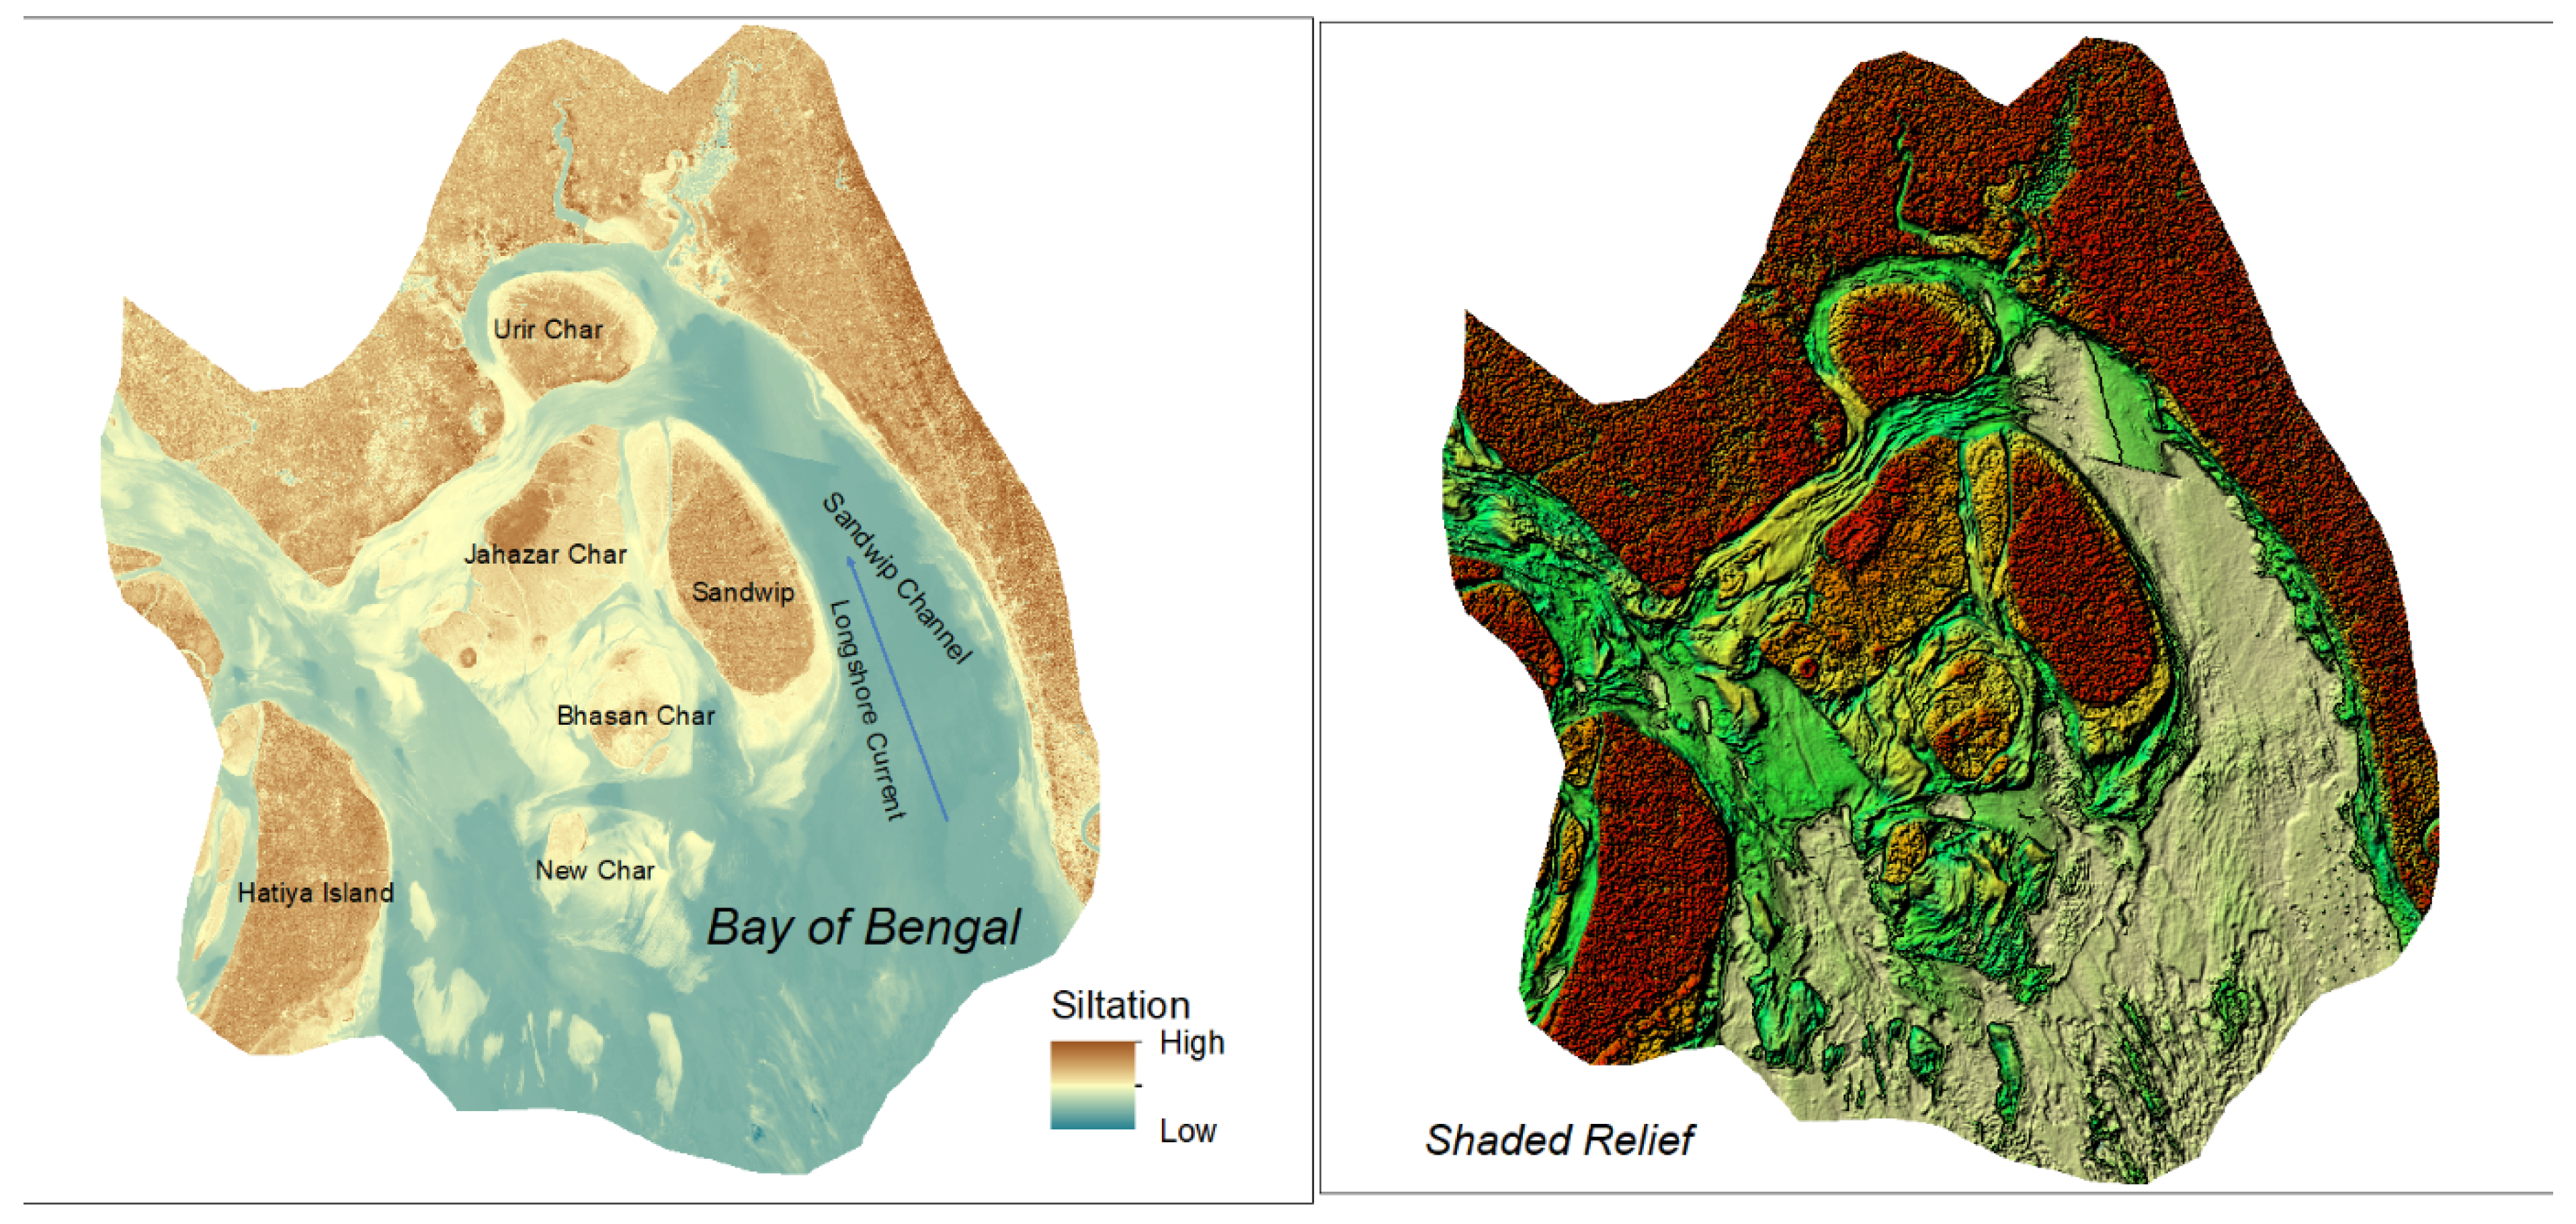
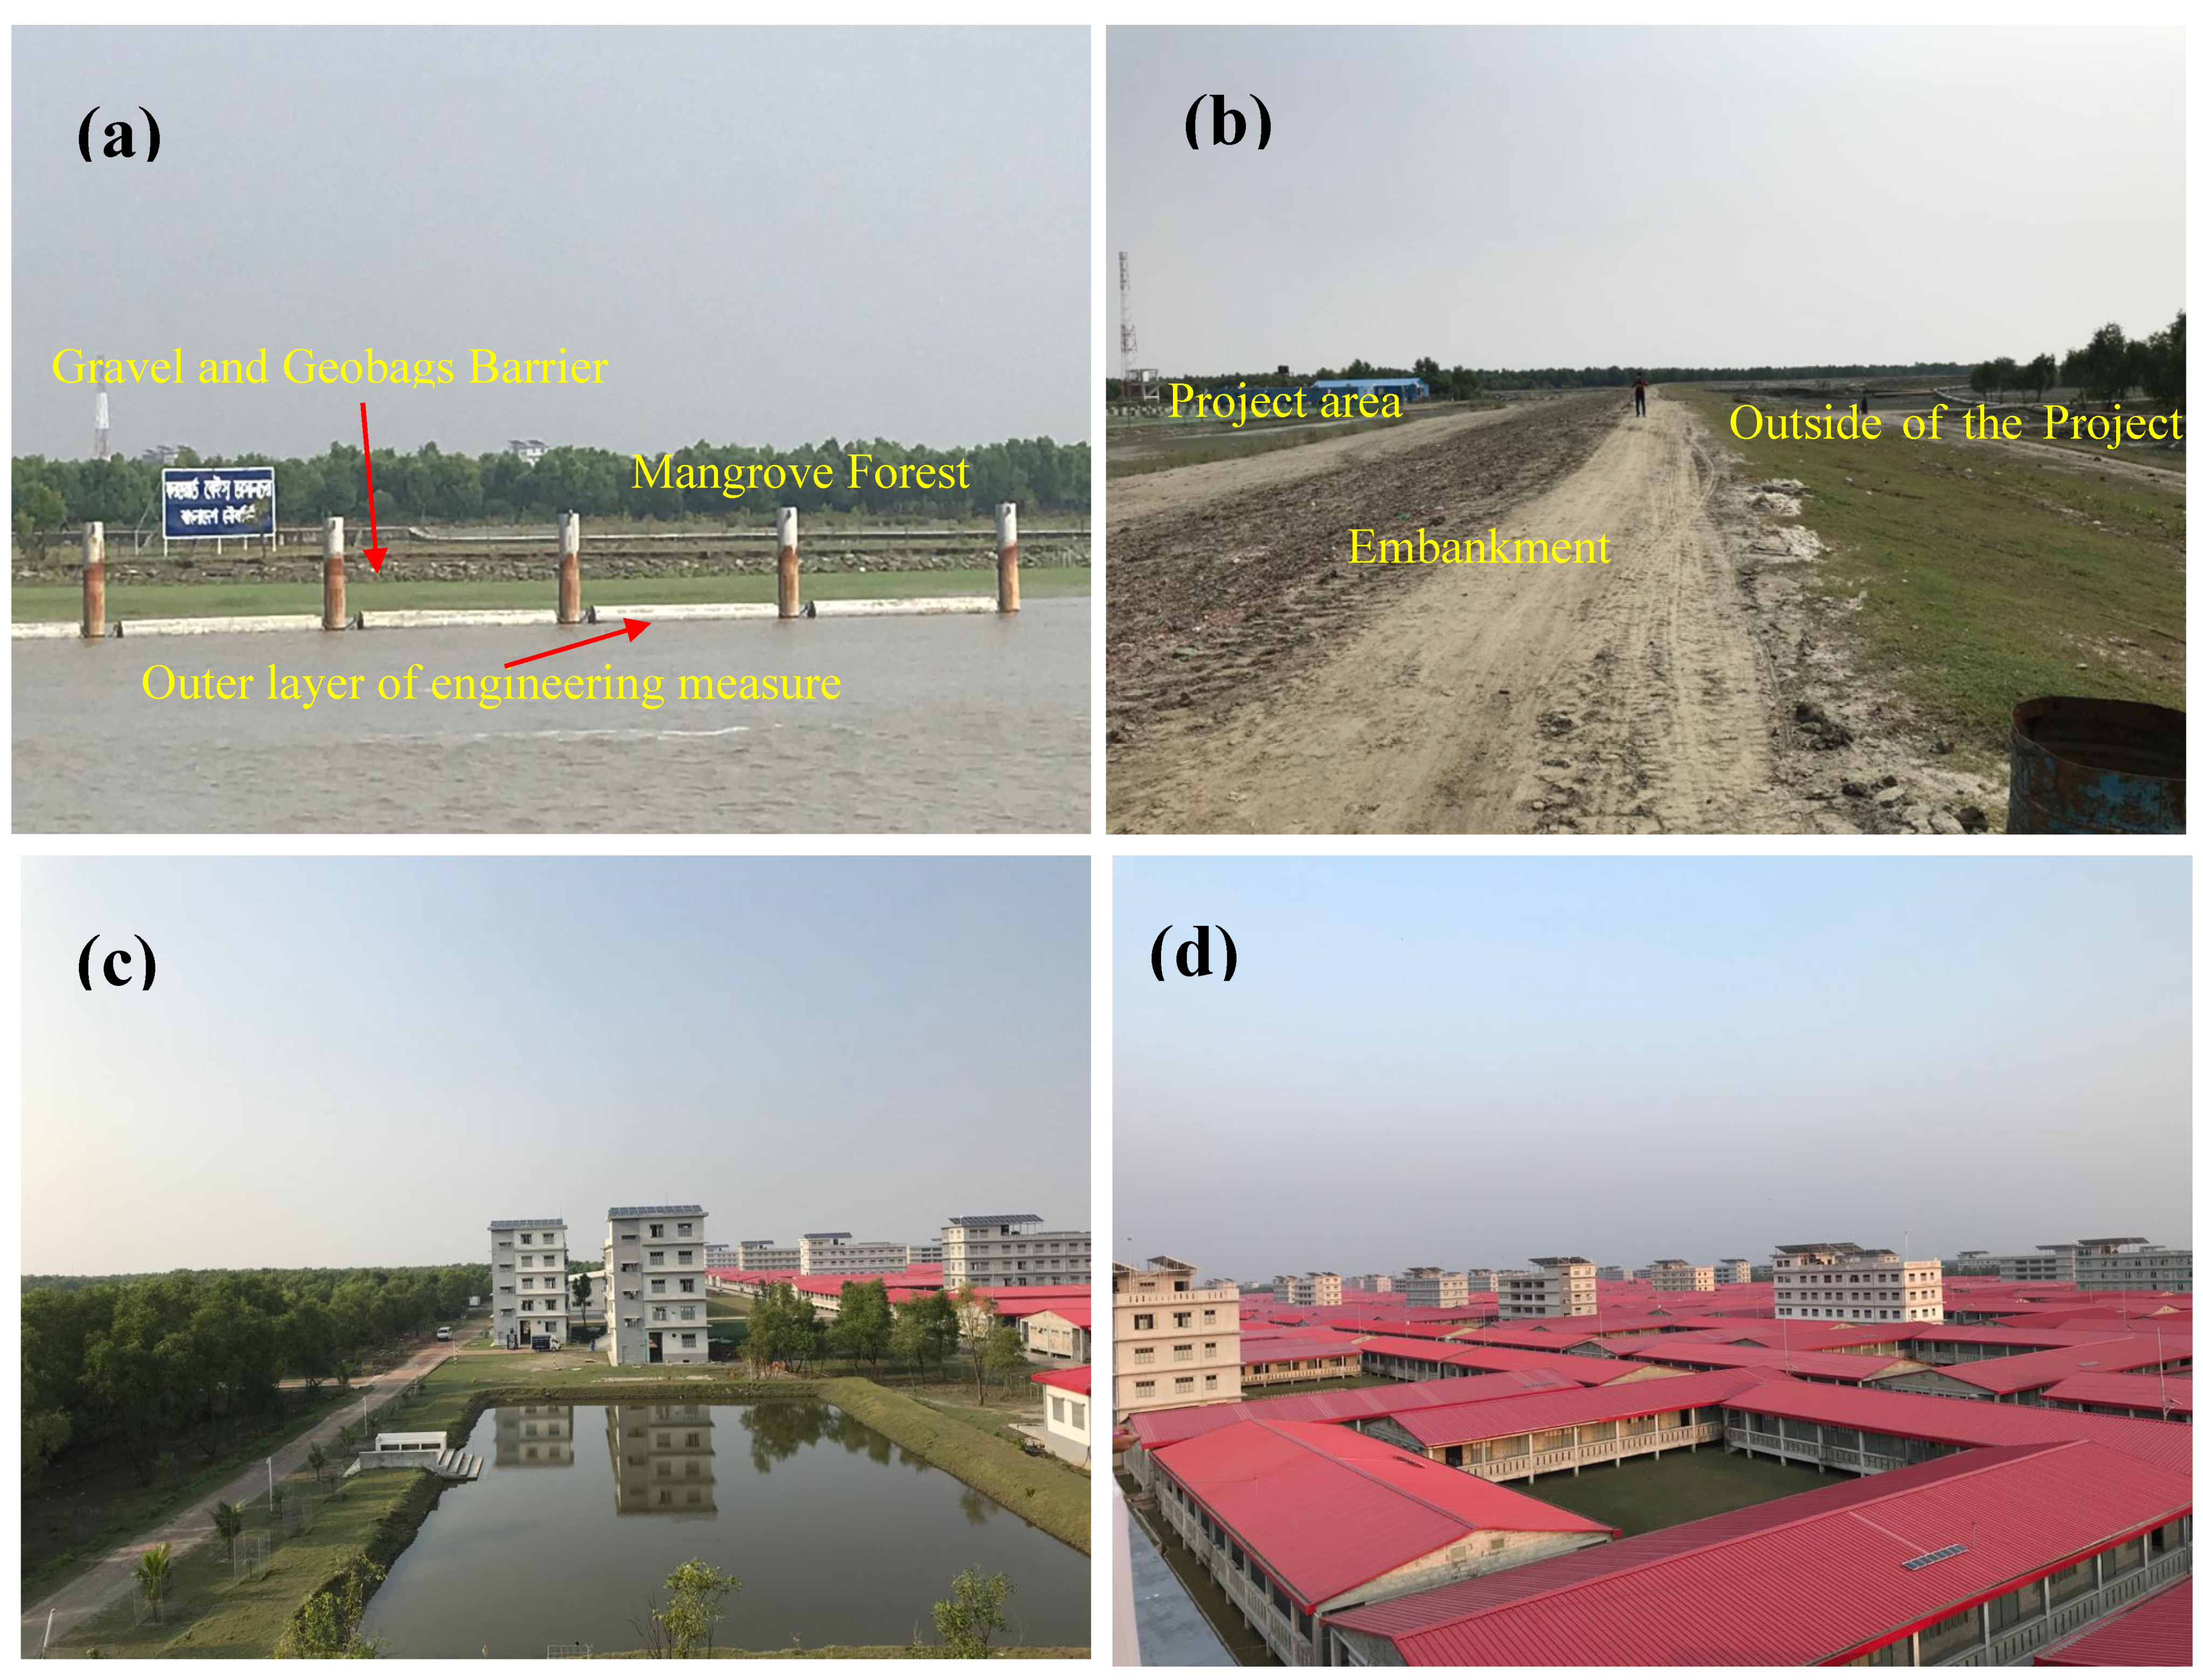
2.1. Study Area

Bhasan Char was previously named Thengar Char, also known as ‘Floating Island’ that has been selected for FDMN as a temporary settlement. Geographically, the island is located in the Bay of Bengal within the Sandwip Upazila, Chittagong District, Bangladesh (Figure 1). It extends from 22°20′ N to 22°27′ N latitudes and 91°21′ E to 91°27′ E longitudes. Bhasan Char is away from Hatiya and Sandwip Island (as shown in Figure 1) approximately 24 km and 6 km, respectively. The total areal extent of the island is nearly 80 km2 and the average elevation of the island is about 2.84 m above the mean sea level (Figure 1).
The monthly average temperature of this island varies from a minimum of 27 °C to a maximum of 36 °C. The lowest precipitation recorded is approximately 2.18 mm in January and the highest amount of rainfall received by this region is around 333 mm in July, whereas the humidity varies from 61 to 81%. Throughout the last five years, the area of this island varied from 39–76 km2 (Braun and Hochschild, 2018). The monthly average windspeed fluctuates from 7.7 kmph in January to 19.7 kmph in June, and monthly average pressure ranges from 1000.6 to 1014 mb [44]. Due to huge riverine discharge, the wave height of this region is relatively low and remains around 0.5 m from January to March, whereas the peak significant height is recorded at 1.22 m in May [45]. However, this wave in the Meghna estuary is highly dominated by the complex tidal circulations [46]. Tropical cyclones frequently visit to the southern part of Bangladesh from which around 1.54 million people lost their lives. Recently (26 May 2021), the cyclone YAAS crossed this region but the area was only mildly affected. The GoB has constructed buildings, helipads, flood protection embankments, cyclone shelters, and roads for the settlers [47].
Recently, the Bangladesh forest department has launched an afforestation program to vegetate and stabilize the island. The island is planted with mangrove forests and covered by grasses and shrubs in some areas [44]. Morphologically, the island is a low-lying sand-flat with gentle undulations (sand dunes with gentle windward and lee sides). The lithology predominantly consists of medium-grained sand and silts with subordinate clays of the Holocene age. The island is drained by numerous tidal channels and creeks. Tectonically, the area is located east of the Hatiya trough and adjacent to the Barisal gravity high (Figure 4). The tidal system in this area is the semidiurnal type.

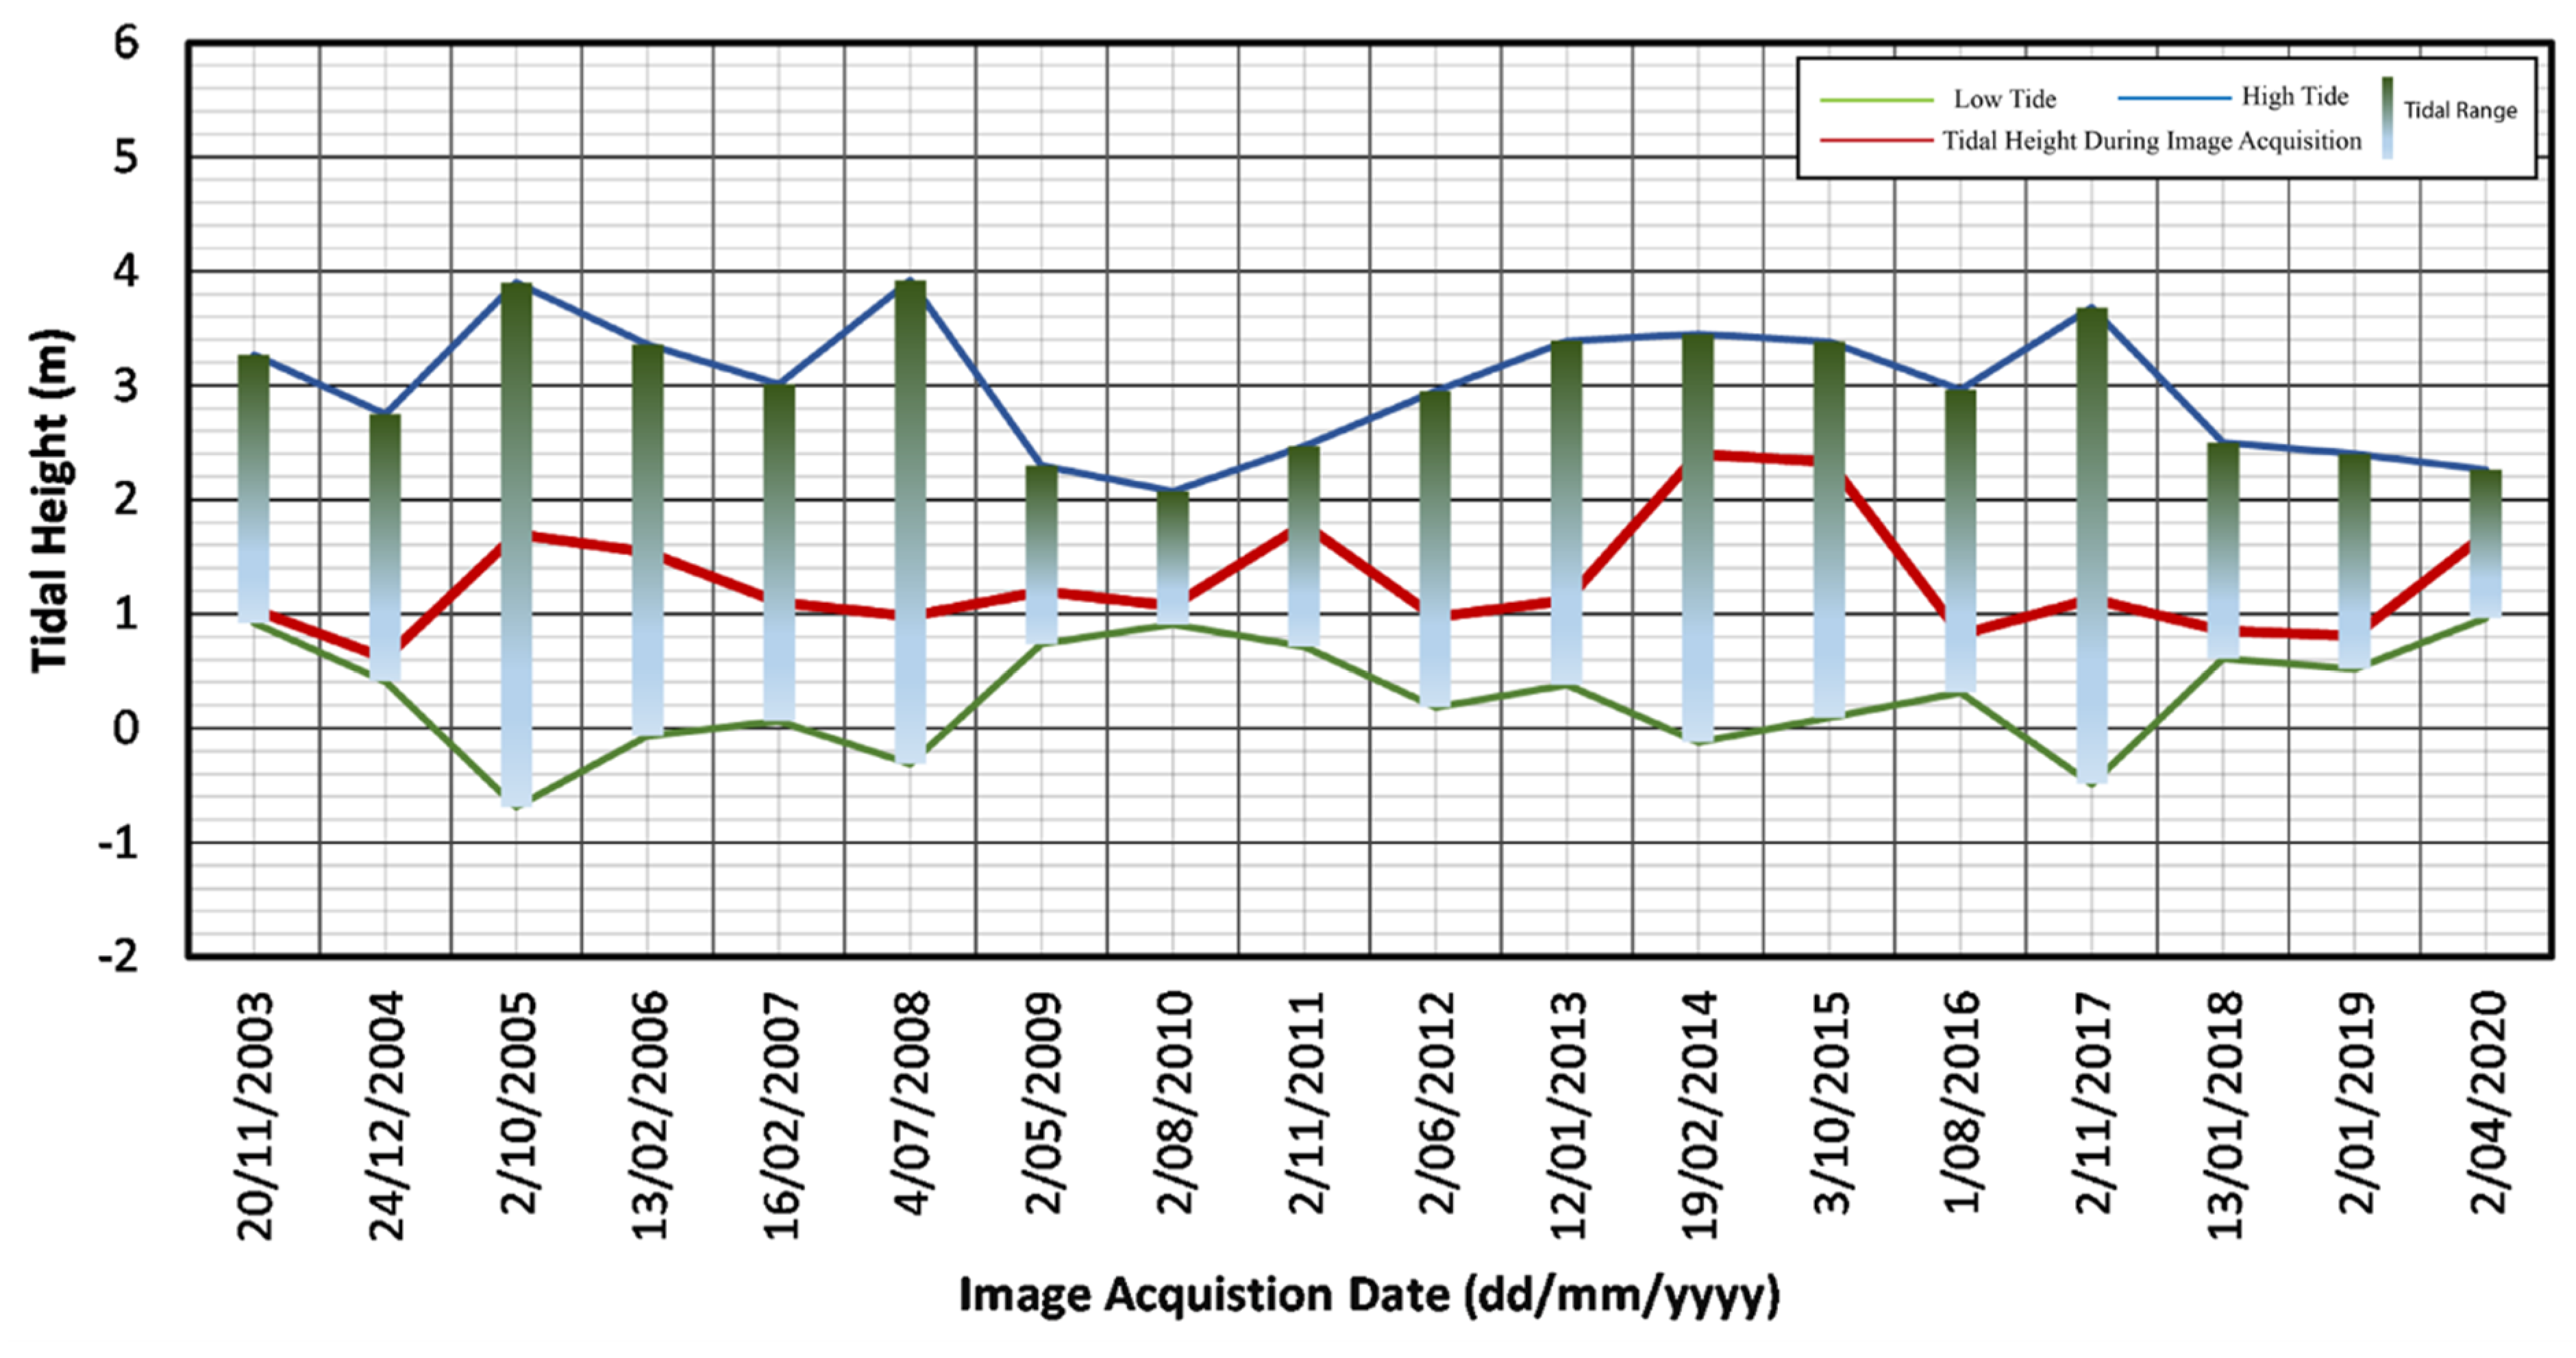
2.2. Acquisition of Satellite Image

Satellite images used in this study have been selected by considering the tidal data of the respective date of image acquisition to obtain the precise location of the shoreline (Figure 2). Tidal data of the Charchanga tidal station has been used in this study. Initially, tidal data from 2003 to 2020 were analyzed to identify the signature of storm surge, cyclone, and coastal flooding to remove the anomalous tidal height (Table 1). Here, daily tide in formation data was collected from Bangladesh Meteorological Development (BMD), from which monthly average and finally yearly average tidal characteristics were analyzed. The study utilized the rule of twelfthsto calculate the tidal data. From this analysis, the study chooses some dates for image selection considering tidal range, image quality, cloud cover, and other atmospheric effects.

2.3. Description of the Satellite Datasets

Multi-temporal Landsat satellite images (Landsat MSS, TM, ETM+, OLI-TIRS) and subsurface seismic data have been used to study the dynamics and stability of Bhasan Char Island. Landsat satellite images from 2003 to 2020 with a one-year interval have been used for time series analysis and at approximately 3 years intervals for digital shoreline change analysis. Landsat MSS, TM, ETM+, OLI-TIRS data used in this study, were downloaded from the (https://earthexplorer.usgs.gov/ (accessed on 5 April 2020)) United States Geological Survey (USGS). Images of the dry season (December–April) have been selected by considering less than 10% cloud cover, good visibility, and high quality (Table 2).

2.4. Satellite Image Analysis

Downloaded images are stored in GeoTIFF format with World Geodetic System (WGS1984) datum and Universal Transverse Mercator (UTM) zone 46N projection. Initially, individual bands for each scene have been stacked in ERDAS IMAGINE 14 without thermal band and band 1. To get a specific study area, a subset operation has been done. Radiometric correction and atmospheric correction have been applied to improve the quality of the images. The erosion line for each of the respective images have been delineated by considering mean tidal range as calculated from the tide table.
Accurate shoreline extraction is difficult, as it is the most dynamic feature in the world, and changes within a short period [48]. There are many different methods for shoreline extraction including the automated water index method [49]. Before applying DSAS, different indices have been used to ease the process of shoreline extraction by simply differentiating land and water boundaries more accurately (Figure 3). For TM, ETM+, the study used McFeeters’s Normalized Difference Water Index (NDWI) and Xu’s Normalized Difference Water Index (NDWI) [50,51]. Modification of Normalized Difference Water Index (MNDWI) was used for OLI sensor [51]. NDWI for MSS and TM sensor [50] as:
N D W I = ( G r e e n N I R ) / ( G r e e n + N I R )
where Green represents the reflectance of the green band (band 2 for TM) and NIR represents the reflectance of the near-infrared band (band 4 for TM). The values of NDWI ranges from −1 to +1. Water shows positive values and soil or vegetation shows negative values. Hence, the shoreline can be extracted from the contrast between land and water [49]. Xu’s equation for MNDWI for TM and ETM+ sensors:
M N D W I = ( G r e e n M I R ) / ( G r e e n + M I R )
where Green represents the reflectance of the green band (band 2 for TM) and MIR represents the reflectance of the middle infrared band (band 4 for TM). The values of MNDWI ranges from −1 to +1. Water shows positive values. Xu’s MNDWI equation for OLI sensor is expressed as:
M N D W I = ( G r e e n S W I R ) / ( G r e e n + S W I R )
where Green represents the reflectance of the green band (band 3 for OLI) and SWIR represents the reflectance of the short-wave infrared band (band 7 for TM). Xu’s MNDWI is more effective for the extraction of the edge between land and water [42]. After getting automated shoreline minor manual error corrections have been adopted [41]. The image threshold value differentiates the two classes. As the automated method has been adopted in this study to extract shorelines, threshold values are generally set to zero for McFeeters’s and Xu’s NDWI or MNDWI [50,51]. But sometimes it needs to adjust the threshold for more accurate water bodies’ delineation [52]. Classification with a threshold value of the NDWI and MNDWI of TM, ETM+, and OLI imageries has provided sharp edges between lands and water. Island area at different time intervals has been extracted by drawing a vector of the edges from the imageries. Vectors have been extracted from the imageries for the respective years and the area of the island has been calculated by ArcGIS. Area and shoreline gain was calculated by subtracting the value of the previous year from the value of the current year. Negative values represent the loss of area. GCPs for validating the satellite images have been collected from different land covers (waterbodies, vegetation, bare land, and settlements) by GPS during field investigations. Tide correction has been employed with the help of the tide table recorded by the tidal station.

2.5. DSAS Analysis

Shoreline shifting measurement requires a shoreline vector inline or polyline format [53]. Therefore, NDWI, MNDWI images of TM, ETM+, and OLI sensors are classified with the threshold value. Then, ArcGIS 10.7 software has been used to convert the classified images into a vector. Polygons were used to obtain the gradual, long-term, spatiotemporal variation of shape and extent of the study area and polylines were for shoreline shifting measurement. Then DSAS version 4.4, an extension for ArcGIS, was used for the shoreline shifting measurement. DSAS creates transects with baseline and shoreline, and then calculates shoreline rates of change through time according to the measured shoreline position difference [53]. The total recorded length of the shoreline is around 55.23 km and the study area includes a total of 114 transects. Transects have been cast in such a way to intersect all the shorelines at different lengths and spacing intervals of 100 m. Due to the breaking of the shoreline, the furthest intersection has been utilized as a shoreline intersection parameter. For a better understanding of the measurements, the study area is separated into four segments, namely A, B, C, and D. Net Shoreline Movement (NSM) and End Point Rate (EPR) have been calculated using the extension. NSM is the distance (meter) between the youngest and the oldest shoreline in transects and EPR is the rate (meter per year) which is the net movement divided by time passed in the youngest and oldest shoreline in transects [53]. NSM and EPR are the universally frequently used statistical methods for shoreline shifting [54].

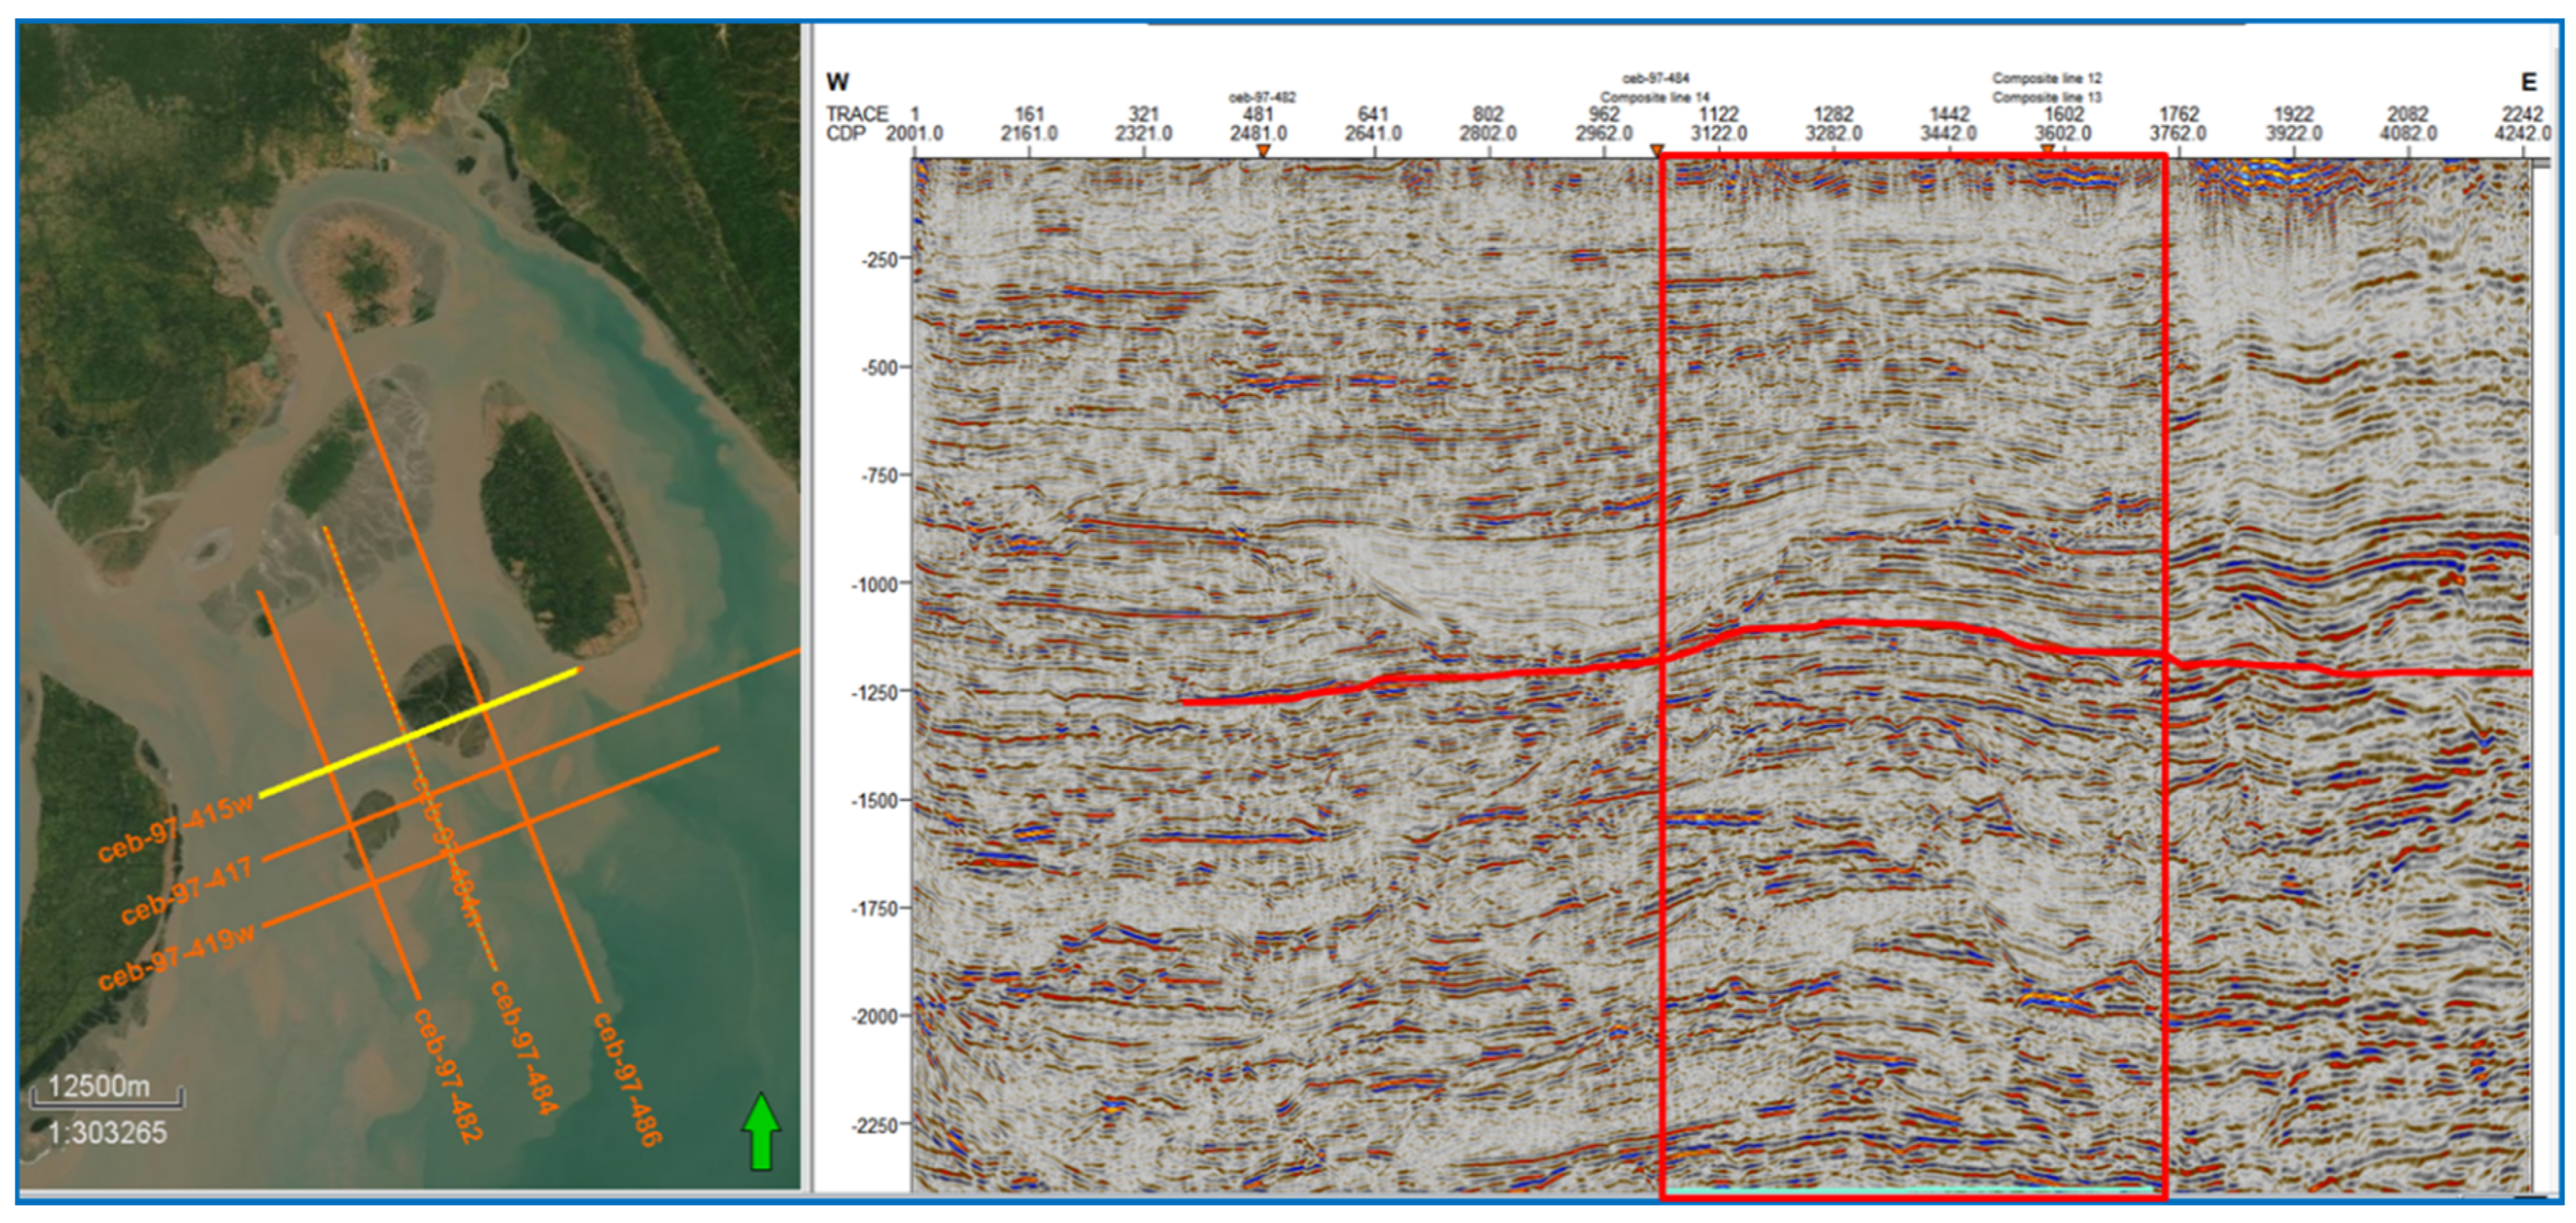
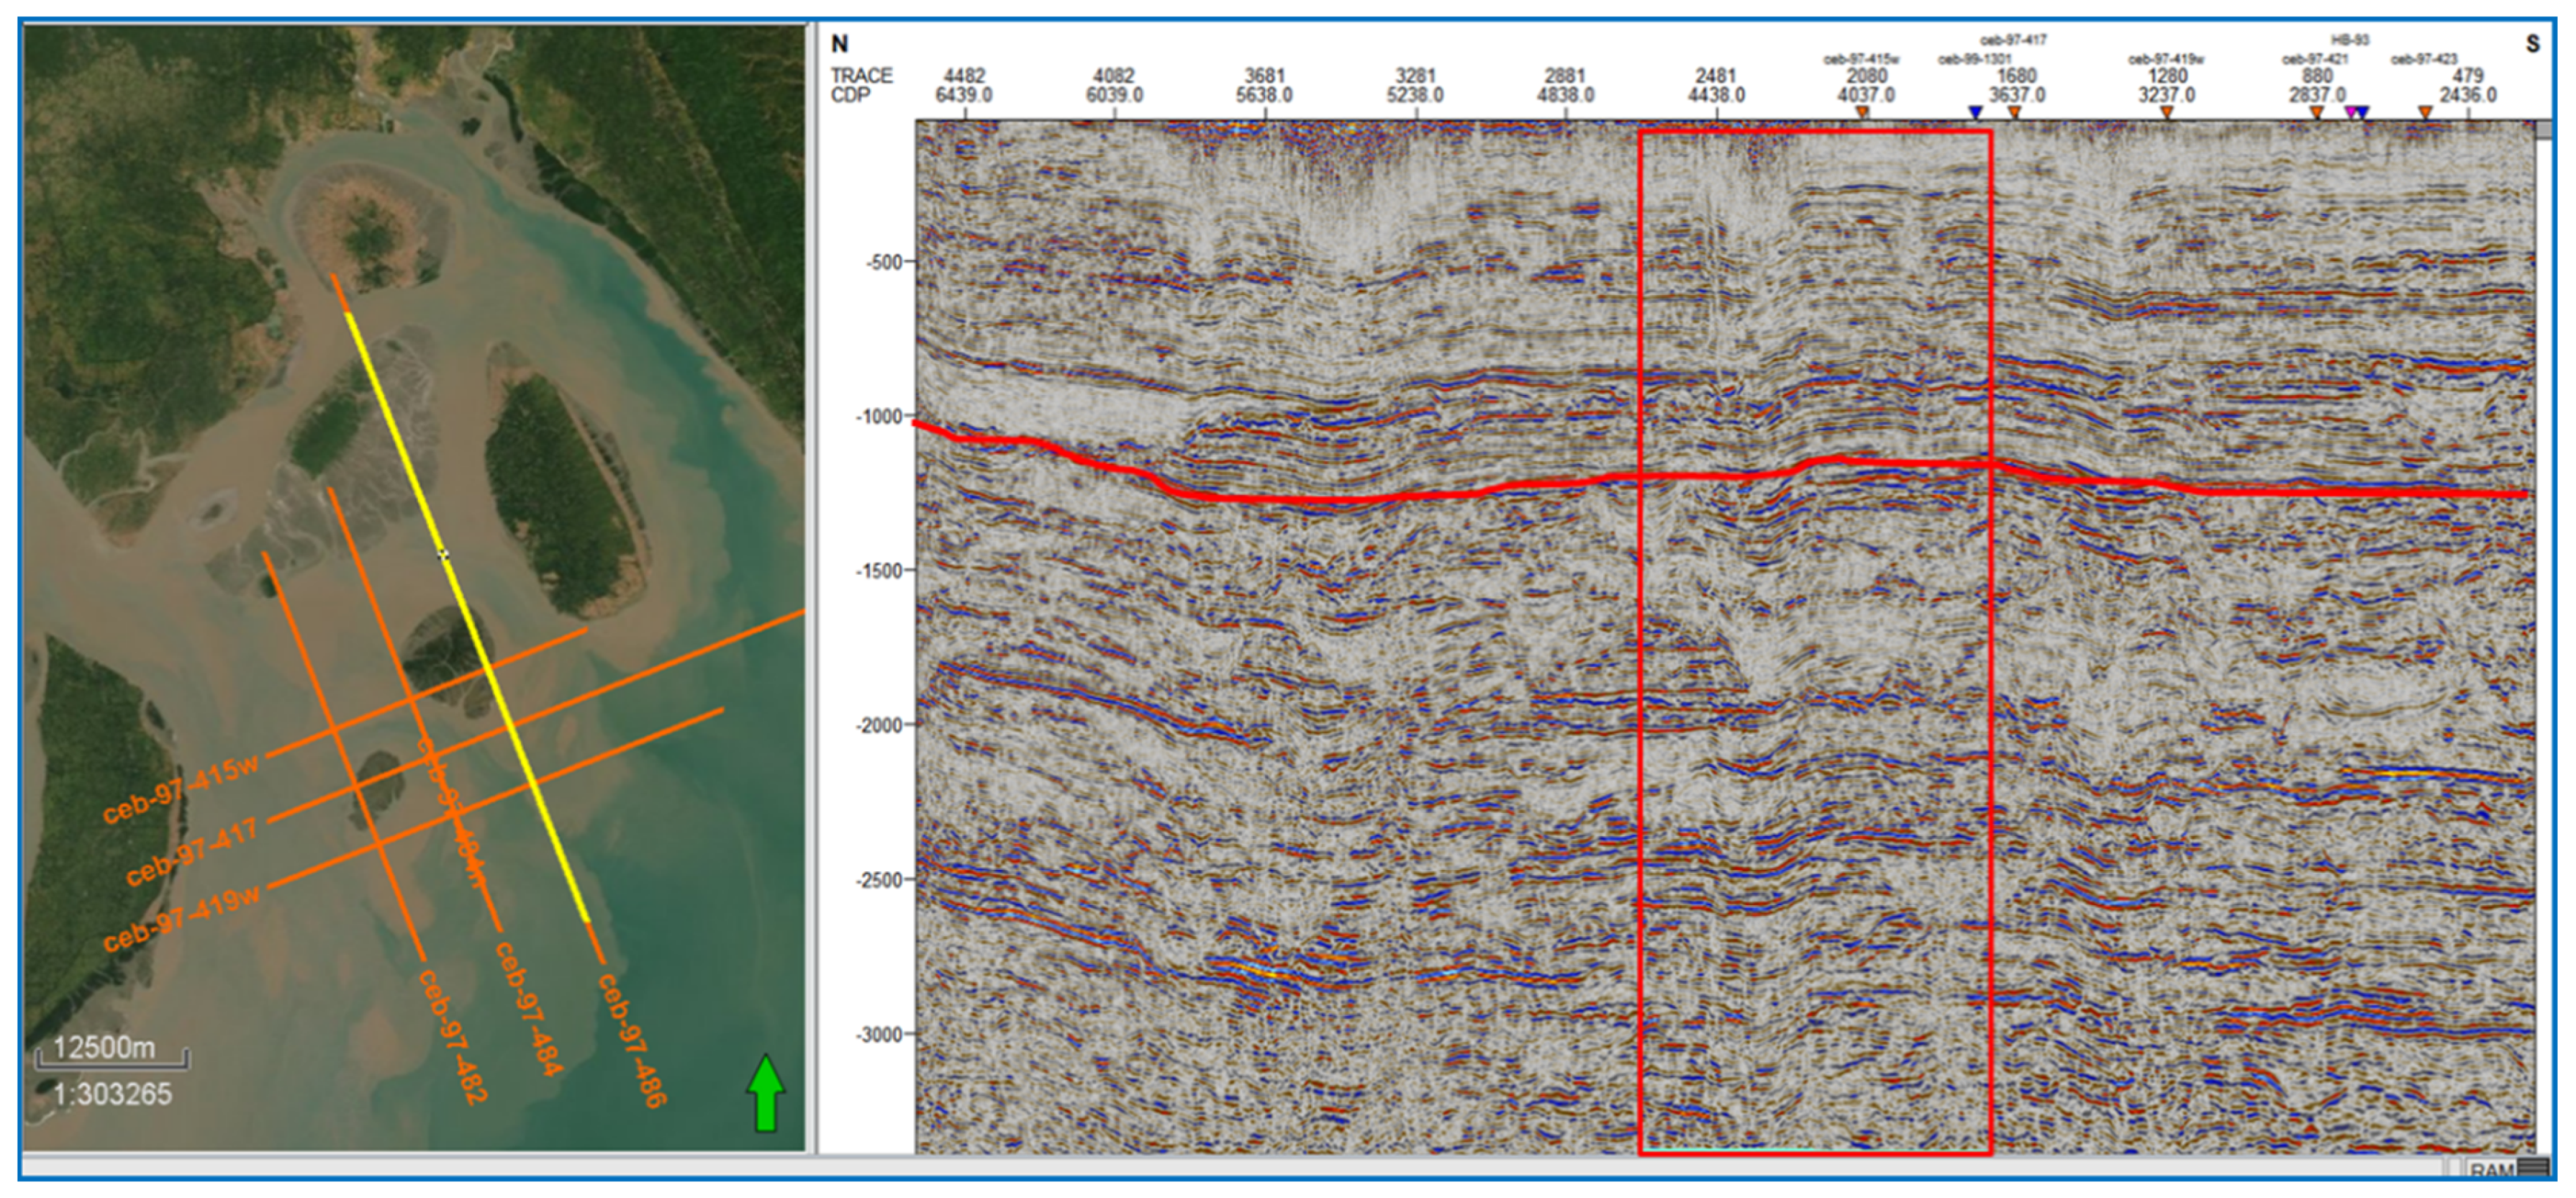
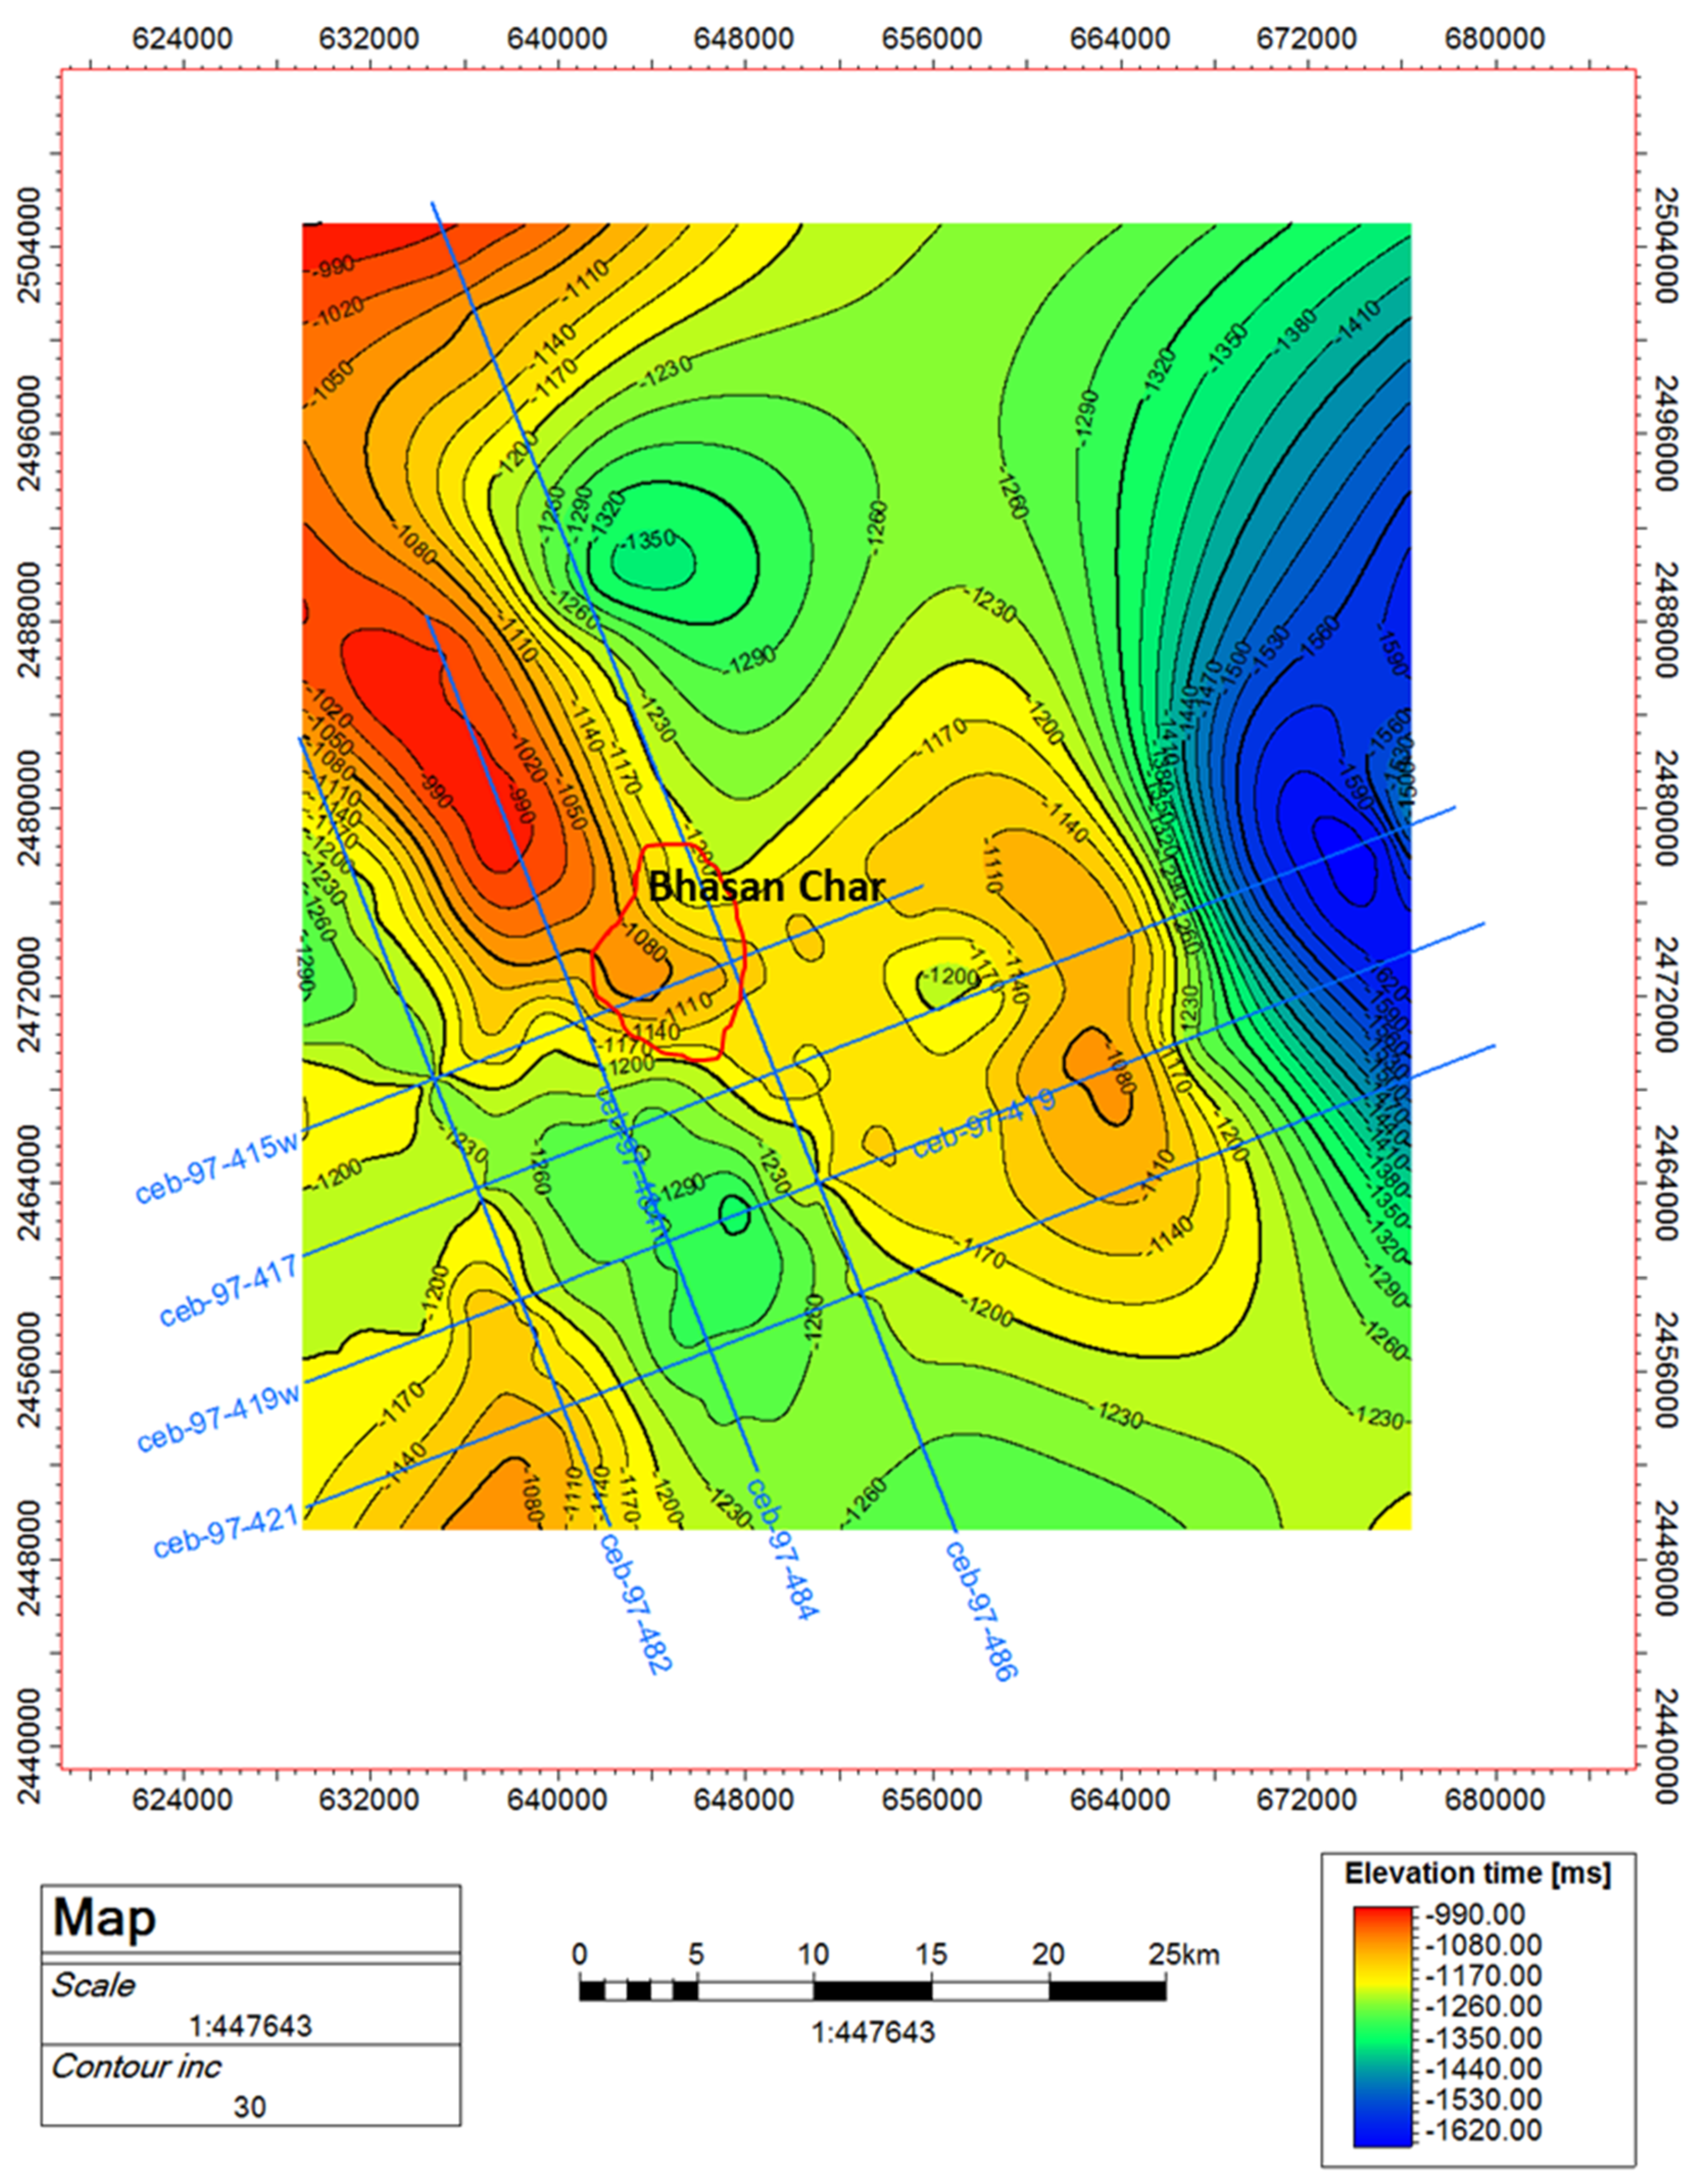
2.6. Seismic Data Analysis

A total of six 2D seismic sections in and around the Bhasan Char Island provided by Petrobangla have been used to study the subsurface structural behavior of the island. Seismic data are given in time for subsurface interpretation. Seismic data is also used to predict the subsurface lithology and possible depositional environments comprising the island. Processed seismic data acquired in 1997 are given in time. The data up to 6-min is of very good quality and suitable for subsurface interpretation. Following the overall structural trend of the Eastern Fold Belt of Bangladesh, the regional structural trend of Bhasan Char Island and the adjoining area is in the NNW-SSE direction. Data used in this study includes three strike and three dip lines (Figure 4).

2.7. Groundwater Quantity and Quality Analysis

To assess the availability of water, a test borehole of around 450 ft near the shelter-45 has been dug in the island and the detailed lithology recorded in each depth interval. It has also planned to install four monitoring wells in different areas of the island. Analysis of the groundwater samples has been performed in the laboratory of the International Centre for Diarrhoeal Disease Research, Bangladesh (ICDDRB) and the zonal laboratory of Department of Public Health Engineering (DPHE). Bacterial analysis was done by following the membrane filtration and culture method. Arsenic, Iron, and Chloride concentration were measured by the atomic absorption spectrometry (AAS) method.

3. Results

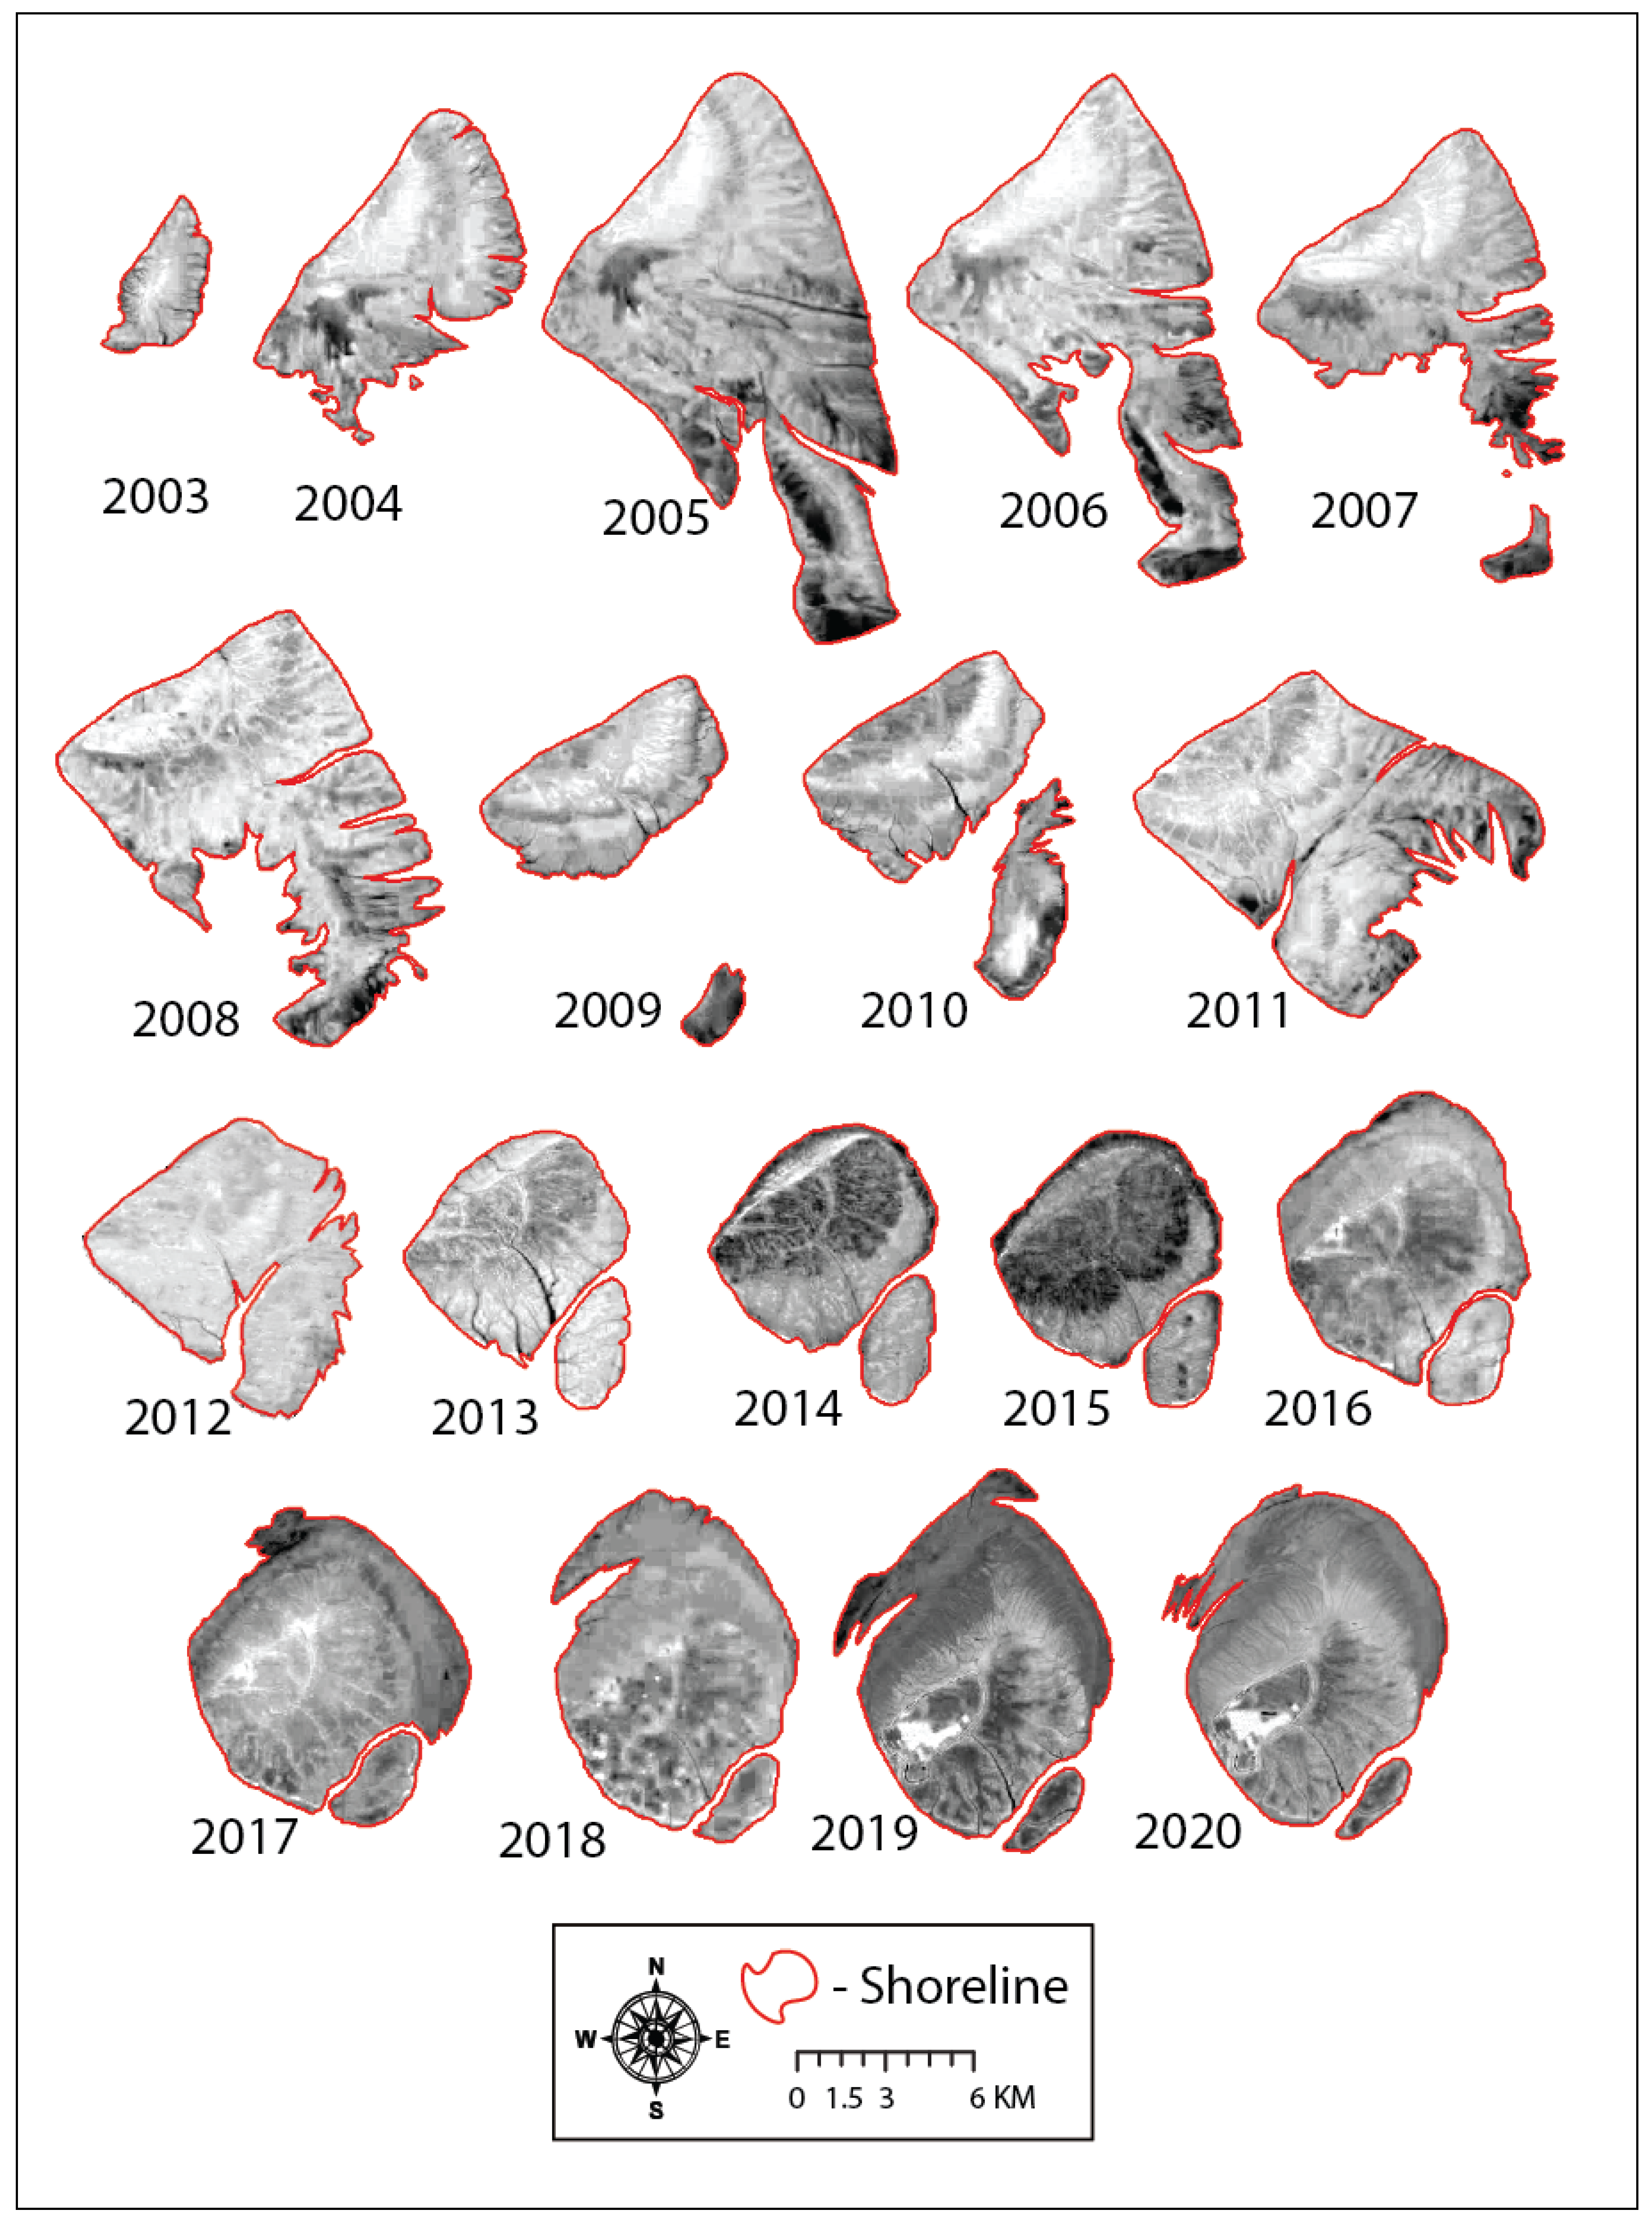
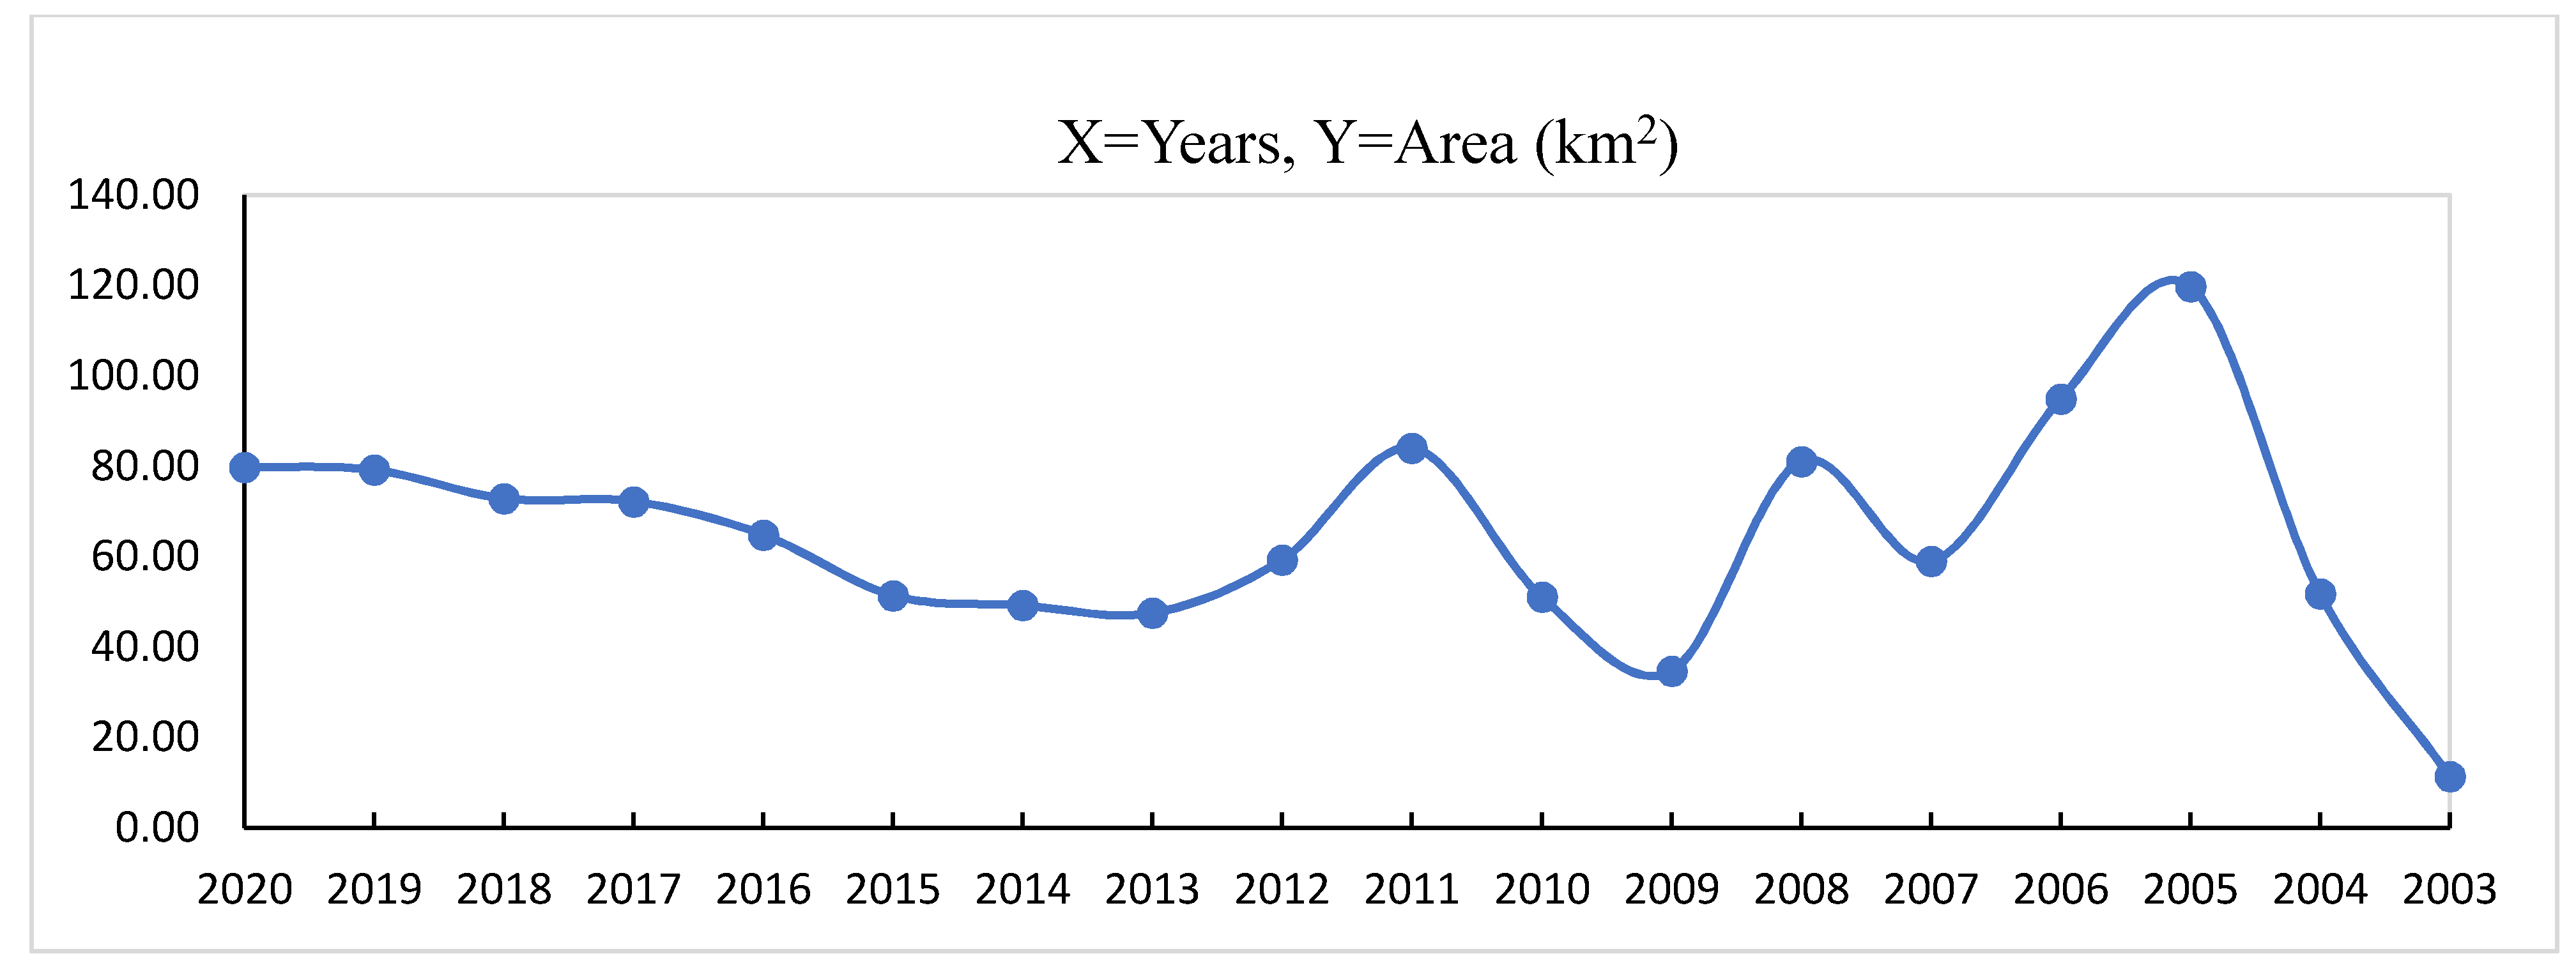
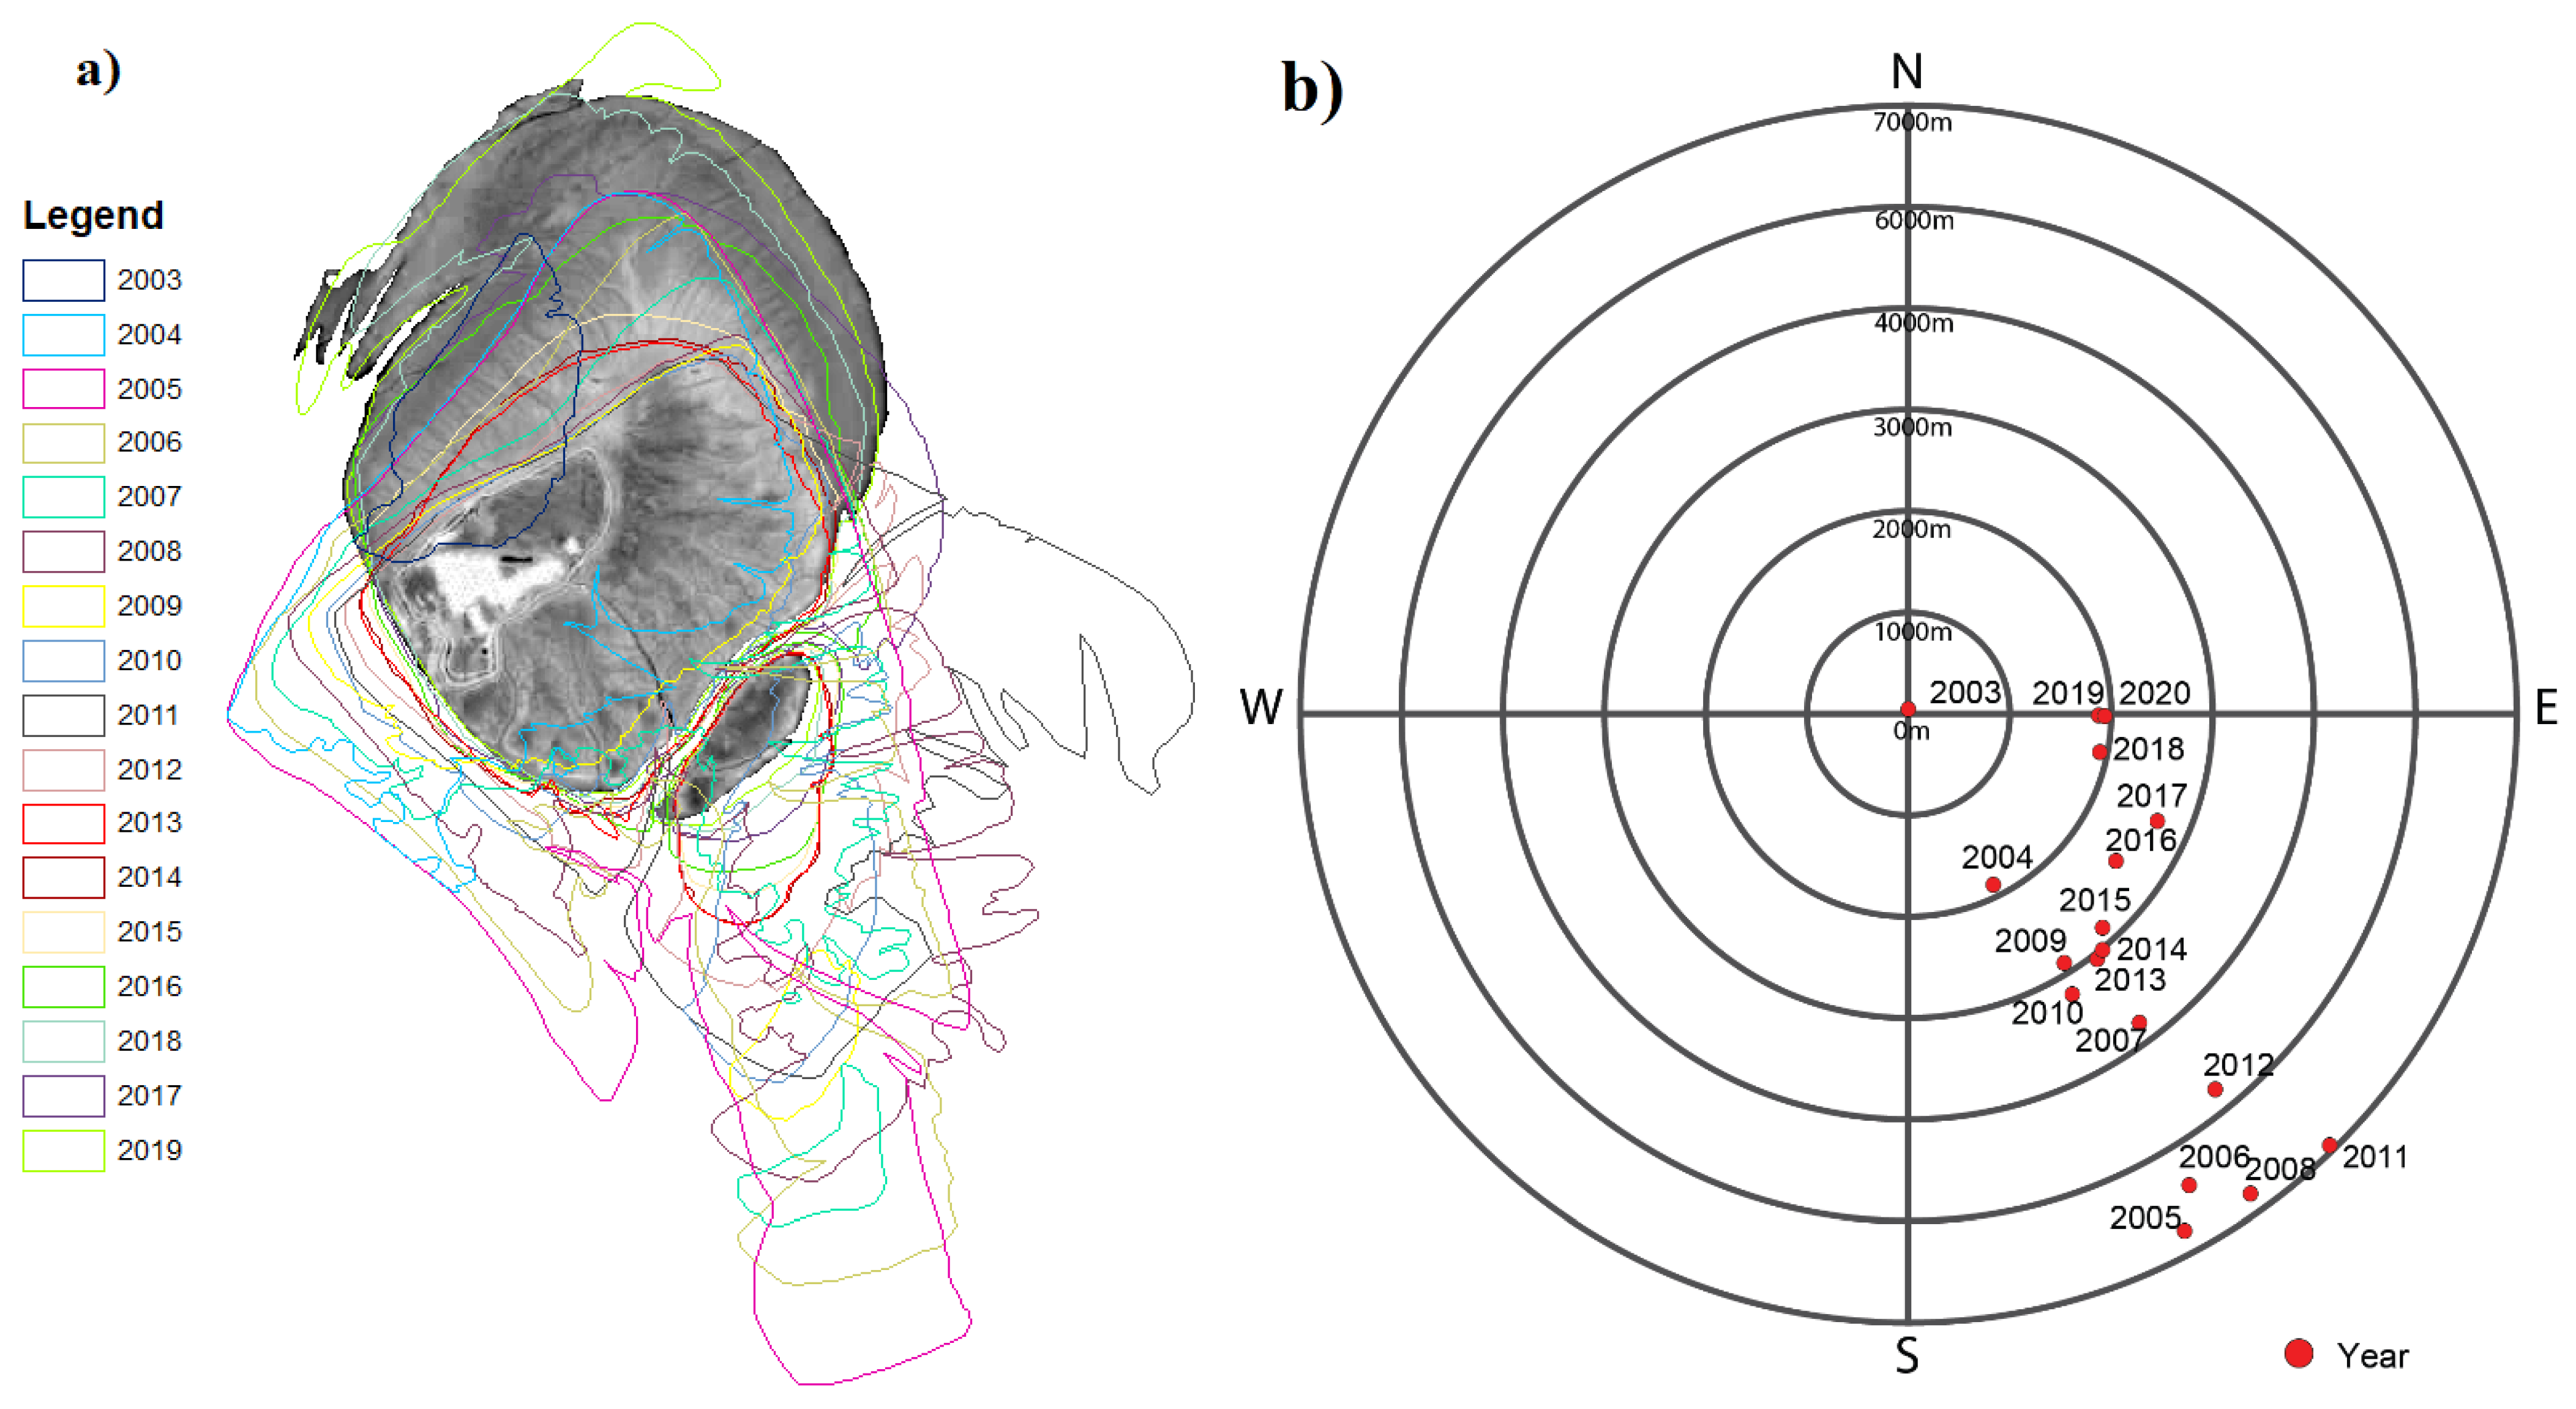
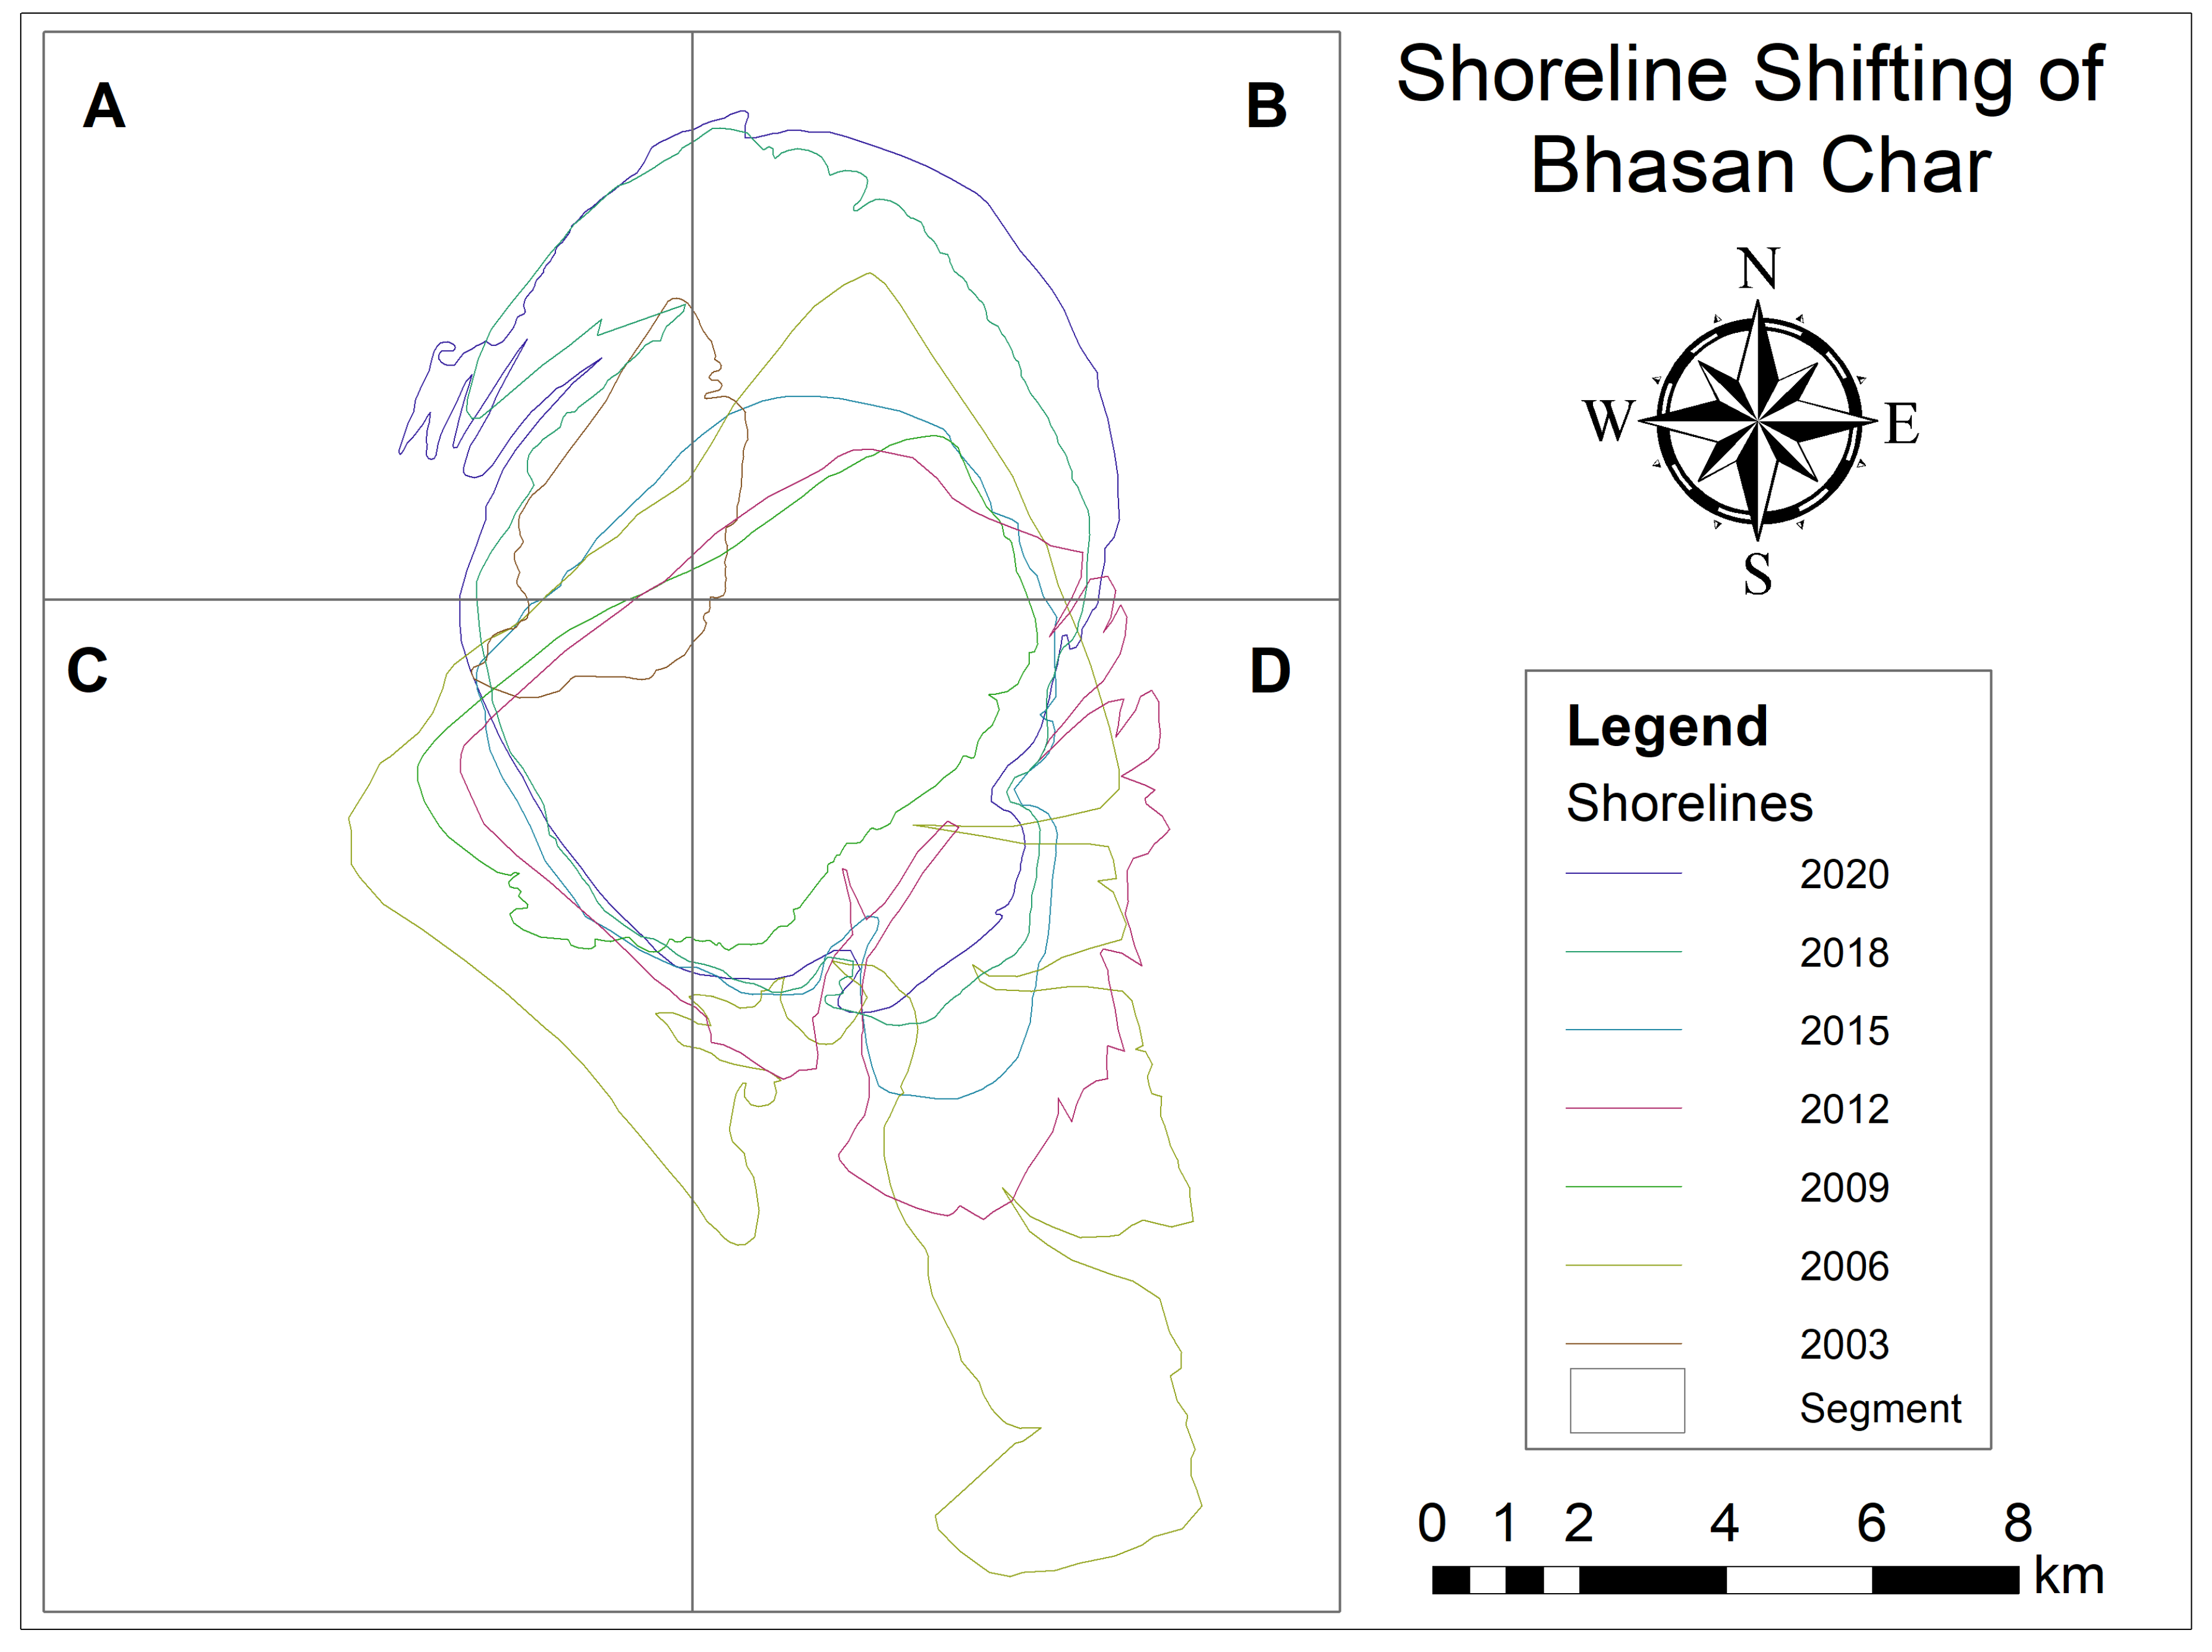
3.1. Spatiotemporal Morphological and Aerial Dynamics

The island has undergone significant morphological variations in the last two decades. The size of the island increased about 5 times within a one-year interval from 2003 to 2004, accounting for about 40 km2 in aerial growth. It is noted that the island emerged as the highest aerial coverage (119.75 km2) in 2005 throughout the study period and again diminished around half (58.97 km2) of the island in 2007 (Figure 5). There is a huge fluctuation in the island morphology and surface extent that has been noticed from 2003 to 2011, probably due to the shifting of sediment depocenter and sediment supply at different times along sediment reworks by tides and waves. During 2003–2012, the island-maintained head-and-tail shape pattern that progressively evolves to rounded to sub-rounded shape in recent times, and maximum modifications occurred in the tail part of the island (Figure 6). From 2009, the tail submerged leaving a tiny island at the southern part, and appeared again in 2010 but as two distinct parts. After that, through 2011–2016 the island has changed from a rectangle shape to a sub-rounded shape as well as was smallest in 2014 in that period. Most of the changes occurred in the southern part of the island. The total aerial growth of the island from 2003 to 2020 is about 68.40 km2 (Table 3). From 2014 to 2020, it is evident that the island is enlarging with a constant aerial increment and approaching a subrounded to rounded shape that seems more stable than the previous years. A recent study on the morphodynamics of a small offshore island of Bangladesh (Doamr Char) also suggests a very dynamic behavior of the island throughout several decades [24]. HatiyaIsland, one of the most stable islands of the Bay of Bengal in the Meghna estuary, shows that the depositional front is moving seaward [40]. On the other hand, Kutubdia island is exceptionally dynamic, as the island has only experienced erosion from 1972 to 2014 [48].

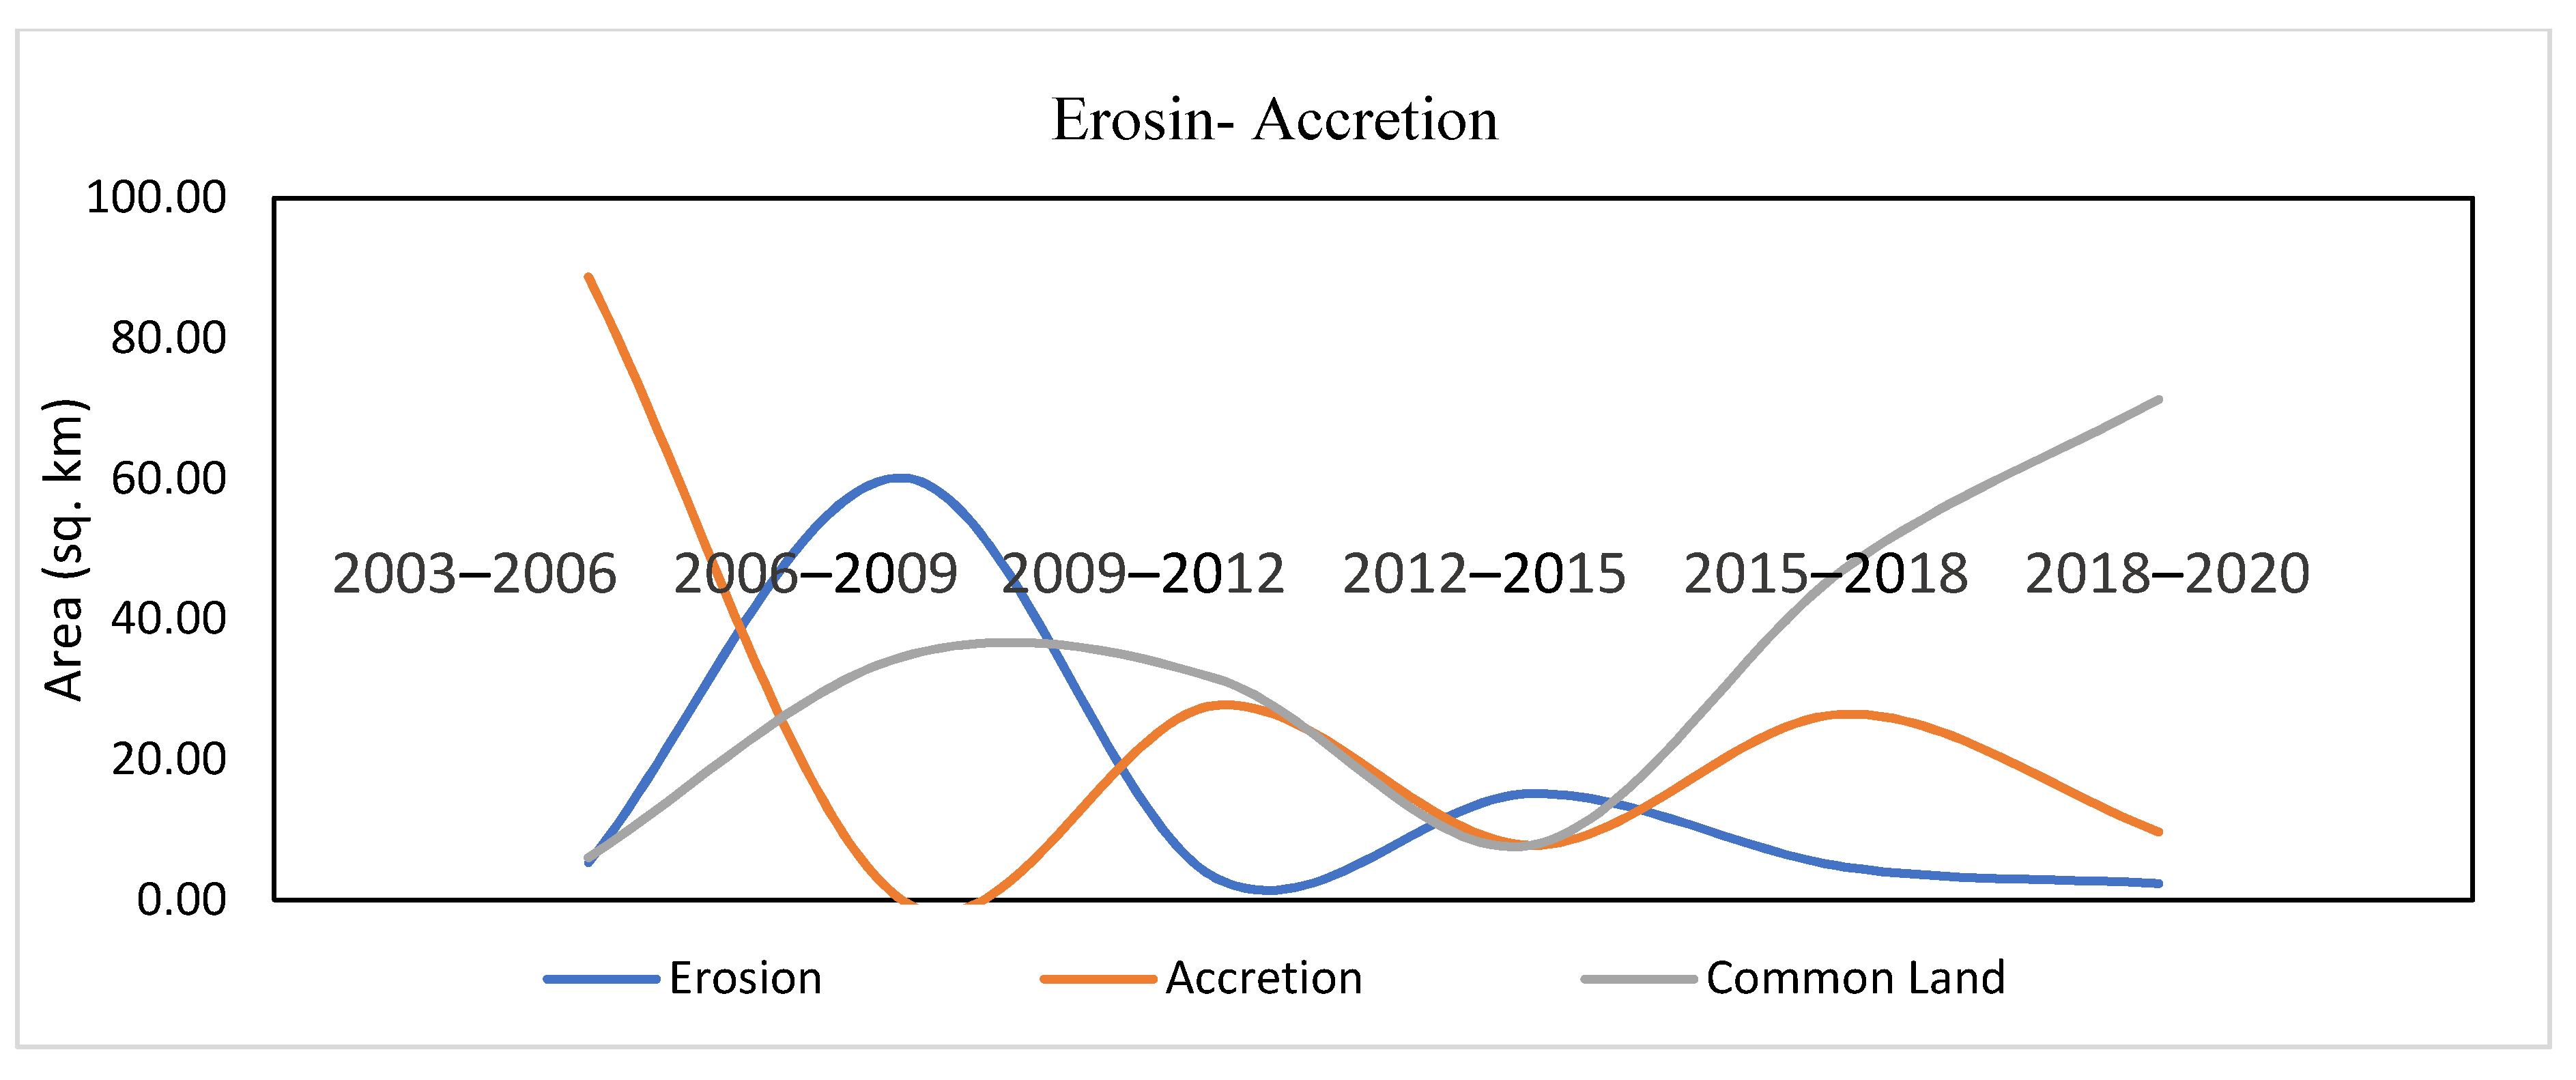
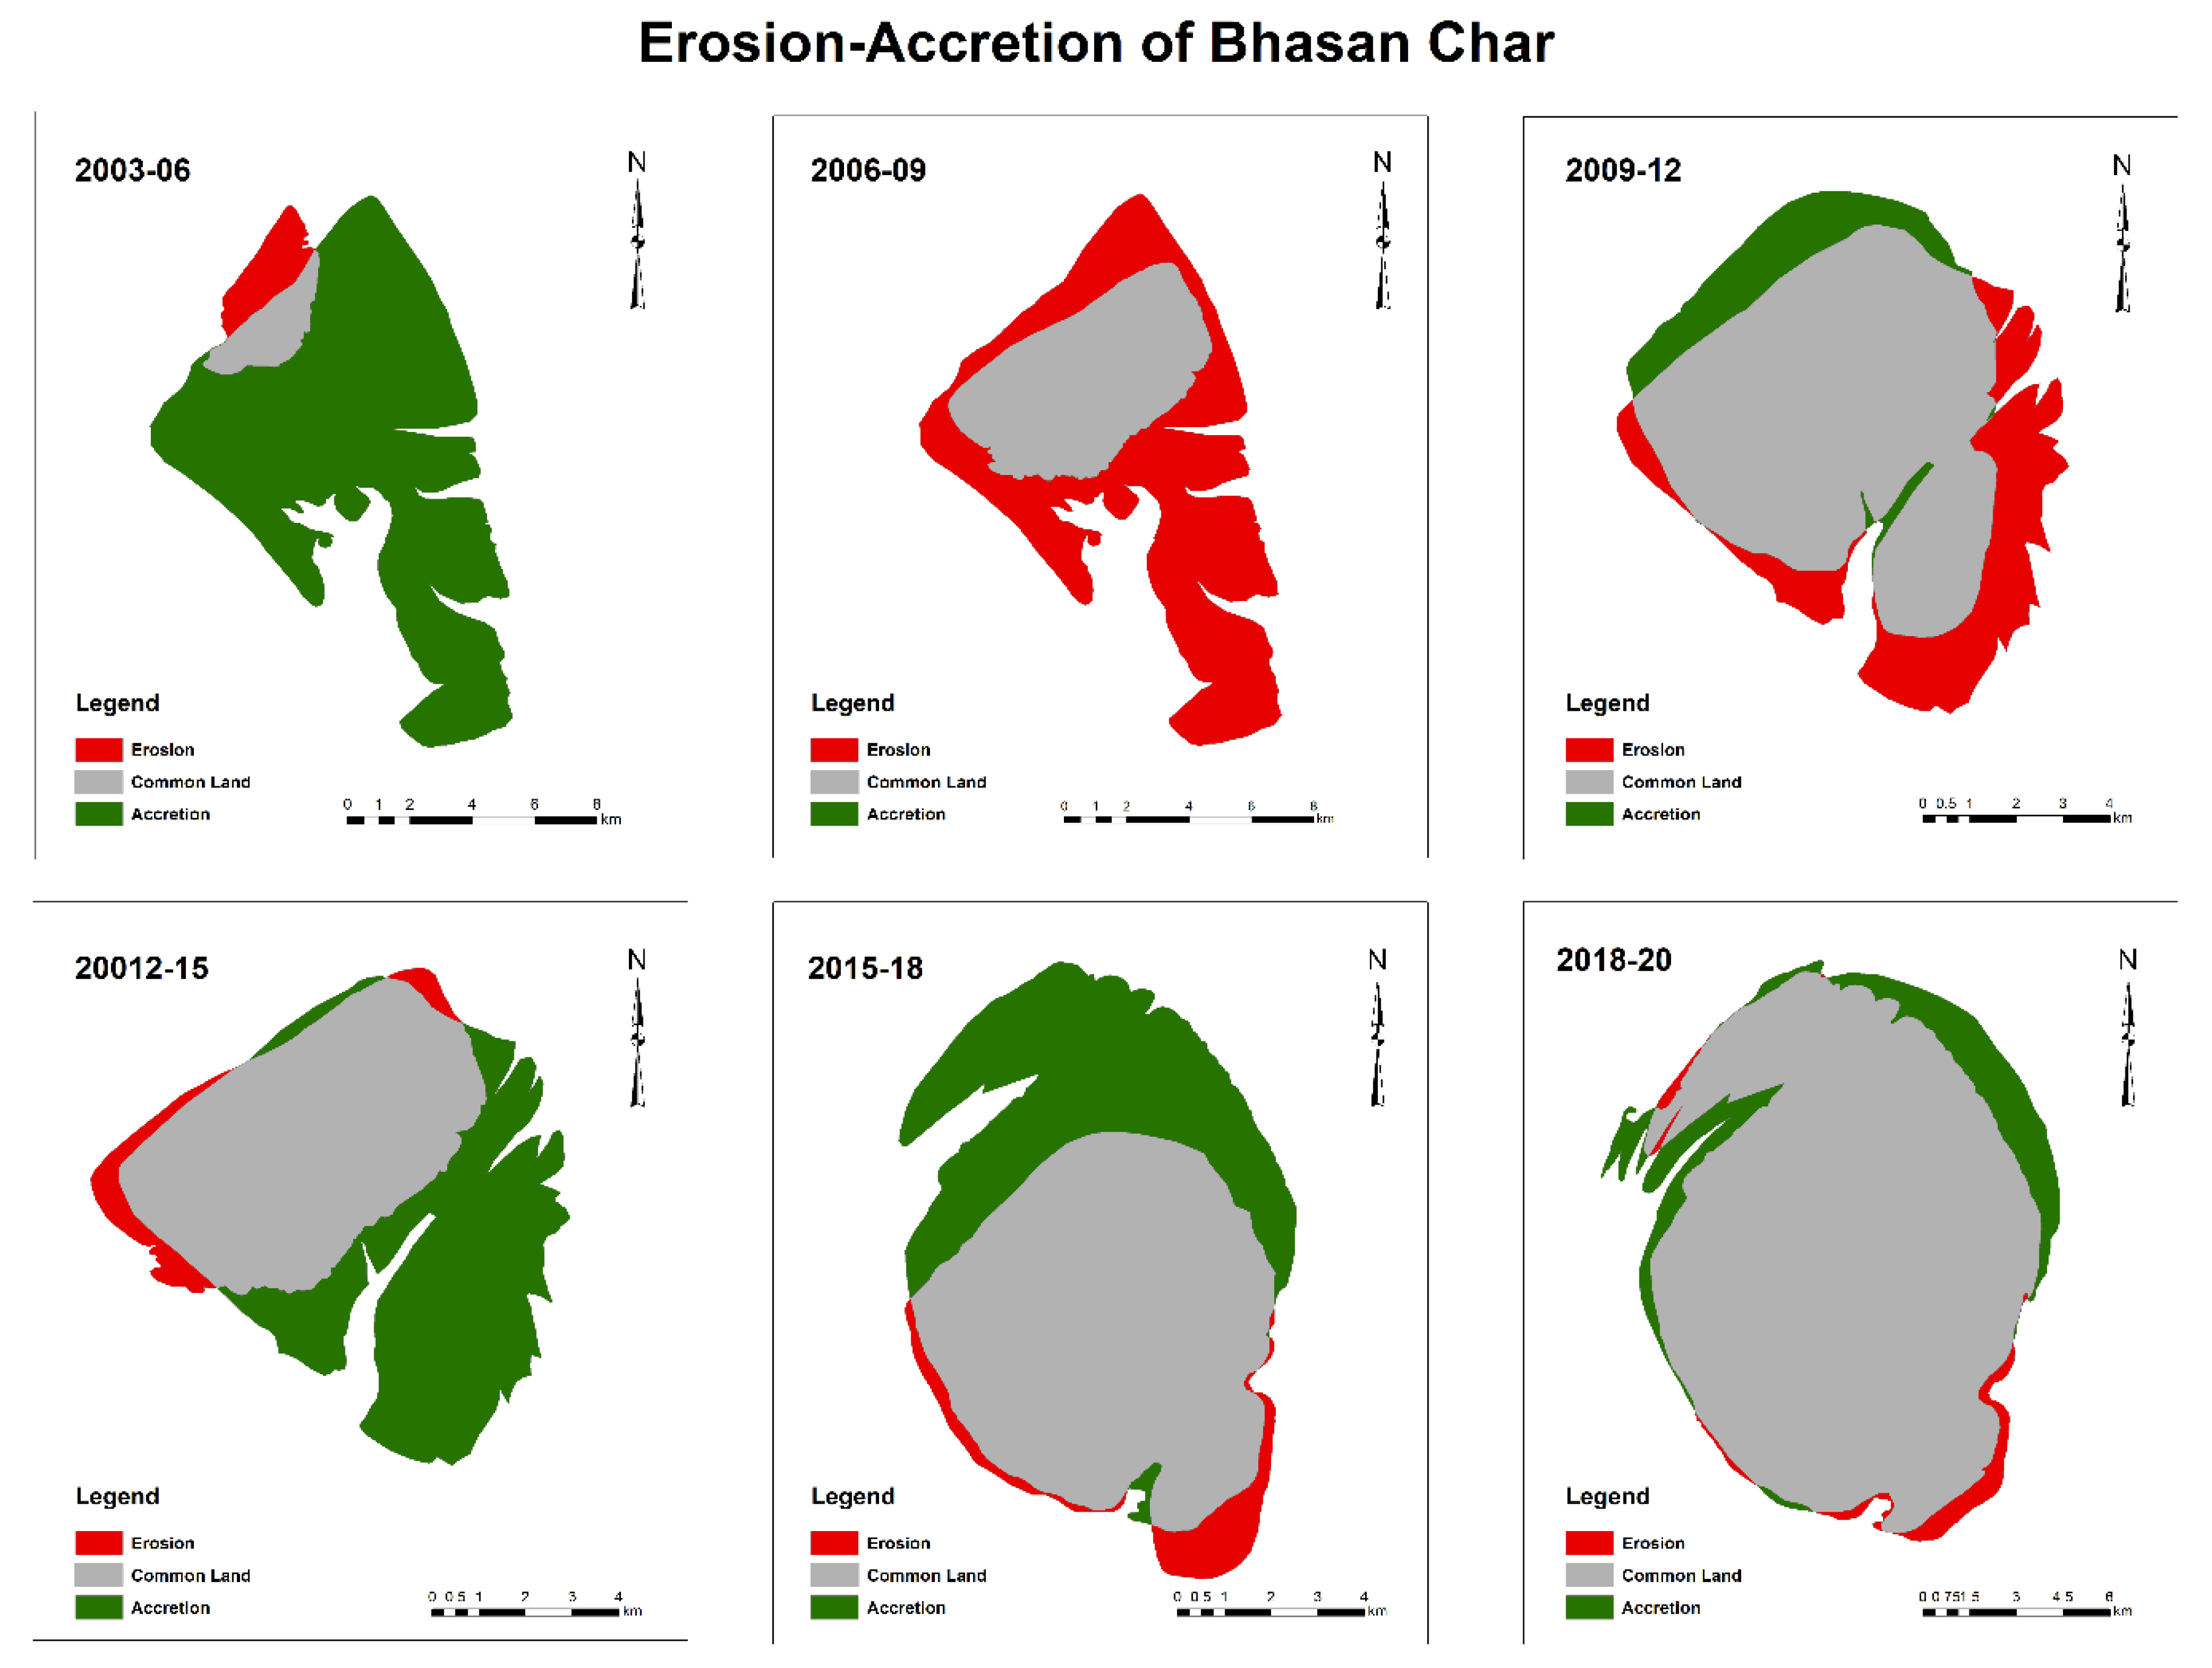
3.2. Erosion-Accretion

Due to massive sediment supply (1.7 billion tons per annum) and complex sediment-seawater interactions, erosion and accretion are frequently changing phenomena here. It can be stated that the Bhasan Char Island is located within the Meghna estuary of the GBM river system, and the island formed from the GBM driven sediments. Simultaneous erosion and accretion occur at different parts of the island.
The analysis shows that a total area of about 5.33 km2 eroded during 2003–2006, and a simultaneous 88.80 km2 of land accreted, having 6.07 km2 of common land (Table 4). The highest amount of erosion has been recorded from 2006–2009, representing an erosional landmass of about 60.9 km2 without any accretion. In the next three years, from 2009 to 2012, erosion was decreased, accounting for 3.11 km2, and accretion increased to 27.75 km2, having 31.58 km2 of common land. Through 2012–2015, 15.17 km2 landmass eroded to the sea and accretion was only about 7.81 km2, where common land was about 7.81 km2. Erosion slowed down from 2015 to 2018, indicating 4.74 km2 of erosion and the rate of accretion tripled (approx. 26.52 km2) along with an increasing trend of common land in the respective years (Figure 7). In the last two years (2018–2020) there have been no significant changes, only 2.40 km2 of the land eroded, and about 9.73 km2 of land accreted the remaining 71.35 km2 of the common area (Figure 8). The present analysis suggests that the common land of the island is higher in the last two years, indicating that the island is becoming more stable. Alam and Uddin (2013) suggest that the offshore islands of Bangladesh have continuously been modified by the erosion-accretion process [55]. The southern part of the Kutubdia island has suffered severe erosion by wave actions [48]. Hatiya Island (northern part) is eroding continuously as there is no barrier landmass to protect the island from the high-velocity water flow of the Meghna river [40,56].

3.3. Shifting of the Island Depocenter

Overlaying operation of satellite images from 2003 to 2020 shows that sediment depocenter in and around the island is very dynamic. This depositional lobe shifted remarkably throughout the study period but followed a specific trend mainly in the southeast direction towards the sea. The island lobe shifted approximately 6000 m from 2003 to 2005, which is the highest shifting distance that has been recorded here. From 2005 to 2012, lobe migration was embedded within 3000 m. From 2012 onwards, it has been progressively shifted close to the former position backward from the southeast heading (Figure 9). In recent times, the island lobe is moving towards the easterly direction. It is worth mentioning that the migration distance of the island depocenter has been recessed from 2018 to 2020. This indicates the stable existence of the island at the present location. This migration is intimately related to the rate of deposition and erosion in a specific direction. Furthermore, accretion-erosion is controlled by the action of waves, tides, sediment influx, and perhaps tectonic influence.

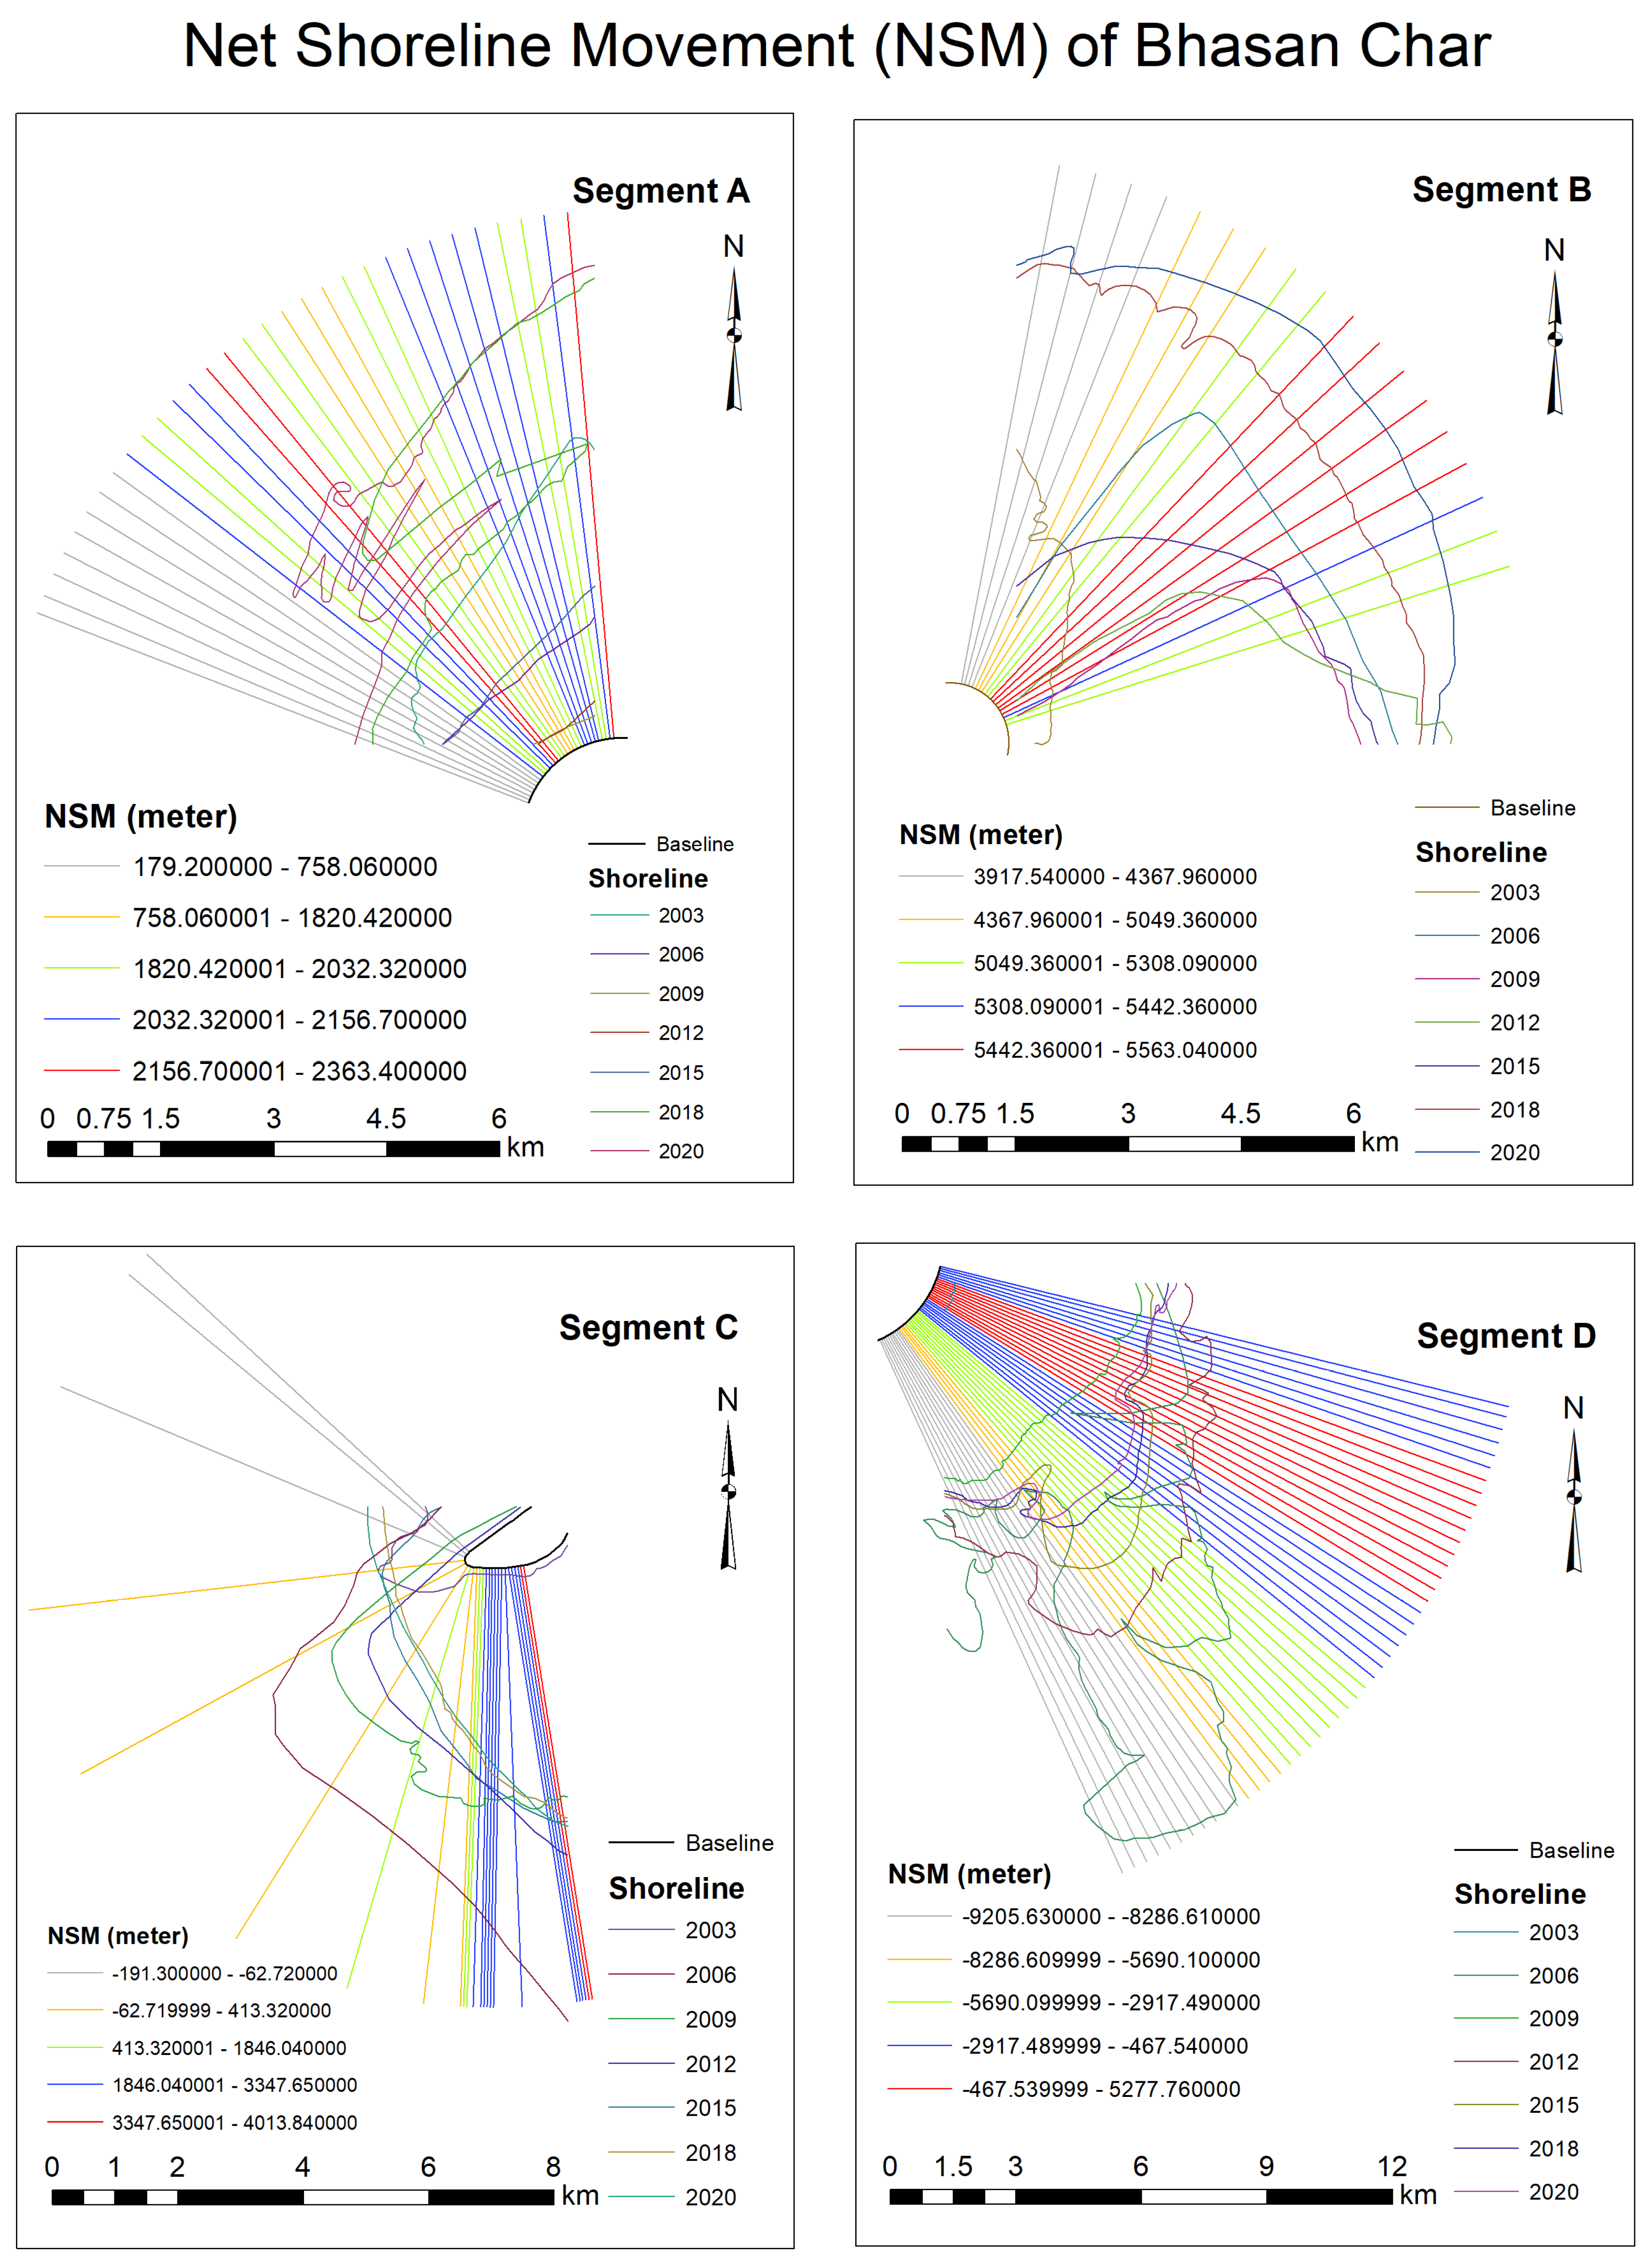
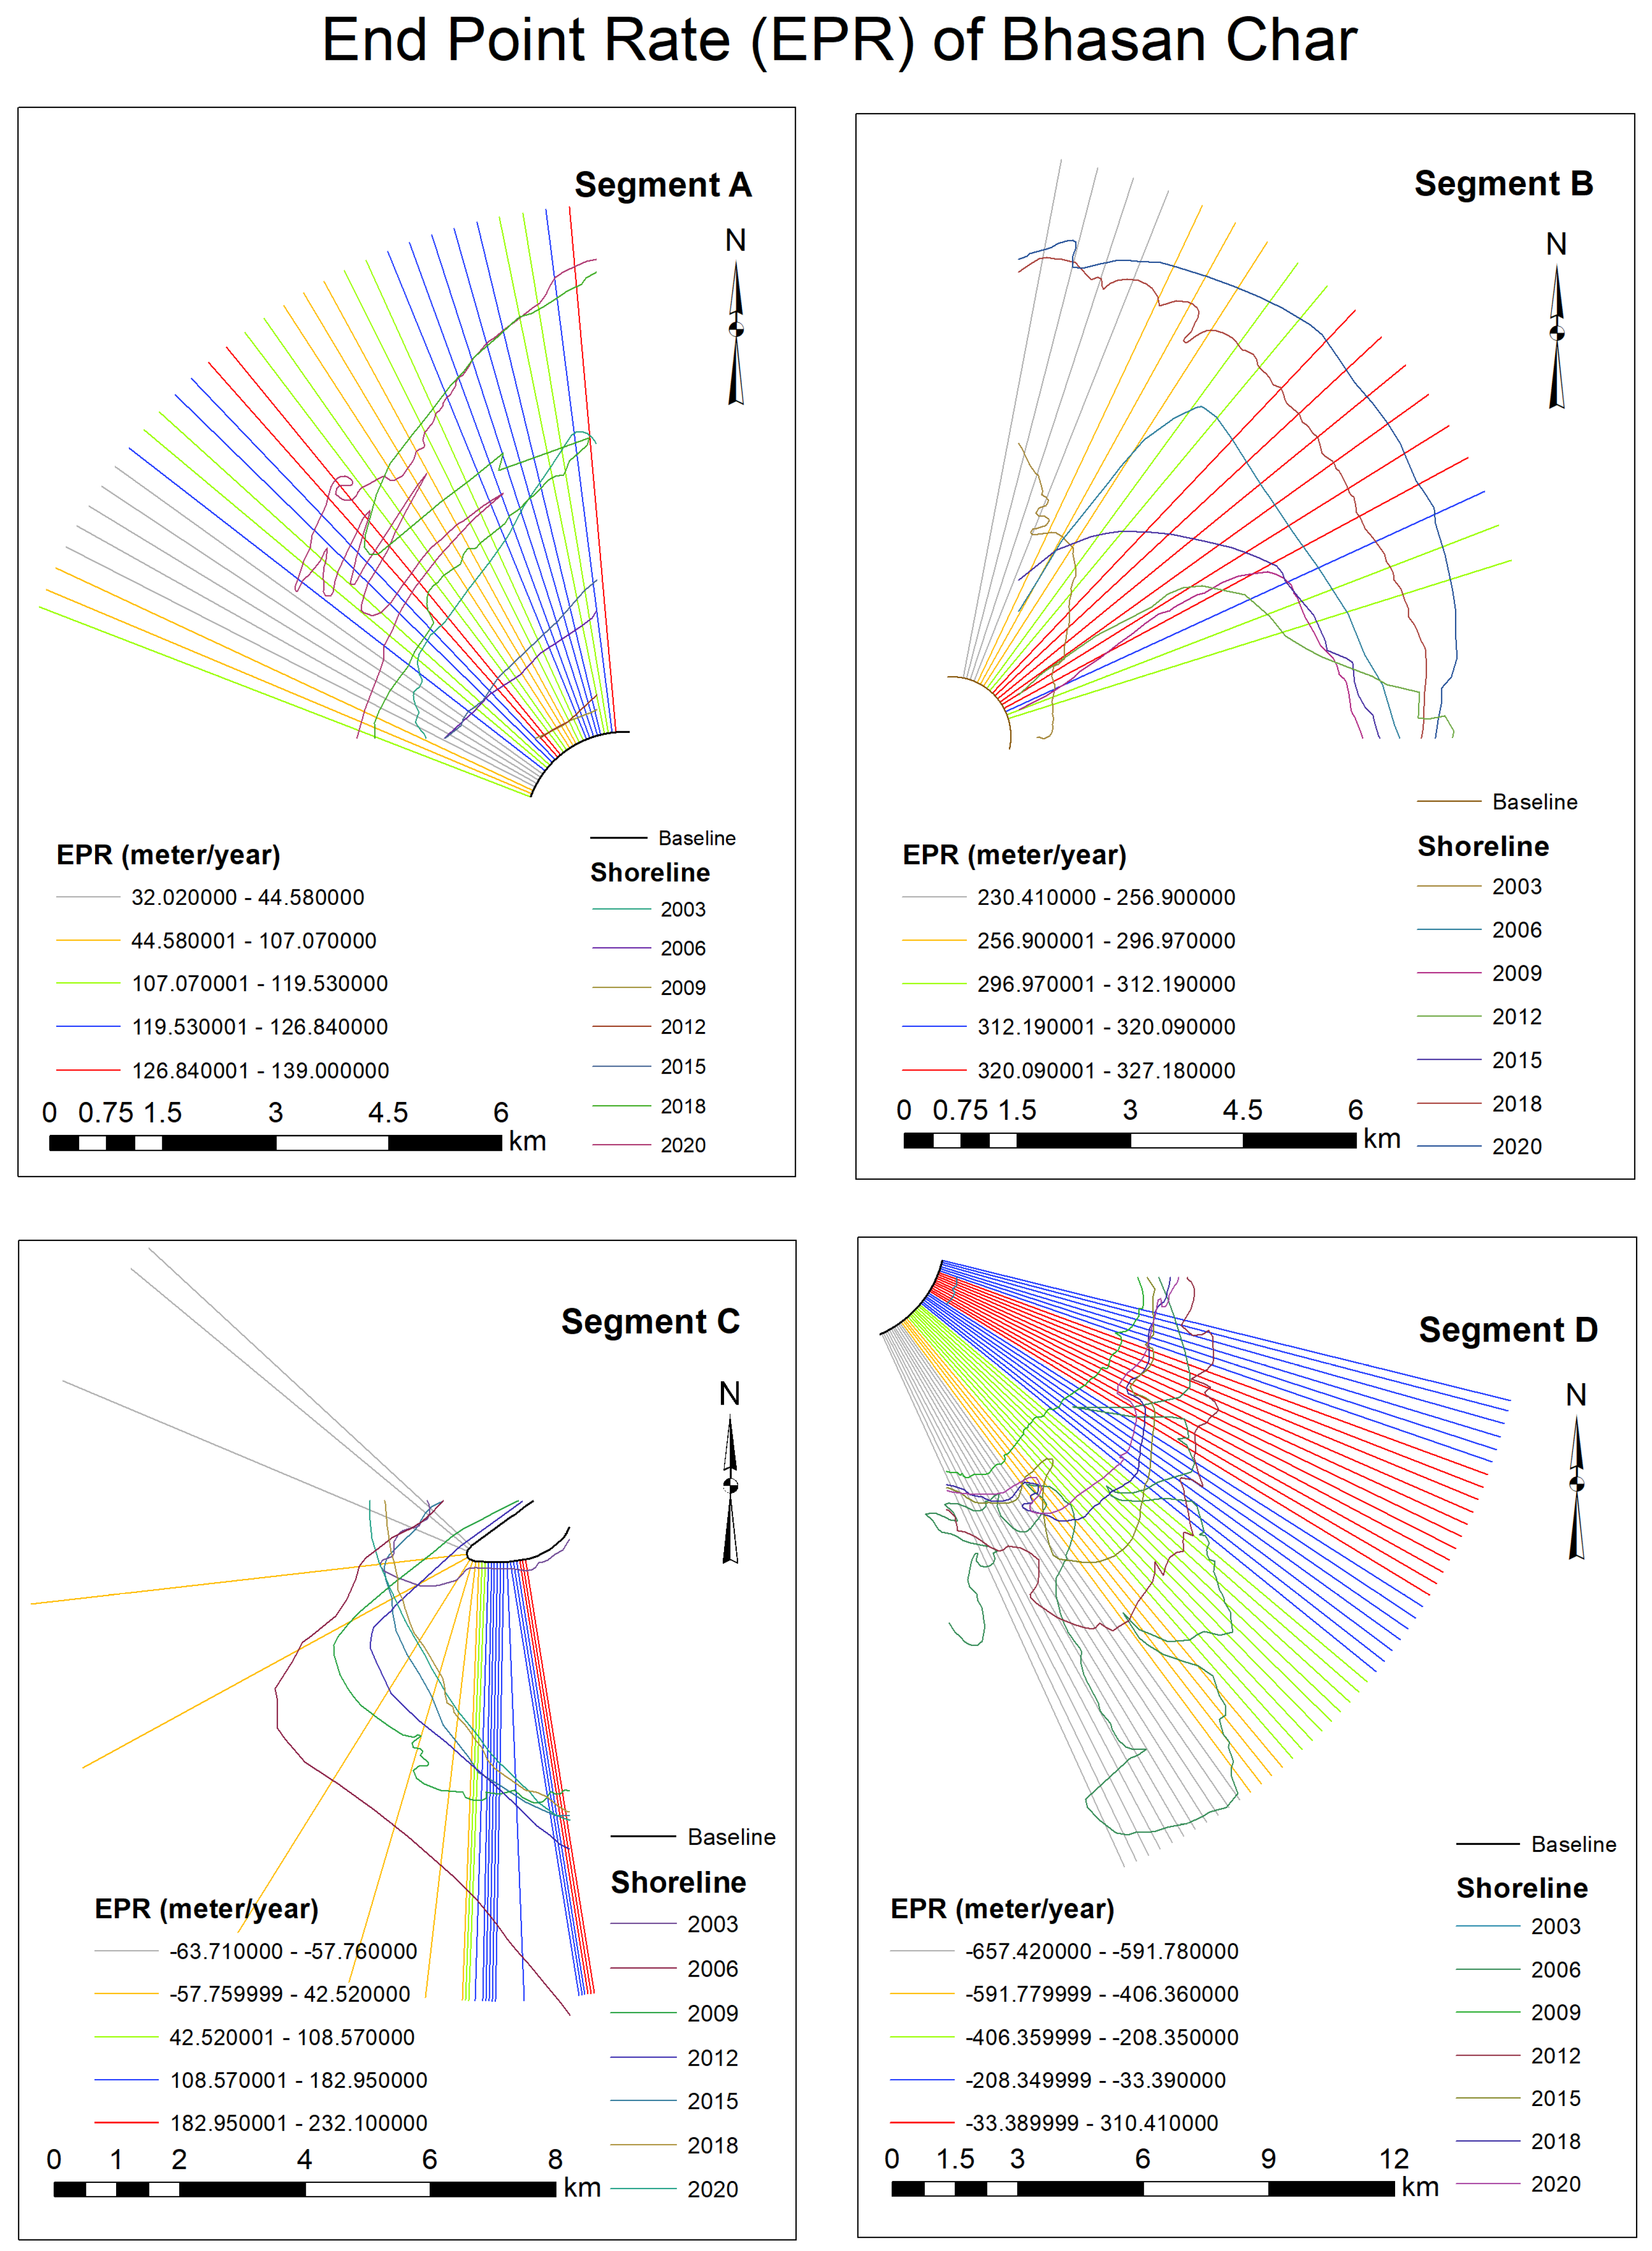
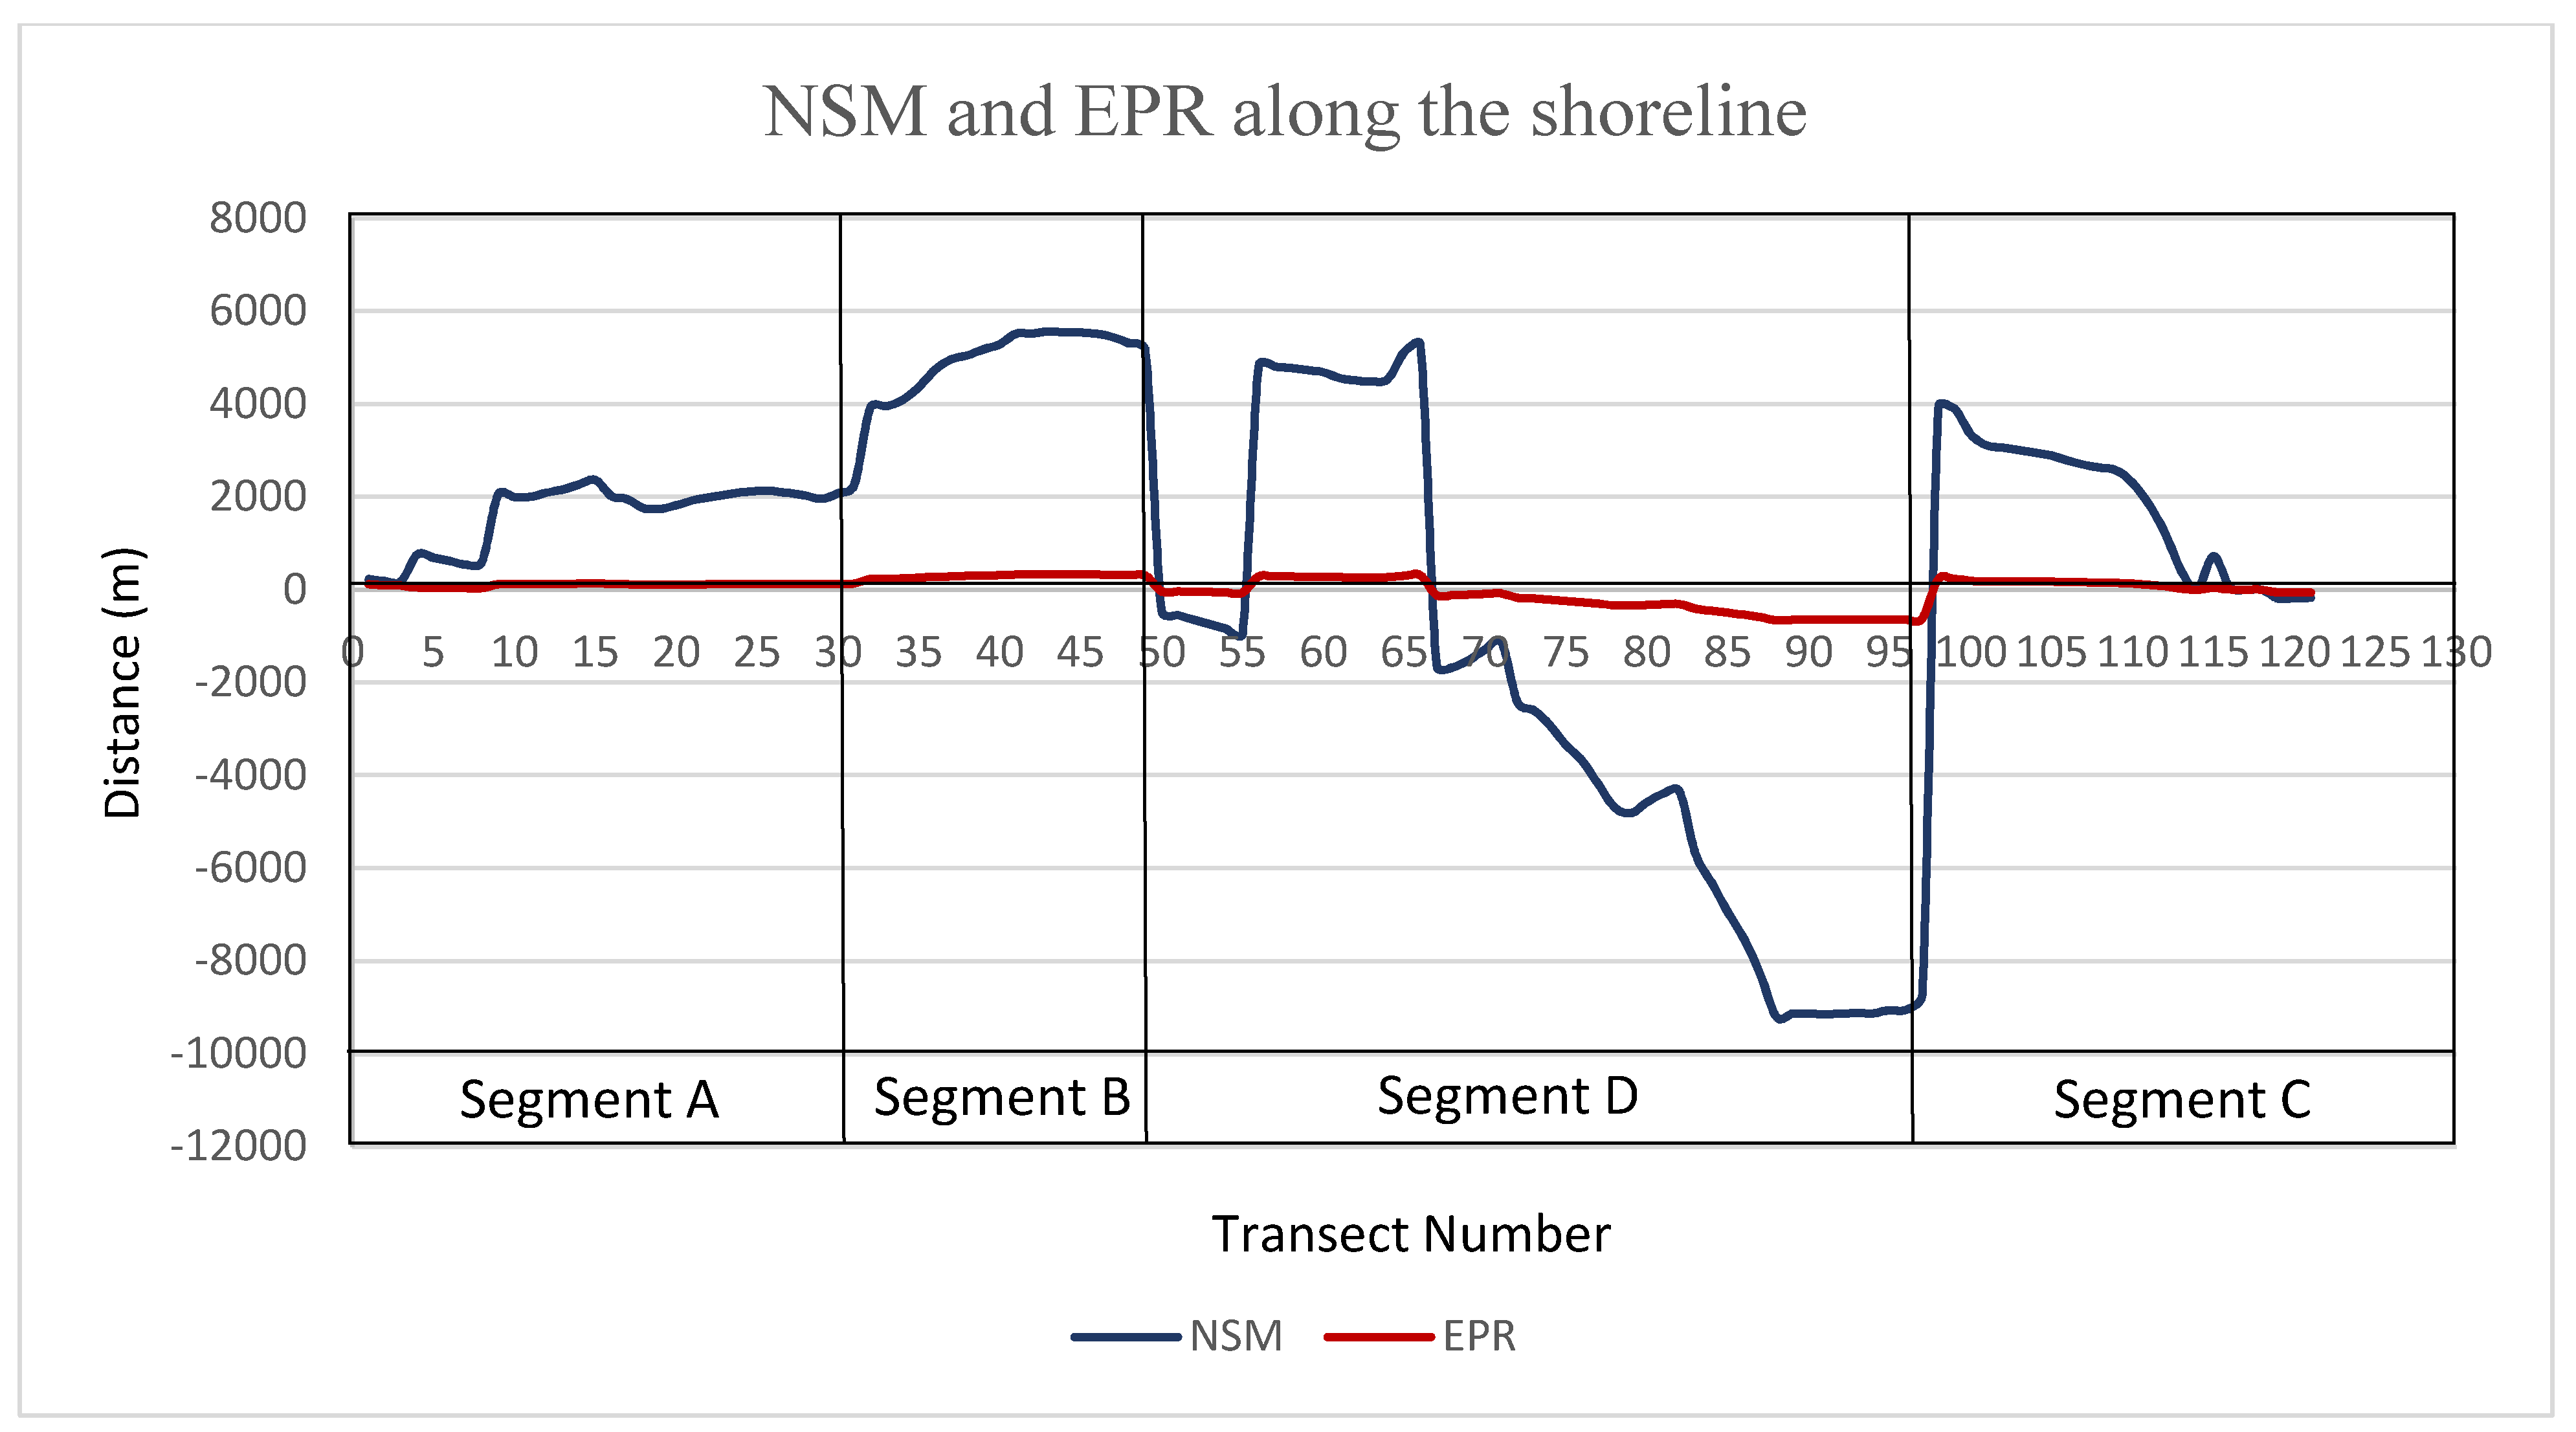
3.4. Shoreline Dynamics

The length of the shoreline has been recorded around 15.97 km in 2003 that gradually increased to 55.23 km in 2020. The longest shoreline has been recorded as 78.87 km in 2008 (Table 5). The island has gained a total of 62.89 km in shoreline between the years 2003–2020. The study area has been segmented into four different parts (Segment A, B, C, and D) for better understanding and analysis (Figure 10). Net Shoreline Movements (NSM) has been presented in meters and End Point Rate (EPR) in meter/year. The NSM has been calculated for each segment as the distance of the shoreline movement by the time elapsed between the oldest and the newest shoreline. Where positive values indicate the movement of the shoreline in the seaward direction, the negative values indicate movement in the landward direction.
Segment A consists of a total of 31 transects of which all show positive values indicating seaward and northwestward movement resulting from accretion. The highest movement is +2363.4 m, and the lowest movement is +179.2 m. Segment B includes 18 transects showing the same trend of shoreline movement. In segment B, the highest movement has been found around +5563.02 m, and the lowest movement is +3917.54 m (Figure 11). Segment C shows both erosion and accretion, but accretion is higher than erosion. In this segment, 28 transects show positive movements ranging from +2.29 to +3946.36 m, and four transects denote negative movements varying from −9.33 to −191.3 m. Severe erosion occurred in segment D, where 37 transects among 48 show negative movements ranging from −467.54 to −9205.63 m, and the rest of the transects show positive value ranging from +4484.81 to +5277.76 m.
The rate of shoreline shifting has been enumerated by End Point Rate (EPR). The EPR is calculated by dividing the NSM by the time elapsed between the oldest and the youngest shoreline. Positive values specify seaward shifting and negative values point to landward shifting per year. Segment A shows a positive shifting rate that ranges from +32.02 to 139.00 m/year. Similarly, Segment B also specifies a positive shifting rate ranging from +230.41 to +327.18 m/year (Figure 12). However, in segment C, both seaward and landward shifting has been found. In this segment, positive values range from +0.25 to 232.10 m/year, and negative values fluctuate between −0.78 and −63.71 m/year. However, segment D indicates intense erosional evidence. Here, positive values range from +263.77 to 310.41 m/year, and negative values from −33.39 to −657.42 m/year (Figure 13). Recent research on an offshore island of Bangladesh also shows the enlargement of the shoreline around the island [39]. The shifting and mobilization of shorelines is very common due to the intense erosional and depositional activities [29,57].

3.5. Geological Stability of the Island

The Bhasan Char Island is geologically located in the area of the Meghna Estuary. The major river system of Bangladesh carries around 1.7 billion tons of sediment from their catchments to this region [58]. This huge sediment load is responsible for the lateral progression and vertical accretion of the estuarine islands. In this region, accretion is more dominant than erosion. The river-fed sediments are reworked by tidal action and longshore currents around these islands. The suspended sediment concentration was reported to be very high, with the highest concentration of sediment around 9000 ppm [59]. Along the shoreline, sediment movement and settlement depend on the incoming wave angle. At incoming wave angles of 260°, 270° and 280°, negligible amounts of sediments concentrate along the shoreline. However, sediments are trapped after 290° (suspended load) and 270° (bedload) wave angles along the shoreline [60]. The southeast, northeast, and northwest part of the island receive the wave component at an angle around 270 to 290° that is in favor of sediment settlement rather than movement. The present rate of sedimentation process may raise the land in the coastal areas relative to the rate of sea-level rise in this area. The vertical accretion of land in the estuary would keep pace with the sea level rise [61,62]. Structurally, the island is located at the crestal part of a broad-gentle anticline near to a convergent boundary. Therefore, it is possible that the island might be uplifted with time due to this tectonic influence.
Seismic data indicate that Bhasan Char is located at the top of a low amplitude broad anticline (Figure 14, Figure 15 and Figure 16). Regionally, the island complex is the western gentle extension of the Eastern Fold Belt of Bangladesh. The structural deformation of this area is the result of the fact that the Indian plate is colliding with the Burmese subplate in the east and is gradually sub-ducting beneath the Eurasian plate. The crustal deformation decreases and thus the intensity of folding and thrusting reduces towards the west. The overall height of the anticlinorium (Eastern Fold Belts) is increasing with time despite a continuous erosion at the hilltops. The gentler western part is also gradually uplifting comparatively with a slower rate, however. Moreover, the rate of sedimentation exceeds over the rate of sea-level rise in this region. The GPS data indicate that the E-W shortening in this region is at ~13 mm/y, which results in vertical uplifting in the crestal part of the anticlinorium [63]. Therefore, net subsidence in this area is unlikely. The earthquake recurrence period in the Trans-Himalayan and Arakan-Yoma hill ranges is 500–2000 years. The latest large-scale earthquake occurred around the Bengal Basin in the last quarter of the Eighteenth century. Therefore, tectonically the Bhasan Char area is likely to be stable.
The longshore current is mainly concentrating within the Sandwip channel. The erosional effect due to longshore current on Bhasan Char Island will be protected by Sandwip Island. The sediment transported by the oceanic current might be trapped in this area. Consequently, a New Char is developing south to Bhasan Char Island (Figure 4 and Figure 18). This New Char will also protect the Bhasan Char from erosional effects of storm surge from the Bay of Bengal.
The bathymetry of the study area ranges from 2 to 5 m (Figure 17). The rate of siltation is also very high in this area. The intensity of siltation is concentrating around Bhasan Char, Jahazzar Char, Urir Char, and Sandwiip Island (Figure 18) which indicates that the whole region might be converted to a unified landmass and will possibly be merged with the mainland of the Noakhali district.

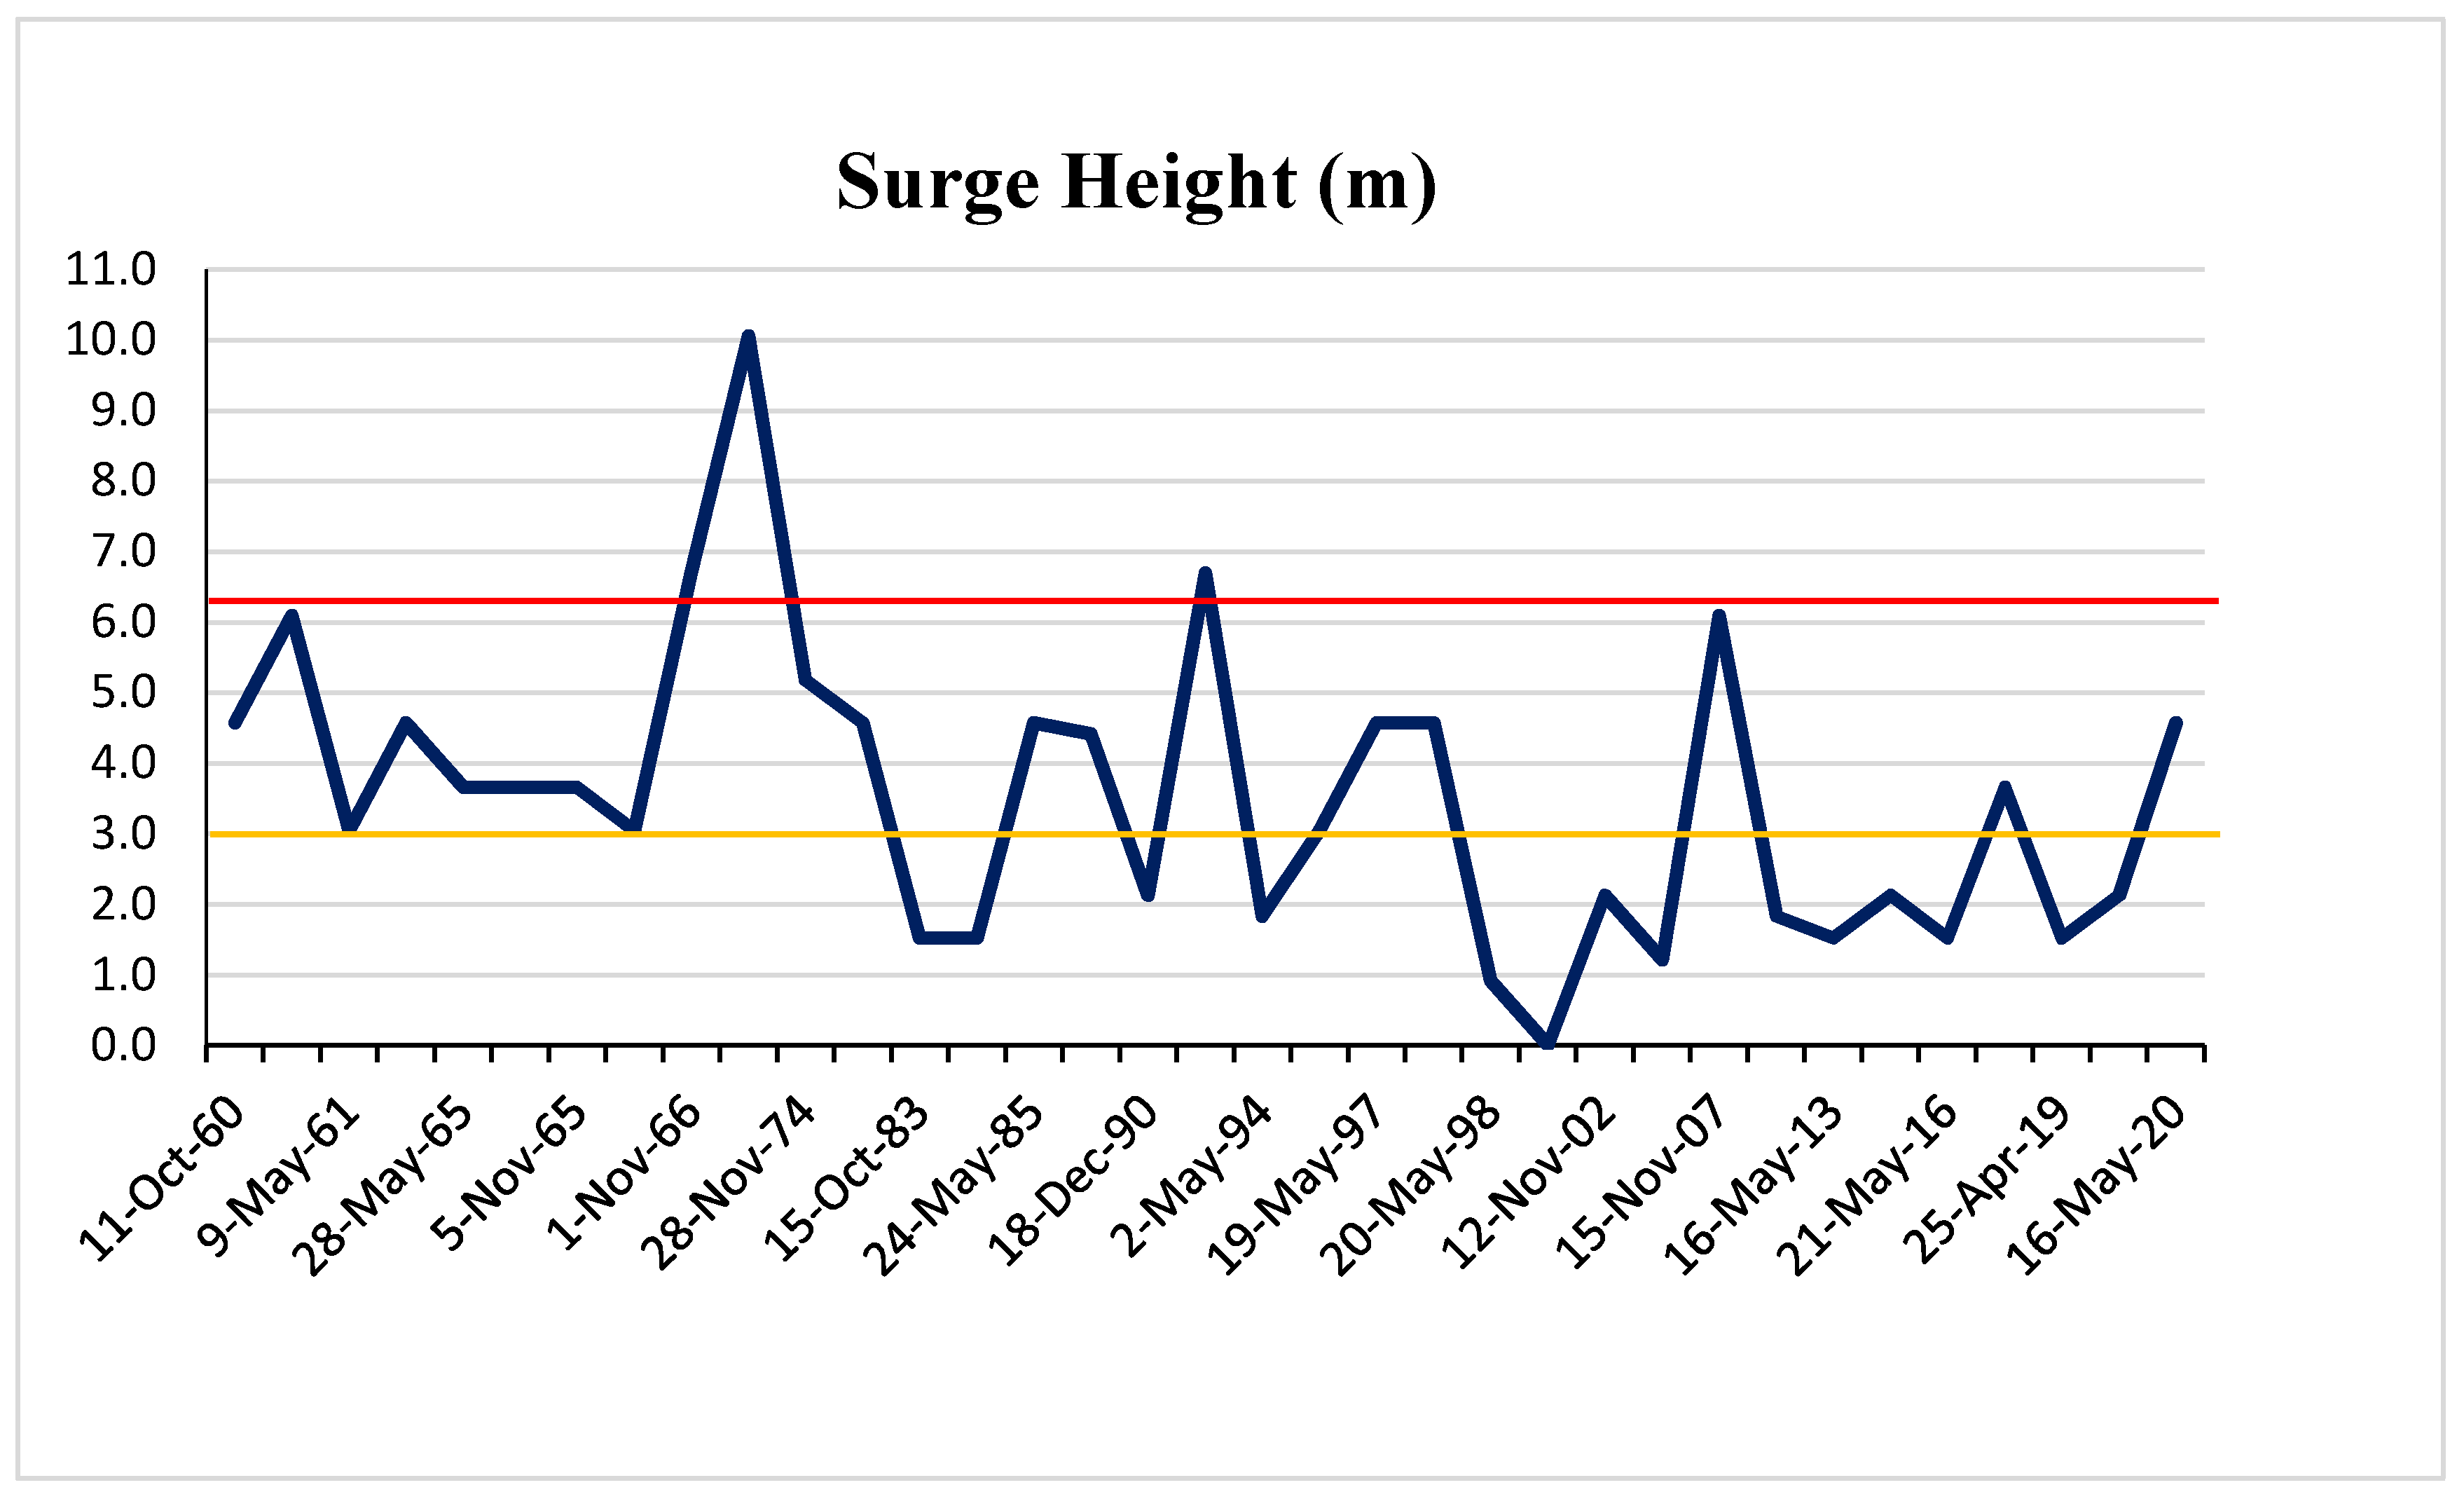
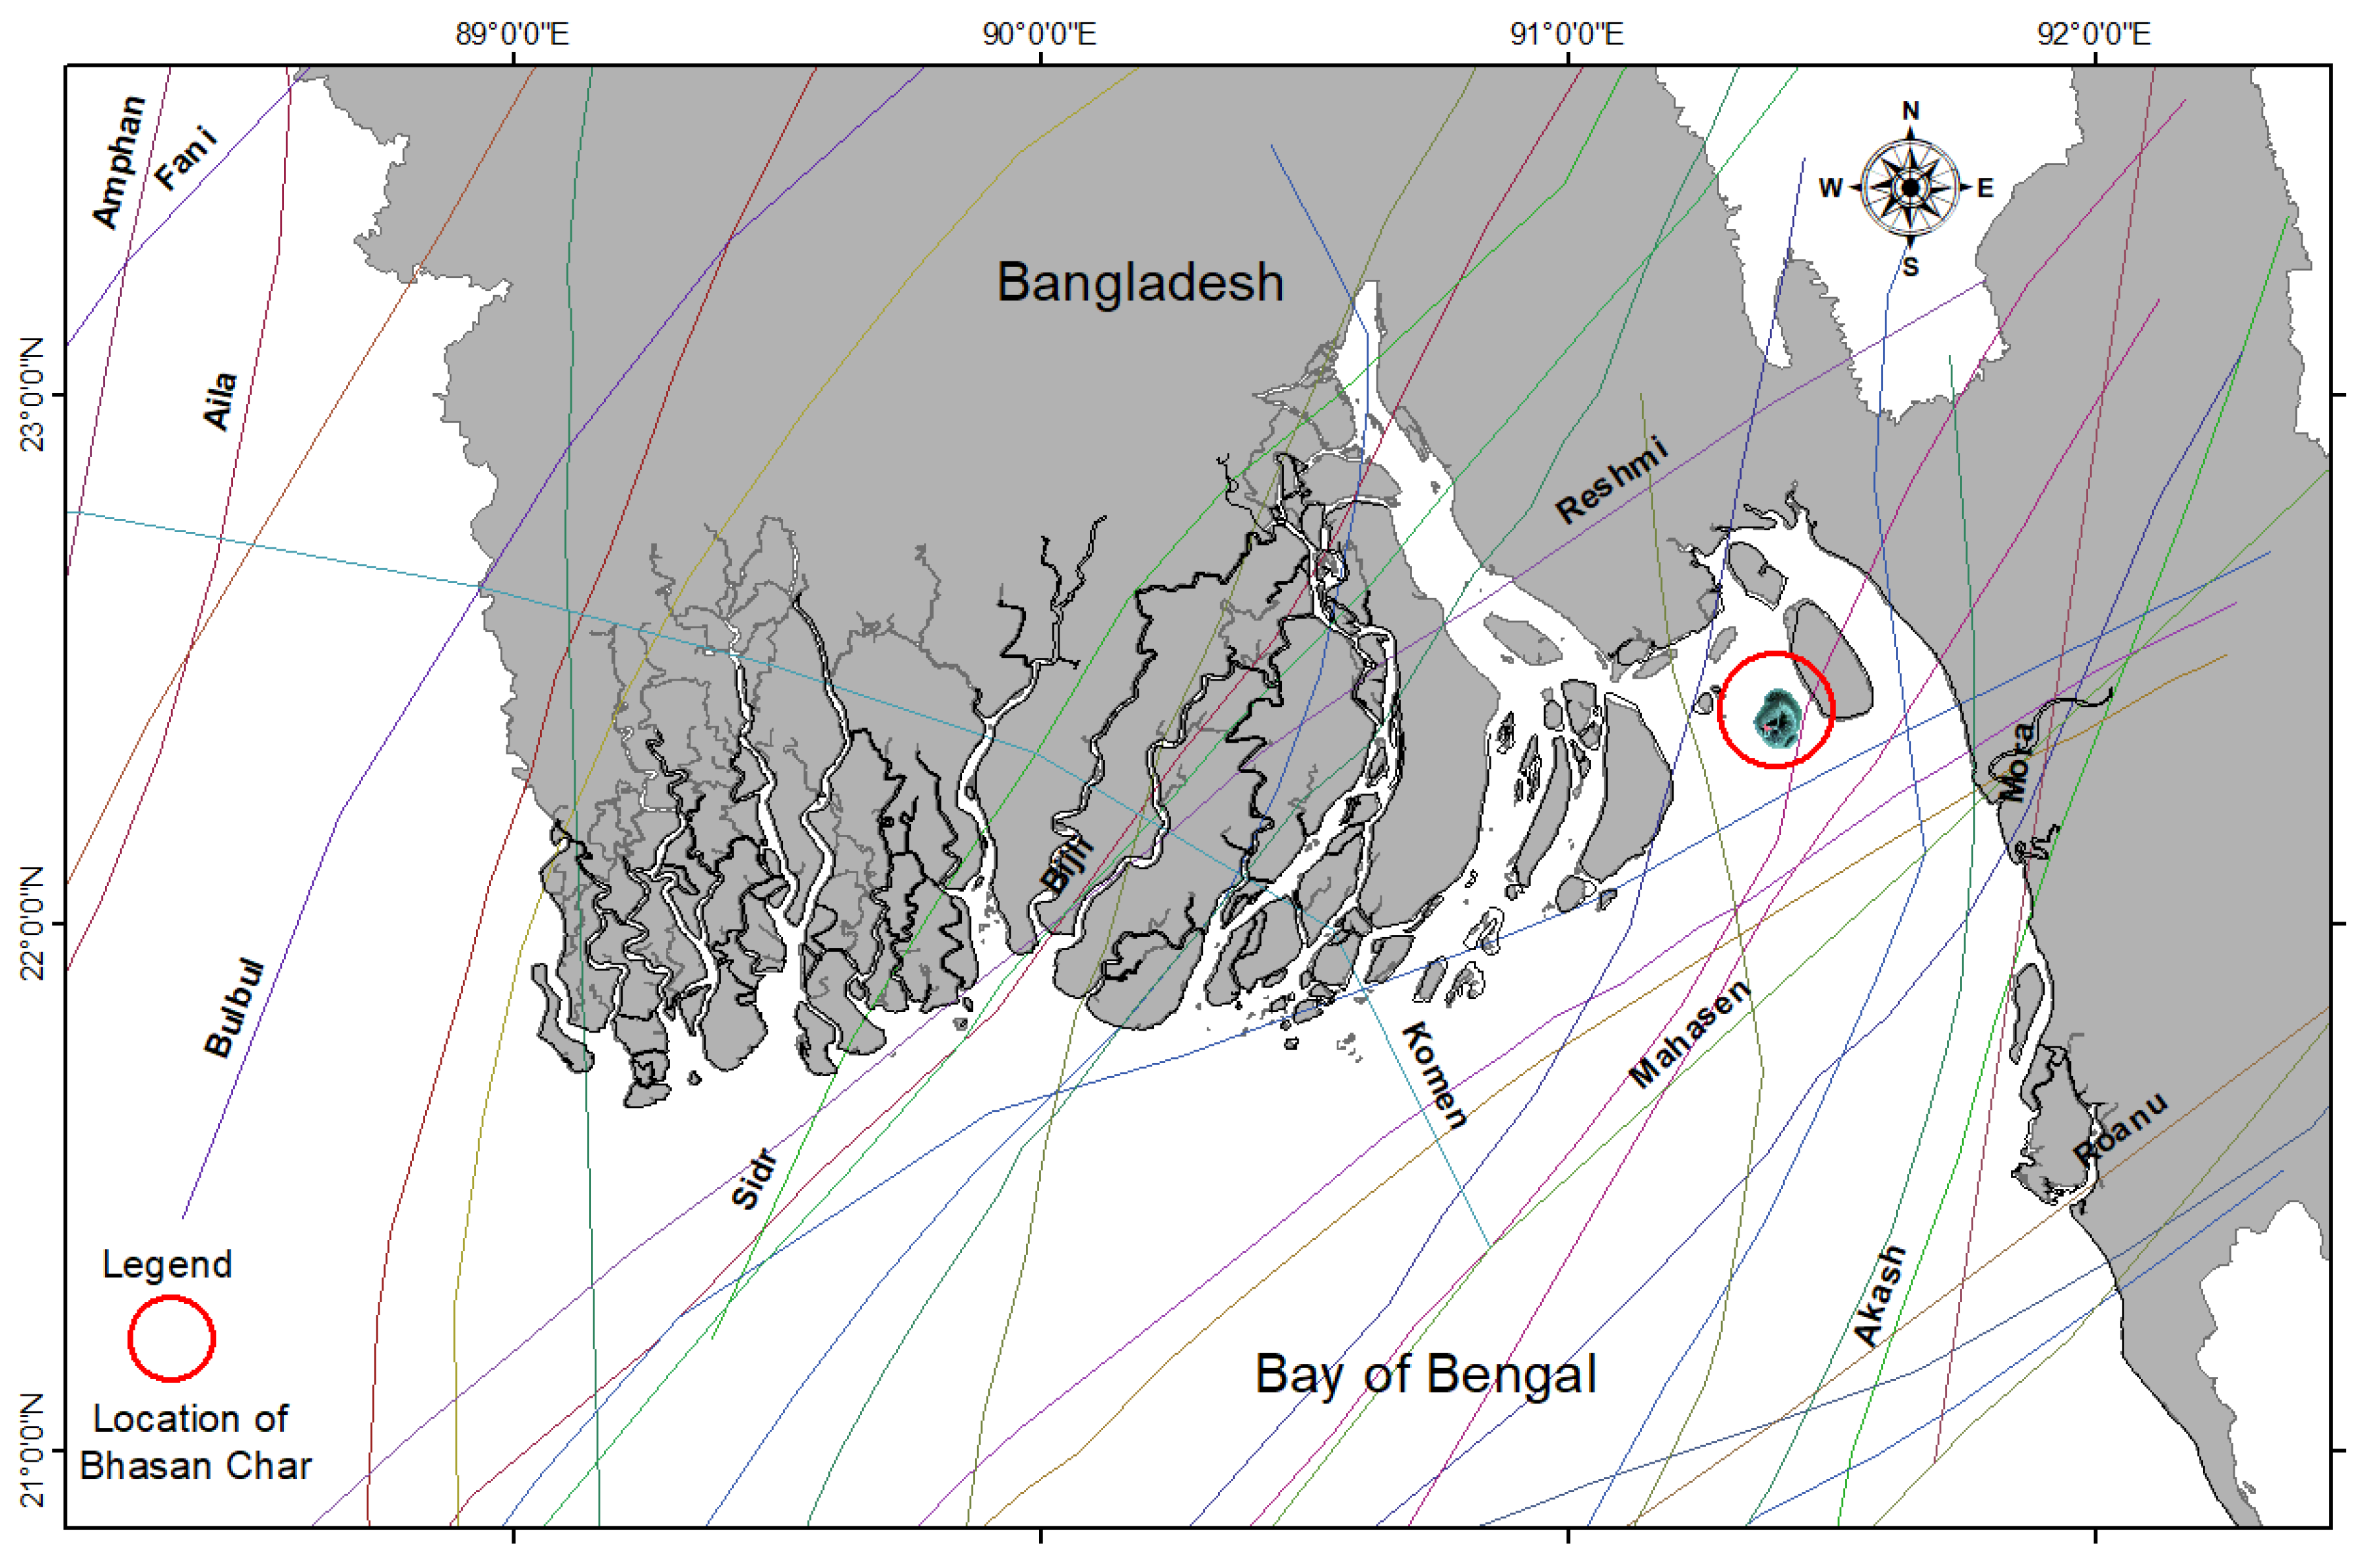
3.6. Impacts of Cyclonic Events on the Island

Foreign companies constructed an embankment on the Bhasan Char of about 3 m, and it will be raised to approximately 6 m. The study has examined the tracks of cyclones and surge height for the last 36 years. Historical records confirm that tidal surges of about 6.8 m never impacted the island except for a cyclone in 1970, although the island has evolved in 2003 (Figure 19). Cyclone Amphan was the most powerful storm since cyclone ‘Sidr’ in 2007. During this cyclone, the island was completely safe. Historical data suggests that the island will remain safe from storm surges in the event of upcoming similar cyclones (Figure 20). Landfall areas due to these events have been analyzed, and indicate maximum cyclonic impacts occurring around the Chittagong (Cox’s Bazar, Teknaf, Sitakund, and Feni) and Khulna (Sundarbans)-Barisal coasts rather than the Noakhali and Hatiya regions close to the island (Haque et al. 2012; Karim et al. 2008) [17,64].

3.7. Groundwater Availability and Quality

At the southwestern part of the island, a camp with clusters of houses has been developed covering an area of around 10 km2. An initial assessment has been done by a test borehole to infer the storage and quality of groundwater in this region. For detailed investigation, a four-monitoring well network has already been installed in the camp area. The depth of the test borehole is about 78.94 m. The borehole data indicates a 40 m thick sand layer at a depth of about 189–229 m. The aquifer has good hydraulic conductivity and porosity (25%). This layer can be the potential aquifer in this region that can feed the available freshwater to the camp habitants. The simple and uniform depositional setting of this island suggests that the aquifer has horizontal continuity with this vertical extent. Considering the total storage of groundwater, freshwater can be abstracted only from the upper 2 m of the aquifer. About 40% of the water of the aquifer will be suitable for usage. Pumping below this limit will produce saltwater in the well. The upper 2 m of the aquifer has water storage of about 5 × 10⁶ m3. This amount is enough to meet the demand for the inhabitants of 120 shelters (Bangladesh Navy). There is a huge opportunity for the aquifer to be replenished from seasonal precipitation. The physical, chemical, and biochemical analyses of the groundwater samples suggest that the water is safe for drinking and other household activities according to the Bangladesh Standard for Drinking Water (ECR’97) and the WHO Guideline for Drinking Water, 2004 (Table 6).

4. Discussion

The present study attempts to assess the stability and suitability of the island for an habitant in terms of island dynamics, shoreline shifting, erosion-accretion, and cyclone impacts. There are about 70 islands near and distal parts of the coastal belt of Bangladesh. Government bodies, NGOs, private organizations in Bangladesh, and those throughout the world are very concerned about the FDMN rehabilitation program in the Bhasan Char due to its inaccessibility and lack of a detailed geo-environmental study that is very crucial for the safety of the FDMN. Therefore, the safety of the islanders is solely dependent on the stability of the island. Most of the islands have been formed in the Meghna estuary by the sediments transported by the GBM river system. The Meghna estuary is the most active area of sediment deposition and reworking [65,66]. The area is very dynamic due to the prevailing erosion and accretion processes. Tropical cyclonesare common disaster in the coastal area of Bangladesh. The central part of the coastal area is somewhat safer than the eastern and western parts [17,64]. The Bhasan Char Island is in the central part of the coastal area. Despite the fact that this island is facing continuous erosion-accretion, shoreline change, and other geogenic modifications, the intensity of erosion is decreasing (Figure 8). However, the southeastern part of the island is the most erosion-prone. Engineering protective measures should be taken for the stability of the island. It is evident from the time series analysis that the maximum areas of tidal flats have been converted to the mainland through time. The present land accretion rate of the island is higher than in previous decades. The island will be evolved soon into a stable landmass like Saint Martins, Hatiya, and Sandwip Islands. These islands already have inhabitants and have been proved to be sustainable to live. The impacts of climate change, sea-level rise, and cyclones on the Bhasan Char Island are not severe as these islands. There is a groundwater aquifer with abundant fresh water in the Bhasan Char Island.
The GoB has implemented a project in the Bhasan Char Island named as ‘Ashrayan-3′ for the one-lac FDMN refugees. The island has significant amenities, i.e., 120 cluster villages with 120 cyclone shelters, schools, playgrounds, mosques, health centers, warehouses, a cemetery, a helipad, etc. There is also the opportunity for livestock and fish farming, salt-tolerant paddy cultivation, horticulture, agriculture, etc. Earth embankments and wave breakers have been constructed to protect the island from tidal waves and storm surges (Figure 21). The island is still preparing by considering the current findings like climate change impacts, sea-level change, and other geological and geographical phenomena. The GoB has taken this initiative by following Article 10, 11, and 12(1) of the International Covenant on Economic, Social, and Cultural Rights and the International Covenant on Civil and Political Rights for Refugees. The international humanitarian organizations are still concerned about the safety of the refugees being relocated from Teknaf to the Bhasan Char Island. This study will help to understand the stability of the island and the safety of the inhabitants during natural disasters such as cyclones and storm surges.

5. Conclusions

This research emphasizes the evaluation of island planform morphological changes, erosion-accretion, areal extent, and sediment lobe shifting in Bhasan Char Island. These aspects are closely related to the future environmental safety of the resettled refugees. Without ensuring environmental safety concerning geological stability and environmental suitability, sustainable rehabilitation is not possible. Globally, this study can be a good example for the policymakers as well as scientists to consider a detailed geo-environmental investigation before any rehabilitation is undertaken. The island has gained 68 km2 in the last 17 years, which is seven times greater than the area (9.5 km2 in 2003). The island has undergone a higher rate of accretion (89 km2 in 2012) and subsequent erosion (net areal extent 75 km2). In recent times, the rate of accretion has been much higher than the rate of erosion around the shorelines (net areal extent of 68 km2, and shoreline length of 39 km in 2020). Erosion is more pronounced in the southeastern part of the island, and deposition in the northwestern part. Similarly, there has been a prominent morphological variation from the earlier elongated (14 × 5 km) form to its current subrounded to rounded morphology (9 × 8 km). The present embankment height of the island is 3 m, which will be raised upto 6 m. The height of the embankment will be high enough to protect the island from heavy storm surges. The island has been modified into a more stable condition in terms of structure, morphology, size, shoreline change, earthquakes, and cyclone hazards. The island is gradually becoming a stable, safe, and sustainable location for the temporary rehabilitation of the FDMN refugees. However, the present prediction of the stability is based on the trend of short time period (100 years) but the other geological and geoenvironmental factors should be considered to validate this prediction. It is very crucial to consider the impact of erosion on the stability of the island and future migrants. To strengthen and expedite the natural accretion process, some groins can be installed around the island for trapping the sediments fed by Meghna estuary.

Author Contributions

Conceptualization, M.Y.G. and A.S.M.M.K.; methodology. M.A.H.B.; software, M.N.U.; validation, M.Y.G.; formal analysis. M.Y.G.; investigation, M.Z.R.; resources, A.S.M.M.K.; data curation, A.S.M.M.K.,writing—original draft preparation, M.Y.G.; writing—review and editing. M.Y.G.; visualization, A.S.M.M.K.; supervision, A.S.M.M.K.; project administration, M.Z.R.; funding acquisition, M.Y.G. All authors have read and agreed to the published version of the manuscript.

Funding

“This research was funded by Ministry of Science and technology, Bangladesh, grant number 322_2018” and “The APC was funded by the University of Dhaka”.

Institutional Review Board Statement

Not Applicable.

Informed Consent Statement

Not Applicable.

Data Availability Statement

Not Applicable.

Acknowledgments

The authors are indebted to the Ministry of Science and Technology (MOST) of the Government of Peoples Republic of Bangladesh for financial assistance. We are also thankful to the Faculty of Earth and Environmental Sciences, University of Dhaka for partial funding to conduct this study. We acknowledge the Department of Geology, University of Dhaka for supporting laboratory facilities to complete the research successfully. We also thankful to the Bangladesh Petroleum Exploration and Production Company (BAPEX) for providing seismic data and Bangladesh Navy for supplying water quality data for this study.

Conflicts of Interest

The authors declare no conflict of interest.

References

  1. UNHCR. Joint Government of Bangladesh-UNHCR Population map as of 15 March 2020. The United Nations High Commissioner for Refugees (UNHCR). Available online: https://data2.unhcr.org/en/documents/details/74675 (accessed on 28 February 2020).
  2. ICJ. Application of the Convention on the Prevention and Punishment of the Crime of Genocide (The Gambia v. Myanmar); Universitas Estudiantes, Pontifical Xavierian University: Bogotá, Colombia, 2020; Volume 21, pp. 257–266. [Google Scholar]
  3. Zaman, S.; Sammonds, P.; Ahmed, B.; Rahman, T. Disaster risk reduction in conflict contexts: Lessons learned from the lived experiences of Rohingya refugees in Cox’s bazar, Bangladesh. Int. J. Disaster Risk Reduct. 2020, 50, 101694. [Google Scholar] [CrossRef]
  4. Morelli, J. Environmental sustainability: A definition for environmental professionals. J. Environ. Sustain. 2011, 1, 2. [Google Scholar] [CrossRef] [Green Version]
  5. Vega-Azamar, R.E.; Glaus, M.; Hausler, R.; Oropeza-García, N.A.; Romero-López, R. An emergy analysis for urban environmental sustainability assessment, the Island of Montreal, Canada. Landsc. Urban Plan. 2013, 118, 18–28. [Google Scholar] [CrossRef]
  6. Zhang, H.; Xiao, Y.; Deng, Y. Island ecosystem evaluation and sustainable development strategies: A case study of the Zhoushan Archipelago. Glob. Ecol. Conserv. 2011, 28, e01603. [Google Scholar] [CrossRef]
  7. Liu, C.; Yang, M.; Hou, Y.; Zhao, Y.; Xue, X. Spatiotemporal evolution of island ecological quality under different urban densities: A comparative analysis of Xiamen and Kinmen Islands, southeast China. Ecol. Indic. 2021, 124, 107438. [Google Scholar] [CrossRef]
  8. Kench, P.S.; McLean, R.F.; Brander, R.W.; Nichol, S.L.; Smithers, S.G.; Ford, M.R.; Aslam, M. Geological effects of tsunami on mid-ocean atoll islands: The Maldives before and after the Sumatran tsunami. Geology 2006, 343, 177–180. [Google Scholar] [CrossRef]
  9. Salvini, R.; Francioni, M.; Riccucci, S.; Fantozzi, P.L.; Bonciani, F.; Mancini, S. Stability analysis of “GrottadelleFelci” Cliff (Capri Island, Italy): Structural, engineering–geological, photogrammetric surveys and laser scanning. Bull. Eng. Geol. Environ. 2011, 70, 549–557. [Google Scholar] [CrossRef]
  10. Perkins, A.; Hamnett, S.; Pullen, S.; Zito, R.; Trebilcock, D. Transport, housing and urban form: The life cycle energy consumption and emissions of city centre apartments compared with suburban dwellings. Urban Policy Res. 2009, 27, 377–396. [Google Scholar] [CrossRef]
  11. Aedla, R.; Dwarakish, G.S.; Reddy, D.V. Automatic shoreline detection and change detection analysis of netravati-gurpurrivermouth using histogram equalization and adaptive thresholding techniques. Aquat. Procedia 2015, 4, 563–570. [Google Scholar] [CrossRef]
  12. Nandi, S.; Ghosh, M.; Kundu, A.; Dutta, D.; Baksi, M. Shoreline shifting and its prediction using remote sensing and GIS techniques: A case study of Sagar Island, West Bengal (India). J. Coast. Conserv. 2016, 20, 61–80. [Google Scholar] [CrossRef]
  13. Farhan, A.R.; Lim, S. Resilience assessment on coastline changes and urban settlements: A case study in Seribu Islands, Indonesia. Ocean. Coast. Manag. 2011, 54, 391–400. [Google Scholar] [CrossRef]
  14. Adger, W. Vulnerability. Glob. Environ. Change 2006, 16, 268–281. [Google Scholar] [CrossRef]
  15. Morris, P.; Therivel, R. Methods of Environmental Impact Assessment; Taylor & Francis: Oxfordshire, UK, 2001; Volume 2. [Google Scholar]
  16. Nicholls, R.J.; Wong, P.P.; Burkett, V.; Codignotto, J.; Hay, J.; McLean, R.; Brown, B. Coastal Systems and Low-Lying Areas; University of Wollongong: Wollongong, Australia, 2007. [Google Scholar]
  17. Karim, M.F.; Mimura, N. Impacts of climate change and sea-level rise on cyclonic storm surge floods in Bangladesh. Glob. Environ. Change 2008, 18, 490–500. [Google Scholar] [CrossRef]
  18. Shibly, A.M.; Takewaka, S. Morphological changes along Bangladesh coast derived from satellite images. Proc. Coast. Eng. 2012, 3, 41–45. [Google Scholar]
  19. Werle, D.; Martin, T.C.; Hasan, K. Flood and coastal zone monitoring in Bangladesh with RadarsatScanSAR: Technical experience and institutional challenges. Johns Hopkins APL Tech. Dig. 2000, 21, 148–154. [Google Scholar]
  20. Yu, W.; Alam, M.; Hassan, A.; Khan, A.S.; Ruane, A.; Rosenzweig, C.; Thurlow, J. Climate Change Risks and Food Security in Bangladesh; Routledge: Oxfordshire, UK, 2010. [Google Scholar]
  21. Donchyts, G.; Baart, F.; Winsemius, H.; Gorelick, N.; Kwadijk, J.; Van De Giesen, G. Earth’s surface water change over the past 30 years. Nat. Clim. Change 2016, 6, 810–813. [Google Scholar] [CrossRef]
  22. Nienhuis, J.H.; Ashton, A.D.; Edmonds, A.D.; Hoitink, A.J.F.; Kettner, A.J.; Rowland, J.C.; Törnqvist, T.E. Global-scale human impact on delta morphology has led to net land area gain. Nature 2020, 577, 514–518. [Google Scholar] [CrossRef]
  23. Brammer, H. Bangladesh’s dynamic coastal regions and sea-level rise. Clim. Risk Manag. 2014, 1, 51–62. [Google Scholar] [CrossRef] [Green Version]
  24. Hossain, K.T.; Salauddin, M.; Tanim, I.A. Assessment of the dynamics of coastal island in Bangladesh using geospatial techniques: Domar Char. Journal of the Asiatic Society of Bangladesh. Science 2016, 42, 219–228. [Google Scholar]
  25. Sarwar, M.G.M.; Woodroffe, C.D. Rates of shoreline change along the coast of Bangladesh. J. Coast. Conserv. 2013, 17, 515–526. [Google Scholar] [CrossRef] [Green Version]
  26. Bagli, S.; Soille, P. Morphological automatic extraction of Pan-European coastline from Landsat ETM+ images. In Proceedings of the International Symposium on GIS and Computer Cartography for Coastal Zone Management, Geneva, Switzerland, 5–9 October 2003; pp. 256–269. [Google Scholar]
  27. Genz, A.S.; Fletcher, C.H.; Dunn, R.A.; Frazer, L.N.; Rooney, J.J. The predictive accuracy of shoreline change rate methods and alongshore beach variation on Maui, Hawaii. J. Coast. Res. 2007, 23, 87–105. [Google Scholar] [CrossRef] [Green Version]
  28. Tirkey, N.; Biradar, R.S.; Pikle, M.; Charatkar, S. A study onshore line changes of Mumbai coast using remote sensing and GIS. J. Indian Soc. Remote Sens. 2005, 33, 85–91. [Google Scholar] [CrossRef]
  29. Bouchahma, B.; Yan, W. Automatic measurement of shoreline change on Djerba Island of Tunisia. J. Comput. Inf. Sci. 2012, 5, 17. [Google Scholar] [CrossRef] [Green Version]
  30. Wang, X.-Z.; Zhang, H.-G.; Fu, B.; Shi, A. Analysis on the coastline change and erosion-accretion evolution of the Pearl River estuary, China, based on remote sensing images and nautical charts. J. Appl. Remote Sens. 2013, 7, 073519. [Google Scholar] [CrossRef] [Green Version]
  31. Li, W.; Du, Z.; Ling, F.; Zhou, D.; Wang, H.; Gui, Y.; Sun, B.; Zhang, X. A Comparison of Land Surface Water Mapping Using the Normalized Difference Water Index from TM, ETM+ and ALI. Remote Sens. 2013, 5, 5530–5549. [Google Scholar] [CrossRef] [Green Version]
  32. Dewidar, K.M.; Frihy, O.E. Automated techniques for quantification of beach change rates using Landsat series along the North-eastern Nile delta, Egypt. J. Oceanogr. Mar. Sci. 2010, 2, 28–39. [Google Scholar]
  33. Mujabar, S.; Chandrasekar, N. A shoreline change analysis along the coast between Kanyakumari and Tuticorin, India, using digital shoreline analysis system. J. Geo. Spat. Inf. Sci. 2011, 14, 282–293. [Google Scholar]
  34. Ramalingam, G.; Renganathan, M. Coastal geomorphology and its evolution—a case study in Agniar basin, Tamilnadu. Indian J. Geomorph. 1998, 3, 146–156. [Google Scholar]
  35. Stockdon, H.F.; Sallenger, A.H.; List, J.H.; Holman, R.A. Estimation of shoreline position and change from airborne topographic lidar data. J. Coast. Res. 2002, 18, 502–513. [Google Scholar]
  36. Kaliraj, S.; Chandrasekar, N.; Magesh, N.S. Impacts of wave energy and littoral currents on shoreline erosion/accretion along the south-west coast of Kanyakumari, Tamil Nadu using DSAS and geospatial technology. Environ. Earth Sci. 2014, 71, 4523–4542. [Google Scholar] [CrossRef]
  37. Kabuth, A.K.; Kroon, A.; Pedersen, J.B. Multidecadal shoreline changes in Denmark. J. Coast. Res. 2014, 30, 714–728. [Google Scholar]
  38. Thi, V.T.; Xuan, A.T.T.; Nguyen, H.P.; Dahdouh-Guebas, F.; Koedam, N. Application of remote sensing and GIS for detection of long-term mangrove shoreline changes in Mui Ca Mau, Vietnam. Biogeosciences 2014, 11, 3781. [Google Scholar]
  39. Salauddin, M.; Hossain, K.T.; Tanim, I.A.; Kabir, M.A.; Saddam, M.H. Modeling Spatio-Temporal Shoreline Shifting of a Coastal Island in Bangladesh Using Geospatial Techniques and DSAS Extension. In Annals of Valahia University of Targoviste, Geographical Series; Valahia University of Targoviste: Târgoviște, Romania, 2018; Volume 18, pp. 1–13. [Google Scholar] [CrossRef] [Green Version]
  40. Kabir, M.A.; Salauddin, M.; Hossain, K.T.; Tanim, I.A.; Saddam, M.M.H.; Ahmad, A.U. Assessing the shoreline dynamics of Hatiya Island of Meghna estuary in Bangladesh using multiband satellite imageries and hydro-meteorological data. Reg. Stud. Mar. Sci. 2020, 35, 101167. [Google Scholar] [CrossRef]
  41. Islam, M.A.; Hossain, M.S.; Murshed, S. Assessment of Coastal Vulnerability Due to Sea Level Change at Bhola Island, Bangladesh: Using Geospatial Techniques. J. Indian Soc. Remote Sens. 2015, 43, 625–637. [Google Scholar] [CrossRef]
  42. Emran, A.; Rob, M.A.; Kabir, M.H.; Islam, M.N. Modeling spatio-temporal shoreline and areal dynamics of coastal island using geospatial technique. Modeling Earth Syst. Environ. 2016, 2, 4. [Google Scholar] [CrossRef] [Green Version]
  43. Sunny, M.J.M.; Rahman, M.A.; Matin, M.A. Affordable electricity for Bhashan Char from renewable energy. In 2019 International Conference on Electrical, Computer and Communication Engineering (ECCE); IEEE: Piscataway, NJ, USA, 2019; pp. 1–5. [Google Scholar]
  44. Bremner, L. Sedimentary logics and the Rohingya refugee camps in Bangladesh. Political Geogr. 2020, 77, 102109. [Google Scholar] [CrossRef]
  45. Matin, N.; Raju, K.A.H.; Rahman, M.A. Analysis of Wave Characteristics along the Coast of Bangladesh Using a Coupled Wave-Hydrodynamic Delft3D Model of the Bay of Bengal. In IOP Conference Series: Earth and Environmental Science; IOP Publishing: Bristol, UK, 2020; Volume 527, p. 012013. [Google Scholar]
  46. Milliman, J.D.; Syvitski, J.P. Geomorphic/tectonic control of sediment discharge to the ocean: The importance of small mountainous rivers. J. Geol. 1992, 100, 525–544. [Google Scholar] [CrossRef]
  47. Cowper-Smith, Y. The Bhasan Char Relocation Project–Implications for Rohingya Refugees in Bangladesh. Relief Web 2020. Available online: https://reliefweb.int/report/bangladesh/bhasan-char-relocation-project-implications-rohingya-refugees-bangladesh (accessed on 24 April 2020).
  48. Islam, M.A.; Hossain, M.S.; Hasan, T.; Murshed, S. Shoreline changes along the Kutubdia Island, southeast Bangladesh using digital shoreline analysis system. Bangladesh J. Sci. Res. 2014, 27, 99–108. [Google Scholar] [CrossRef] [Green Version]
  49. Mitra, S.S.; Santra, A.; Mitra, D. Change detection analysis of the shoreline using Toposheet and Satellite Image: A case study of the coastal stretch of Mandarmani-Shankarpur, West Bengal, India. Int. J. Geomat. Geosci. 2013, 3, 425. [Google Scholar]
  50. McFeeters, S.K. The use of the Normalized Difference Water Index (NDWI) in the delineation of open water features. Int. J. Remote Sens. 1996, 17, 1425–1432. [Google Scholar] [CrossRef]
  51. Xu, H. Modification of normalized difference water index (NDWI) to enhance open water features in remotely sensed imagery. Int. J. Remote Sens. 2006, 27, 3025–3033. [Google Scholar] [CrossRef]
  52. Ji, L.; Zhang, L.; Wylie, B. Analysis of dynamic thresholds for the normalized difference water index. Photogramm. Eng. Remote Sens. 2009, 75, 1307–1317. [Google Scholar] [CrossRef]
  53. Thieler, E.R.; Himmelstoss, E.A.; Zichichi, J.L.; Ergul, A. Digital Shoreline Analysis System (DSAS) Version 4.0—An ArcGIS Extension for Calculating Shoreline Change; US Geological Survey Open-File Report; U.S. Geological Survey: Reston, VA, USA, 2009. [Google Scholar] [CrossRef]
  54. Crowell, M.; Douglas, B.C.; Leatherman, S.P. On forecasting future U.S. Shoreline positions: A test of algorithms. J. Coast. Res. 1997, 13, 1245–1255. [Google Scholar] [CrossRef]
  55. Alam, M.S.; Uddin, K. A study of morphological changes in the coastal areas and offshore islands of Bangladesh using remote sensing. Am. J. Geogr. Inf. Syst. 2013, 2, 15–18. [Google Scholar]
  56. Ghosh, M.K.; Kumar, L.; Roy, C. Monitoring the coastline change of Hatiya Island in Bangladesh using remote sensing techniques. ISPRS J. Photogramm. Remote Sens. 2015, 101, 137–144. [Google Scholar] [CrossRef]
  57. Aslam, M.; Kench, P.S. Reef Island dynamics and mechanisms of change in Huvadhoo Atoll, Republic of Maldives, Indian Ocean. Anthropocene 2017, 18, 57–68. [Google Scholar] [CrossRef]
  58. Goodbred, S.L., Jr.; Kuehl, S.A. Floodplain processes in the Bengal Basin and the storage of Ganges–Brahmaputra Riversediment: An accretion study using 137Cs and 210Pb geochronology. Sediment. Geol. 1998, 121, 239–258. [Google Scholar] [CrossRef]
  59. Sarker, M.H.; Akter, J.; Ferdous, R.; Noor, F. Sediment dispersal processes and management in coping with climate change in the Meghna Estuary, Bangladesh. In Proceedings of the Workshop on Sediment Problems and Sediment Management in Asian River Basins; IAHS: Hyderabad, India, 2011; pp. 203–218, Publication 349. [Google Scholar]
  60. Hossain, S. Assessment of Sediment Movement Pattern Along Nearshore Coastal Water of Cox’s Bazar; Bangladesh University of Engineering and Technology: Dhaka, Bangladesh, 2015. [Google Scholar]
  61. Brammer, H. Can Bangladesh be Protected from Floods? University Press Limited (UPL): Dhaka, Bangladesh, 2004. [Google Scholar]
  62. CEGIS. Impacts of Climate Change on the Morphological Processes of the Main Rivers and Meghna Estuary of Bangladesh; Asian Development Bank (ADB): Manila, Philippines, 2010; pp. 1–123. [Google Scholar]
  63. Steckler, M.S.; Akhter, S.H.; Seeber, L.; Bilham, R.G.; Kogan, M.G.; Masson, F.; Maurin, T.; Mondal, D.; Agostinetti, N.P.; Rangin, C.; et al. GPS velocities and structure across the Burma accretionary prism and shillong anticline in Bangladesh. In Proceedings of the AGU Fall Meeting Abstracts, New Orleans, LA, USA, 13–17 December 2012; Volume 2012, p. T51F-2667. [Google Scholar]
  64. Haque, U.; Hashizume, M.; Kolivras, K.N.; Overgaard, H.J.; Das, B.; Yamamoto, T. Reduced death rates from cyclones in Bangladesh: What more needs to be done? Bull. World Health Organ. 2012, 90, 150–156. [Google Scholar] [CrossRef] [Green Version]
  65. Hossain, M.S. Biological aspects of the coastal and marine environment of Bangladesh. Ocean. Coast. Manag. 2001, 44, 261–282. [Google Scholar] [CrossRef]
  66. Iftekhar, M.S. Conservation and management of the Bangladesh coastal ecosystem: Overview of an integrated approach. In Natural Resources Forum; Blackwell Publishing Ltd: Oxford, UK, 2006; Volume 30, pp. 230–237. [Google Scholar]
Figure 1. Location map of the study area (Bhasan Char, Bay of Bengal, Bangladesh).
Sustainability 14 00747 g001
Figure 2. Tidal height with low and high during image acquisition date from 2003 to 2020 (Tidal station: Charchanga, Bangladesh).
Sustainability 14 00747 g002
Figure 3. Methodology workflow process used in this study.
Sustainability 14 00747 g003
Figure 4. Blue lines showing seismic data used in this study.
Sustainability 14 00747 g004
Figure 5. Morphological variations of the Bhasan Char Island from 2003–2020.
Sustainability 14 00747 g005
Figure 6. Trend of areal change of the island (2003–2020).
Sustainability 14 00747 g006
Figure 7. Erosion-Accretion Trend on the island throughout the study timeframe (2003 to 2020).
Sustainability 14 00747 g007
Figure 8. Erosion-Accretion scenarios of the Bhasan Char Island (2003–2020).
Sustainability 14 00747 g008
Figure 9. Spatiotemporal migration of island. (a) Boundary shifting and (b) Depocenter (Lob Shifting) of the Bhasan Char Island.
Sustainability 14 00747 g009
Figure 10. Showing four segments of the curvilinear shorelines to ease shoreline shifting calculation. (A: Northwestern segment, B: Northeastern Segment, C: Southwestern Segment, D: Southeastern Segment).
Sustainability 14 00747 g010
Figure 11. Net Shoreline Movement (NSM) of the Bhasan Char Island (A, B, C, and D segments).
Sustainability 14 00747 g011
Figure 12. End Point Rate (EPR) of the Bhasan Char Island (A, B, C, and D segments).
Sustainability 14 00747 g012
Figure 13. NSM and EPR along the shoreline (shoreline shifting trend).
Sustainability 14 00747 g013
Figure 14. 2D seismic section (LINE: CEB-97-415W) running from SSW to NNEacross the Bhasan Char Island. This a dip line shows the subsurface structural arrangement.
Sustainability 14 00747 g014
Figure 15. 2D seismic section (LINE: CEB-97-486) running from SSE to NNW across the Bhasan Char Island. The strike line shows the subsurface structural arrangement.
Sustainability 14 00747 g015
Figure 16. Time structure map produced approximately at upper Pliocene time. This map shows an NW-SE trending of gentle anticline. Bhasan Char Island is situated at the crest of the gentle anticline.
Sustainability 14 00747 g016
Figure 17. Water depth in and around the study area ranges from only two to four meters.
Sustainability 14 00747 g017
Figure 18. Intensity of siltation and shaded relief map of Bhasan Char area.
Sustainability 14 00747 g018
Figure 19. Storm surge height from 1960 to 2020 and the height of the dams constructed around the Bhasan Char Island.
Sustainability 14 00747 g019
Figure 20. Showing the historical cyclone tracks from 1960 to recent. The red circle outlines the location of the study area.
Sustainability 14 00747 g020
Figure 21. (a) There are three layers of protective measures to save the island from tidal waves and storm surges. This figure shows the outermost layer of engineering measure (vertical and horizontal steel pipes) along the western side of the Bhasan Char to reduce the energy of the tidal waves and strong surges. Behind is the second layer of protection that is made of gravel and geobags. Behind the mangrove forest, there is an earth embankment (third layer of protection) around the Ashrayan-3 Project implemented for the relocation of the FDMN displaced people. (b) The earth embankment (third layer of protection) is constructed around the Ashrayan-3 Project Area (1702 Acres). The length of the embankment is 12.1 km, and the height is nine feet (to be raised to 19 feet in the future). The slope ratio of the embankment is 1:5. The width of the top surface of the embankment will be 25 feet. (c) Cluster houses (red) with cyclone shelter and sweet water pond. (d) Cluster houses with cyclone shelters for the FDMN displaced people to be relocated in Bhasan Char.
Sustainability 14 00747 g021
Table 1. Cyclonic events in Bangladesh with landfall area from 2003 to 2020 (Data source: Bangladesh Meteorological Development).
Date of OccurrenceNature of PhenomenonLandfall AreaMaximum Wind Speed in km/hourTidal Surge Height in ft.
19 May 2004Cyclonic StormTeknaf-Akyab Coast65–902–4
15 November 2007Severe Cyclonic Storm with core of hurricane winds (SIDR)Khulna-Barisal Coast near Baleshwar River22315–20
25 May 2009Cyclonic Storm (AILA)West Bengal-Khulna Coast near Sagar Island70–904–6
16 May 2013Cyclonic Storm
(MAHASEN)
Noakhali-Chittagong Coast100-
30 July 2015Cyclonic Storm (KOMEN)Chittagong-Cox’s Bazar655–7
21 May 2016Cyclonic Storm
(ROANU)
Barisal-Chittagong Coast
near Patenga
1284–5
30 May 2017Severe Cyclonic Storm
(MORA)
Chittagong-Cox’s Bazar Coast
near Kutubdia
146-
4 May 2019Cyclonic Storm
(FANI)
Khulna and adjoining southwestern coast2154–5
9 November 2019Cyclonic Storm
(BULBUL)
West Bengal-Khulna150–1605–7
20 May 2020Severe Cyclonic Storm
(AMPHAN)
West Bengal-Khulna24015
Table 2. Details of the selected satellite images used in the study.
Sensor PlatformSensorAcquisition DateSpatial ResolutionCloud Cover
Landsat 5TM20 November 200330 mCloud Free
Landsat 5TM24 December 200430 m3%
Landsat 5TM10 February 200530 m2%
Landsat 5TM13 February 200630 mCloud Free
Landsat 5TM16 February 200730 m1%
Landsat 5TM7 April 200830 m1%
Landsat 5TM5 February 200930 mCloud Free
Landsat 5TM8 February 201030 m2%
Landsat 5TM11 February 201130 mCloud Free
Landsat 7ETM+6 February 201230 m1%
Landsat 8OLI1 December 201330 m2%
Landsat 8OLI19 February 201430 mCloud Free
Landsat 8OLI10 March 201530 m1%
Landsat 8OLI8 January 201630 m2%
Landsat 8OLI11 February 201730 mCloud Free
Landsat 8OLI13 January 201830 mCloud Free
Landsat 8OLI1 February 201930 mCloud Free
Landsat 8OLI4 February 202030 mCloud Free
Table 3. Areal statistics of the island from 2003 to 2020.
YearArea (sq. km)Area Gain (sq. km)
202079.800.61
201979.196.37
201872.830.62
201772.217.36
201664.8513.43
201551.422.23
201449.191.66
201347.53−11.80
201259.33−24.72
201184.0532.92
201051.1316.45
200934.69−46.43
200881.1222.15
200758.97−35.90
200694.86−24.89
2005119.7568.00
200451.7540.35
200311.40-
2003–2020 68.40
Table 4. Erosion-Accretion summery of Bhasan Char Island from 2003 to 2020.
DurationErosion
(sq. km)
Accretion
(sq. km)
Common Land
(sq. km)
2003–20065.3388.806.07
2006–200960.18034.69
2009–20123.1127.7531.58
2012–201515.177.817.81
2015–20184.7426.5247.23
2018–20202.409.7371.35
Table 5. Length, loss, and gain of the Shorelines of Bhasan Char Island.
YearShoreline
Length (km)
Shoreline
Gain/Loss (km)
202055.232.23
201952.994.28
201848.714.27
201744.443.90
201640.544.67
201535.870.23
201435.64−1.07
201336.71−13.48
201250.19−17.46
201167.6515.48
201052.1626.85
200925.32−53.55
200878.8716.26
200762.61−13.48
200676.093.89
200572.1923.34
200448.8532.88
200315.97-
2003–2020 39.25
Table 6. Water quality indicators in the Bhasan Char Island.
Assessed
Parameters
UnitResultsBangladesh Standard for Drinking Water (ECR’97)WHO Guideline for Drinking Water, 2004MethodData Source
Physical
pH-7.326.5–8.56.5–8.5Electrometric (pH meter)Bangladesh Navy
Total Hardness (EDTA) as CaCO3mg/L121.2200–500<500EDTA Titrimetric
Total Dissolved Solids (TDS)mg/L425.01000<1000Electrical Conductivity
Chemical
Chloridemg/L85.83150–600<250ArgentometricBangladesh Navy
Ironmg/L<0.10.3–1.0<0.3FAAS
Arsenicppb<1.050.010.0HGAAS
Biochemical
Salmonella sp.-Absent-AbsentCultureBangladesh Navy
Thermotolerant Escherichia coliCFU/100 mL000Membrane Filtration
Shigella spp.-Absent-AbsentCulture
Publisher’s Note: MDPI stays neutral with regard to jurisdictional claims in published maps and institutional affiliations.

