Article

Seismic Performance of Hybrid Corrosion-Free Self-Centering Concrete Shear Walls

1
Department of Civil and Environmental Engineering, Faculty of Engineering, Western University, London, ON N6A 5B9, Canada
2
Structural Engineering Department, Faculty of Engineering, Alexandria University, Alexandria 21544, Egypt
*
Author to whom correspondence should be addressed.
Sustainability 2022, 14(2), 712; https://doi.org/10.3390/su14020712
Submission received: 24 November 2021 / Revised: 27 December 2021 / Accepted: 5 January 2022 / Published: 10 January 2022

Abstract

:
Reinforced concrete (RC) walls are extensively used in high-rise buildings to resist lateral loads, while ensuring an adequate level of ductility. Durability problems, including corrosion of conventional steel reinforcements, necessitate exploring alternative types of reinforcement. The use of glass fiber reinforced polymer (FRP) bars is a potential solution. However, these bars cannot be used in seismic applications because of their brittleness and inability to dissipate seismic energy. Superelastic shape memory alloy (SMA) is a corrosion-free material with high ductility and unique self-centering ability. Its high cost is a major barrier to use in construction projects. The clear advantage of utilizing both SMA and FRP to achieve durable self-centering structures has motivated the development of a composite SMA-FRP bar. This paper investigates the hybrid use of FRP bars and either SMA bars or composite SMA-FRP in concrete shear walls. An extensive parametric study was conducted to study the effect of different design parameters on the lateral performance of hybrid RC walls. The seismic behavior of the hybrid walls was then examined. The hybrid walls not only solved the durability problem but also significantly improved the seismic performance.

1. Introduction

Reinforced concrete (RC) shear walls are commonly used as the lateral load system for residential and commercial buildings [1]. During seismic events, they are expected to provide adequate strength, stiffness, and ductility. To achieve sustainable buildings, which can be easily repaired following major seismic events, the need for novel materials that can mitigate seismic damage is increasing. These material needs to address other durability problems including corrosion, which can increase the concentration of stresses at crack locations and lead to deterioration in reinforcement strength and stiffness [2].
Glass fiber reinforced polymer (FRP) has a high resistance to corrosion and chemical attacks, high tensile strength, and a high stiffness-to-weight ratio [3]. These properties have motivated its use as an alternative reinforcement in concrete structures. The flexural behavior and serviceability of FRP RC beams have been examined and assessed based on different design guidelines by Kassem et al. [4]. El-Salakawy et al. [5] conducted a field test on FRP RC bridge decks. Results showed that GFRP rebars provide very competitive performance in comparison to steel rebars. Tobbi et al. [6] examined the effects of key variables including tie configuration, tie spacing, and spalling of concrete cover on the structural performance of GFRP RC columns. They concluded that utilizing GFRP rebars in RC columns can lead to significant improvements in seismic performance. Mohamed et al. [7] conducted experimental tests on concrete walls reinforced with different configurations of FRP bars. The FRP RC walls exhibited self-centering behavior up to the allowable drift limits, while providing a low level of energy dissipation. Yamakawa and Fujisaki [8] tested seven walls reinforced with FRP grids. The specimens had low energy dissipation characteristics and experienced an early degradation in the load capacity at a drift of 1%.
Superelastic shape memory alloy (SMA) has a flag-shaped hysteresis that allows the recovery of inelastic strains upon unloading [9]. This unique ability has made SMA a potential design option for attaining sustainable seismic force-resisting systems. Meshaly et al. [10], Araki et al. [11], Qiu and Zhu [12], and Sultana and Youssef [13] explored the use of SMA in the vertical bracing of RC and steel buildings. The results of these studies highlighted the benefits of using SMA as a sustainable material. Eliminating the seismic residual deformations by using SMA was also explored for beam-column joints [14], beams [15], and columns [16]. Abdulridha [17] tested a full-scale SMA RC wall using a cyclic lateral load. The residual displacement of the SMA RC wall was 85% less than a similar conventional steel RC shear wall. Abraik and Youssef [18,19] investigated the effect of the location of SMA bars on the seismic performance of RC walls. Abraik and Youssef [20] assessed the collapse vulnerability of SMA RC walls. The results showed that SMA RC walls exhibited lower seismic damage as compared to steel RC walls.
Zafar and Andrawes [21] developed an SMA-FRP composite bar that comprises a high elongation resin matrix and SMA reinforcing wires. The flexural behavior of concrete beams and frames reinforced with these bars was experimentally examined [22,23]. The experiments highlighted the high potential for the developed composite bar in earthquake resisting systems.
This paper aims to evaluate the seismic performance of concrete shear walls reinforced with hybrid SMA and FRP composites. An extensive parametric study is conducted to identify the effect of different geometric and material configurations. The seismic performance of RC walls utilizing either SMA bars or composite bars at the plastic hinge regions and FRP bars elsewhere are then compared. The following sections provide details about the composite bar, considered walls, modeling technique, parametric study, and dynamic analysis results.

2. SMA-FRP Composite Bar

The composite bar is composed of embedded Ni–Ti wires connected using polymeric resin with high ultimate strain and covered with supplementary glass fibers. Ni–Ti (51-49%) SMA wires with a diameter of 500 µm were selected and trained through continuous cycling [21]. Glycidyl ether epoxy (Epoxy-862) and polyamine curing agent (Epikure-3274) were selected as components of the host resin matrix in a ratio of 100:40 parts by weight [21]. S-glass was selected as the supplementary reinforcement in the composite because of its excellent elongation properties (ultimate strain of 3.4%) as compared with other commercially available fiber types such as E-glass, Carbon, and Kevlar [21]. Under specified temperature and pressure, hot-pressed SMA-GFRP composites were produced by embedding trained SMA wires in the resin matrix [24].

3. Shear Wall Design

The reference steel RC shear wall (W1), shown in Figure 1a, is considered to represent the Seismic Force Resisting System (SFRS) of a 10-story building located in Vancouver, BC. Site class D with shear wave velocity ranging from 180 to 360 m/s is assumed. The assumed concrete compressive strength and steel yield strength are 30 MPa and 400 MPa, respectively. The gravity load, being supported by the wall during a seismic event, is taken 1248 kN per story. Assuming the wall to be ductile, the seismic load reduction factor ( R d R 0 ) is 5.6 [25]. The internal forces and moments are calculated using the equivalent static lateral force method as per the National Building Code of Canada [25]. The design of the wall is conducted according to CSA A23.3 [26]. Figure 1b gives details of the designed steel RC wall.
The steel RC wall design was then revised by replacing the steel bars with SMA bars or composite bars, and FRP bars. The SMA bars and the composite bars were utilized over the length of the expected plastic hinges. Mechanical couplers are assumed to connect the SMA bars and composite bars to the FRP bars, which are reinforcing the remaining portion of the wall height. The designed wall is expected to develop two plastic hinges [20] each with a length of 0.2 h w . One of the plastic hinges is located at the base of the wall due to the predominant vibration mode. The second is at the wall mid-height as a results of higher vibration modes.
The six reinforcement layouts, shown in Figure 2, were considered in this research. The considered walls were reinforced with steel bars (W1); SMA bars in the boundary elements over the two plastic hinges and FRP bars elsewhere (W2); composite bars in the boundary elements over the two plastic hinges and FRP bars elsewhere (W3); SMA bars in the boundary elements and the web over the lower plastic hinge and FRP bars elsewhere (W4); composite bars in the boundary elements and the web over the lower plastic hinge and FRP bars elsewhere (W5); and composite bars in the boundary elements over the lower plastic hinge and FRP bars elsewhere (W6). Figure 3 shows details of reinforcement for the designed hybrid walls.

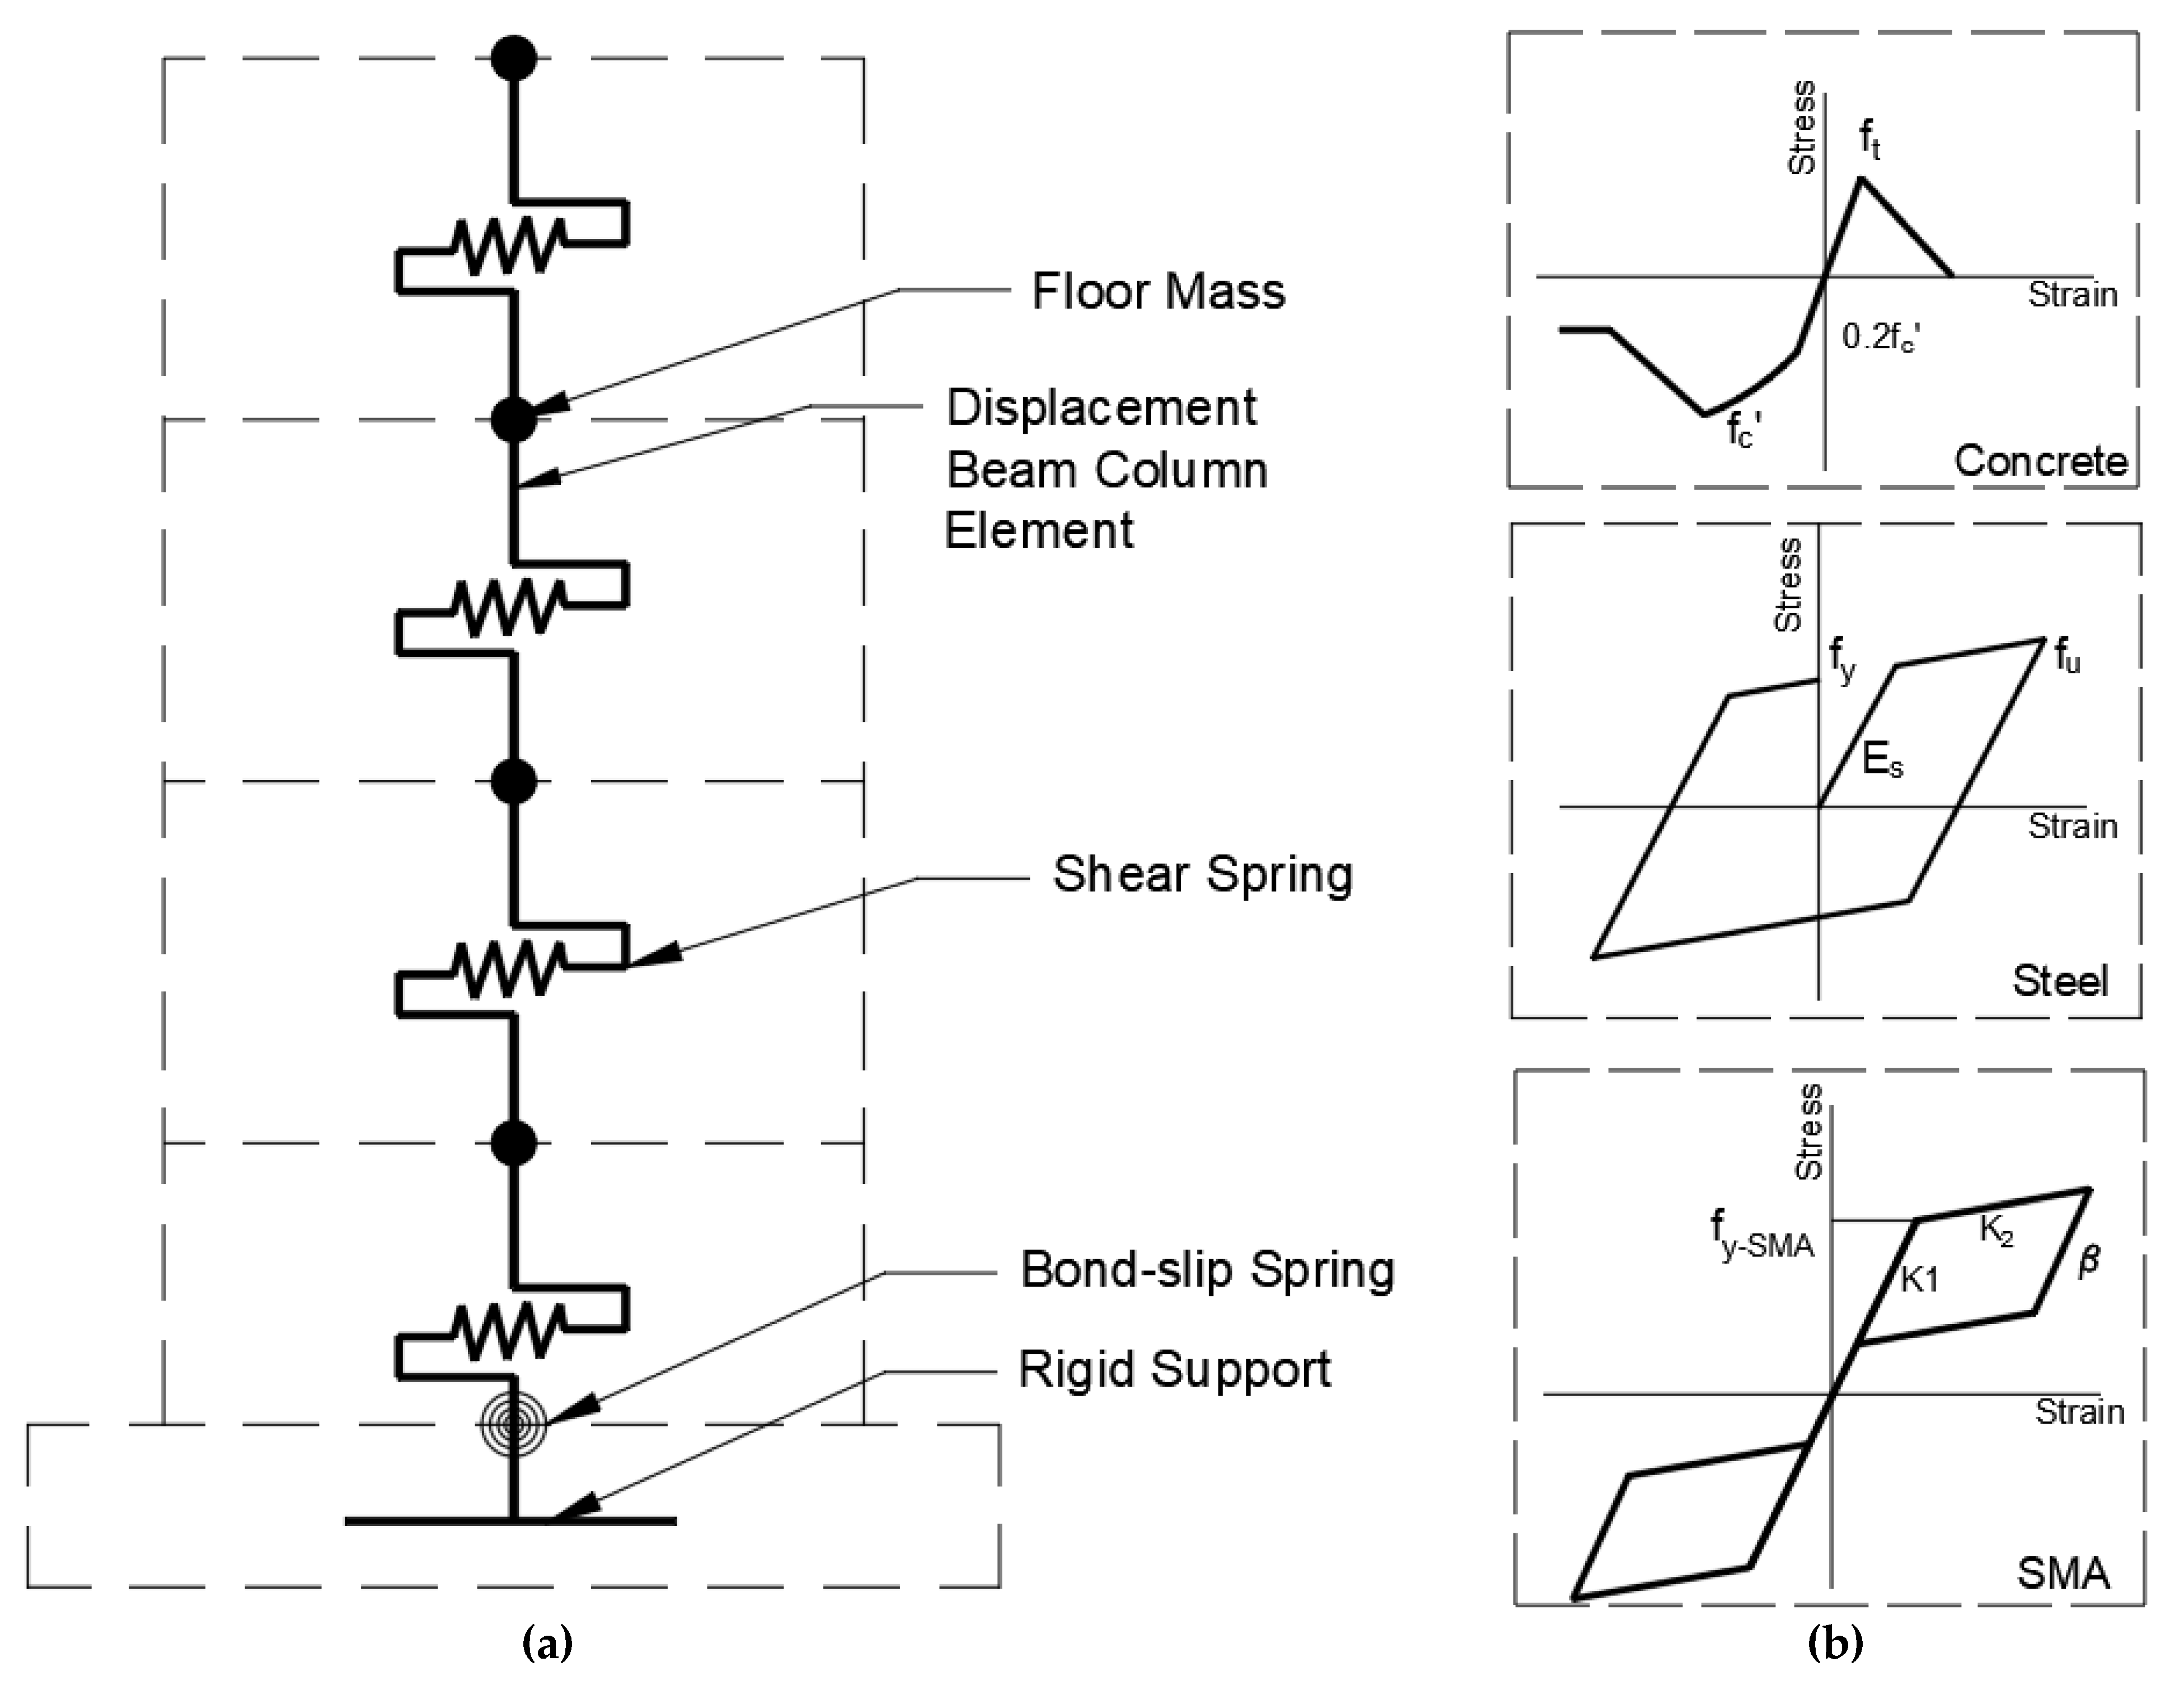
4. Numerical Modeling

The numerical model and nonlinear time history analyses were conducted using the “Open System for Earthquake Engineering Simulation” finite element software (OpenSees) [27]. The walls were modeled using the distributed-plasticity fiber-section beam-column elements, shown in Figure 4. These elements account for moment–axial force interaction at each analysis step. To account for shear deformations, a horizontal spring, with an effective shear stiffness defined by Equation (1) [28], was located at mid-height of each floor.
V eff = 0.4 E C b w L w
where E c is the concrete elastic modulus, b w is the wall thickness, and L w is the wall length.
The uniaxial material relationship described by Menegotto and Pinto [29] was used to model steel reinforcement. The steel yield strength ( f y ) and its modulus of elasticity ( E s ) were assumed to be 400 MPa and 200 GPa, respectively. Confined and unconfined concrete were modeled using the uniaxial material model of Mander et al. [30]. The concrete compressive strength ( f c ) was assumed to be 30 MPa. The Ni–Ti SMA bars were modeled using a self-centering material constitutive model. Their assumed mechanical properties are presented in Table 1 and are based on the experimental results by Abdulridha [17]. The FRP and the resin were modeled using linear elastic and elastic-perfectly plastic uniaxial materials, respectively, as recommended by Zafar and Andrawes [23]. Table 2 provides the main mechanical properties for the composite SMA-FRP bars.

4.1. Damage Criteria

For local response, two strain levels were defined—serviceability and damage-control strains. The serviceability strain defines the limit below which the expected damage is minor and does not require repair. Its value for confined concrete and steel bars can be taken as −0.004 and +0.015, respectively [31]. The damage-control strain defines the limit for repairable damage. Its values for confined concrete and steel bars can be taken as −0.018 and +0.06, respectively [31]. There is no serviceability limit for FRP and SMA because of their linear and self-centering behavior. However, their damage control limits are +0.013 for FRP [32] and +0.070 for SMA [33]. The global damage criteria are defined for serviceability and acceptable repair at residual inter-story drift values of 0.3% [34] and 0.5% [35], respectively.

4.2. Numerical Model Validation

Abdulridha [17] performed full-scale (i.e., aspect ratio 2.2) tests on a steel RC wall and SMA RC wall. Both specimens were identical in dimensions and materials except for the amounts of boundary reinforcement, which are listed in Table 3. h w is the wall height; L w is the wall length; b w is the wall thickness; f c is a concrete compressive strength; f y is the steel yielding; ρ v b is the vertical steel ratio at boundaries; ρ v is the vertical steel ratio at web; ρ h is the horizontal steel ratio. For both RC walls, the numerical model accurately captured the specimen performance (see Figure 5), including peak strength (error of +2.7%), ultimate displacement (error of −2.0%), and residual displacement (error of −1.0%). It should be noted that predicting strength degradation was not required as the dynamic analysis, described later in the paper, considered ground motions with 2% and 10% probabilities of exceedance in 50 years.

5. Lateral Force–Displacement Response

A nonlinear static analysis (pushover analysis) was carried out to determine the influence of the design parameters on ten-story wall lateral performance. Table 4 lists the parametric study cases. The studied variables are axial load ratio, boundary length, boundary reinforcement ratio, and web reinforcement ratio. For each case, the six reinforcement patterns, shown in Figure 2, were examined.

5.1. Effect of Axial Load Ratio (Cases 1, 2, and 3)

The practical range for axial load ratios ( P A g f c ) for RC walls is from 0 to 0.15, considering low and moderate height buildings (i.e., building with height < 22.86 m) [36]. P is the applied axial load, and Ag is the gross-section area.
Figure 6 shows the effect of the applied axial load on the load-displacement curves for the studied walls. Increasing the axial load by 10 or 15% significantly increases the yield load. The figure also shows that the considered walls exhibited a ductile behavior at zero axial load ratio. The ductility level at 10% axial load ratio varied based on the type of reinforcing bars. It is clear that the use of the composite bars improves the wall ductility due to their lower yield strength as compared to steel and SMA bars (W3, W5, and W6).

5.2. Effect of Boundary Element Length (Case 2, 4, and 5)

The effect of increasing the length of the wall boundary on the load-displacement behavior is shown in Figure 7. For W1, increasing the boundary element length from 500 mm to 700 mm slightly increases the load capacity and the lateral displacement capacity. The displacement increase was more visible for SMA RC walls (W2 and W4) as the load capacity and lateral displacement capacity of SMA RC walls (W2 and W4) increased by 3% and 20%, respectively. For composite RC walls (W3, W5, and W6), the increase was significant, reaching 17% and 68% for the load capacity and lateral displacement capacity, respectively.

5.3. Effect of Boundary Element Reinforcement Ratio (Case 6, 9, and 10)

Figure 8 shows the effect of the longitudinal reinforcement ratios on the load-displacement performance. Increasing the boundary reinforcement ratio of the reference wall W1 from 1.28% to 2.00% increased the load capacity by approximately 11% and slightly improved the lateral displacement capacity. Increasing the longitudinal reinforcement in the boundary region of walls W2, W3, W4, W5, and W6 did not affect the displacement capacity. However, it increased the load capacity by about 6% on average for W2, W3, W4, W5, and W6.

5.4. Effect of web reinforcement ratio (Case 6, 7, and 8)

Figure 9 shows the effect of web reinforcement on the load-displacement curves for the studied walls. Increasing the web reinforcement from 0.25% to 0.40% for wall W1 increased the load capacity by 8% and slightly increased the displacement capacity. In contrast, W2, W3, W4, W5, and W6 showed an increase in load-capacity by about 4%, accompanied by a decrease in the displacement capacity by about 5%. The effect of increasing the web reinforcement ratio on load and displacement capacity was found to be negligible beyond 0.4%.

6. Dynamic Analysis

Eigenvalue analysis was performed for each of the considered walls. The minimum (T1S) and maximum (T1) fundamental periods were 1.69 and 1.71 seconds, respectively. Seven ground motions were selected to represent the seismic hazard spectrum of Vancouver, BC, considering 2% [25] and 10% (moderate) probabilities of exceedance in 50 years (2% in 50 y and 10% in 50 y). The ground motions were selected from the PEER ground motion database to have an effective vibration period that ranged between 0.2 T1S and 1.5 T1 as per TBI (2017) and to match the assumed site class. The ground motions were then scaled using the Mean Square Error (MSE) to minimize the difference between the response spectra of their strong components and the target spectra. The resulting response spectra for the strong components of the earthquakes are shown in Figure 10, where Sa is the spectral acceleration. Details of the selected ground motions and the used scale factors are listed in Table 5.
Nonlinear time history analysis was carried out to evaluate the response of the considered walls when subjected to 10% in 50 y and 2% in 50 y seismic events. Both the weak and strong components of each earthquake were utilized. The investigated response parameters were the lateral displacements, interstory drifts, residual drifts, floor accelerations, shear forces, bending moments, and internal strains.

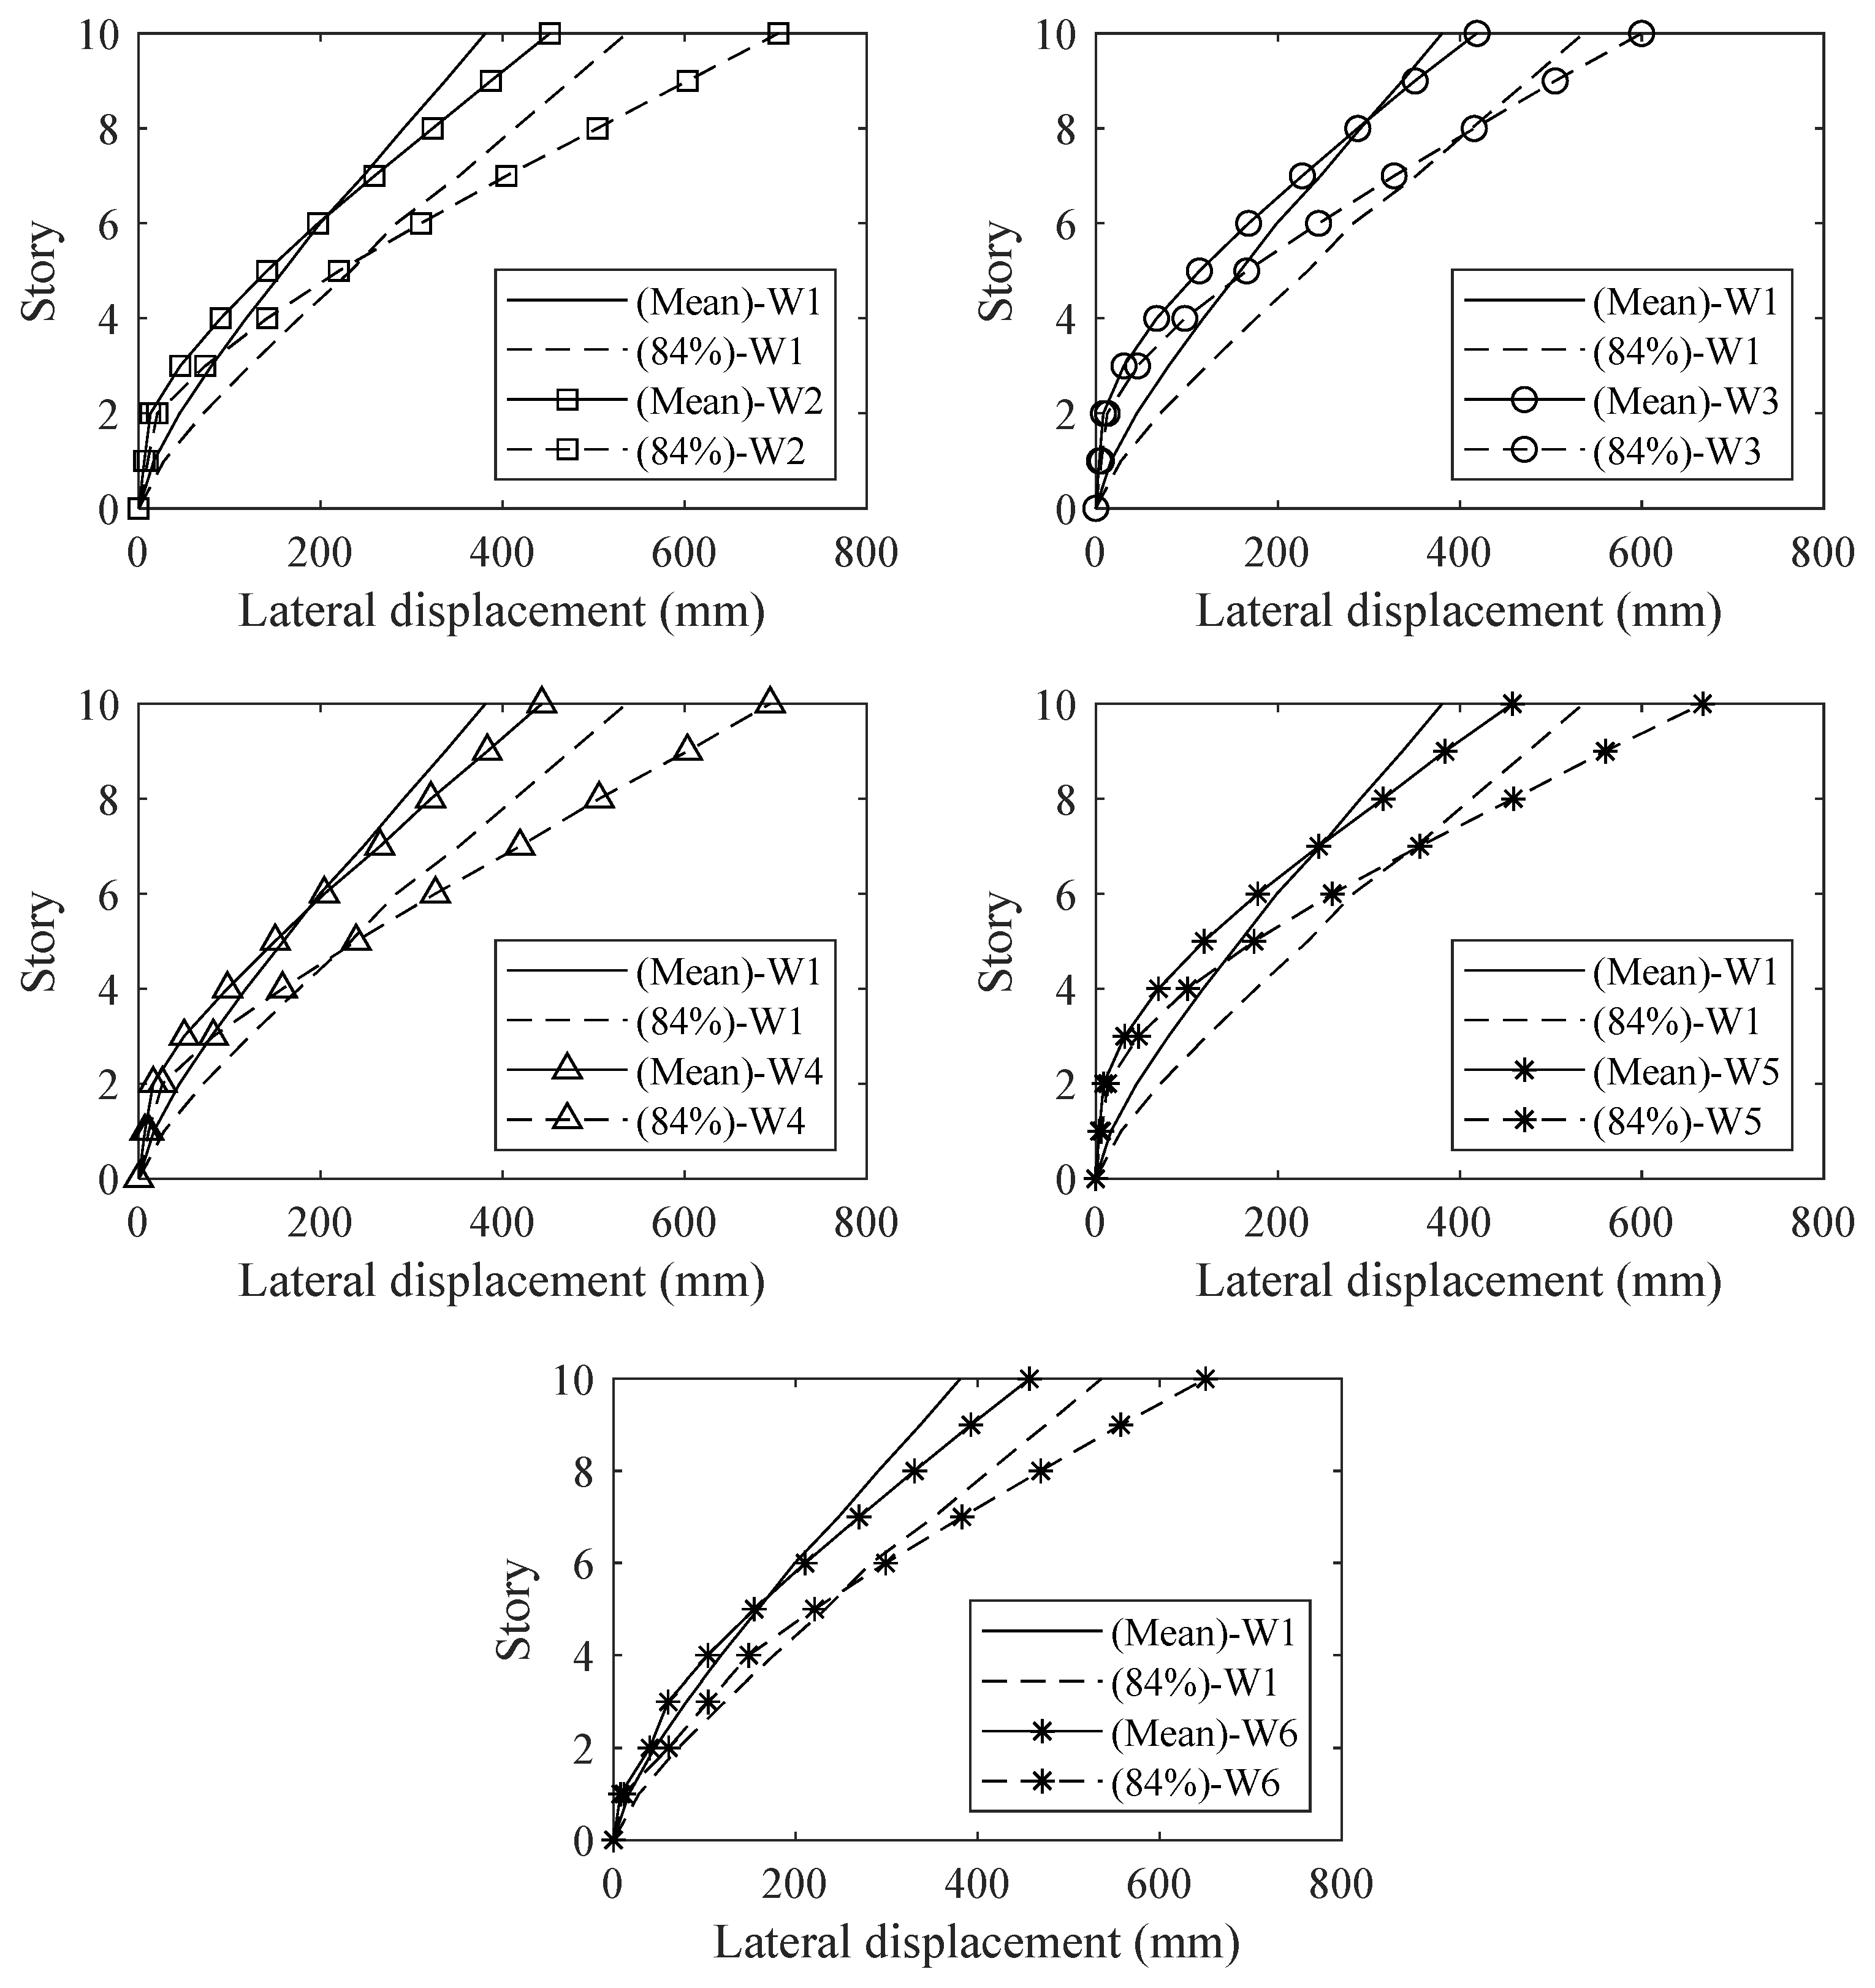
6.1. Story Displacements

Figure 11, Figure 12, Figure 13 and Figure 14 show the mean and 84th percentile maximum and residual lateral story displacements of the examined walls. Table 6 summarizes the maximum interstory drift (MID) and maximum residual interstory drift (MRID) values.
Figure 11 shows that the differences in the maximum lateral story displacement between W1, W2, W4, and W6 are negligible for the frequent 10% in 50 y seismic events. For the same hazard level, the maximum lateral story displacements of composite RC W3 and W5 are on average 11% less than for other walls. Considering the 2% in 50 y seismic events, Figure 12 shows that the low modulus of elasticity of SMA and composite bars leads to 10% to 31% higher maximum lateral story displacements for walls W2 to W6, as compared to W1.
Table 6 shows that all examined walls experienced similar mean and 84th percentile interstory displacements considering the 10% in 50 y seismic events, with average values of 0.64% and 0.85%, respectively. For the 2% in 50 y seismic events, the average values for walls W2 to W6 were higher than W1 by about 40%.

6.2. Residual Displacements

As shown in Figure 13 and Figure 14, the recentering feature of the SMA and composite bars led to a significant reduction in the story residual displacements. For the 10% in 50 y seismic events, W6 had the lowest story deformations followed by walls W3, W4, and W5, and then followed by W2. Considering the 2% in 50 y seismic events, W5 had the lowest story deformations followed by walls W2, W3, W4, and W6. The residual story displacement for W5 was reduced by about 80%, as compared to W1.
Table 6 shows that the mean MRID of SMA and composite RC walls was significantly reduced as compared to W1. For the hazard level of 10% in 50 y, the average reduction was 81% for W6, 71% for W3, 57% for W4 and W5, and 42% for W2. For the hazard level of 2% in 50 y, the average reduction was 78% for W6, 71% for W3, 64% for W4 and W5, and 21% for W2.
The mean and the 84th percentile MRID values reveal that all walls meet the serviceability limit when considering the 10% in 50 y seismic events. For the 2% in 50 y seismic events, the mean MRID values reveal that W1 does not meet this limit. The 84th percentile MRID values show that W2, W3, and W6 are not satisfying the serviceability limit; i.e., W4 and W5 are the only walls satisfying the limit. W6, which showed the best performance considering lateral displacements for the 10% in 50 y, had a significant difference between the mean and 84% percental seismic residual deformations, suggesting that it will not provide the needed reduction in residual deformations for a wide array of seismic events.

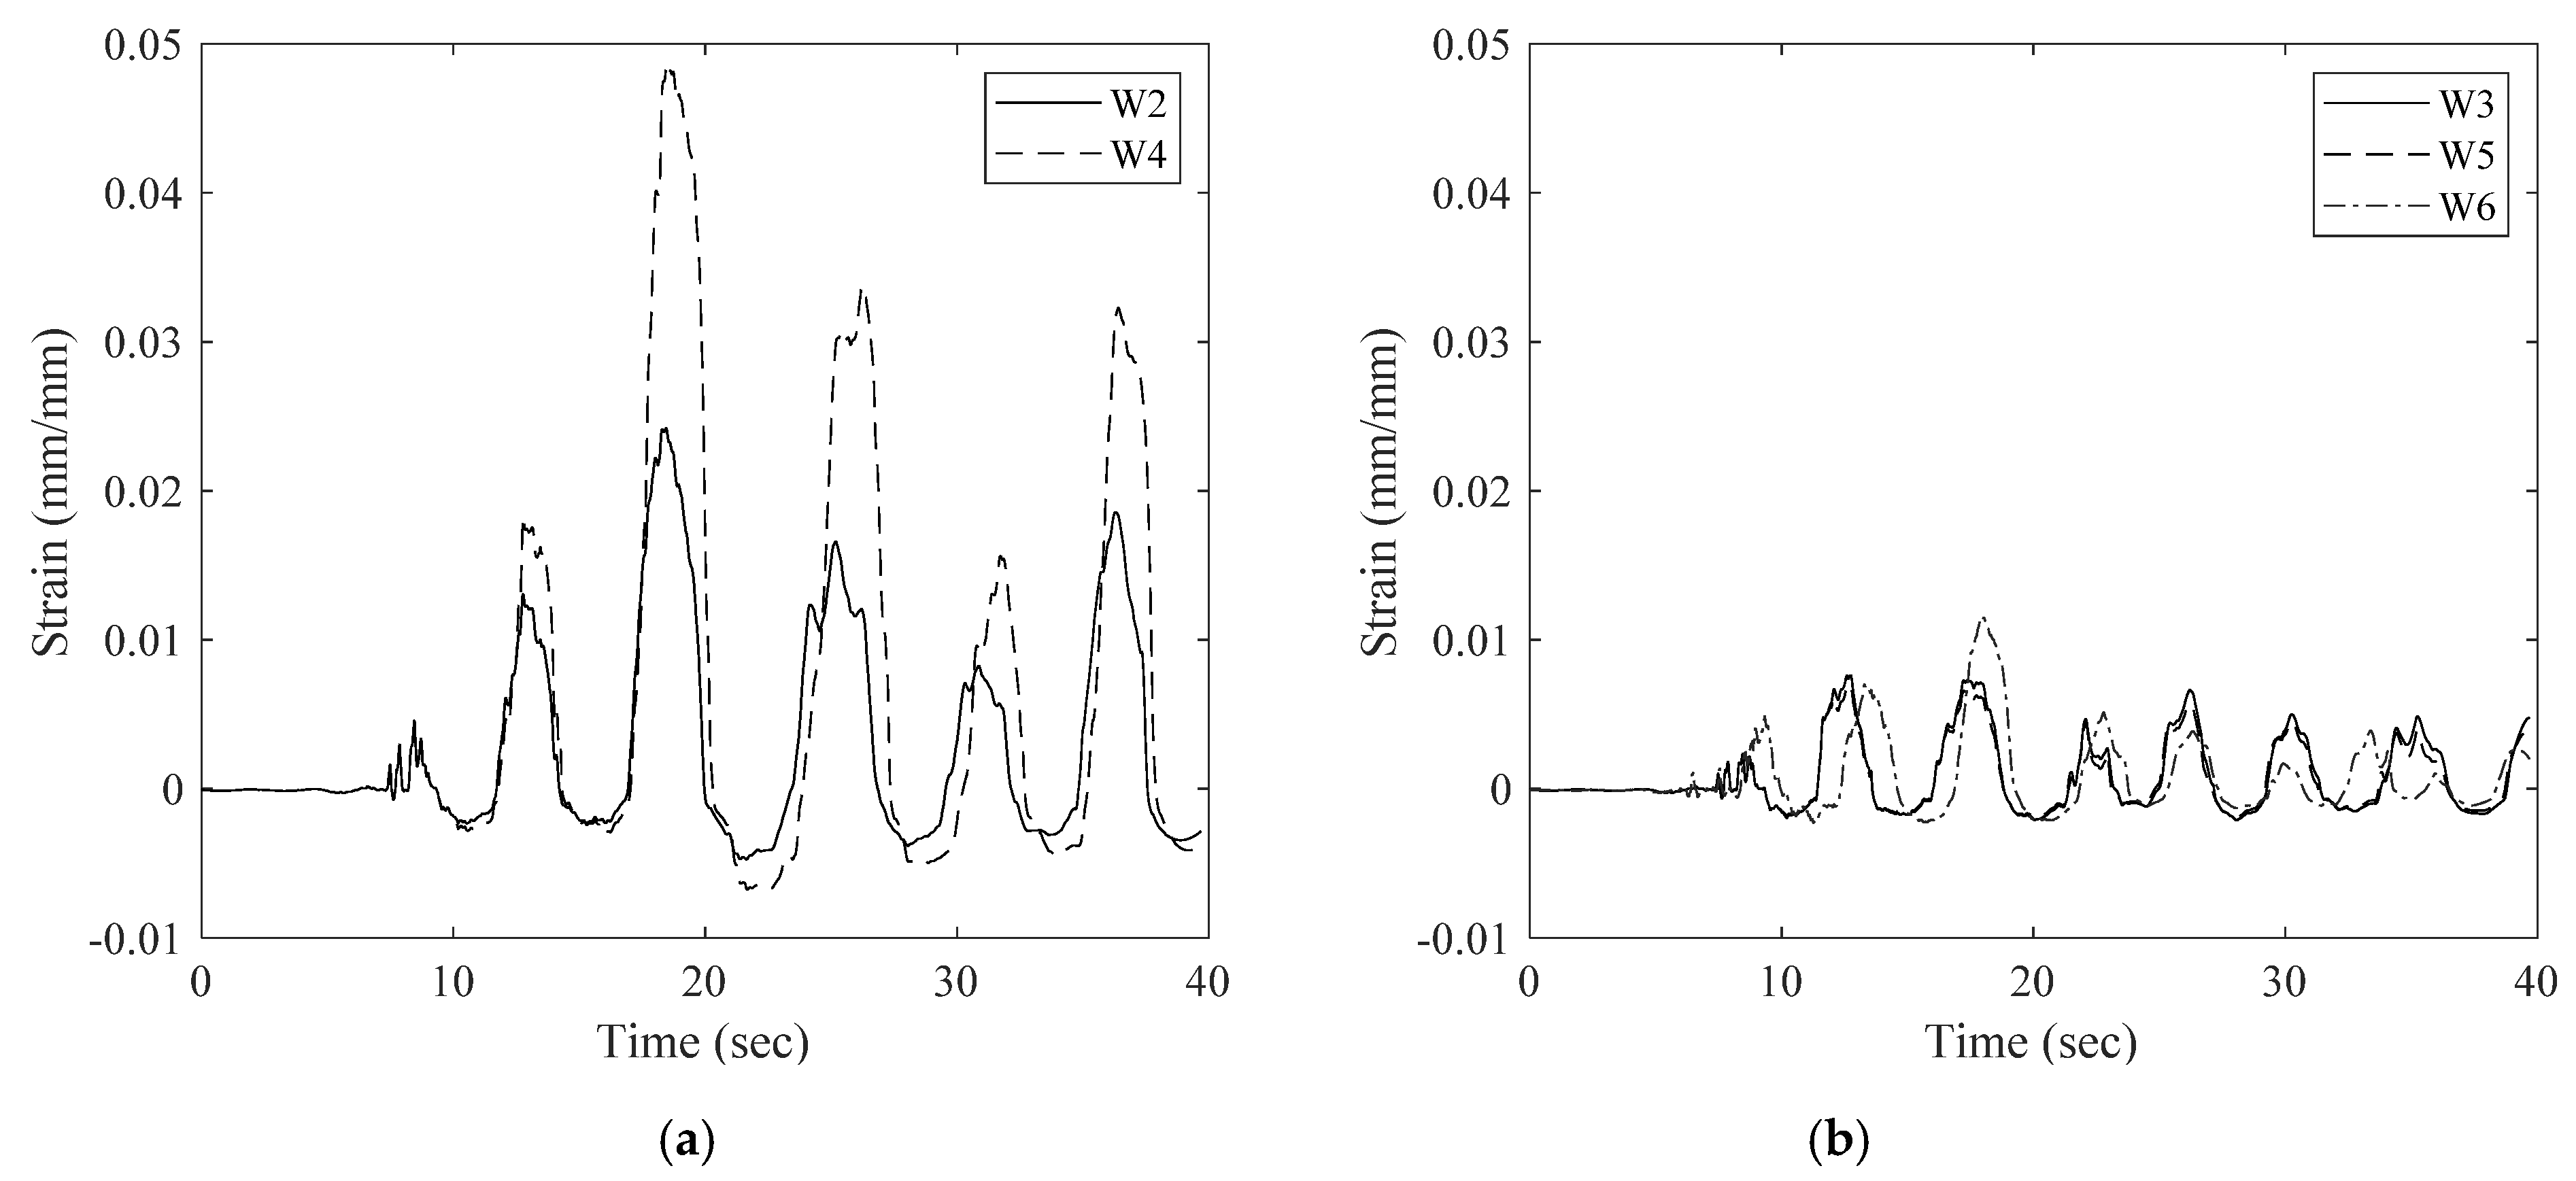
6.3. Floor Acceleration

Floor acceleration can be used to represent the damage level of non-structural components. The allowable floor acceleration ( a f ) is given by Equation (2) [37].
a f = 0.4 S DS ( 1 + 2 z / h )
where S DS is the design spectral response acceleration parameter at short periods, z is the height of the considered floor measured from the base, and h is the height of the structure.
Figure 15 shows the variation of the floor acceleration for the considered walls. All walls had similar acceleration values. This behavior might be explained by their similar natural periods, which are located in the displacement region of the response spectra of the chosen records. For the 2% in 50 y seismic events, the peak floor acceleration is increased by about 90% as compared to the 10% in 50 y seismic events. The damage to non-structural components for all considered walls is acceptable as the floor accelerations are lower than the allowable limits.

6.4. Internal Forces and Moments
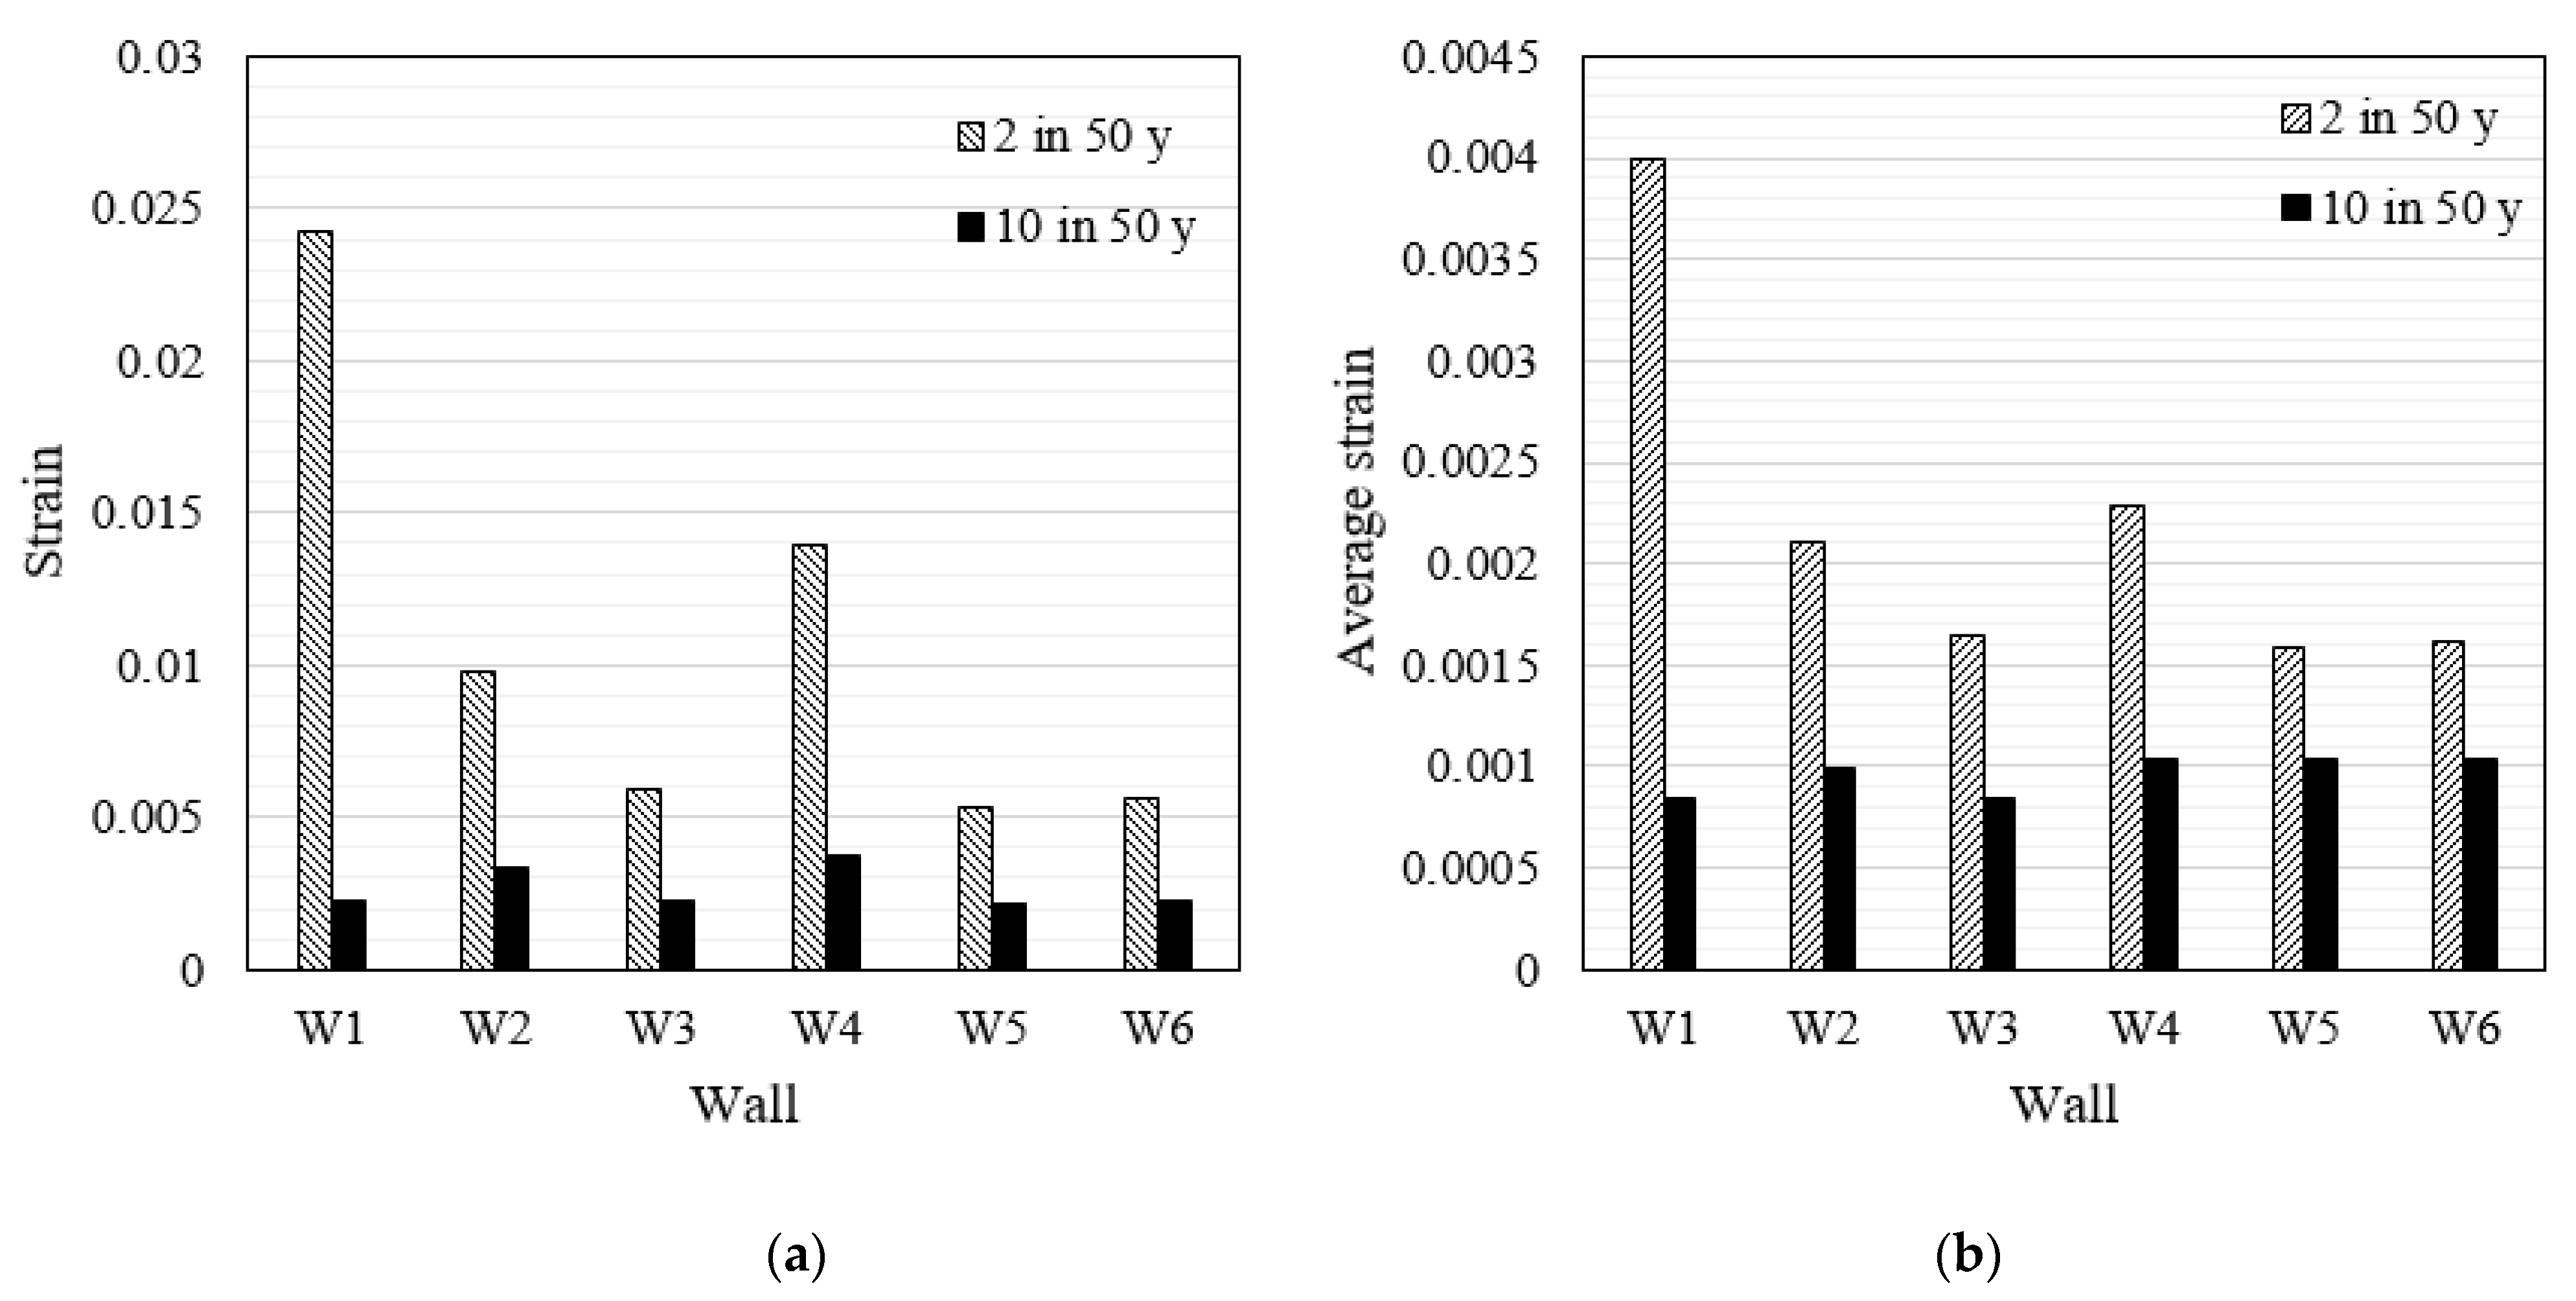
Figure 16 shows the shear forces and bending moment envelopes for the 10% in 50 y seismic events. The mean story shear for W1 is about 10% higher than that of SMA and composite RC walls. The reduction in story shear forces corresponds to a decrease in the bending moments, reaching 17%. Figure 17 shows the shear forces and bending moments for the 2% in 50 y seismic events. Shear forces and bending moments for SMA RC walls (W2 and W4) are lower than W1 by about 11% and 24%, respectively. For composite RC walls, the difference in the story shear forces was negligible, but their moments were higher than W1 by 35% on average.

6.5. Damage Level

Figure 18 and Figure 19 show the maximum developed strains in the rebars and concrete. For the 10% in 50 y seismic events, strains in the concrete, steel bars, SMA bars, and composite bars were lower than their serviceability limits. For the 2% in 50 y seismic events, the strains in the SMA and composite bars remained below their serviceability limits. However, the strains in the steel bars of W1 reached 0.055, which exceeds their serviceability limit. The concrete strains of W1, W2, and W4 also exceeded the concrete serviceability limit. Strains developed in W3, W5, and W6 reflect a minor amount of damage for the two considered seismic hazards.
Figure 20 shows the strain-time history for the SMA and composite bars considering the strong component of record 2 of the 2% in 50 y seismic events. The figure clearly shows that the composite bars experienced lower strains than the SMA bars. It also shows that neither type of bar experienced any permanent deformations.
Figure 21 shows the average reinforcement and concrete maximum strains. For the 10% in 50 y seismic events, the strains in the concrete and reinforcing bars had similar values for all walls. However, for the 2% in 50 y seismic events, the SMA and composite bar strains were lower than the steel strains by 50% and 78%, respectively. The concrete strains for SMA and composite RC walls were also lower than those for steel RC walls by 45% and 60%, respectively.
Figure 22 shows the distribution of average reinforcement strain along the height. The strain values for the SMA and composite bars were generally higher than the steel bars for the 10% in 50 y seismic events. Regarding the 2% in 50 y seismic events, the benefit of using SMA and composite bars becomes clear.

7. Conclusions

This paper investigated the seismic behavior of walls reinforced with SMA and FRP composites as compared to steel RC walls. Three potential hybrid reinforcement solutions were investigated: steel bars, SMA and FRP bars, and composite and FRP bars. The SMA and composite bars were provided for the plastic hinge length. The composite bars proved to be an excellent choice for sustainable structures as they lower inter-story drift, result in higher shear capacity, and require smaller amount of SMA. Specific conclusions are given below.
1.
Pushover Analysis:
a.
The axial load increased the lateral resistance of the examined walls as it delayed the yielding of the longitudinal bars. This delay significantly reduced the ductility for walls that were reinforced with either steel or SMA bars. However, the ductility for walls reinforced with composite bars was not significantly reduced due to their lower yield strength.
b.
The improvement in the lateral load capacity and lateral displacement capacity associated with increasing the length of the boundary elements is slight for steel RC walls, visible for SMA RC walls (i.e., 3% to 20%), and major for composite RC walls (i.e., 17% to 68%).
c.
Increasing the longitudinal reinforcement of the wall boundary elements increased the lateral capacity of the considered walls but did not affect their displacement capacity.
d.
The web reinforcement had a minor effect on the load and displacement capacities. This effect vanishes for reinforcement ratios higher than 0.4%.
2.
Seismic Analysis
a.
For the frequent 10% in 50 y seismic events, the story displacements are not greatly affected by the type of reinforcement. However, for the 2% in 50 y seismic events, utilizing SMA or composite bars increases the maximum story displacements by 10 to 31% as well as the MID by about 40% due to their relatively low modulus of elasticity.
b.
The recentering capability of SMA and composite bars significantly reduced the seismic residual deformations, as well as the RIDs. Utilization of the composite bars in the web and boundary elements for the length of the lower plastic hinge provided the best performance in terms of residual deformations. It reduced the seismic residual deformations by about 80% and the RIDs by about 64%. The residual deformations for this case were also judged to meet the serviceability limit, which indicates that the wall requires minor repair following a major seismic event. Some of the analysis cases showed a significant difference between the mean and the 84% seismic residual deformations. This observation suggests that care should be taken in designing structures utilizing SMA and composite bars to ensure that they achieve the required reduction in seismic residual deformations for a wide array of seismic events.
c.
For the case of a moderate seismic event, the studied SMA and composite RC walls had lower shear forces and bending moments when compared with the steel RC wall. This observation held true for SMA RC walls considering the case of major seismic events. However, the bending moments were increased by 35% on average for composite RC walls suggesting the need to conduct future studies to develop criteria to design such walls.
d.
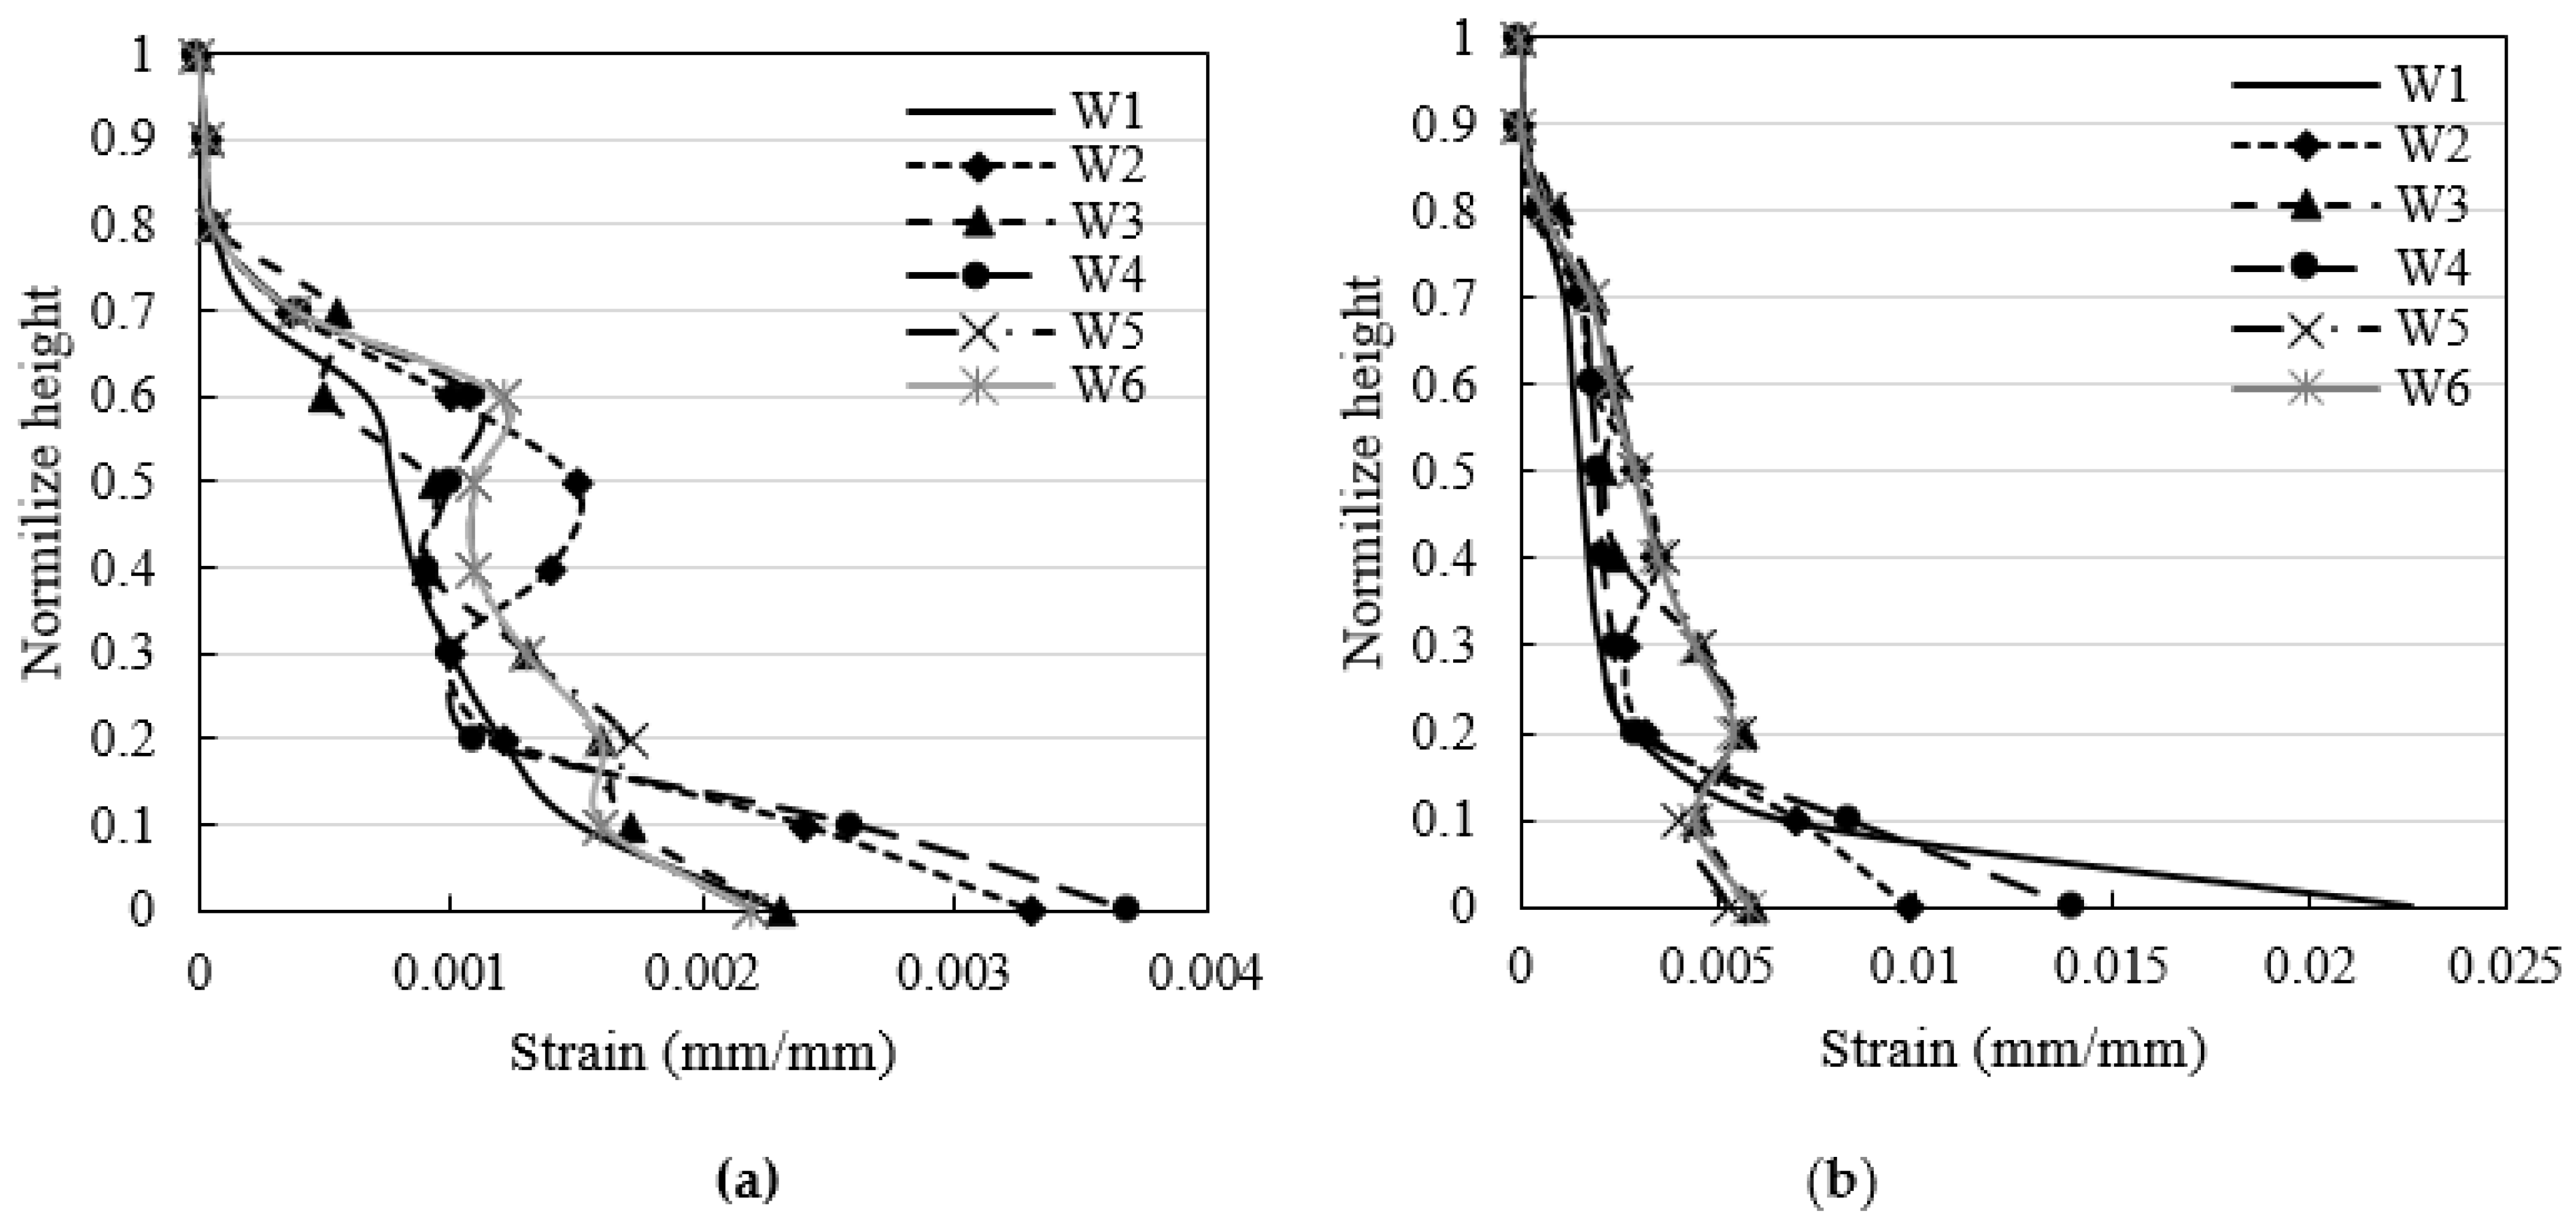
The strain results from both reinforcements and concrete imply a significant margin of safety against damage for composite RC walls (i.e., the SMA and composite bar strains were lower than the steel and concrete strains by 64% and 52% on average, respectively). The use of SMA bars reduced the level of concrete damage but did not eliminate it.
It should be noted that all conclusions are drawn based on the assumed 10-story building and modeling assumptions. Additionally, due to the absence of design guidelines for walls reinforced with SMA or composite bars, the steel RC wall design is utilized to define the number of longitudinal steel bars needed. This design process is not optimal and might have affected the conclusions. Future studies are needed to define the ductility and overstrength factors for walls reinforced with SMA or composite bars.

Author Contributions

E.A.: Methodology, Validation, Analysis. M.A.Y.: Conceptualization, Writing—review & editing, Supervision, Project administration, Funding acquisition. S.F.E.-F.: Writing—review & editing, Supervision. All authors have read and agreed to the published version of the manuscript.

Funding

This research was funded by the Natural Sciences and Engineering Research Council of Canada (NSERC) and the Canadian Bureau for International Education (CBIE).

Institutional Review Board Statement

Not applicable.

Informed Consent Statement

Not applicable.

Data Availability Statement

The raw/processed data required to reproduce these findings cannot be shared at this time as the data also form part of an ongoing study.

Conflicts of Interest

The authors declare that they have no known competing financial interest or personal relationships that could have appeared to influence the work reported in this paper.

References

  1. Liu, C.; Ni, X.; Wu, H.; Wei, X.; He, B. Calculation theory and test verification for skeleton curve of T-shaped shear walls. Struct. Eng. Int. 2017, 27, 281–291. [Google Scholar] [CrossRef]
  2. Liu, C.; Fang, D.; Zhao, L. Reflection on earthquake damage of buildings in 2015 Nepal earthquake and seismic measures for post-earthquake reconstruction. In Structures; Elsevier: Amsterdam, The Netherlands, 2021; Volume 30, pp. 647–658. [Google Scholar] [CrossRef]
  3. Bank, L.C. Composites for Construction: Structural Design with FRP Materials; John Wiley & Sons, Inc.: Hoboken, NJ, USA, 2006. [Google Scholar]
  4. Kassem, C.; Farghaly, A.S.; Benmokrane, B. Evaluation of flexural behavior and serviceability performance of concrete beams reinforced with FRP Bars. J. Compos. Constr. 2011, 15, 682–695. [Google Scholar] [CrossRef]
  5. El-Salakawy, E.; Benmokrane, B.; El-Ragaby, A.; Nadeau, D. Field investigation on the first bridge deck slab reinforced with glass FRP bars constructed in Canada. J. Compos. Constr. 2005, 9, 470–479. [Google Scholar] [CrossRef]
  6. Tobbi, H.; Farghaly, A.S.; Benmokrane, B. Concrete columns reinforced longitudinally and transversally with glass fiber-reinforced polymer bars. ACI Struct. J. 2012, 109, 551–558. [Google Scholar]
  7. Mohamed, N.; Farghaly, A.S.; Benmokrane, B.; Neale, K.W. Experimental investigation of concrete shear walls reinforced with glass fiber-reinforced bars under lateral cyclic loading. J. Compos. Constr. 2014, 18, A4014001. [Google Scholar] [CrossRef]
  8. Yamakawa, T.; Fujisaki, T. A study on elasto-plastic behavior of structural walls reinforced by CFRP grids. In Proceedings of the Second International RILEM Symposium (FRPRCS-2), Ghent, Belgium, 23–25 August 1995; pp. 306–313. [Google Scholar]
  9. McCormick, J.; Tyber, J.; DesRoches, R.; Gall, K.; Maier, H.J. Structural engineering with NiTi. II: Mechanical behavior and scaling. J. Eng. Mech. 2007, 133, 1019–1029. [Google Scholar]
  10. Meshaly, M.E.; Youssef, M.A.; Abou Elfath, H.M. Use of SMA Bars to Enhance the Seismic Performance of SMA Braced RC Frames. Earthq. Struct. 2014, 6, 267–280. [Google Scholar] [CrossRef]
  11. Araki, Y.; Shrestha, K.C.; Maekawa, N.; Koetaka, Y.; Omori, T.; Kainuma, R. Shaking table tests of steel frame with superelastic Cu-Al-Mn SMA tension braces. Earthq. Eng. Struct. Dyn. 2016, 45, 297–314. [Google Scholar] [CrossRef]
  12. Qiu, C.; Zhu, S. Shake table test and numerical study of self-centering steel frame with SMA braces. Earthq. Eng. Struct. Dyn. 2017, 46, 117–137. [Google Scholar] [CrossRef]
  13. Sultana, P.; Youssef, M.A. Seismic performance of modular steel frames equipped with shape memory alloy braces. Bull. Earthq. Eng. 2018, 16, 5503–5527. [Google Scholar] [CrossRef]
  14. Youssef, M.A.; Alam, M.S.; Nehdi, M. Experimental investigation on the seismic behaviour of beam-column joints reinforced with superelastic shape memory alloys. J. Earthq. Eng. 2008, 12, 1205–1222. [Google Scholar] [CrossRef]
  15. Saiidi, M.S.; Sadrossadat-Zadeh, M.; Ayoub, C.; Itani, A. Pilot study of behavior of concrete beams reinforced with shape memory alloys. J. Mater. Civ. Eng. 2007, 19, 454–461. [Google Scholar] [CrossRef]
  16. Tazarv, M.; Saiidi, M.S. Analytical studies of the seismic performance of a full-scale SMA-reinforced bridge column. Int. J. Bridge Eng. 2013, 1, 37–50. [Google Scholar]
  17. Abdulridha, A. Performance of Superelastic Shape Memory Alloy Reinforced Concrete Elements Subjected to Monotonic and Cyclic Loading. Ph.D. Thesis, University of Ottawa, Ottawa, ON, Canada, 2012. [Google Scholar]
  18. Abraik, E.; Youssef, M.A. Cyclic performance of shape memory alloy reinforced concrete walls 2015. In Response of Structures under Extreme Loading, In Proceedings of the Fifth International Workshop on Performance, Protection, and Strength of Structures under Extreme Loading, Lansing, MI, USA, 28–30 June 2015; pp. 326–333.
  19. Abraik, E.; Youssef, M.A. Ductility and overstrength of shape-memory-alloy reinforced-concrete shear walls. Eng. Struct. 2021, 239, 112236. [Google Scholar] [CrossRef]
  20. Abraik, E.; Youssef, M.A. Seismic Fragility assessment of superelastic shape memory alloy reinforced concrete shear walls. J. Build. Eng. 2018, 19, 142–153. [Google Scholar] [CrossRef]
  21. Zafar, A.; Andrawes, B. Incremental dynamic analysis of concrete moment resisting frames reinforced with shape memory composite bars. J. Smart Mater. Struct. 2012, 21, 025013. [Google Scholar] [CrossRef]
  22. Zafar, A.; Andrawes, B. Experimental flexural behavior of SMA-FRP reinforced concrete beam. Front. Struct. Civ. Eng. 2013, 7, 341–355. [Google Scholar] [CrossRef]
  23. Zafar, A.; Andrawes, B. Fabrication and cyclic behavior of highly ductile superelastic shape memory composites. J. Mater. Civ. Eng. 2014, 26, 622–632. [Google Scholar] [CrossRef]
  24. Zafar, A.; Andrawes, B. Seismic behavior of SMA-FRP reinforced concrete frames under sequential seismic hazard. Eng. Struct. 2015, 98, 163–173. [Google Scholar] [CrossRef]
  25. NBCC. The National Building Code of Canada; National Research Council: Ottawa, ON, Canada, 2015. [Google Scholar]
  26. CSA A23. 3. Design of Concrete Structures; Canadian Standards Association: Mississauga, ON, Canada, 2014. [Google Scholar]
  27. OpenSees. Open System for Earthquake Engineering Simulation; University of California at Berkeley: Berkeley, CA, USA, 2018. [Google Scholar]
  28. ASCE 41. Seismic Rehabilitation of Existing Buildings; American Society of Civil Engineers: Reston, VA, USA, 2006. [Google Scholar]
  29. Menegotto, M.; Pinto, P.E. Method of analysis of cyclically loaded RC plane frames including changes in geometry and non-elastic behavior of elements under normal force and bending. In Symposium on the Resistance and Ultimate Deformability of Structures Acted on by Well Defined Repeated Loads; International Association for Bridge and Structural Engineering: Zurich, Switzerland, 1973; pp. 15–22. [Google Scholar]
  30. Mander, J.B.; Priestley, M.J.; Park, R. Theoretical stress-strain model for confined concrete. J. Struct. Eng. ASCE 1988, 114, 1804–1826. [Google Scholar] [CrossRef] [Green Version]
  31. Kowalsky, M.J. Deformation limit states for circular reinforced concrete bridge columns. J. Struct. Eng. 2000, 126, 869–878. [Google Scholar] [CrossRef]
  32. Sharbatdar, M.K.; Saatcioglu, M. Seismic Design of FRP Reinforced Concrete Structures. Asian J. Appl. Sci. 2009, 2, 211–222. [Google Scholar]
  33. Hurlebaus, S.; Gaul, L. Smart structure dynamics. Mech. Syst. Signal Process. 2006, 20, 255–281. [Google Scholar] [CrossRef]
  34. Henry, R.; Sritharan, S.; Ingham, J. Residual drift analyses of realistic self-centering concrete wall systems. Earthq. Struct. 2016, 10, 409–428. [Google Scholar] [CrossRef]
  35. McCormick, J.; Aburano, H.; Ikenaga, M.; Nakashima, M. Permissible residual deformation level for building structures considering both safety and human elements. In Proceedings of the 14th World Conference on Earthquake Engineering, Beijing, China, 12–17 October 2008. [Google Scholar]
  36. Priestley, M.J.N.; Calvi, G.M.; Kowalsky, M.J. Direct displacement-based seismic design of structures. In Proceedings of the Performance by Design—Can We Predict It, New Zealand Society for Earthquake Engineering (NZSEE) Conference, Palmerston North, New Zealand, 30 March–1 April 2007. [Google Scholar]
  37. ASCE 7. Minimum Design Loads for Buildings and Other Structures; ASCE/SEI 7: Reston, VA, USA, 2016. [Google Scholar]
Figure 1. 10-story reference steel RC shear wall (dimensions in mm): (a) wall elevation; (b) wall cross-section.
Sustainability 14 00712 g001
Figure 2. Reinforcement type and location for the hybrid walls. (a) W1 (Steel RC Wall); (b) W2 (SMA RC Wall); (c) W3 (Composite RC Wall); (d) W4 (SMA RC Wall); (e) W5 (Composite RC Wall); (f) W6 (Composite RC Wall).
Sustainability 14 00712 g002
Figure 3. Reinforcement details. (a) W2, W3, and W6; (b) W4 and W5.
Sustainability 14 00712 g003
Figure 4. Numerical model. (a) displacement beam-column model; (b) material models.
Sustainability 14 00712 g004
Figure 5. Numerical Model Validation. (a) steel RC wall; (b) SMA RC wall.
Sustainability 14 00712 g005
Figure 6. Effect of axial load ratio: (a) W1; (b) W2; (c) W3; (d) W4; (e) W5; (f) W6.
Sustainability 14 00712 g006
Figure 7. Effect of boundary element length: (a) W1; (b) W2; (c) W3; (d) W4; (e) W5; (f) W6.
Sustainability 14 00712 g007
Figure 8. Effect of boundary reinforcement ratio: (a) W1; (b) W2; (c) W3; (d) W4; (e) W5; (f) W6.
Sustainability 14 00712 g008
Figure 9. Effect of web reinforcement ratio: (a) W1; (b) W2; (c) W3; (d) W4; (e) W5; (f) W6.
Sustainability 14 00712 g009
Figure 10. Response spectra for selected ground motions and target response spectra. (a) 10% in 50; (b) 2% in 50.
Sustainability 14 00712 g010
Figure 11. Lateral displacements at 10% in 50 y.
Sustainability 14 00712 g011
Figure 12. Lateral displacements at 2% in 50 y.
Sustainability 14 00712 g012
Figure 13. Residual displacements at 10% in 50 y.
Sustainability 14 00712 g013
Figure 14. Residual displacements at 2% in 50 y.
Sustainability 14 00712 g014
Figure 15. Floor acceleration: (a) 10% in 50 y; (b) 2% in 50 y.
Sustainability 14 00712 g015
Figure 16. Internal actions for 10% in 50 y: (a) shear forces; (b) bending moments.
Sustainability 14 00712 g016
Figure 17. Internal actions for 2% at 50 y: (a) shear forces; (b) bending moments.
Sustainability 14 00712 g017
Figure 18. Maximum reinforcement strain. (a) 10% in 50 y; (b) 2% in 50 y.
Sustainability 14 00712 g018
Figure 19. Maximum strain in confined concrete. (a) 10% in 50 y; (b) 2% in 50 y.
Sustainability 14 00712 g019
Figure 20. Strains history considering Eq2C1 of the 2% in 50 y seismic events. (a) SMA bars; (b) composite bars.
Sustainability 14 00712 g020
Figure 21. Average maximum strains. (a) reinforcement; (b) concrete.
Sustainability 14 00712 g021
Figure 22. Distribution of average reinforcement strains along the height. (a) 10% in 50 y; (b) 2% in 50 y.
Sustainability 14 00712 g022
Table 1. Properties of SMA bars.
MaterialParameterValue [17]
Ni–Ti SMA
(55.9% Nickel and 44.1% Titanium)
Austenite to Martensite start stress, f y SMA (MPa) 380
Austenite modulus, K 1 (MPa)36,459
Martensite modulus, K 2 (MPa)365
Recoverable strain7%
Austenite to Martensite finish stress (MPa)520
Martensite to Austenite start stress (MPa)209
Martensite to Austenite finish stress (MPa)170
Table 2. Properties of composite bars.
MaterialParameterValue [21]
FPRModulus of elasticity ( E FRP )86.7 GPa
Rupture strain3.0%
ResinModulus of elasticity1.57 GPa
Yield stress32.0 MPa
SMA Modulus of elasticity65.0 GPa
Austenite to Martensite start stress500 MPa
Austenite to Martensite finish stress510 MPa
Martensite to Austenite start stress135 MPa
Martensite to Austenite finish stress145 MPa
Table 3. Details of Validation Walls.
Wall h w   ( m m ) L w   ( m m ) b w   ( m m ) f c   ( M P a ) f y   ( M P a ) ρ v b ρ v w = ρ h w
Steel RC wall [17]2200100015030425
380
1.330.88
SMA RC wall [17]1.68
Table 4. Parametric study cases.
CaseAxial Load Ratio (%)Boundary Length (mm)Boundary Reinforcement Ratio (%)Web Reinforcement Ratio (%)
105001.280.25
2105001.280.25
3155001.280.25
4106001.280.25
5107001.280.25
6105001.280.25
7105001.280.40
8105001.281.00
9105001.500.25
10105002.000.25
Table 5. Selected ground motions.
Hazard LevelEarthquake (Eq) with Components C1 and C2StationMagnitudeScale
10% in 50 y1. Northridge-01LA - Baldwin Hills6.690.73
2. Northridge-01bLA - W 15th St6.690.94
3. Chuetsu-oki, JapanSanjo Shinbori6.800.39
4. Chuetsu-oki, Japan(b)Niigata Nishi Kaba District6.800.78
5. El Mayor-Cucapah, MexicoCalexico Fire Station7.200.41
6. Darfield, New ZealandRKAC7.001.01
7. El Mayor-Cucapah, MexicoWestside School7.200.35
2% in 50 y8. Imperial Valley-06El Centro Array #16.532.98
9. Imperial Valley-06El Centro Array #126.531.88
10. Imperial Valley-06El Centro Array #136.532.40
11. Northridge-01LA - Baldwin Hills6.691.50
12. Northridge-01LA - W 15th St6.691.96
13. Chuetsu-oki, JapanHinodecho Yoshida 6.801.72
14. ElMayor-Cucapah, MexicoCalexico Fire Station7.200.85
Table 6. MID and MRID values.
WallSeismic RiskMID (%)MRID (%)
MEAN84%MEAN84%
W110% in 50 y0.670.800.070.14
2% in 50 y1.702.480.330.43
W210% in 50 y0.701.040.040.11
2% in 50 y2.293.590.240.38
W310% in 50 y0.630.870.020.04
2% in 50 y2.403.400.200.34
W410% in 50 y0.640.840.030.05
2% in 50 y2.553.270.230.29
W510% in 50 y0.640.850.030.05
2% in 50 y2.453.360.080.13
W610% in 50 y0.570.710.0130.03
2% in 50 y2.293.330.200.40
Publisher’s Note: MDPI stays neutral with regard to jurisdictional claims in published maps and institutional affiliations.

