Article

How to Use Live Streaming to Improve Consumer Purchase Intentions: Evidence from China

1
School of Economics and Management, Beijing University of Posts and Telecommunications, Beijing 100876, China
2
Department of Digital Communication, Soochow University, Suzhou 215123, China
*
Author to whom correspondence should be addressed.
Sustainability 2022, 14(2), 1045; https://doi.org/10.3390/su14021045
Submission received: 29 December 2021 / Revised: 7 January 2022 / Accepted: 13 January 2022 / Published: 17 January 2022

Abstract

:
As a new business model, live-streaming commerce has great commercial value. This study used the stimulus–organism–response framework to explore the psychological mechanisms of how live peculiarities impact consumer behavioral responses as well as the effects of gender and platform differences, and to make clear how to choose the two dependent variables of engagement and purchase intentions. Using 454 valid questionnaires from consumers who had made purchases during live streaming, the authors employed partial least squares structural equation modeling to analysis the research model. The results suggest that interactivity, visualization, entertainment, and professionalization play considerable roles in consumer behavioral responses and that their psychological mechanisms are different. Male respondents are more satisfied with interactivity than females. E-commerce platforms are more interactive, visible and professional than social media platforms, and the trust mechanism of social media platforms is immature. If we use engagement to describe consumer behavioral responses of interactivity and purchase intentions to describe consumer behavioral responses of visualization, entertainment, and professionalization, this provides a basis for selecting the two dependent variables in live-streaming commerce. This study extends existing theoretical research on live-streaming commerce and provides some managerial implications for platforms, stores, and streamers.

1. Introduction

With the development of mobile communication technology, live streaming is being used for online shopping, leading to a new form of social commerce known as live-streaming commerce. In China, Alibaba first launched Taobao Live in 2016 before ByteDance started e-commerce commercialization and launched TikTok Live in 2018. Subsequently, live-streaming commerce began to boom in China. According to a research report on the Chinese live-streaming commerce industry in 2021 released by IResearch [1], the market size of Chinese live-streaming commerce in 2020 exceeded 1.2 trillion RMB, with an annual growth rate of 197.0%, and the scale in 2023 would exceed 4.9 trillion RMB. Due to its considerable commercial value, live-streaming commerce merits in-depth research.
Previous studies on live-streaming commerce have focused mainly on (1) the motivations of viewers, such as social interactivity, information gathering, and entertainment [2,3]; (2) psychological mechanisms such as trust [4], perceived value [5], immersion, presence [6], arousal and cognitive assimilation [7]; (3) characteristics such as interactivity [8,9]; (4) factors affecting purchase intentions such as information quality, interactivity quality [10], IT affordances [6], and social status display [11]; (5) factors impacting continuous watching intentions, including interactivity and humor appeal [11]; and (6) factors impacting consumer engagement, including relational bonds [12]. Besides interactivity, live-streaming commerce also has other peculiarities, such as visualization, entertainment, and professionalization, and the psychological mechanisms of how these live peculiarities impact on purchase intentions are still unclear.
Compared with social commerce, live-streaming commerce has four live peculiarities: interactivity [8,9], visualization [5,13], entertainment [5,14], and professionalization [15]. A streamer can interact with consumers through virtual face-to-face communication based on live streaming [8,9], can display a product in all directions, even try-ons [8], can organize some interesting activities, such as prize draws and cash voucher grabbing [5], and can provide many professional introductions. Therefore, live-streaming commerce greatly reduces the uncertainty in online shopping and helps improve consumer purchase intentions.
Research on the psychological mechanisms of live-streaming commerce are mainly based on a single inner state, such as social presence [6], psychological distance [8], or trust [4]. Social presence shortens the psychological distance between buyer and seller and, in doing so, increases trust in online shopping [16]. There may also be some correlations among these psychological states in the live-streaming commerce context. And the psychological mechanisms of the four live peculiarities on purchase intentions may be different.
Some scholars use engagement to describe consumer behavioral responses in live-streaming commerce [5,8,9], while others use purchase intentions [6,10,17]. Few studies have examined the relationship between engagement and purchase intentions and it’s not clear how to choose these two dependent variables, engagement and purchase intentions.
To fill these gaps, we took the stimulus–organism–response framework (SOR) as our theoretical framework and explored how live peculiarities (interactivity, visualization, entertainment, and professionalization) impact purchase intentions by social presence, psychological distance, and trust, and examined the effects of gender and platform differences. Additionally, we also compared engagement and purchase intentions. The results suggest that live peculiarities play considerable roles on consumer behavioral responses, and their psychological mechanisms are different. This study enriches the research on the characteristics and psychological mechanisms of live-streaming commerce and provides a basis for selecting two dependent variables we can use to describe consumer behavioral responses in future research on the subject.
The remainder of the paper is organized as follows: Section 2 gives a literature review, Section 3 provides the theoretical framework and hypotheses, Section 4 describes the methodology and study design, Section 5 shows the results and the final section presents the discussion.

2. Literature Review

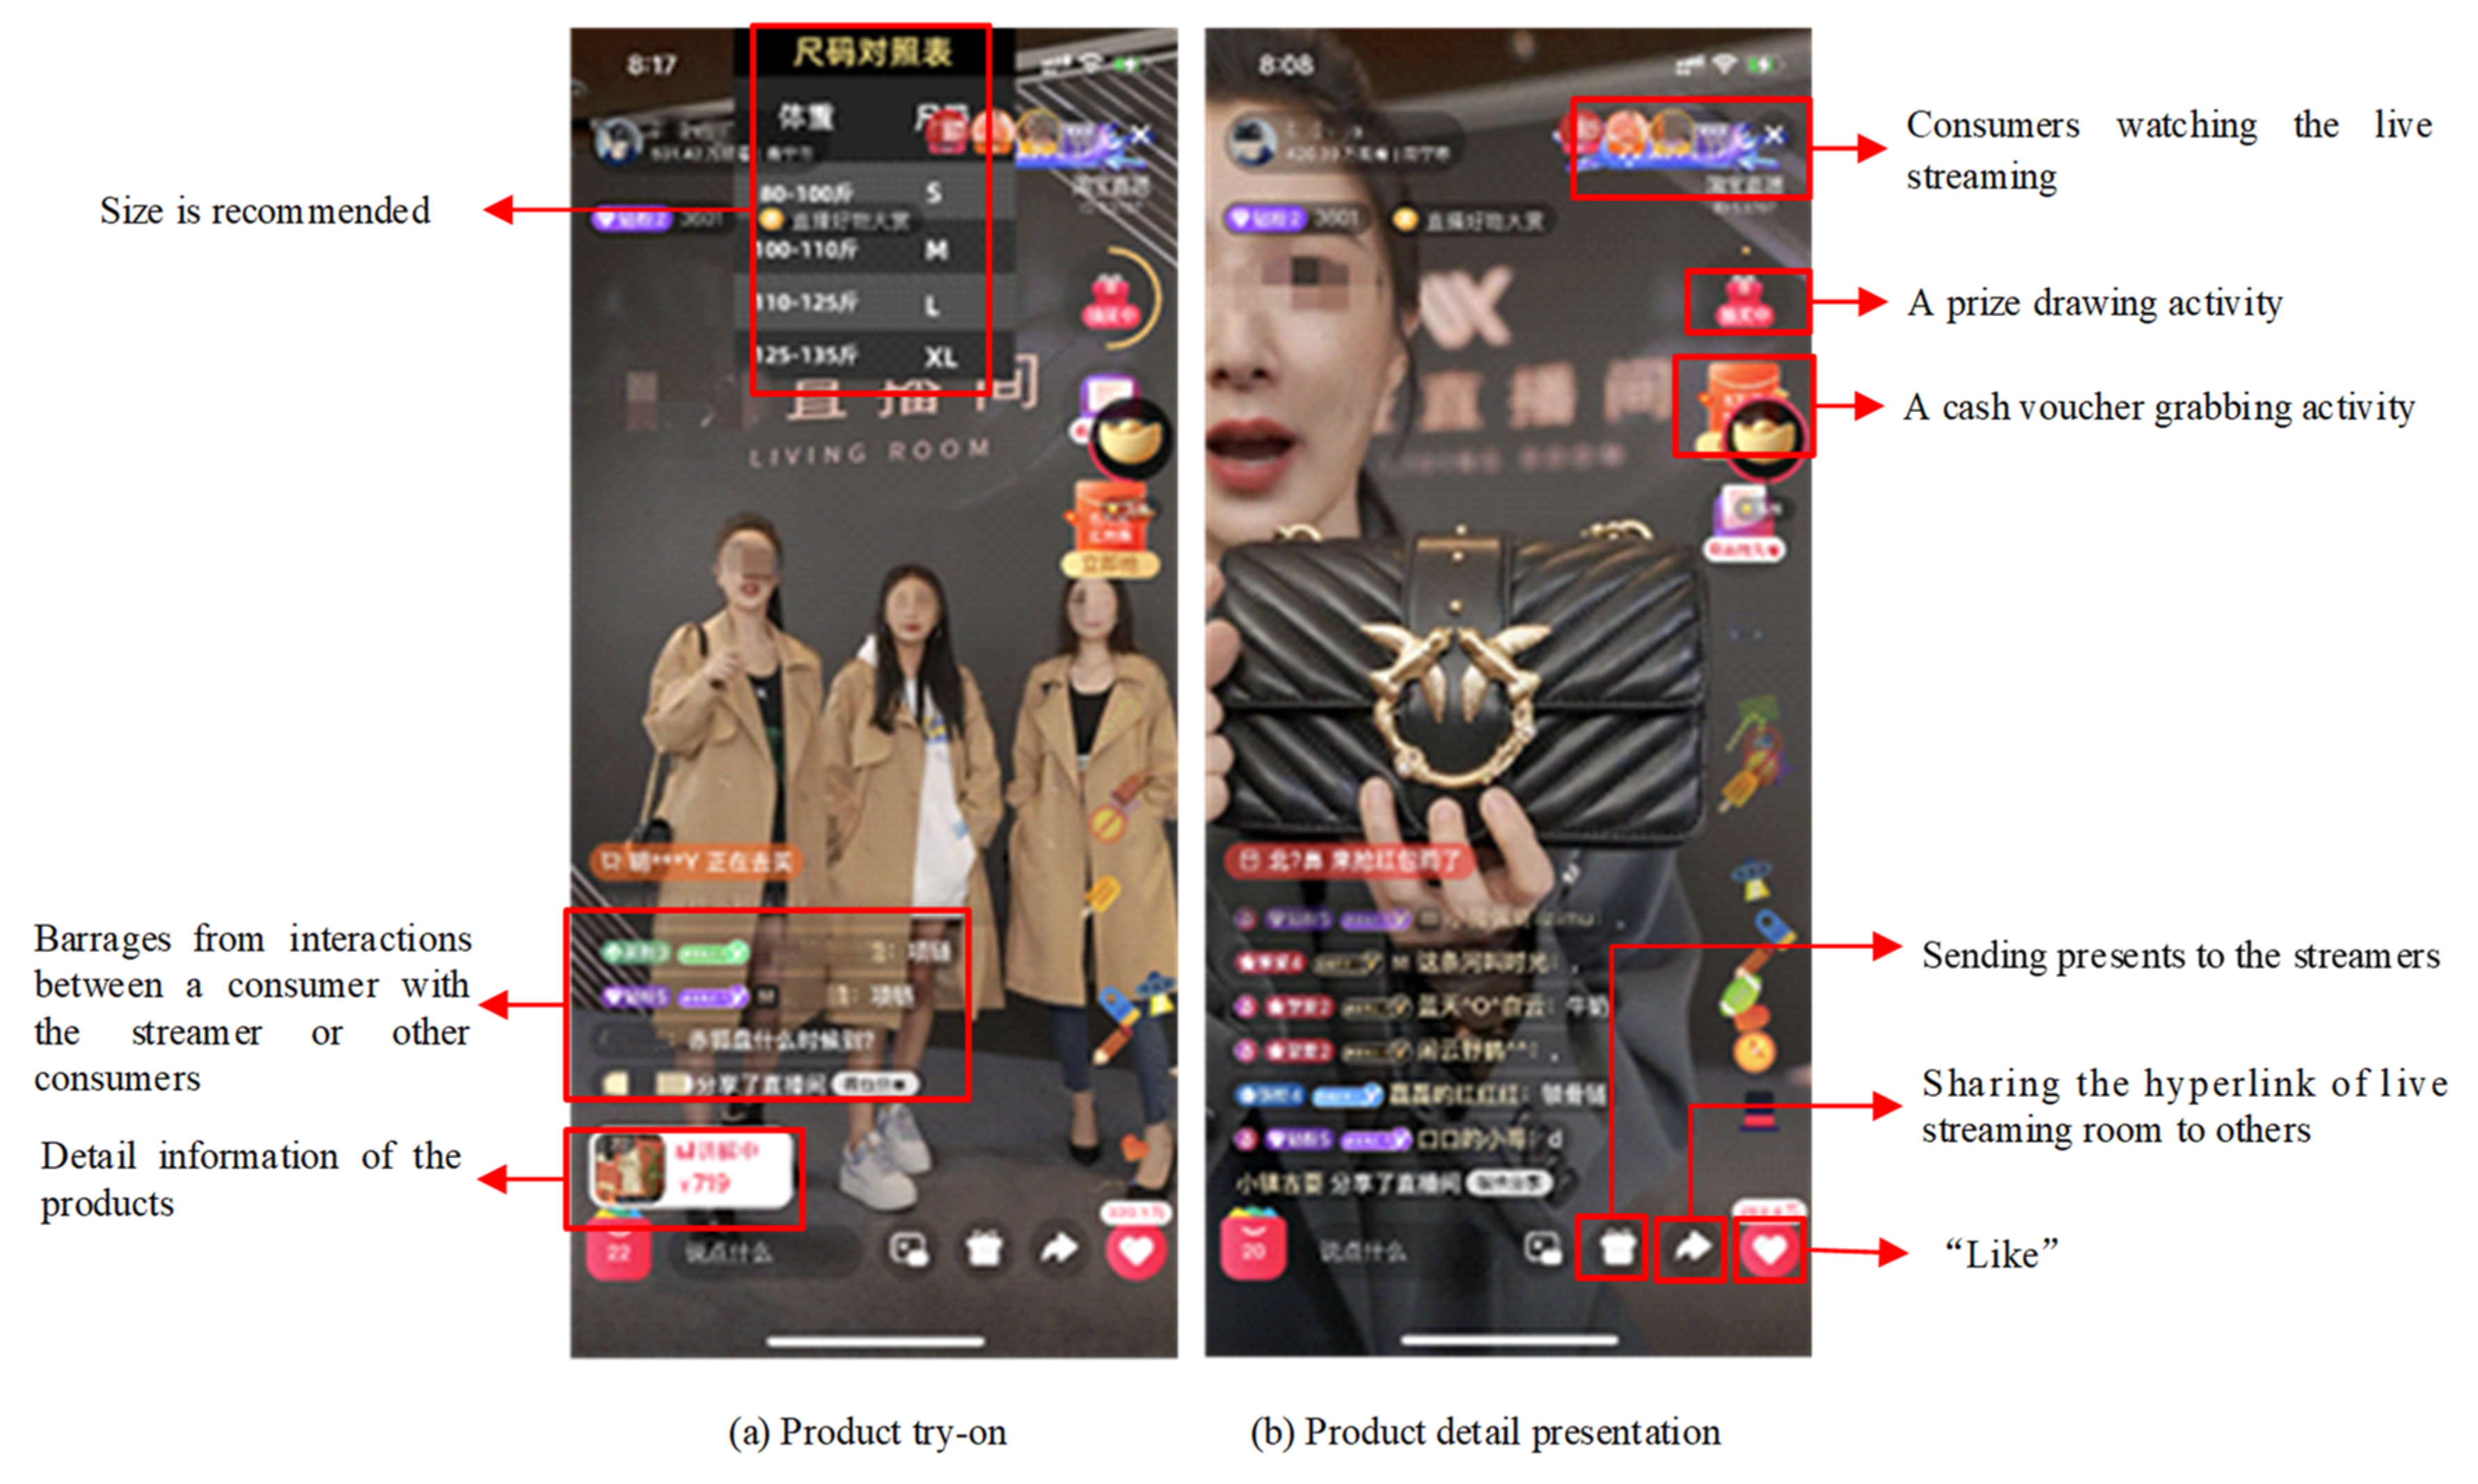
2.1. Live-Streaming Commerce

With the rapid development of mobile communication technology, live-streaming commerce has emerged in recent years as a new business model, consisting of “live streaming + social + e-commerce”. Traditional e-commerce has been enabled by Web 1.0 technology, which allows for one-to-one interaction, while social commerce has been enabled by Web 2.0 technology, which allows for many-to-many interaction, and live-streaming commerce enabled by Web 3.0 technology, which allows for real-time multidimensional interaction [18]. Interactivity is significantly improved in live-streaming commerce [8,9]. In addition, visualization [5,13], entertainment [5,14], and professionalization [15] have been greatly improved. Some screenshots of a live streaming studio are shown in Figure 1. The streamer shows various details of his or her products to consumers by means of strategic explanations, such as try-ons. When watching live streaming, consumers can interact with the streamer, draw prizes, and grab cash vouchers.

2.2. Stimulus–Organism–Response Framework

Under the SOR framework, an external environmental stimulus (S) impacts the internal state of a consumer (O) and subsequently influences his or her behavioral responses (R) while shopping online [8,9]. Xue applied the SOR framework to conceptualize interactivity as a stimulus, perceived usefulness, psychological distance, and perceived risk as internal states, and social commerce engagement as a response in social commerce [8]. Kang employed the SOR framework to explore the dynamic effect of interactivity on customer engagement behaviors through tie strength in live-streaming commerce platforms [9]. Therefore, the SOR framework offers a structured method for testing the impact of live peculiarities as external environmental stimuli on customer behavioral responses. In this study, social presence, psychological distance, and trust were selected to assess the internal states of consumers, and engagement and purchase intentions were selected to assess their responses. By structuring a causal relationship among stimuli, organisms, and responses, a systematic framework was provided to trace the impact of live peculiarities on purchase intentions.

2.2.1. Live Peculiarities as Environmental Stimuli (S)

Media richness theory regards rich information as being more capable of reducing equivocality than lean information [19]. Currently, live-streaming commerce, which provides real-time communication, text messages, voice, and video, possesses high media richness [20]. Compared with social commerce, live-streaming commerce is more interactive [8,9,21], visual [5,13], entertaining [5,14] and professional [15]. Therefore, this study adopted four live peculiarities, namely, interactivity, visualization, entertainment, and professionalization, as external stimuli.

2.2.2. Cognitive and Affective Factors as Inner States of the Organism (O)

The SOR framework demonstrates that the effect of environmental stimuli on customer behavioral responses is mediated through virtual experiences [8]. Trust is widely used as an internal state to impact purchase intentions in e-commerce [18,22]. Compared with traditional e-commerce, frequent interactions shorten the social distance between customers and sellers [8,9]. Social presence has been used to quantify the cognitive state of consumers in live-streaming commerce [17]. Therefore, we utilized social presence, psychological distance and trust to measure the cognitive and affective states of consumers in live-streaming commerce.

2.2.3. Engagement and Purchase Intentions as Behavioral Responses (R)

Engagement has been widely used in social commerce to conceptualize consumer behavioral responses [23,24,25]. In live-streaming commerce, some scholars employ engagement to describe consumer behavioral responses [5,8,9], while others employ purchase intentions [6,10,17]. In this study, both engagement and purchase intentions were employed to describe consumer behavioral responses. To explore how to choose these two dependent variables, engagement and purchase intentions, we assumed that engagement positively affects purchase intentions.

3. Hypothesis Development

3.1. Effect of Live Peculiarities

3.1.1. Effect of Interactivity

Like social commerce, live-streaming commerce is famous for its interactivity. Interactivity refers to the intensity and the richness of the interaction that occurs in the mutual communication between two parties [9]. In live-streaming commerce, a consumer can interact with a streamer and other consumers, and this interaction takes place in real time. Xue showed that interactivity impacts the consumer’s cognitive and affective state in social commerce [8]. Therefore, we proposed the following:
Hypothesis 1a (H1a). 
Interactivity positively affects social presence.
Hypothesis 2a (H2a). 
Interactivity negatively affects psychological distance.
Hypothesis 3a (H3a). 
Interactivity positively affects trust.

3.1.2. Effect of Visualization

Vision is one of the most important ways in which humans obtain information, and visual information processing has the obvious advantages of high speed, large capacity, and parallelism. In live streaming, a streamer can display a product in all directions including trying on the clothes in person [8], so that consumers can see the details of the product and even feel that they are there in person [5]. Therefore, we proposed the following:
Hypothesis 1b (H1b). 
Visualization positively affects social presence.
Hypothesis 2b (H2b). 
Visualization negatively affects psychological distance.
Hypothesis 3b (H3b). 
Visualization positively affects trust.

3.1.3. Effect of Entertainment

Entertainment is the degree to which an experience is fun, interesting, or pleasant [5,26]. In use and satisfaction theory, the value of entertainment lies in the ability to meet people’s needs for escapism, recreation, aesthetic enjoyment, or emotional release [27]. Previous studies have shown that entertainment has a significant effect on tourist trust [28] and social media brand trust [29]. In live streaming, merely watching the streamers wearing and showing clothes can be enjoyable, and the viewing experience is almost like being at a fashion show. Sometimes, live streaming studios organize prize drawings, give out cash vouchers, and run flash sales in limited batches to attract consumers [8]. If consumers are among the lucky ones, they will feel that they obtained a real bargain. Indeed, the pleasure derived from such bargain hunting is one of the reasons people shop online [5]. Therefore, we proposed the following:
Hypothesis 1c (H1c). 
Entertainment positively affects social presence.
Hypothesis 2c (H2c). 
Entertainment negatively affects psychological distance.
Hypothesis 3c (H3c). 
Entertainment positively affects trust.

3.1.4. Effect of Professionalization

Professionalization refers to the extent to which a streamer provides correct and effective knowledge or experience. Biswas found that experts have a strong effect on reducing consumers’ perceived risk regarding high-technology-oriented products [30]. In live streaming, the streamer usually provides many professional introductions to products. Professionalization can provide consumers with rich and reliable information, which can make them identify with the streamer, thus enhancing trust [15]. Therefore, we proposed the following:
Hypothesis 1d (H1d). 
Professionalization positively affects social presence.
Hypothesis 2d (H2d). 
Professionalization negatively affects psychological distance.
Hypothesis 3d (H3d). 
Professionalization positively affects trust.

3.2. Mediating Role of Social Presence

Social presence originated from social presence theory, which was first proposed by Short in information system research [31], and it is a critical attribute in mediating communication media. Subsequently, it was introduced into e-education and e-commerce [16,32]. Recently, scholars have attempted to apply social presence theory to live-streaming commerce. Social presence refers to the degree of salience of another person in interactivity and the consequent salience of the interpersonal relationship. In live streaming, the streamer and consumers are in constant discussion, form a small online community, feel each other’s presence, arouse emotional reactions, and gradually build social relations. Social presence enhances when streamers acknowledge the presence of consumers by mentioning them while live streaming [33] and has a positive influence on live streaming shopping intentions [6,17]. Therefore, we proposed the following:
Hypothesis 4 (H4). 
Social presence mediates the effect of live peculiarities (interactivity, visualization, entertainment, and professionalization) on purchase intentions.

3.3. Mediating Role of Psychological Distance

According to construal level theory, psychological distance refers to the extent to which individuals mentally construe a target item, event, or concept as distant from themselves at that moment [34]. Compared with traditional e-commerce, frequent interactivity shortens the social distance between customers and sellers in social commerce [35]. Social distance impacts judgments of physical distance [36]. Psychological distance negatively impacts customer online purchase intentions [37] and mediates the effect of interactivity on social commerce engagement [8]. Therefore, we proposed the following:
Hypothesis 5 (H5). 
Psychological distance mediates the effect of live peculiarities (interactivity, visualization, entertainment, and professionalization) on purchase intentions.
Hypothesis 6 (H6). 
Psychological distance mediates the effect of social presence on trust.

3.4. Mediating Role of Trust

In e-commerce, the temporal and spatial separation of transaction partners leads to a lack of face-to-face interactivity between a customer and a seller/product, which makes lack of trust a key reason behind consumers’ reluctance to purchase online [5,38]. In mobile commerce, trust has a significant relationship with behavioral intentions [22]. In social commerce, communication positively impacts consumer trust [39] and trust strongly correlates with consumer behaviors [18]. In live streaming, trust positively impacts purchase intentions [4,5]. Therefore, we propose the following:
Hypothesis 7 (H7). 
Trust mediates the effect of live peculiarities (interactivity, visualization, entertainment, and professionalization) on purchase intentions.
Hypothesis 8a (H8a). 
Trust mediates the effect of social presence on purchase intentions.
Hypothesis 8b (H8b). 
Trust mediates the effect of psychological distance on purchase intentions.

3.5. Mediating Role of Engagement
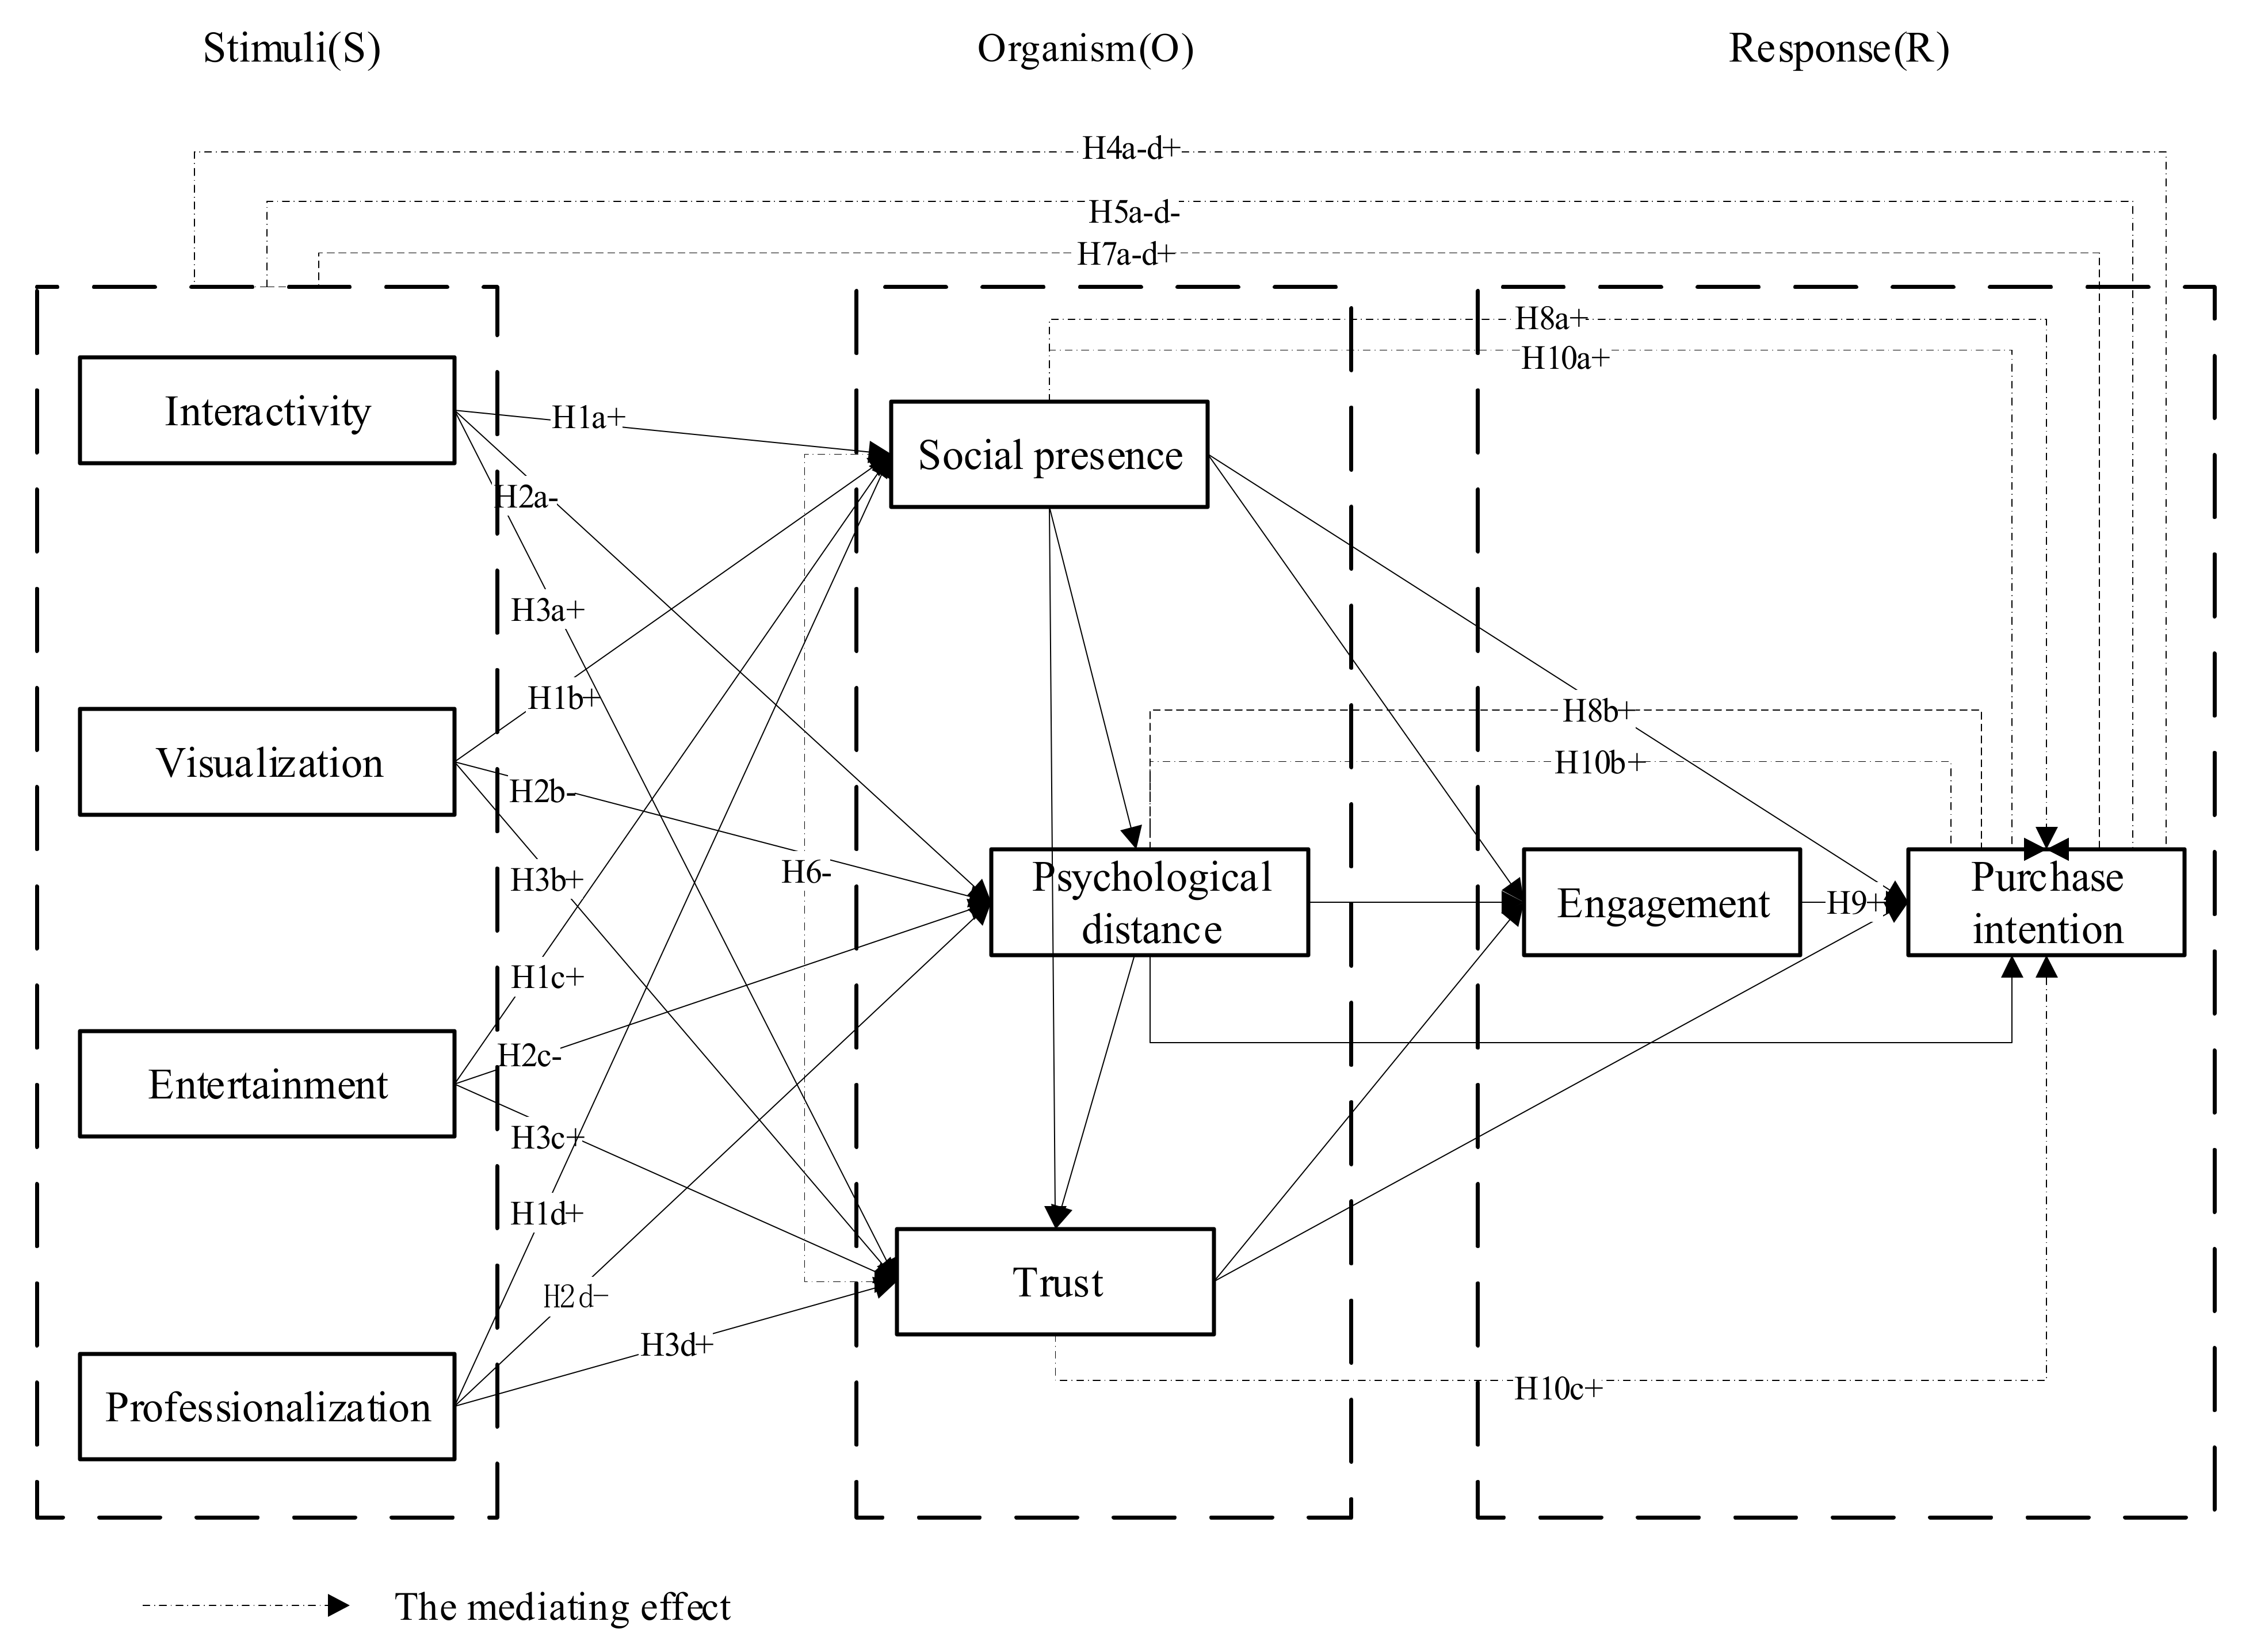
Engagement refers to the behavioral manifestations that represent the level of users’ investment, participation, and efforts [8]. In recent years, engagement has been widely used in social commerce as a vital factor in predicting and explaining consumer behaviors [25,40]. Previous studies have proved that social presence [24], psychological distance [8], and trust [5,25] affect social commerce engagement. In live-streaming commerce, some scholars use engagement to describe consumer behavior responses [5,8,9], while others use purchase intentions [6,10,17]. Social commerce information sharing activities increase the intention to buy [40]. Therefore, we proposed the following:
Hypothesis 9 (H9). 
Engagement positively affects purchase intentions.
Hypothesis 10a (H10a). 
Engagement mediates the effect of social presence on purchase intentions.
Hypothesis 10b (H10b). 
Engagement mediates the effect of psychological distance on purchase intentions.
Hypothesis 10c (H10c). 
Engagement mediates the effect of trust on purchase intentions.

3.6. Research Model

The theoretical framework of this study is presented in Figure 2. Live peculiarities, including interactivity, visualization, entertainment, and professionalization, enhance engagement and purchase intentions by decreasing psychological distance and increasing social presence and trust. Psychological distance mediates the effect of social presence on trust. Engagement positively affects purchase intentions.

4. Method

4.1. Sample

Partial least squares structural equation modeling (PLS-SEM) was used as the method of analysis, as it is suitable for complex models (i.e., when the number of latent variables exceeds eight), exploratory research, and theory development [41,42]. As a popular rule of thumb for robust PLS-SEM estimations, Chin suggested using a minimum sample size of 10 times the maximum number of paths aiming at any construct in the measurement model and structural model [43]. Thus, the suggested minimum sample size for this study is 60.
In August 2021, 500 questionnaires were collected from a Chinese online questionnaire platform (https://www.wjx.cn (accessed 20 August 2021)) [4]. A screening question was employed to verify that the participants had made purchases while watching live streaming. The respondents were asked to recall their last watching experience and to then complete the questionnaire based on their states at the moment. To promote participation and obtain valid samples, we awarded each respondent 9 RMB. A respondent could submit a questionnaire only once. Therefore, we checked the identification of all the respondents and deleted duplicates. Finally, over a four-week period, we gathered 454 complete and valid responses, of which 213 were from males and 241 were from females. Most of the respondents were company employees (n = 423; 93.17%), were aged between 26 and 30 (n = 180; 39.65%), had a bachelor’s degree (n = 365, 80.40%), lived in a super first-tier city (n = 156; 34.36%), and spent between 501 and 1000 RMB on online shopping (n = 142; 31.28).

4.2. Measurements

The respondents were presented with a self-administered questionnaire that was written in Chinese. The original questionnaire was constructed in English, translated, and back-translated to guarantee the consistency of the original English scales and the Chinese scales. The multi-item scales used in this study were adapted based on a systematic review of relevant literature and adjusted to fit the current live-streaming commerce context. Some statements were fine-tuned based on the results of the pretest. After two rounds of pretesting, we obtained the final measurement items, as shown in Table 1. All the items were measured by a 7-point Likert scale ranging from “1 = strongly disagree” to “7 = strongly agree”.

5. Results

SmartPLS 3.3 software (Hamburg, Germany) was employed to conduct the PLS-SEM [52]. A two-step procedure was employed to estimate the measurement model and then the structural model. The former was used to test the reliability and validity of the measures, and the latter was used to assess the hypotheses.

5.1. Measurement Model

The measurement model was estimated by indicator loadings, composite reliability (CR), Cronbach’s alpha, and the average variance extracted (AVE) (see Table 2 for a summary). The indicator loadings are all above 0.7 and significant at the 0.001 level, indicating adequate internal reliability [43]. For all the latent variables, the CR is higher than 0.8, and the Cronbach’s alpha is higher than 0.7, indicating acceptable internal consistency [53].
The AVE was calculated to assess convergent validity. For all the factors, the AVE values are greater than 0.6, indicating that more than 60% of the variance in the indicators could be accounted for by the latent variables. Based on the suggested AVE value higher than 0.5 [54], our data are considered to have adequate validity.
To determine satisfactory discriminant validity based on the Fornell–Larcker criterion, each construct should be more highly correlated with its own construct than with other constructs. The results (see Table 3) show that the diagonal elements are greater than the off-diagonal elements, suggesting a reasonable degree of discriminant validity.

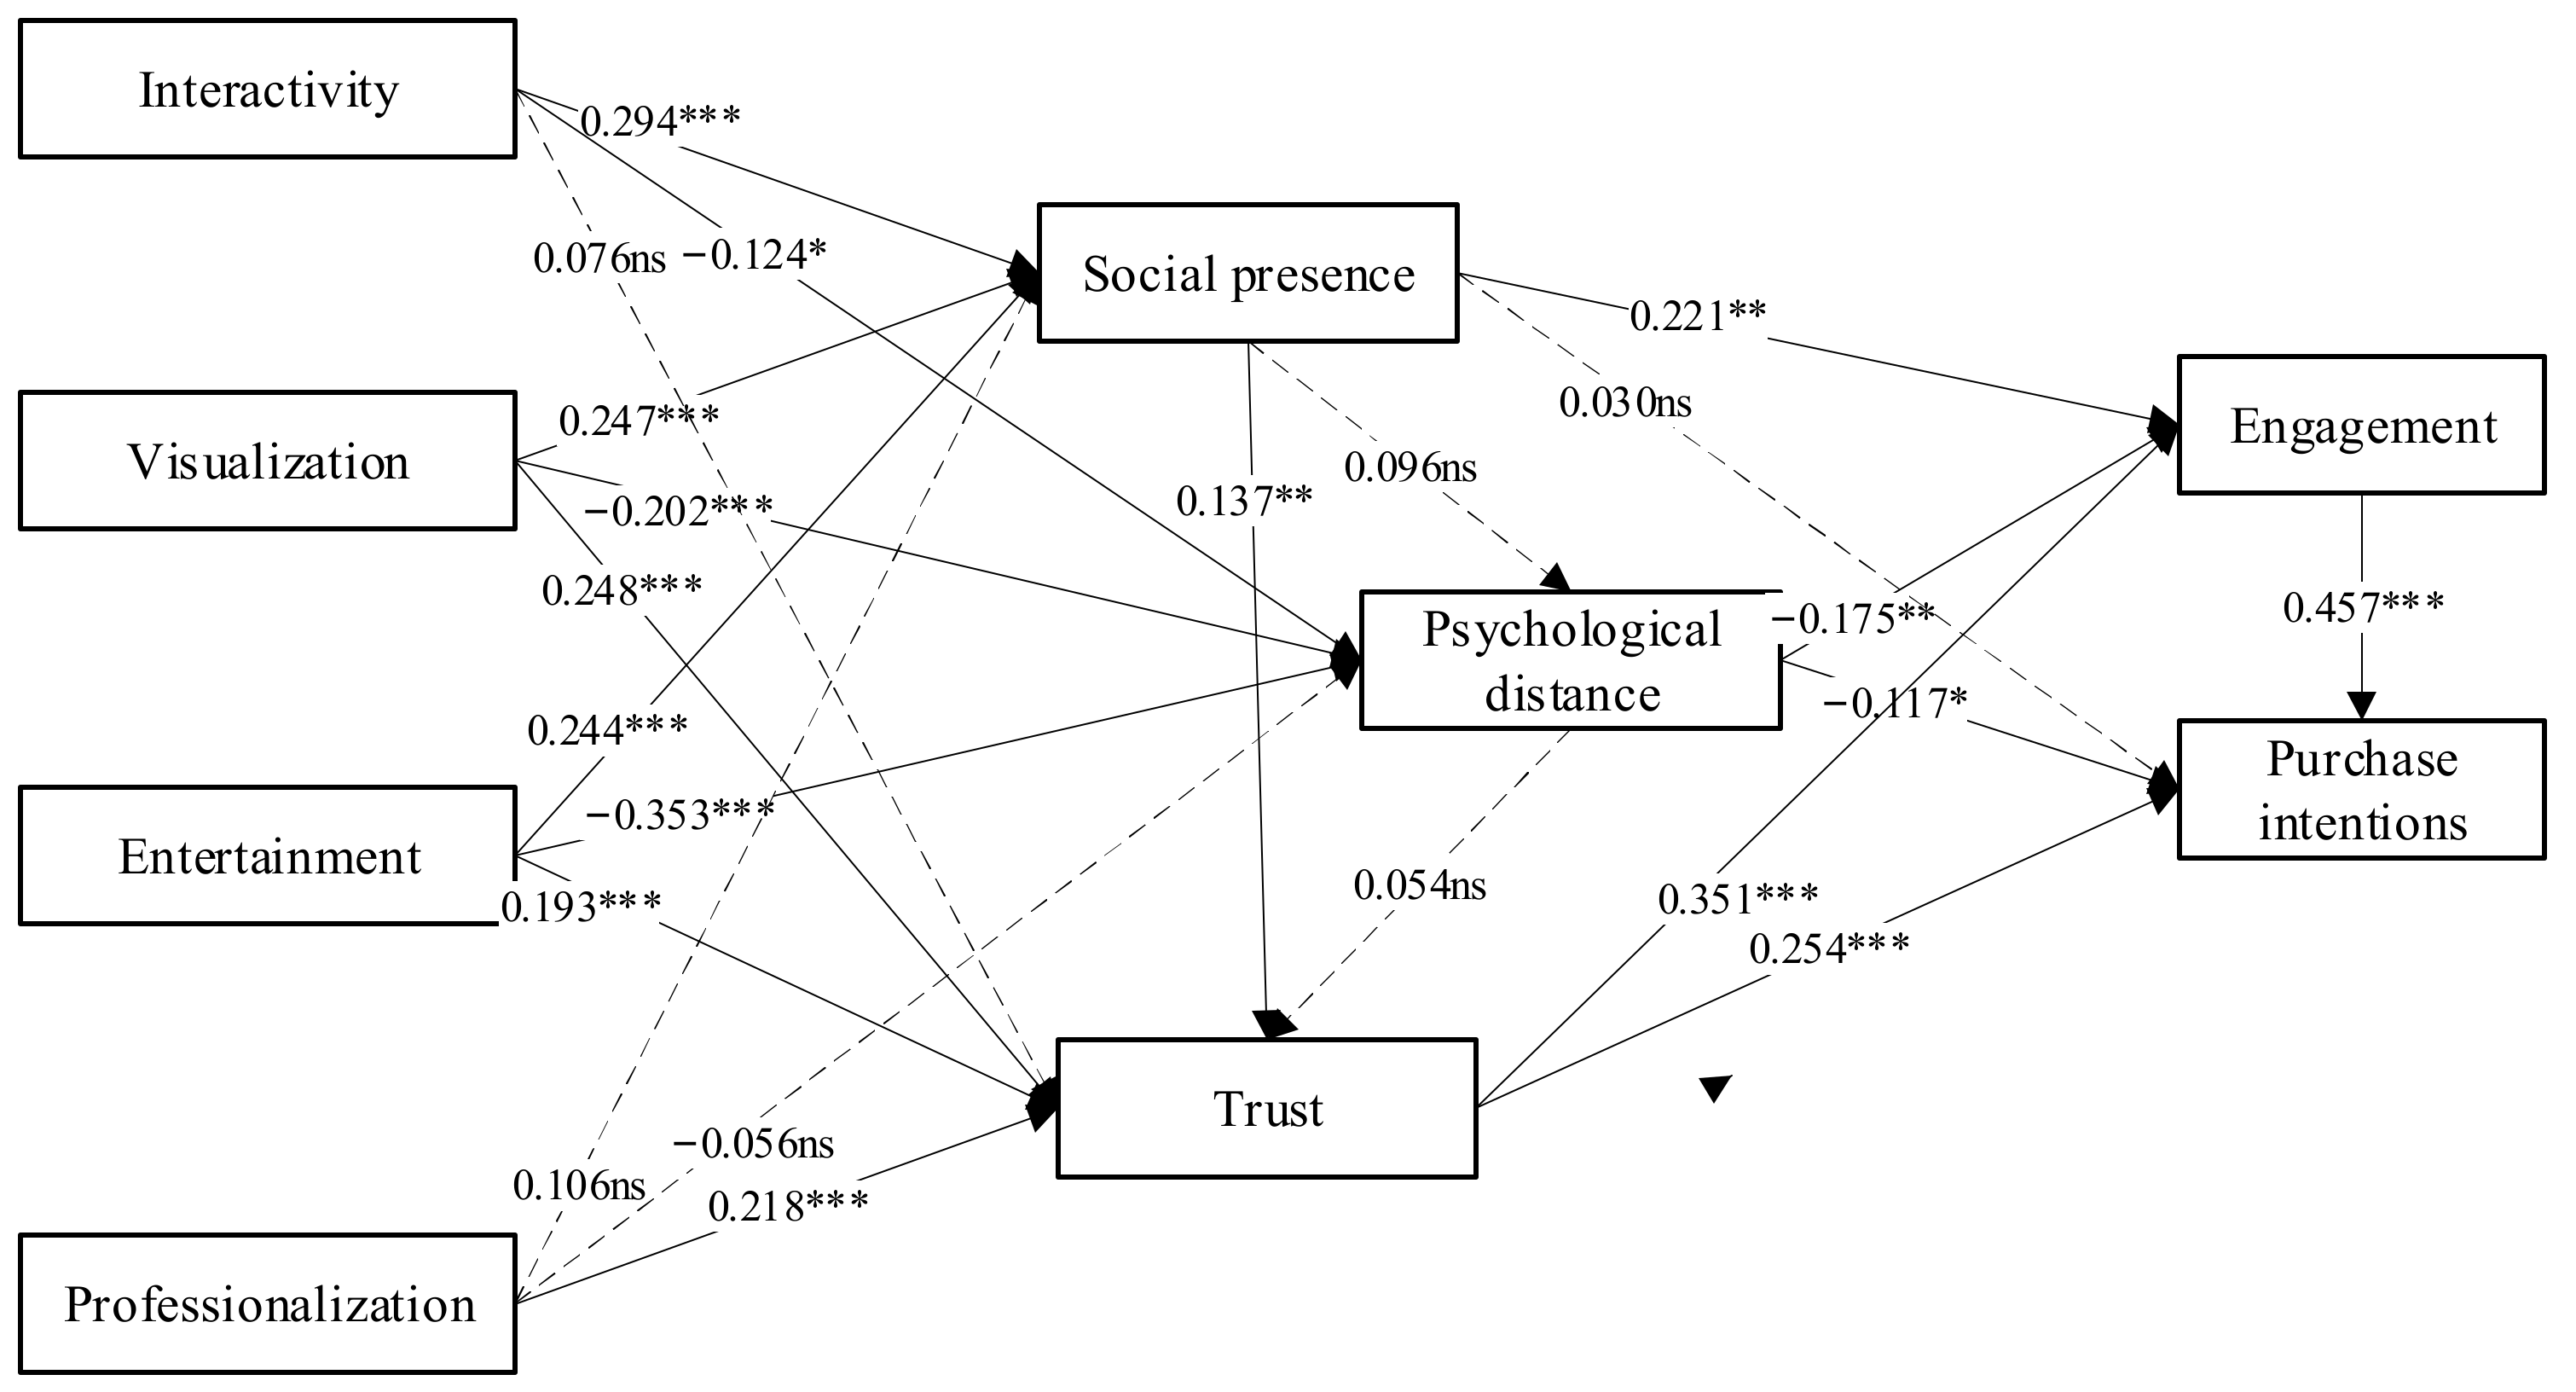
5.2. Structural Model

The results of the structural model are presented in Figure 3. The final model explains a moderate portion of the variance, with a coefficient of determination (R2) of 0.526 for social presence, 0.470 for psychological distance, 0.607 for trust, 0.407 for engagement, and 0.561 for purchase intentions (all the R2 is between 0.33 and 0.67), suggesting a satisfactory level of predictive power [43]. All the path coefficients and hypotheses are summarized in Table 4.
For H1a–H1d, the results indicate that interactivity (β = 0.294, p < 0.05), visualization (β = 0.247, p < 0.05), and entertainment (β = 0.244, p < 0.05) have positive effects on social presence, supporting H1a–H1c, but not H1d.
Regarding H2a–H2d, the results indicate that interactivity (β = −0.124, p < 0.05), visualization (β = −0.202, p < 0.05), and entertainment (β = −0.353, p < 0.05) are negatively associated with psychological distance, supporting H2a–H2c, but not H2d.
Regarding H3a–H3d, the results indicate that visualization (β = 0.284, p < 0.05), entertainment (β = 0.193, p < 0.05), and professionalization (β = 0.218, p < 0.05) have positive effects on trust, supporting H3b–H3d, but not H3a.
H9 is supported, as engagement positively impacts purchase intentions (β= 0.457, p < 0.05).

5.3. Mediating Effects

We conducted multiple mediation analysis to examine the mediation effects of social presence, psychological distance, trust, and engagement [5,55]. A bootstrapping procedure with 5000 samples was used to construct and test the confidence intervals for indirect effects. The results of the mediating effects are presented in Table 5.
First, after bootstrapping, the 95% confidence interval of the indirect effect of interactivity on purchase intentions does not contain zero, indicating that social presence mediates the effect of interactivity on purchase intentions. Social presence also mediates the effect of visualization and entertainment on purchase intentions but does not mediate the effect of professionalization on purchase intentions. Psychological distance mediates the effect of interactivity, visualization, and entertainment on purchase intentions but does not mediate the effect of professionalization on purchase intentions. Trust mediates the effect of visualization, entertainment, and professionalization on purchase intentions but does not mediate the effect of interactivity on purchase intentions. Therefore, H4a–H4c, H5a–H5c, and H7b–H7d are supported, but H4d, H5d, and H7a are not supported.
Second, after bootstrapping, the 95% confidence interval of the indirect effect of social presence on trust contains zero, indicating that psychological distance does not mediate the effect of social presence on trust, not supporting H6. Trust does not mediate the effect of psychological distance on purchase intentions, not supporting H8b.
Next, after bootstrapping, the 95% confidence interval of the indirect effect of social presence on purchase intentions does not contain zero, indicating that trust mediates the effect of social presence on purchase intentions. Furthermore, the total effect of social presence on purchase intentions is significant, but the direct effect is not significant. Thus, trust fully mediates the effect of social presence on purchase intentions, supporting H8a. Engagement fully mediates the effect of social presence on purchase intentions, supporting H10a.
Finally, after bootstrapping, the 95% confidence interval of the indirect effect of psychological distance on purchase intentions does not contain zero, indicating that engagement mediates the effect of psychological distance on purchase intentions. In addition, the total effect of psychological distance on purchase intentions is significant, similar to the direct effect. Thus, engagement partially mediates the effect of psychological distance on purchase intentions, supporting H10b. Engagement partially mediates the effect of trust on purchase intentions, supporting H10c.

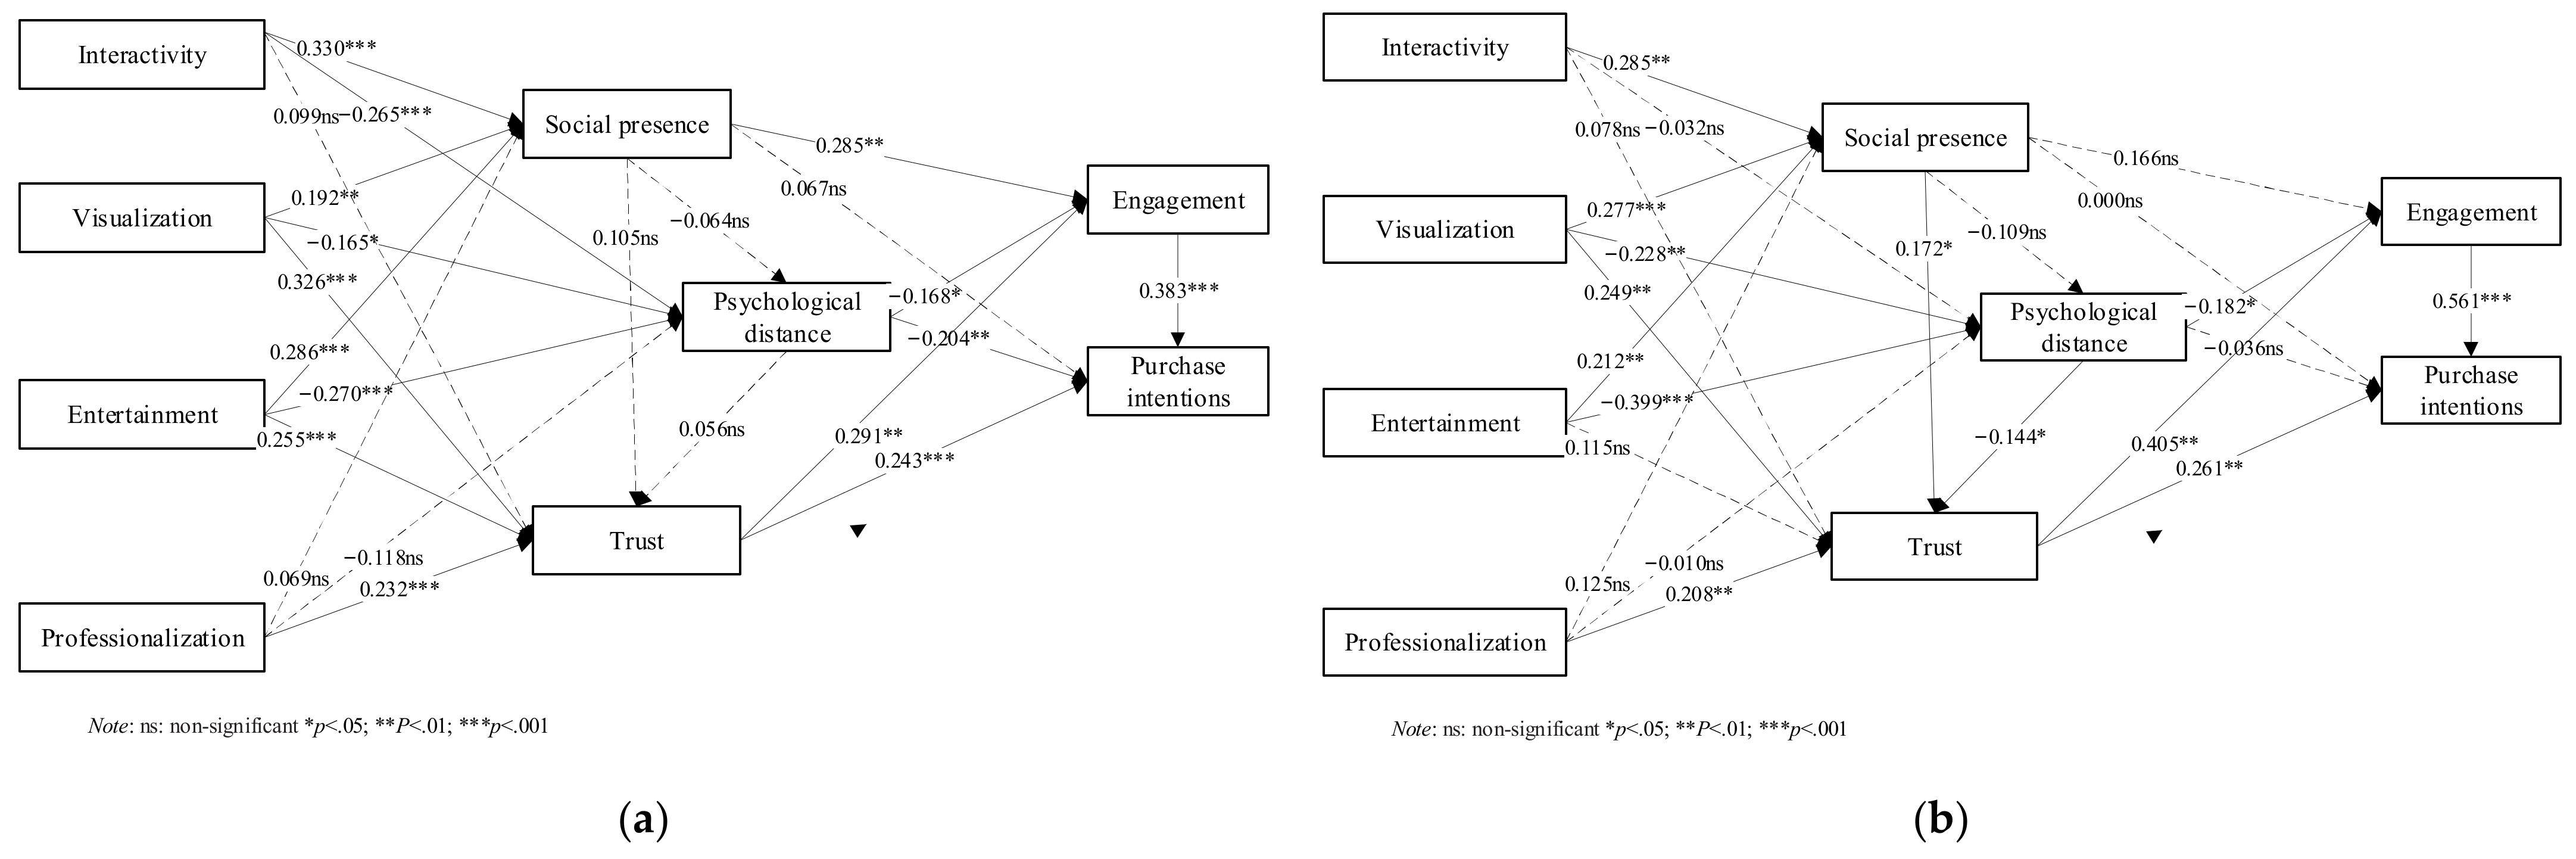
5.4. Gender Differences

Some studies show that there are large differences in online shopping behaviors and attitudes between males and females [56,57]. To test whether there were significant differences in the live peculiarities between different genders, a t-test was used to analyze the data, and the result is shown in Table 6. The scores of males and females are significantly different in interactivity. Because μ I N . m a l e > μ I N . f e m a l e ( μ I N . m a l e = 6.026, μ I N . f e m a l e = 5.829), we infer that males are more satisfied with the interactivity of live-streaming commerce than females. Therefore, streamers could pay more attention to the females’ need for interactivity.
Multi-group analysis was used to test whether gender differences would change the hypothesis testing results [58], and the results are shown in Table 7. In Table 7 every p-value is above 0.05, which indicates that our hypothesis testing results are not significantly different between males and females. Therefore, the psychological mechanisms of males and females are the same in live-streaming commerce.

5.5. Platform Difference

Live-streaming commerce platforms can be divided into two categories: e-commerce platforms and social media platforms, in which the former is to embed live streaming into traditional e-commerce platforms, such as Taobao live; and the latter is integration of e-commerce into social media, such as Tik Tok and Snack Video [59]. We used the independent sample t-test to test whether there were significant differences in the live peculiarities between the two types of platforms. The results are shown in Table 8. We see that interactivity, visualization and professionalization are significantly different between these two types of platforms, and the respondents consider that e-commerce platforms are more interactive, visible and professional than social media platforms. Therefore, social media platforms, as the emerging and live-streaming commerce platforms, should improve their interactivity, visualization and professionalization.
Multi-group analysis was also used to test whether platform differences would change the hypothesis testing results, and the results are shown in Table 9. In Table 9, we see that there are some differences in the psychological mechanism between the two types of platforms. To further illustrate, we draw the results of structural models under the two types of platforms respectively in Figure 4. In e-commerce platforms, social presence, psychological distance and trust did not affect each other, and separately affected purchase intention. However, social presence and psychological distance affect purchase intentions mainly through trust in social media platforms. This may be due to how immature the trust mechanisms of social media platforms is.

5.6. Path Comparison

We employed the path comparison method [55] to compare all the specific indirect effects of live peculiarities on purchase intentions. Because all mediators of the same independent–dependent variable pair are quantified in the same metric—that of the dependent variable—Preacher and Hayes justified the comparison of multiple indirect effects linking the same XY [55]. We compared all the specific indirect effects of live peculiarities on purchase intentions, and the results are shown in Table 10. Table 10 shows that the maximum of all specific indirect effects of interactivity on purchase intentions is IN- > SP- > ENG- > PI, in which interactivity influences purchase intentions through engagement. Therefore, for interactivity, we can directly use engagement to depict consumer behavioral responses in live-streaming commerce. The maximum of all specific indirect effects of visualization on purchase intentions is VI- > TR- > PI, in which visualization does not need engagement to influence purchase intentions. Therefore, for visualization, we can directly use purchase intentions to describe consumer behavioral responses in live-streaming commerce. As with visualization, for entertainment and professionalization we can directly use purchase intentions to describe consumer behavioral responses in live-streaming commerce.

6. Discussion

This study focused on the psychological mechanisms of live-streaming commerce. Interactivity, visualization, entertainment and professionalization are important peculiarities of live-streaming commerce that distinguish it from traditional e-commerce. This study analyzed the role of social presence, psychological distance and trust in the impact of live peculiarities on purchase intentions as well as the effects of gender and platform differences.
The results show that there are different psychological mechanisms among the effects of interactivity, visualization, entertainment, and professionalization on purchase intentions. First, there is no direct effect of interactivity on trust, but interactivity indirectly affects trust through social presence. This result can be explained by the fact that frequent interactions between consumers and streamers will make consumers feel warm and humanizing. Thus, consumers will have a better service experience, and their trust will be improved. This finding is consistent with the finding of prior studies of service quality that reliable and efficient service provides a sense of high quality that enables users to build trust in the system [22,60,61].
Second, there is no direct effect of professionalization on social presence or psychological distance, but professionalization directly affects trust. This result can be explained by the fact that we trust the advice of experts more than ordinary beings. This finding is consistent with the finding of prior studies of professionalization that the degree of professionalization shared by friends and the professionalism of reviewers positively affects consumer trust [62,63].
Third, trust and engagement fully mediate the effect of social presence on purchase intentions. This finding is consistent with prior studies in the social commerce context. Lu found that social presence has a positive impact on trust, which in turn results in online purchase behaviors [64]. Additionally, Osei-Frimpong and McLean proved that social presence significantly influences social brand engagement [65].
Fourth, engagement positively affects purchase intentions. This finding is consistent with Addo [66], who found that customer engagement has a direct relationship with purchase intentions in live-streaming commerce. However, we also found that the cognitive and affective states of consumers impact purchase intentions through engagement.
Next, gender does not moderate the effect of live peculiarities on purchase intentions, but males are more satisfied with the interactivity of live-streaming commerce than females. This result may be because males pay more attention to the functional attributes of products, while females pay more attention to the service experience when shopping online. This finding is consistent with the finding of prior studies that females find online shopping experiences less satisfying than males [56,57].
The respondents consider e-commerce platforms to be more interactive, visible and professional than social media platforms, and the platform moderates the mediating effect of interactivity on psychological distance. This result may be due to the way in which e-commerce platforms started live-streaming commerce earlier and because the business model is relatively mature in comparison with other social media platforms.
Finally, it is better to use engagement to describe consumer behavioral responses when studying the role of interactivity and to use purchase intentions when studying the roles of visualization, entertainment, and professionalization, as doing so provides a basis for selecting the two dependent variables in live-streaming commerce. This finding explains why Xue [8] and Kang [9] used engagement to describe consumer behavioral responses in live-streaming commerce.

6.1. Theoretical Contribution

This study makes several pivotal theoretical contributions.
First, this study contributes to research of the characteristics of live-streaming commerce. Compared with traditional e-commerce and social commerce, live-streaming commerce is greatly improved in terms of interactivity, visualization, entertainment, and professionalization. However, current studies on live-streaming commerce mainly focus on the interactivity while ignoring visualization, entertainment, and professionalization. This study explored and compared the influences of these four live peculiarities on purchase intentions. Their influence mechanisms differ, enriching the research on the psychological mechanisms of live-streaming commerce.
Second, in previous studies on live-streaming commerce, engagement or purchase intentions are used to describe consumer behavioral responses. By assuming that engagement positively affects purchase intentions, the two variables were integrated to describe consumer behavioral responses. We proved that it is better to use engagement to describe consumer behavioral responses when studying the role of interactivity, to use purchase intentions when studying the role of visualization, entertainment, and professionalization, and that doing so provides a basis for selecting the two dependent variables to describe consumer behavioral responses in future research on live-streaming commerce.

6.2. Managerial Implications

From the managerial perspective, this study provides insights into how stores, platforms, and streamers apply live peculiarities to attract and retain more customers.
Compared with visualization, entertainment, and professionalization, interactivity has the greatest influence on social presence. In live streaming, streamers should encourage consumers to express themselves, answer their questions in a timely manner, focus on the problems that consumers care about, and pay more attention to the needs of females. Platforms could apply artificial intelligence technology to interact with consumers when the streamer is too busy to answer.
Visualization has the greatest influence on trust. Streamers should display a product in all directions and enlarge its details so that consumers can truly feel the quality of the product. Stores should employ high-quality equipment to make superior video that allows customers to see and visualize products more clearly.
Entertainment has the greatest influence on psychological distance. Stores can organize interesting activities, such as lucky drawings and flash sales. Stores should invite humorous sellers to be streamers. Streamers should be full of passion to enliven the atmosphere to keep live streaming interesting. Sometimes, streamers can also perform talent shows.
Professionalization directly affects trust. A brand store should invite streamers who are familiar with the brand and its products. Before live streaming, streamers should know the products in detail and try them on. Streamers should highlight the uniqueness of a product when introducing it so that consumers can quickly grasp the purchase value of the products.
Visualization and entertainment have a greater impact on purchase intentions than interactivity and professionalism. A store that has just started live streaming should first show more details of the products and make live streaming interesting to quickly attract consumers.
For social media platforms, the immature trust mechanism is the primary factor limiting the development of their live streaming businesses. Meantime, social media platforms are less interactive, visible and professional than e-commerce platforms. Therefore, social media platforms still have huge development space in live-streaming commerce, especially in interactivity, visualization and professionalization.

6.3. Limitations and Future Research

Research on live-streaming commerce, which is an emerging business model, is still in its infancy, and more studies are needed. In this study, we chose consumers with live streaming shopping experience as research objects. In the future, we could investigate the factors impacting continuous purchase intentions. Some studies have shown that Eastern and Western cultures have different influences on social commerce behaviors. Next, we could verify whether this result holds true with live-streaming commerce. Regarding the demographics of consumers, other than gender, we could consider the impacts of educational background, income, and geographical distribution. In addition, there may be cross-gender effects. In the future, we would compare the results of the same genders of the viewer and the streamer with the opposite genders of the two parties.

Author Contributions

Formal analysis, L.M.; investigation, L.M.; methodology, L.M.; writing—original draft, L.M.; writing—review & editing, S.G. and X.Z. All authors have read and agreed to the published version of the manuscript.

Funding

This research received no external funding.

Institutional Review Board Statement

Approval for the study was not required in accordance with local/national legislation.

Informed Consent Statement

Informed consent was obtained from all subjects involved in the study.

Data Availability Statement

The data presented in this study are available on request from the corresponding author. The data are not publicly available due to the sensitivity of the data.

Conflicts of Interest

The authors declare no conflict of interest.

References

  1. IResearch. The Research Report on Chinese Live Streaming E-Commerce Industry in 2021. Available online: https://baijiahao.baidu.com/s?id=1710963499129873379&wfr=spider&for=pc (accessed on 22 September 2021).
  2. Hilvert-Bruce, Z.; Neill, J.T.; Sjöblom, M.; Hamari, J. Social motivations of live-streaming viewer engagement on Twitch. Comput. Hum. Behav. 2018, 84, 58–67. [Google Scholar] [CrossRef] [Green Version]
  3. Xu, Y.; Ye, Y. Who watches live streaming in China? Examining viewers’ behaviors, personality traits, and motivations. Front. Psychol. 2020, 11, 1607. [Google Scholar] [CrossRef]
  4. Guo, L.Y.; Hu, X.Y.; Lu, J.X.; Ma, L. Effects of customer trust on engagement in live streaming commerce: Mediating role of swift guanxi. Internet Res. 2021, 31, 1718–1744. [Google Scholar] [CrossRef]
  5. Wongkitrungrueng, A.; Assarut, N. The role of live streaming in building consumer trust and engagement with social commerce sellers. J. Bus. Res. 2020, 117, 543–556. [Google Scholar] [CrossRef]
  6. Sun, Y.; Shao, X.; Li, X.; Guo, Y.; Nie, K. How live streaming influences purchase intentions in social commerce: An IT affordance perspective. Electron. Commer. Res. Appl. 2019, 37, 100886. [Google Scholar] [CrossRef]
  7. Xu, X.Y.; Wu, J.H.; Li, Q. What drives consumer shopping in live streaming commerce. J. Electron. Commer. Res. 2020, 21, 144–167. [Google Scholar]
  8. Xue, J.; Liang, X.; Xie, T.; Wang, H. See now, act now: How to interact with customers to enhance social commerce engagement? Inf. Manag. 2020, 57, 103324. [Google Scholar] [CrossRef]
  9. Kang, K.; Lu, J.; Guo, L.; Li, W. The dynamic effect of interactivity on customer engagement behavior through tie strength: Evidence from live streaming commerce platforms. Int. J. Inf. Manag. 2021, 56, 102251. [Google Scholar] [CrossRef]
  10. Zhang, M.; Sun, L.; Qin, F.; Wang, G.A. E-service quality on live streaming platforms: Swift guanxi perspective. J. Serv. Mark. 2021, 35, 312–324. [Google Scholar] [CrossRef]
  11. Hou, F.F.; Guan, Z.Z.; Li, B.Y.; Chong, A.Y.L. Factors influencing people’s continuous watching intention and consumption intention in live streaming evidence from China. Internet Res. 2020, 30, 141–163. [Google Scholar] [CrossRef]
  12. Hu, M.Y.; Chaudhry, S.S. Enhancing consumer engagement in e-commerce live streaming via relational bonds. Internet Res. 2020, 30, 1019–1041. [Google Scholar] [CrossRef]
  13. Su, Q.L.; Zhou, F.; Wu, Y.J. Using virtual gifts on live streaming platforms as a sustainable strategy to stimulate consumers’ green purchase intention. Sustainability 2020, 12, 3783. [Google Scholar] [CrossRef]
  14. Wei, H.; Gao, J.; Wang, F. The impact of information interaction on user engagement behavior in live streaming commerce. Inf. Sci. 2021, 39, 148–156. [Google Scholar]
  15. Liu, F.; Meng, L.; Chen, Y.; Duan, K. The impact of network celebrities’ information source charecteristics on purchase intention. Chin. J. Manag. 2020, 17, 94–104. [Google Scholar]
  16. Pavlou, P.A.; Liang, H.; Xue, Y. Understanding and mitigating uncertainty in online exchange relationships: A principal-agent perspective. MIS Q. 2007, 31, 105–136. [Google Scholar] [CrossRef] [Green Version]
  17. Ma, Y.Y. To shop or not: Understanding Chinese consumers’ live-stream shopping intentions from the perspectives of uses and gratifications, perceived network size, perceptions of digital celebrities, and shopping orientations. Telemat. Inform. 2021, 59, 101562. [Google Scholar] [CrossRef]
  18. Mou, J.; Benyoucef, M. Consumer behavior in social commerce: Results from a meta-analysis. Technol. Forecast. Soc. Change 2021, 167, 120734. [Google Scholar] [CrossRef]
  19. Tseng, F.C.; Cheng, T.C.E.; Li, K.; Teng, C.I. How does media richness contribute to customer loyalty to mobile instant messaging? Internet Res. 2017, 27, 520–537. [Google Scholar] [CrossRef]
  20. Chen, Y.H.; Chen, M.C.; Keng, C.J. Measuring online live streaming of perceived servicescape Scale development and validation on behavior outcome. Internet Res. 2020, 30, 737–762. [Google Scholar] [CrossRef]
  21. Li, Y.; Li, X.L.; Cai, J.L. How attachment affects user stickiness on live streaming platforms: A socio-technical approach perspective. J. Retail. Consum. Serv. 2021, 60, 102478. [Google Scholar] [CrossRef]
  22. Sarkar, S.; Chauhan, S.; Khare, A. A meta-analysis of antecedents and consequences of trust in mobile commerce. Int. J. Inf. Manag. 2020, 50, 286–301. [Google Scholar] [CrossRef]
  23. Pancer, E.; Chandler, V.; Poole, M.; Noseworthy, T.J. How readability shapes social media engagement. J. Consum. Psychol. 2019, 29, 262–270. [Google Scholar] [CrossRef]
  24. Busalim, A.H.; Hussin, A.R.C.; Iahad, N.A. Factors influencing customer engagement in social commerce websites: A systematic literature review. J. Theor. Appl. Electron. Commer. Res. 2019, 14, 1–14. [Google Scholar] [CrossRef] [Green Version]
  25. Molinillo, S.; Anaya-Sánchez, R.; Liebana-Cabanillas, F. Analyzing the effect of social support and community factors on customer engagement and its impact on loyalty behaviors toward social commerce websites. Comput. Hum. Behav. 2020, 108, 105980. [Google Scholar] [CrossRef]
  26. Moon, J.-W.; Kim, Y.-G. Extending the TAM for a World-Wide-Web context. Inf. Manag. 2001, 38, 217–230. [Google Scholar] [CrossRef]
  27. Yu, X.; Xu, Z. The theoretical model of bullet screen users’ participative behavior in network broadcast platform. Inf. Sci. 2017, 35, 147–151. [Google Scholar]
  28. Pujiastuti, E.E.; Nimran, U.; Suharyono, S.; Kusumawati, A. The antecedents of behavioral intention regarding rural tourism destination. Asia Pac. J. Tour. Res. 2017, 22, 1169–1181. [Google Scholar] [CrossRef]
  29. Zhang, M.M.; Xu, P.; Ye, Y.J. Trust in social media brands and perceived media values: A survey study in China. Comput. Hum. Behav. 2022, 127, 107024. [Google Scholar] [CrossRef]
  30. Biswas, D.; Biswas, A.; Das, N. The differential effects of celebrity and expert endorsements on consumer risk perceptions. The role of consumer knowledge, perceived congruency, and product technology orientation. J. Advert. 2006, 35, 17–31. [Google Scholar] [CrossRef]
  31. Short, J.; Williams, E.; Christie, B. The Social Psychology of Telecommunications; Wiley: Toronto, ON, Canada; London, UK; New York, NY, USA, 1976. [Google Scholar]
  32. Ye, S.; Ying, T.Y.; Zhou, L.Q.; Wang, T.Y. Enhancing customer trust in peer-to-peer accommodation: A “soft” strategy via social presence. Int. J. Hosp. Manag. 2019, 79, 1–10. [Google Scholar] [CrossRef]
  33. Lim, J.S.; Choe, M.-J.; Zhang, J.; Noh, G.-Y. The role of wishful identification, emotional engagement, and parasocial relationships in repeated viewing of live-streaming games: A social cognitive theory perspective. Comput. Hum. Behav. 2020, 108, 106327. [Google Scholar] [CrossRef]
  34. Liberman, N.; Trope, Y. The psychology of transcending the here and now. Science 2008, 322, 1201–1205. [Google Scholar] [CrossRef] [Green Version]
  35. Lim, S.; Cha, S.Y.; Park, C.; Lee, I.; Kim, J. Getting closer and experiencing together: Antecedents and consequences of psychological distance in social media-enhanced real-time streaming video. Comput. Hum. Behav. 2012, 28, 1365–1378. [Google Scholar] [CrossRef]
  36. Darke, P.R.; Brady, M.K.; Benedicktus, R.L.; Wilson, A.E. Feeling close from afar: The role of psychological distance in offsetting distrust in unfamiliar online retailers. J. Retail. 2016, 92, 287–299. [Google Scholar] [CrossRef]
  37. Zhang, M.; Qin, F.; Wang, G.A.; Luo, C. The impact of live video streaming on online purchase intention. Serv. Ind. J. 2020, 40, 656–681. [Google Scholar] [CrossRef]
  38. Liébana-Cabanillas, F.; Marinković, V.; Kalinić, Z. A SEM-neural network approach for predicting antecedents of m-commerce acceptance. Int. J. Inf. Manag. 2017, 37, 14–24. [Google Scholar] [CrossRef]
  39. Kim, S.; Park, H. Effects of various characteristics of social commerce (s-commerce) on consumers’ trust and trust performance. Int. J. Inf. Manag. 2013, 33, 318–332. [Google Scholar] [CrossRef]
  40. Bugshan, H.; Attar, R.W. Social commerce information sharing and their impact on consumers. Technol. Forecast. Soc. Change 2020, 153, 119875. [Google Scholar] [CrossRef]
  41. Urbach, N.; Ahlemann, F. Structural equation modeling in information systems research using partial least squares. J. Inf. Technol. Theory Appl. 2010, 11, 5–40. [Google Scholar]
  42. Hair, J.F.; Sarstedt, M.; Ringle, C.M.; Mena, J.A. An assessment of the use of partial least squares structural equation modeling in marketing research. J. Acad. Mark. Sci. 2012, 40, 414–433. [Google Scholar] [CrossRef]
  43. Chin, W.W.; Marcoulides, G. The partial least squares approach to structural equation modeling. Adv. Hosp. Lsure 1998, 295, 295–336. [Google Scholar]
  44. Wu, G.; Wu, G. Conceptualizing and measuring the perceived interactivity of websites. J. Curr. Issues Res. Advert. 2006, 28, 87–104. [Google Scholar] [CrossRef]
  45. Dong, X.; Wang, T.; Benbasat, I. IT affordances in online social commerce: Conceptualization validation and scale development. In Proceedings of the Twenty-Second Americas Conference on Information Systems, San Diego, CA, USA, 11–14 August 2016. [Google Scholar]
  46. Dong, X.; Wang, T. Social tie formation in Chinese online social commerce: The role of IT affordances. Int. J. Inf. Manag. 2018, 42, 49–64. [Google Scholar] [CrossRef]
  47. Chen, C.C.; Lin, Y.C. What drives live-stream usage intention? The perspectives of flow, entertainment, social interaction, and endorsement. Telemat. Inform. 2018, 35, 293–303. [Google Scholar] [CrossRef]
  48. Ohanian, R. Construction and validation of a scale to measure celebrity endorsers’ perceived expertise, trustworthiness, and attractiveness. J. Advert. 1990, 19, 39–52. [Google Scholar] [CrossRef]
  49. Busalim, A.H.; Ghabban, F. Customer engagement behaviour on social commerce platforms: An empirical study. Technol. Soc. 2021, 64, 101437. [Google Scholar] [CrossRef]
  50. Edwards, S.M.; Lee, J.K.; Ferle, C.L. Does place matter when shopping online? Perceptions of similarity and familiarity as indicators of psychological distance. J. Interact. Advert. 2009, 10, 35–50. [Google Scholar] [CrossRef]
  51. Chen, A.; Lu, Y.; Wang, B. Customers’ purchase decision-making process in social commerce: A social learning perspective. Int. J. Inf. Manag. 2017, 37, 627–638. [Google Scholar] [CrossRef]
  52. Ringle, C.M.; Wende, S.; Becker, J.M. SmartPLS 3. Available online: http://www.smartpls.com (accessed on 3 September 2021).
  53. Nunnally, J.C.; Bernstein, I.H. Psychological Theory; McGraw Hill: New York, NY, USA, 1994. [Google Scholar]
  54. Fornell, C.; Larcker, D.F. Evaluating structural equation models with unobservable variables and measurement error. J. Mark. Res. 1981, 18, 39–50. [Google Scholar] [CrossRef]
  55. Preacher, K.J.; Hayes, A.F. Asymptotic and resampling strategies for assessing and comparing indirect effects in multiple mediator models. Behav. Res. Methods 2008, 40, 879–891. [Google Scholar] [CrossRef]
  56. Benson, V.; Ezingeard, J.-N.; Hand, C. An empirical study of purchase behaviour on social platforms: The role of risk, beliefs and characteristics. Inf. Technol. People 2019, 32, 876–896. [Google Scholar] [CrossRef]
  57. Rodgers, S.; Harris, M.A. Gender and e-commerce: An exploratory study. J. Advert. Res. 2003, 43, 322–329. [Google Scholar] [CrossRef]
  58. Sarstedt, M.; Henseler, J.; Ringle, C.M. Multigroup analysis in partial least squares (PLS) path modeling: Alternative methods and empirical results. In Measurement and Research Methods in International Marketing; Emerald Group Publishing Limited: Bingley, UK, 2011; Volume 22, pp. 159–218. [Google Scholar]
  59. Cai, J.; Wohn, D.Y.; Mittal, A.; Sureshbabu, D. Utilitarian and hedonic motivations for live streaming shopping. In Proceedings of the 2018 ACM International Conference on Interactive Experiences for TV and Online Video, Seoul, Korea, 26–28 June 2018. [Google Scholar]
  60. Giovanis, A. Consumer-brand relationships’ development in the mobile internet market: Evidence from an extended relationship commitment paradigm. J. Prod. Brand Manag. 2016, 25, 568–585. [Google Scholar] [CrossRef]
  61. Wang, W.-T.; Ou, W.-M.; Chen, W.-Y. The impact of inertia and user satisfaction on the continuance intentions to use mobile communication applications: A mobile service quality perspective. Int. J. Inf. Manag. 2019, 44, 178–193. [Google Scholar] [CrossRef]
  62. Lv, X.; Cao, J. Analysis on the influencing factors of the evolution of consumer trust in social commerce context. J. Commer. Econ. 2021, 16, 69–72. [Google Scholar]
  63. Sun, J.; Zheng, Y.; Chen, J. The influence of credibility of online reviews on Consumers’ trust: The moderating role of uncertainty. Manag. Rev. 2020, 32, 146–159. [Google Scholar]
  64. Lu, B.Z.; Fan, W.G.; Zhou, M. Social presence, trust, and social commerce purchase intention: An empirical research. Comput. Hum. Behav. 2016, 56, 225–237. [Google Scholar] [CrossRef] [Green Version]
  65. Osei-Frimpong, K.; McLean, G. Examining online social brand engagement: A social presence theory perspective. Technol. Forecast. Soc. Change 2018, 128, 10–21. [Google Scholar] [CrossRef] [Green Version]
  66. Clement Addo, P.; Fang, J.; Asare, A.O.; Kulbo, N.B. Customer engagement and purchase intention in live-streaming digital marketing platforms. Serv. Ind. J. 2021, 41, 11–12. [Google Scholar] [CrossRef]
Figure 1. Screenshots of live streaming: (a) The streamers are trying on the product. (b)The streamer is showing details of the product.
Sustainability 14 01045 g001
Figure 2. The research model.
Sustainability 14 01045 g002
Figure 3. Results of structural model. Note: ns: non-significant; * p < 0.05; ** p < 0.01; *** p < 0.001.
Sustainability 14 01045 g003
Figure 4. Results of structural model under different platforms. (a) Results of structural model under e-commerce platforms; (b) results of structural model under social media platforms.
Sustainability 14 01045 g004
Table 1. Measurement items.
ConstructItemReferences
Interactivity
(IN)
IN1.The streamers were very happy to communicate with viewers
IN2. The streamers actively responded viewers’ questions
IN3.The streamers answered viewers’ questions and requests in time
IN4.The streamers provided relevant information for viewers’ inquiries.
[8,44]
Visualization
(VI)
VI1. The live streaming made information about how to use products visible to me.
VI2. The live streaming made the product attributes visible to me.
VI3.The live streaming helped me to visualize products like in the real world.
[45,46]
Entertainment
(ENT)
EN1. The live streaming was interesting.
EN1. The live streaming got me relaxed.
EN1.The live streaming gave me pleasure.
[47]
Professionalization
(PR)
PR1. The streamers were experts on these products.
PR2. The streamers were highly experienced in these products.
PR3. The streamers were very knowledgeable about these products
[48]
Social presence
(SP)
SP1.The interactivity with streamers was personal.
SP2.The interactivity with streamers was warm.
SP3.The interactivity with streamers was close.
SP4.The interactivity with streamers was humanizing.
SP5.The interactivity with streamers was emotional.
[31,49]
Psychological distance
(PD)
PD1. The live streaming reduced the distance between me and streamers or products.
PD2. The live streaming brings my heart closer to streamers or products.
PD3. The live streaming reduced my strangeness to streamers or products.
[8,34,50]
Trust
(TR)
TR1.I believed that the streamers were trustworthy
TR2.I believed in the information that the streamers provided.
TR3.I trusted that the products I would receive would be the same as those shown on live streaming.
[5]
Engagement
(ENG)
EN1.I would share this live streaming shopping information with my friends.
EN2.I would subscribe to and watch the product information recommended by streamers.
EN3.I would give a “like” for this live streaming room.
[8]
Purchase intention
(PI)
PI1.I intended to purchase products from this live streaming studio.
PI2.I predicted that I would purchase products from this live streaming studio.
PI3.If there was a product that I would like to purchase, I would firstly purchase from this live streaming studio.
[51]
Table 2. Assessment of measurement model.
Factor LoadingsT StatisticsComposite ReliabilityCronbach’s AlphaAVE
ININ10.750 29.126 *** 0.8570.7780.600
IN20.751 24.900 ***
IN30.802 40.416 ***
IN40.79438.803 ***
VIVI10.833 46.334 *** 0.8740.7840.698
VI20.825 45.753 ***
VI30.848 57.135 ***
ENTENT10.833 52.841 ***0.8820.7990.713
ENT20.83447.433 ***
ENT30.86671.254 ***
PRPR10.765 29.342 ***0.8870.8090.724
PR20.82847.687 ***
PR30.87363.189 ***
SPSP10.851 52.133 ***0.9250.8990.712
SP20.82441.405 ***
SP30.86260.909 ***
SP40.87371.130 ***
SP50.81845.307 ***
PDPD10.84150.513 ***0.8430.7220.641
PD20.83156.515 ***
PD30.80536.788 ***
TRTR10.89695.335 ***0.9120.8560.776
TR20.89174.247 ***
TR30.85660.650 ***
ENGENG10.853 45.190 ***0.9050.8420.760
ENG20.908105.262 ***
ENG30.85351.207 ***
PIPI10.83349.284 ***0.8840.8040.718
PI20.86872.818 ***
PI30.84047.026 ***
Note: ns: non-significant, *** p < 0.001.
Table 3. Discriminant validity based on Fornell–Larcker criterion.
INVIENTPRSPPDTRENGPI
IN0.775
VI0.4990.835
ENT0.5010.580.844
PR0.5290.6070.5450.851
SP0.5960.6000.5920.5450.844
PD0.4880.5600.6190.4890.5300.801
TR0.5370.6780.6280.6370.6140.5480.881
ENG0.5250.4620.5640.4690.5300.4850.5830.872
PI0.5380.4960.5550.4640.5000.5030.6140.6960.847
Note: The square root of the AVE of every multi-item construct is shown in bold on the main diagonal.
Table 4. Results of path analysis.
CoefficientT StatisticsHypothesis Result
IN -> SP0.294 5.373 ***H1a: supported
VI -> SP0.247 4.882 ***H1b: supported
ENT -> SP0.244 5.128 ***H1c: supported
PR -> SP0.106 1.958 ns H1d: not supported
IN -> PD−0.124 2.279 *H2a: supported
VI -> PD−0.202 3.580 ***H2b: supported
ENT -> PD−0.353 6.056 ***H2c: supported
PR -> PD−0.056 1.136 ns H2d: not supported
IN -> TR0.076 1.701 ns H3a: not supported
VI -> TR0.284 5.131 ***H3b: supported
ENT -> TR0.193 3.995 ***H3c: supported
PR -> TR0.218 4.475 ***H3d: supported
ENG- > PI0.45710.043 ***H9: supported
Note: ns: non-significant; * p < 0.05; *** p < 0.001.
Table 5. Results of mediating effect.
Total EffectDirect EffectIndirect Effect
CoefficientT StatisticsCoefficientT Statistics CoefficientBootstrap 95% CI
H4aIN- > SP- > PI0.122 4.440 *** IN- > SP- > ENG- > PI0.031[0.010:0.057]
IN- > SP- > TR- > PI0.010[0.002:0.021]
IN- > SP- > TR- > ENG- > PI0.007[0.001:0.015]
H4bVI- > SP- > PI0.218 8.000 *** VI- > SP- > ENG- > PI0.026[0.010:0.043]
VI- > SP- > TR- > PI0.009[0.002:0.019]
VI- > SP- > TR- > ENG- > PI0.006[0.001:0.014]
H4cENT- > SP- > PI0.212 7.666 *** ENT- > SP- > ENG- > PI0.026[0.009:0.047]
ENT- > SP- > TR- > PI0.008[0.002:0.018]
ENT- > SP- > TR- > ENG- > PI0.006 [0.001:0.013]
H4dPR- > SP- > PI0.127 4.916 *** PR- > SP- > ENG- > PI0.011[0:0.026]
PR- > SP- > TR- > PI0.004[0:0.009]
PR- > SP- > TR- > ENG- > PI0.002[0:0.006]
H5aIN- > PD- > PI0.122 4.440 *** IN- > PD- > PI0.014[0.001:0.036]
IN- > PD- > ENG- > PI0.010[0.001:0.024]
H5bVI- > PD- > PI0.218 8.000 *** VI- > PD- > PI0.024[0.005:0.048]
VI- > PD- > ENG- > PI0.017[0.005:0.031]
H5cENT- > PD- > PI0.2127.666 *** ENT- > PD- > PI0.041[0.009:0.080]
ENT- > PD- > ENG- > PI0.030[0.009:0.055]
H5dPR > PD- > PI0.1274.916 *** PR > PD- > PI0.007[−0.005:0.021]
PR- > PD- > ENG- > PI0.005[−0.003:0.015]
H6SP- > PD- > TR0.1422.720 **0.1372.607 **SP- > PD- > TR0.005[−0.004:0.019]
H7aIN- > TR- > PI0.1224.440 *** IN- > TR- > PI0.019[−0.02:0.047]
IN- > TR- > ENG- > PI0.013[−0.002:0.029]
H7bVI- > TR- > PI0.2188.000 *** VI- > TR- > PI0.072[0.033:0.118]
VI- > TR- > ENG- > PI0.047[0.026:0.071]
H7cENT- > TR- > PI0.212 7.666*** ENT- > TR- > PI0.049[0.020:0.085]
ENT- > TR- > ENG- > PI0.032[0.013:0.058]
H7dPR > TR- > PI0.1274.916 *** PR > TR- > PI0.055[0.028:0.091]
PR- > TR- > ENG- > PI0.036[0.017:0.063]
H8aSP- > TR- > PI0.2143.708 ***0.030.623SP- > TR- > PI0.035[0.009:0.068]
SP- > TR- > ENG- > PI0.023[0.005:0.049]
SP- > PD- > TR- > PI0.001[−0.001:0.005]
SP- > PD- > TR- > ENG- > PI0.001[−0.001:0.003]
H8bPD- > TR- > PI0.2244.065 ***0.1172.578 *PD- > TR- > PI0.014[−0.009:0.038]
PD- > TR- > ENG- > PI0.009[−0.006:0.026]
H10aSP- > ENG- > PI0.2143.708 ***0.030.623SP- > ENG- > PI0.105[0.042:0.169]
SP- > TR- > ENG- > PI0.023[0.005:0.049]
SP- > PD- > ENG- > PI0.008[−0.001:0.021]
SP- > PD- > TR- > ENG- > PI0.001[−0.001:0.003]
H10bPD- > ENG- > PI0.2244.065 ***0.1172.578 *PD- > ENG- > PI0.084[0.031:0.138]
PD- > TR- > ENG- > PI0.009[−0.006:0.026]
H10cTR- > ENG- > PI0.4217.415 ***0.2544.659 ***TR- > ENG- > PI0.167[0.103:0.243]
Note: ns: non-significant; * p < 0.05; ** p < 0.01; *** p < 0.001.
Table 6. The results of t-test of gender difference.
GenderNMean (μ)Standard DeviationStandard ErrorT Statistics
INMale2136.0260.5830.0403.158 **
Female2415.8290.7430.048
VIMale2135.7280.8850.0611.112 ns
Female2415.6330.9150.059
ENTMale2135.5210.8710.0600.357 ns
Female2415.4920.8430.054
PRMale2135.7290.9270.0630.540 ns
Female2415.6800.9880.064
Note: ns: non-significant; ** p < 0.01.
Table 7. Results of gender difference theoretical model.
Path Coefficients-Diff
(Male-Female)
p-Value
(Male vs. Female)
H1aIN -> SP−0.147 ns0.158
H1bVI -> SP0.029 ns0.778
H1cENT -> SP0.146 ns0.123
H1dPR -> SP0.022 ns0.830
H2aIN -> PD0.076 ns0.455
H2bVI -> PD0.092 ns0.420
H2cENT -> PD−0.141 ns0.217
H2dPR -> PD−0.011 ns0.901
H3aIN -> TR−0.015 ns0.854
H3bVI -> TR0.017 ns0.879
H3cENT -> TR−0.019 ns0.841
H3dPR -> TR−0.038 ns0.698
H4aIN -> SP - > ENG- > PI−0.009 ns0.743
H4bVI -> SP - > ENG- > PI0.010 ns0.566
H4cENT-> SP - > ENG- > PI0.022 ns0.254
H4dPR -> SP - > ENG- > PI0.005 ns0.699
H5aIN- > PD- > PI−0.001 ns0.924
H5bVI- > PD- > PI−0.003 ns0.874
H5cENT- > PD- > PI−0.037 ns0.269
H5dPR- > PD- > PI−0.001 ns0.924
H6SP- > PD- > TR0.015 ns0.317
H7aIN- > TR- > PI0.003 ns0.899
H7bVI- > TR- > PI0.011 ns0.741
H7cENT- > TR- > PI0.013 ns0.674
H7dPR- > TR- > PI0.011 ns0.741
H8aSP- > TR- > PI0.017 ns0.527
H8bPD- > TR- > PI0.038 ns0.104
H9ENG- > PI−0.097 ns0.292
H10aSP- > ENG- > PI0.026 ns0.683
H10bPD- > ENG- > PI−0.044 ns0.397
H10cTR- > ENG- > PI−0.002 ns0.988
Note: ns: non-significant.
Table 8. The results of t-test of platform difference.
Platformn Mean   ( ? ? ) Standard Deviation Standard Error T Statistics
INe-commerce platforms2345.98400.627950.627952.036 *
social media platforms2205.85450.725740.72574
VIe-commerce platforms2345.77780.822320.822322.441 *
social media platforms2205.57120.969070.96907
ENTe-commerce platforms2345.57550.839670.839671.794 ns
social media platforms2205.43180.867060.86706
PRe-commerce platforms2345.83760.881770.881773.105 **
social media platforms2205.56061.017291.01729
Note: ns: non-significant; * p < 0.05; ** p < 0.01.
Table 9. Results of the impact of platform difference of the theoretical model.
Path Coefficients-Diffp-Value
(E-Commerce Platforms-Social Media Platforms)(E-Commerce Platforms-Social Media Platforms)
H1aIN -> SP0.045 ns0.675
H1bVI -> SP−0.085 ns0.390
H1cENT -> SP0.074 ns0.445
H1dPR -> SP−0.056 ns0.598
H2aIN -> PD−0.233 *0.027
H2bVI -> PD0.062 ns0.565
H2cENT -> PD0.129 ns0.233
H2dPR -> PD−0.108 ns0.282
H3aIN -> TR0.021 ns0.815
H3bVI -> TR0.077 ns0.488
H3cENT -> TR0.14 ns0.147
H3dPR -> TR0.024 ns0.812
H4aIN -> SP - > ENG- > PI0.009 ns0.643
H4bVI -> SP - > ENG- > PI−0.005 ns0.777
H4cENT-> SP - > ENG- > PI0.011 ns0.544
H4dPR -> SP - > ENG- > PI−0.004 ns0.772
H5aIN- > PD- > PI0.053 *0.01
H5bVI- > PD- > PI0.025 ns0.271
H5cENT- > PD- > PI0.041 ns0.246
H5dPR- > PD- > PI0.024 ns0.13
H6SP- > PD- > TR−0.019 ns0.172
H7aIN- > TR- > PI0.004 ns0.886
H7bVI- > TR- > PI0.014 ns0.735
H7cENT- > TR- > PI0.032 ns0.325
H7dPR- > TR- > PI0.002 ns0.927
H8aSP- > TR- > PI−0.02 ns0.563
H8bPD- > TR- > PI0.051 *0.02
H9ENG -> PI−0.178 ns0.069
H10aSP- > ENG- > PI−0.116 ns0.105
H10bPD- > ENG- > PI0.038 ns0.481
H10cTR- > ENG- > PI−0.116 ns0.105
Note: ns: non-significant; * p < 0.05.
Table 10. Results of the impact of gender difference on the theoretical model.
Total EffectIndirect Effect
CoefficientT Statistics CoefficientBootstrap 95% CIResults
PercentileBias Corrected
IN -> PI0.1224.440 ***IN- > SP- > ENG- > PI0.031[0.010:0.057][0.011:0.059]optimum
IN- > SP- > TR- > PI0.01[0.002:0.021][0.003:0.022]
IN- > SP- > TR- > ENG- > PI0.007[0.001:0.015][0.002:0.016]
IN- > PD- > PI0.014[0.001:0.036][0.001:0.037]
IN- > PD- > ENG- > PI0.01[0.001:0.024][0.002:0.026]
VI- > PI0.2188.000 ***VI- > SP- > ENG- > PI0.026[0.010:0.043][0.012:0.047]
VI- > SP- > TR- > PI0.009[0.002:0.019][0.002:0.020]
VI- > SP- > TR- > ENG- > PI0.006[0.001:0.014][0.001:0.015]
VI- > PD- > PI0.006[0.001:0.014][0.001:0.015]
VI- > PD- > ENG- > PI0.017[0.005:0.031][0.006:0.035]
VI- > TR- > PI0.072[0.033:0.118][0.036:0.122]optimum
VI- > TR- > ENG- > PI0.047[0.026:0.071][0.029:0.075]
ENT- > PI0.2127.666 ***ENT- > SP- > ENG- > PI0.026[0.009:0.047][0.010:0.050]
ENT- > SP- > TR- > PI0.008[0.002:0.018][0.002:0.019]
ENT- > SP- > TR- > ENG- > PI0.006[0.001:0.013][0.001:0.013]
ENT- > PD- > PI0.041[0.009:0.080][0.01:0.0810]
ENT- > PD- > ENG- > PI0.03[0.009:0.055][0.011:0.058]
ENT- > TR- > PI0.049[0.020:0.085][0.02:0.0860]optimum
ENT- > TR- > ENG- > PI0.032[0.013:0.058][0.014:0.059]
PR- > PI0.1274.916 ***PR- > TR- > PI0.055[0.028:0.091][0.029:0.093]optimum
PR- > TR- > ENG- > PI0.036[0.017:0.063][0.017:0.065]
Note: ns: non-significant; *** p < 0.001.
Publisher’s Note: MDPI stays neutral with regard to jurisdictional claims in published maps and institutional affiliations.

