Article

Effect and Mechanism of Economic Circulation in the Middle and Lower Reaches of the Yellow River: Multiregional Input–Output Model and Industrial Complex Network Approaches

Institute of Science and Technology for Development of Shandong, Qilu University of Technology (Shandong Academy of Sciences), Jinan 250014, China
*
Authors to whom correspondence should be addressed.
Sustainability 2022, 14(19), 12922; https://doi.org/10.3390/su141912922
Submission received: 31 August 2022 / Revised: 1 October 2022 / Accepted: 3 October 2022 / Published: 10 October 2022

Abstract

:
China has implemented the Yellow River strategy, and the middle and lower reaches of the Yellow River (MLYR) play an important role in promoting the sustainable economic growth of China. However, the economic circulation of the MLYR is constricted by the imbalance and heterogeneity in the economy in the regions, and it is necessary to explore how economic circulation and sustainable development in the MLYR can be improved. In this study, based on the multiregional input–output tables for 2012 and 2017, we developed a MLYR multiregional input–output model; applied indicators, such as intraregional multiplier, interregional feedback, and spillover, to measure economic circulation effects; further developed the industrial circular network; and designed indicators of cycle length distribution, average cycle correlation, influence of the industrial cycle, and interactions of the weighted cycle to analyze the industrial circulation mechanism in the MLYR. We also analyzed the spatial and industrial structures of the economic circulation flows. The results show that economic linkages have been strengthened to a certain extent, but the imbalance in economic circulation is still prominent, and the imbalanced circular effects are determined by the characteristics of the cycles in the MLYR. The empirical findings contribute to several aspects of the theory of imbalanced economic development and provide an important perspective on, and feasible path for, achieving economic development. We suggest that policymakers should build a multi-dimensional innovation cooperation system, improve the digital connectivity of regions, and promote the green and low-carbon development of industry and the application of new energy technologies to achieve balanced, common, and sustainable economic development in the MLYR.

1. Introduction

The World Summit on Sustainable Development (WSSD) held in 2022 pointed out that, with the development of economic globalization, the gap between the Global North and South is widening and a “digital divide” is emerging with the development of information and communication technology. Achieving sustainable development is an urgent, major task facing all countries in the world. Many researchers have discussed information, capital, and other factors that affect economic growth and sustainable development. Bakare et al. discussed the positive roles of libraries, information managers, and information dissemination in achieving Nigeria’s sustainable development goals in the 21st century [1]. Maiwada et al. studied the economic growth of developing countries via the development and implementation of scientific and technological innovation capacity [2]. Wang et al. explored the impact and transmission mechanism of the spatial flow of local and adjacent regional factors on China’s regional economic growth using the three dimensions of capital, labor, and technology [3]. Zhao et al. studied how urbanization development, human capital investment, material capital investment, opening up, government financial burden, and other factors jointly have a certain impact on economic growth in northeast China [4]. As can be seen, the factors that affect the sustainable development of developing countries and regions are the research focus of scholars in China and abroad. “Sustainable development” means the coordinated development of the economy, society, and the environment [5]. The coupled economic–social–environmental complex system is composed of three subsystems, in which the economic subsystem is the sum of production, circulation, consumption, and distribution activities, and sustainable economic growth is the basis for achieving high-quality development [6].
Against this background, in 2021, China issued an outline document on the ecological protection and high-quality development of the Yellow River basin. As the Yellow River basin straddles the north–south border in China, one of the document’s objectives was to eliminate the serious economic imbalance between south and north China that hinders the sustainable development of China’s economy. The middle and lower reaches of the Yellow River (MLYR), including the provinces of Shanxi, Inner Mongolia, Shaanxi, Henan, and Shandong, represent the main industrial agglomeration of the Yellow River basin and span many important urban agglomerations and metropolitan areas, such as the Central Plains and the Shandong Peninsula [7]. However, in 2019, the gross domestic product (GDP) per capita of the MLYR was lower than the average in China. Large regional economic heterogeneity is also present in the MLYR. Before COVID-19, Shandong, which had the highest GDP in the MLYR in 2019, had a GDP 4.13 times that of Inner Mongolia, which had the lowest, and the economic growth rates in Henan and Shandong increased by 8.66% and 6.63%, respectively [8]. It can be seen that economic circulation in the MLYR is constricted by the imbalance and heterogeneity among the regions and the sustainability of economic growth is insufficient.
The national strategy has been issued, emphasizing the common goals and multiple tasks in the MLYR. However, determining how to organize the specific and effective implementation of this strategy based on the promotion of collaboration and interaction among the regions and sustainable economic growth is still under exploration. Determining how to solve the issue of economic imbalance at the policy level is a popular discussion topic and needs the support of relevant research. However, at present, research related to sustainable development in the Yellow River focuses more on ecological protection, water resource allocation, and other issues [9,10], and less on promoting its sustainable economic growth. The essence of sustained and steady economic growth is that all products and energy should be reasonably and permanently used in ongoing, two-way economic interaction and circulation. An interregional economic circulation system can be defined as the closed-loop interaction between intermediate production and demand (industrial chain) in multiple regions and industries [11]. The effective interregional economic circulation system in the MLYR is the foundation of its sustainable growth, and further helps coordinate economic development between north and south China. In this sense, the basis of policy design is to accurately grasp the level of internal economic interaction among regions and the mechanism of supporting or limiting the two-way interaction in regional economic development. Therefore, it is necessary to measure the effects of interregional economic circulation and analyze the dynamic mechanism of industrial economic circulation in order to explore how to improve the circulation system and sustainable development capacity in the MLYR. When an integrated industrial circular system is constructed in the MLYR, the market separation and the interregional trade barriers between the north and south economies in China will be broken and economic resources will be effectively transferred. In this way, developed south China can effectively drive the relatively undeveloped economy of north China. Thus, on this basis, in terms of optimizing economic circulation, solving the problem of imbalanced economic development, and achieving common and sustainable development, the correct implementation of policy can be identified.
Approaches such as spatial econometric models, Data Envelopment Analysis (DEA) and system dynamics (SD) were generally applied in the measurement of economic circular effects and the analysis of influencing factors. Kolade et al. adopted econometric methods and found that digital innovation had a significant positive impact on promoting the circular plastic economy, and the participation and influence of digital innovation were also limited by a series of institutional, infrastructure, and socio-cultural factors [12]. Based on a spatial panel model, a study analyzed the spatial effect of the regional circular economy driven by S&T innovation [13]. DEA can be used to estimate the circular economy performance, decompose the growth rate of the circular economy, and further test influences of environmental regulations on circular economy performance [14]. SD and Material Flow Analysis (MFA) were also integrated into Circular Economy theories [15]. By means of a system dynamics computable simulation model, the systemic effect of combining multiple product design and business model strategies for slowing and closing resource loops in a circular economy was analyzed [16]. In addition, Grey Relational Analysis can be used to assess the goals of the circular economy in countries [17]. Previous research suggests that the coordinated development level of interregional economic dual circulation was affected by scientific and technological innovation, scientific research funds, and other factors [18]. Market effects, geographical location, opening up, and industrial policy were found to be important factors that affect the preference of economic dual circulation [19]. These achievements can provide many valuable references. However, these methods emphasized the description of circulation process and evaluation of the one-way effect of specific factors. Furthermore, they are limited to the analysis of two-way influences and interactions of complex multi-economic factors across regions and industries, and exploration of mechanisms of economic growth in economic circulation. The essence of industrial circulation can be regarded as the extension and feedback of industrial chains that reflect industrial economic and technological relationships. Through interaction of product trade, and diffusion of technology and production factors among regional economic systems, total outputs among regions can be produced, which can be interpreted as economic feedback and spatial spillover effects [20,21]. Generally, compared with the above approaches, multiregional input–output model and industrial complex network approaches are advantageous in the identification of cross-regional and cross-industrial chains and analysis of interregional and inter-industrial interaction.
The multiregional input–output (MRIO) model has been widely used to measure two-way economic interaction among regions or industries [22,23]. In contrast to single regional input–output (SRIO) models, the MRIO model takes into account technological differences in regions, and links of industrial trade among regions. In the MRIO model, different economies and sectors are linked together through intraregional and interregional product trade, and intermediate products can be used to track the correlation, feedback, and spillover effects of industries among regions produced by trade exchanges [24]. Spillover effects occur to respond to the needs of other regions. Miller first applied the input–output model to measure feedbacks effect produced by two regional economies, and then used this method to study interregional economic development [25]. Referring to Miller’s research, the multiplier decomposition method was proposed to divide interregional industrial interaction effects into intraregional multiplier, interregional feedback, and spillover effects [26]. The feedback effect was further decomposed into intraregional and interregional feedback effects, which were respectively called internal and external effects [27]. Wang et al. further verified the consistency of multiplicative and additive decompositions, and improved intraregional spillover, interregional spillover, and feedback effects according to final demand [28]. Through the MRIO model, Kim analyzed the close economic relationship between Gyeong Nam and other provinces in South Korea based on net closed-loop, net open-loop, and spillover effects [29]. Multiplier, spillover, and feedback effects can be introduced to comprehensively measure the induced total output of other regions and the total output induced by other regions [30]. It can be seen that interregional economic feedback and spillover effects comprise a systematic description of economic growth in the industrial circulation system. Therefore, the circular effects can be decomposed into interregional economic spillover and feedback effects measured by the MRIO, emphasizing forward spillover and reverse feedback effects of multiple regions.
Input–output (I–O) analysis is well established in the literature and its application procedures are substantially standardized, and the classic I–O model can provide a clear quantitative description of relationships among industries. However, experiences of different regions in many nations using the same or similar methods also addressed the limitations of this approach, which mainly relate to the core assumptions about the structure and nature of the economy [31,32]. A typical criticism of such I–O analysis is that the input coefficients are fixed and constant, which is too restrictive and unrealistic, because input coefficients can change with changing conditions [33]. Information obtained through input–output analysis is too scattered, and it is difficult to fully reflect structural features of industrial system, which means that under certain circumstances, it is possible to fail to capture the essence of regions in economic transition [34]. Despite these limitations, I–O models have proven to be significant tools for economic and industrial policymaking and have provided an empirical foundation for comparative analysis among different industries and economies [35]. To address the weaknesses of input–output analysis in processing structural information, another approach was introduced, namely, the industrial network, which takes industrial sectors as nodes and close economic relationships among industrial sectors as edges. Inputs in multiple sectors can be used in production of a specific commodity, and conversely, a commodity can also be used in the production process of multiple sectors, forming a complex interconnected industrial network system [36,37]. As a new quantitative method, industrial network integrates theories and research methods of statistics, topology, system dynamics, and other disciplines, comprehensively describing the whole structural characteristics of the network. This approach is capable of dynamic analysis and can better capture the essence of regions in economic transition, making up for a deficiency of I–O analysis [22,38]. The industrial circulation structure in networks can describe the internal mechanisms of regional economic growth [39]. Industrial fluctuations transmitted through the sector network can be fed back to the original industrial sector, and the shortest and the longest paths among industries reflect the industrial feedback in the network [40]. The simplest industrial loop is a two-way connecting path between two industries, and a more complicated structure is composed of more sectors. This is shown as a “cycle” on a network diagram, and cycle degree is an indicator to measure the ability of an industry to participate in circulation [41]. A circular network is an industrial circular structure that provides a new method for the study of evolution of industrial economic circular systems. However, few relevant studies exist on the construction of circular networks and measurement of circular structures. It is necessary to develop models and indicators that can more effectively explore the interregional industrial circulation mechanism.
Referring to the above literature, we found that great importance has been attached globally to sustainable development. Furthermore, the imbalance in economic growth in the MLYR seriously restricts its sustainable development, and even the coordination of development in China’s economy. However, the methods used in the existing research are not suitable and cannot be applied to these issues. Thus, in this study, we aimed to address the limitations associated with the effective implementation of national strategy to eliminate imbalances in economic circulation, and the lack of adequate empirical evidence on interregional economic circulation to support meaningful policy making. For this purpose, we combined the MRIO model and industrial complex networks, which are advantageous in the identification of cross-regional and cross-industrial chains, and undertook analysis of interregional and inter-industrial interactions, to explore how economic circulation and sustainable economic growth in the MLYR can be improved. In this paper, we propose systematic analytical frameworks of interregional economic circulation effects and the dynamic mechanism of the circulation system. First, the MLYR–MRIO model was constructed, and intraregional multiplier, interregional feedback, and interregional spillover effects were applied to measure interregional economic circulation effects. Second, indicators including cycle length distribution, the average cycle correlation, the influence of the industrial cycle, and the interactions of the weighted cycle on industrial circular network were designed to study the interregional dynamic circular mechanism. Based on results of China’s interregional input–output tables for 2012 and 2017, we tried to find the main process in which interregional circulation effects were hindered and explore the main structural factors. The findings contribute several aspects related to the theory of imbalanced economic development. We discuss policy recommendations to construct an effective internal circulation system and achieve balanced, common, and sustainable economic development in the MLYR.

2. Methods and Models

Interaction among multiple regions and sectors can be widely described by a multiregional input–output model, and measurements of factors such as multiplier, spillover, and feedback effects have been successfully applied in many empirical studies [21,28,30]. Approaches for construction of an industrial complex network have been greatly improved [42]. Based on an industrial complex network, structure indicators, such as overall, local, and individual industrial structural indicators, have been verified and effectively applied in exploring the structural evolution of economic systems [43,44]. Regarding circulation indicators in industrial networks, “cycles” are more sensitive to identifying the key functions of a network than previous group centrality indicators in real networks [45]. Referring to the above literature, the research framework designed in this paper is as follows. Firstly, traditional multiregional input–output models were used to measure industrial circulation effects of the MLYR. Secondly, the indicator system based on industrial circular network was designed to analyze interregional and inter-industrial economic circulation mechanisms. Finally, interregional industrial economic flow analysis was used to show the interregional and inter-industrial economic circulation process under the circulation mechanism.

2.1. MLYR–Multiregional Input–Output Model

A five-region input–output model was established. According to the decomposition method of Miller and Blair [25], Equation (1) can be obtained:
[ X 1 X 2 X 5 ] = ( I [ A 11 A 12 A 15 A 21 A 51 A 52 A 55 ] ) 1 [ Y 1 Y 2 Y 5 ] = [ M 11 M 12 M 15 M 21 M 51 M 52 M 55 ] [ Y 1 Y 2 Y 5 ]
where X r ( r = 1 , 2 , 3 , 4 , 5 ) is the total output of region r, Y r is the final use of region r, and A r s ( s = 1 , 2 , 3 , 4 , 5 ) is the direct consumption coefficient matrix of intermediate product inputs by region s to region r. M r s is the Leontief inverse matrix among regions, which can be decomposed as shown in Equation (2):
[ M 11 M 12 M 15 M 21 M 51 M 52 M 55 ] = [ L 1 0 0 0 0 0 0 0 L 5 ] + [ F 1 0 0 0 0 0 0 0 F 5 ] + [ 0 M 12 M 13 M 14 M 15 M 21 0 M 23 M 24 M 25 M 31 M 32 0 M 34 M 35 M 41 M 42 M 43 0 M 45 M 51 M 52 M 53 M 54 0 ]
where L r = ( I A r r ) 1 and F r = M r r ( I A r r ) 1 .
For region r, there are
X r = L r Y r + F r Y r + s = 1 , s r 5 M r s Y s = ( I A r r ) 1 Y r +   [ M r r ( I A r r ) 1 ] Y r + s = 1 , s r 5 M r s Y s
In Equation (3), L r = ( I A r r ) 1 is used to measure the multiplier effect in regions, which reflects the impact of adding one unit in the final use of a region to the total output of the region through interactions of industries, and describes economic relationships among industries and sectors [46]. M r s represents the spillover effect of the total output of region r and the final use of region s to region r, and describes the spillover effect of the economic development of region s to region r [47]. F r = M r r ( I A r r ) 1 is used to measure interregional feedback effect on region r after the final use of region r has an impact on region s, which does not include the increase in the total output due to the interaction among industries within regions [48]. By summing the matrix elements, the multiplier effect (ME) within regions, spillover effect (SE), and feedback effect (FE) can be obtained in Equations (4)–(6). The principle of ME, SE, and FE is shown in Figure 1.
M E r = i j L i j r
S E r s = i j M i j r s
F E r = i j F i j r

2.2. Industrial Circular Network Model

The interregional industrial network (IRIN) is a complex system with industrial sectors as nodes and inter-sectoral technological linkages as edges. Weights of edges are measured by the interregional direct consumption coefficients. In the IRIN, a closed path that takes any node as a starting node, passes through non–repeating nodes along non-repeating edges, and then returns to the starting node, is defined as an industrial cycle. The closed path starting from any node, traveling non-repeating edges once and only once, and then returning to the starting node in the IRIN, is defined as the interregional industrial circular network (ICN), which is abstracted as a graph ICN = ( V ,   E ,   W ) composed of a node set V , an edge set E , and a weight set W . The ICN is an Euler–network in which most nodes are formed by the merger and agglomeration of industrial cycles, and the in-degree of any node is equal to its out-degree. The ICN is a relatively independent circular sub-network of the IRIN, describing the industrial trajectory and dynamic feedback function of economic growth, and contains closed industrial chains and industrial functional circular subgroups (cycles). In essence, a cycle is a closed industrial chain, where multi-level and sustainable economic activity increases along an industrial chain, and then the source power of a regional economic system forms. The more complex the ICN, the richer the means and paths of technology and economic circulation. An input technology coefficient less than 1 indicates attenuation of the production trigger and demand feedback on industrial chains. The longer a cycle, the greater the attenuation. Therefore, the cycle length and the weight of a cycle are important characteristics when describing circulation chains, and indicator (a) and indicator (b) can be designed. In order to compare differences in the circulation capacity of cycles, indicator (c) and indicator (d) were designed to describe internal circulation capacity and external circulation capacity, respectively, as shown in Figure 2.
(a)
Cycle length and relative frequency. The cycle length l is defined as the quantity of edges contained in a cycle and the cycle length relative frequency describes the relative quantity of industrial cycles to the present status of industrial cycles of each length [49]. The proportion of industrial cycles with cycle length equaling l in all the industrial cycles is defined as CF(l), as shown in Equation (7). The larger the proportion, the greater the circular influence of cycles of this length.
C F ( l ) = N ( l ) N ( l )
where N ( l ) is the number of industrial cycles with cycle length of l in the ICN.
(b)
Average cycle correlation. The weight of an edge has an important influence on the efficiency of a network and is an important indicator in network analysis [50]. The average cycle correlation refers to the economic relevance of one edge in an industrial cycle, which describes the circulation ability of transmission and feedback of industrial cycles in economic circulation, as shown in Equation (8). The greater the value of A C ( l ) , the more economic outputs induced by circular industrial chains of this length in the ICN.
A C ( l ) = f = 1 , L ( f ) = l Q C W ( f ) l × N ( l )
where W ( f ) is the weight of industrial cycle f, L ( f ) is the length of cycle f, N ( l ) denotes quantity of industrial cycles whose length is l, and Q C is the total number of industrial cycles in the ICN.
(c)
Influence of the industrial cycle. Different edge weight distributions help to reveal internal structures and organization mechanisms of different networks [51]. We believe that relative weights of cycles can measure the internal circulation function and status of cycles in the ICN. The influence of the industrial cycle refers to relative weights of all the cycles and functional effects of cycles with different lengths in the ICN, as shown in Equation (9). The larger the value, the stronger the capacity of sustainable economic supply of circular industrial chains in the ICN.
A I ( l ) = f = 1 , L ( f ) = l Q C W ( f ) W I C N
where W I C N represents the weight of the ICN, which is the sum of edge weights in the ICN.
(d)
Interactions of the weighted cycle. Relationships among nodes and the edge weight can be used to measure the structural balance of weighted networks [52]. We measure coordination among cycles by interactivity of weighted cycles. The interactions of the weighted cycle refer to the average number of relationships between a cycle and other cycles, which reflects the capability of interlocking other cycles with different lengths in the ICN, as shown in Equation (10). The larger the indicator, the stronger the capability of a circular industrial chain of this length in the ICN.
W I ( l ) = f = 1 , L ( f ) = l Q C W ( f ) W I C N × D ( f ) L ( f ) N ( l )
where D ( f ) represents the number of connected edges between a cycle and other cycles.
(e)
Interregional product circular flows. In order to present the circulation mechanism, the interregional net product transfer matrix T P W is applied [53].
T P W = P W P W T
where
P W = X T ( I W I C N ) 1
and X represents a column vector of total outputs.
The elements with negative values in the transfer matrix T P W are set to zero to more clearly represent the one-way net flow of products, and the net product distribution matrix T P n e t can be obtained. Based on T P n e t , net product trade inflows and outflows of regions are measured by Equations (13) and (14), respectively.
T P n e t i n = e T T P n e t
T P n e t o u t = T P n e t e
where e is the column vector with all the elements of “1”.

2.3. Data Source

The multiregional input–output tables in the MLYR are from “China Multiregional Input–Output Table 2012 and 2017” of Science Data downloaded in CEADS [54]. At completion of this study, the data after 2017 had not been published, so the multiregional input–output tables of the MLYR (Shanxi, Inner Mongolia, Shandong, Henan, and Shaanxi) for 2012 and 2017 were selected in this study. As economic systems are assumed to be stable in a certain period, these data still have practical significance. In the interregional input–output tables, each province has 42 industries (see Appendix A), and 210 sectors in the MLYR in total. We merged the 42 industries into 13 and obtained 65 sectors. MATLAB was used for data processing, GEPHI was used to visualize the ICN, and circulation flow among regions was visualized by ArcMap 10.5.

3. Results and Discussions

3.1. Analysis of Circulation Effects in the MLYR

Table 1 shows the ME, SE, and FE of the five provinces in the MLYR. Generally speaking, the inter-industrial correlation within a region was considerably stronger than that among regions, so the intraregional multiplier effect was much greater than interregional spillover and interregional feedback effects, which is consistent with research results of other scholars [48,55].
Firstly, the ME showed a decreasing trend, and independence of economic development of the provinces in the MLYR was weakening. From 2012 to 2017, the decrease rate of the ME in Inner Mongolia was the highest, reaching 22.56%, while that in Shandong was the smallest, reaching 1.01%. Inner Mongolia was rich in animal husbandry products, and the products were exported to other regions and finely processed in the industry of the MLYR, which decimated the self-supply and self-demand, and accelerated improvement in long-term economic openness. Shandong was the third largest province in China’s economy and had substantial heavy and chemical industries, whose industrial chains were relatively complete. Shandong also had a relatively higher ME, with almost no change.
Secondly, the interregional economic linkage had been strengthened to a certain extent, but changes in the SE and FE in the MLYR were not equivalent. (a) The SE and FE in Shanxi and Henan showed an increasing trend. Shanxi is located in the central position of the MLYR; it consciously dropped its dependence on coal, expanded its opening-up and cooperation, and realized economic transformation and upgrading. Henan is connected geographically to relatively developed Shandong and underdeveloped Shanxi and Shaanxi. It not only transferred and transformed resources through service sectors, but also accelerated the flow of product trade through the logistics sector. (b) The SE and FE of Shaanxi and Shandong both showed decreasing trends. The population and economic scale of Shaanxi were small, its own resource advantages were not prominent, the market scope of product trade within and outside the region was small, and circulation effects were not strong. The return of capital, talent, technology, and other resources in Shandong was generally less than the spillover, resulting in negative growth in the SE and FE. (c) The increase in the FE and decrease in the SE in Inner Mongolia indicated that other provinces in the MLYR had made a high contribution to Inner Mongolia’s economic openness.
Combining these three indicators, we can find that levels of participation of provinces in the economic circulation of the MLYR were different. Although economic structures of Shandong and Shaanxi were heterogeneous, the two provinces faced the common problem that their interregional circulation effects were decreasing. Economic integration in Shandong and Shaanxi was staggering, and they were separated from the economic system of the MLYR. Henan and Shanxi played a relatively balanced role in promoting sustainable economic circulation of the MLYR. Inner Mongolia had effectively utilized the resources of the surrounding provinces. Their integration into the MLYR had been successful, and support for interregional economic circulation was strong.

3.2. Analysis of Industrial Circular Mechanism

The ICNs of the MLYR in 2012 and 2017 were constructed, as shown in Figure 3. The industrial nodes of Shanxi, Inner Mongolia, Shandong, Henan, and Shaanxi are represented by blue, red, purple, green, and yellow filled circles, respectively. In 2017, the ICN included 139 industrial nodes and 488 edges, and in 2012, there were 143 industrial nodes and 484 edges. The number of nodes decreased while the number of edges increased, indicating that complexity of the circulation mechanism was higher, and circular correlation among industries was stronger. In 2017, the ICN included 38 nodes in Shaanxi, 36 nodes in Henan, 30 nodes in Shandong, 19 nodes in Inner Mongolia, and 16 nodes in Shanxi.
The distributions of the indicators of the ICNs in the MLYR are shown in Figure 4, and the results are as follows:
(a)
The high-order cycles ( cycle   length [ 16 , 31 ] ) were composed of inter-provincial industrial chains, which had the strongest impact on interregional economic cooperation and product trade, but the number was greatly reduced. On the WI, interactions between the high-order cycles and the external cycles were strong, and were considerably higher in 2017 than those in 2012. With gradual extension of industrial circulation chains to the upstream and downstream industries, the coordination and integration of the high-order cycles in industrial economic circulation system were more effective, and economic feedback relationships were strengthened, which stimulated other circular cycles and supported economic sustainable growth. The numbers of industrial cycles of the MLYR in 2012 and 2017 were 9126 and 9902, respectively, while the proportion of the high-order cycles decreased from 44.69% to 27.39%. This was related to the decline in the SE and FE in Shandong and Shaanxi.
(b)
The low-order cycles ( cycle   length [ 2 , 7 ] ) with weaker robustness and multiple feedbacks were generally distributed on intersections of industrial chains from neighboring provinces. In 2017, the AC of the low-order cycles dropped considerably compared to 2012, and the stability of inter-provincial industrial chains was reduced. Both AI and WI of the low-order cycles in the industrial circulation system were always at a low level, and the low-order cycles were insufficient in promoting the growth in output. According to the above results, circular activities between Shanxi and Inner Mongolia were relatively active, which was attributed to producing the low-order cycles as a result of the geographical adjacency of these two provinces.
(c)
The middle-order cycles ( cycle   length ( 7 , 16 ) ) were mainly industrial cycles within a province, which meant that the industrial chains were relatively mature and stable. The number of middle-order cycles increased considerably, but it is difficult to promote industrial upgrading. In 2017, the CF of the middle-order cycles increased considerably, the influences in some regions of the MLYR were enhanced, and economic inner circulation was improved. From 2012 to 2017, the AC and AI of the middle-order cycles was maintained at a high level all of the time, which meant that stability and reorganization of industrial circular chains of medium length continued to be enhanced. This limited the interregional circulation effects of spillover and feedback in provinces such as Shandong and Shaanxi, decomposition of the middle-order cycles, and production of inter-provincial cycles.

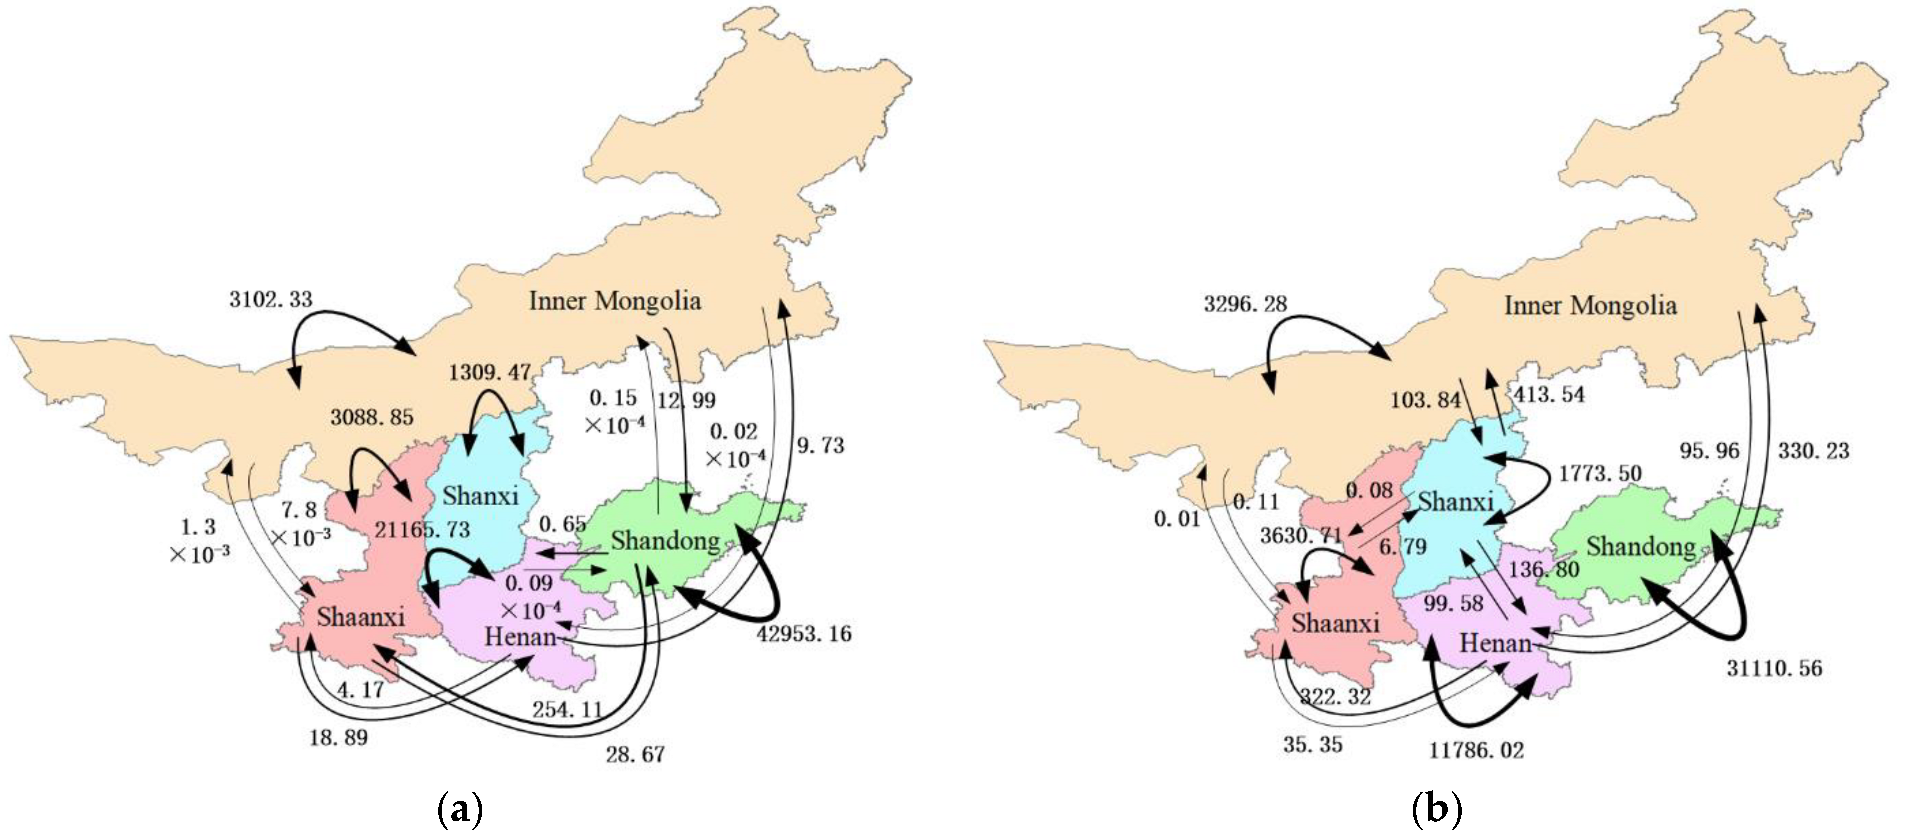
3.3. Analysis of Regional and Industrial Circulation Flow

The 42 industries in all the regions were merged into 13 industries to analyze trade flows among regions and industries of the MLYR under the circulation mechanism. The method of merging the industrial sectors is shown in Appendix A. The product trade flows among regions of the MLYR are shown in Figure 5.
On the whole, Shandong had the largest economic and trade flow and strong intra-provincial circulation, while the external economic circulation with other provinces was weakened. The internal and the external economic circulations in Shanxi were considerably improved, and proximity of economic flows deepened economic circulation with Shaanxi, Henan, and Inner Mongolia. Despite marginalization and underdevelopment of Inner Mongolia, its economic dependence on other regions increased. We can acquire the further findings: (a) The trade circulation within a province occupied a dominant position. In 2012 and 2017, as the middle-order cycles dominated economic inner circulation, the circulation flow within each province far exceeded the flow to other regions, and the ME was far greater than the SE and FE. In particular, in 2017, Shandong achieved internal circulation balance of inflow and outflow. The position of inner-industrial circulation of Shandong was prominent, and the ME was the highest. (b) Although the flow between two neighboring provinces was increasing, the circular paths were insufficient. Shanxi shifted from a regional demander to a supplier. In 2017, the net interregional trade flow of Shanxi was the largest, reaching CNY 34.021 billion, which flowed to Inner Mongolia, Henan, Shaanxi, and other surrounding provinces, increasing its SE and FE. However, in 2012, Shanxi’s economic development was relatively isolated from its neighboring provinces; in addition, Shandong’s trade and economic linkage with other provinces was weakened in 2017, and the SE and FE of the two regions were not high. As the low-order cycles mainly distributed among industrial chains of neighboring provinces were not robust, Shanxi in 2012 and Shandong in 2017 were out of the economic circulation of the five provinces. (c) The circulation flow among multiple regions decreased. The economic and trade flow between Inner Mongolia and non-neighboring Henan increased considerably; the economic flow returned from Henan was 3.44 times that imported to Henan, and their SF increased considerably. However, from 2012 to 2017, trade flows across more than three provinces decreased, such as Shanxi–Henan–Shaanxi and Shanxi–Inner Mongolia–Shaanxi. The economic circulation was hindered by insufficient high-order cycles.
The flow of product trade among industrial sectors of the MLYR is shown in Figure 6. The outflows of sectors are represented in different colors. The width of the flow represents the trade flow intensity. The direction of the flow represents the destination of the trade flow. The flow connected to outer rings represents outflow and the flow connected to inner rings represents inflow. Furthermore, the proportion of product trade of industrial sectors in the MLYR is shown in Figure 7. As a whole, the source of economic flow changed from the metal and non-metal industry in 2012 to the petrochemical industry in 2017, and intersection changed from the service industry in 2012 to the mining and processing industry in 2017. Moreover, in 2017, the inflows and outflows of electrical and water supply service industry were at a high level, the outflows of mining and processing, wood processing, and paper and printing industries were far higher than the inflows, and the inflows and outflows of food and tobacco, other manufacturing, and construction industries were at a low level.
The evolution of the industrial structures in all the regions led to the change in circular structure and promoted the internal circulation and external effects in the MLYR. (a) The complementarity of the industrial chains was the basis for integrating circular structure and optimizing circular effects. The regions had different industrial advantages, such as agricultural resources in Inner Mongolia, industrial resources in Shandong, and energy resources in Shanxi, which continuously supported the industrial chains to the upstream and downstream and produced stable middle-order cycles. In 2017, the economic flow of resource-based industries, such as the mining and dressing industry, and agriculture imported from other provinces to Inner Mongolia, increased by 35.37% and 14.17%, respectively, compared with 2012. Both the structure of industrial output flow in Shaanxi and circulation effects inside and outside the region did not change much. The adjustment in industrial structure enhanced the external circulation effect and promoted production of the low-order cycles across neighboring provinces. For example, the proportion of output flow of the service sector in each region increased, especially in Inner Mongolia, which increased by 64.20%, and in Shanxi, which increased by 21.53%. The inflow of light industries, such as paper and printing and food sectors, from other regions to Henan, also increased in the MLYR. (b) The leading industry of economic growth changed from the metal and non-metal industry to the petrochemical industry, which was attributed to the intersection of the high-order cycles. In 2017, the petrochemical industry became the largest net outflow sector, and showed the characteristics of diversified product destinations, and integration and utilization of oil resources, producing the high-order cycles. The proportion of external trade of the petrochemical industry in Henan and Shandong increased considerably, by 38.24% and 17.81%, respectively. However, the product flow of the metal and non-metal industry had been greatly weakened, which restricted evolution of the high-order cycles that can regulate interregional economic circulation.

4. Conclusions and Suggestions

Based on the multiregional input–output method, this paper analyzed intraregional multiplier, interregional feedback, and spillover effects of the five regions in the MLYR in 2012 and 2017. We found that the economic linkage had been strengthened to a certain extent, but the imbalance in economic circulation was still prominent, reflected in changes of the ME, FE, and SE, and Shandong and Shaanxi were not integrated into the economy system of the MLYR. Furthermore, we constructed the “cycle”, and analyzed the circulation mechanism based on the distributions of the CF, AC, AI, and WI in the MLYR to explore the circular relationship and structure bringing about the imbalance. We found that the imbalanced circular effects were determined by statistical characteristics and interactions of the cycles. For example, the high-order cycles composed of inter-provincial industrial chains had the strongest impact on interregional economic cooperation, the low-order cycles were distributed on the intersection of industrial chains from neighboring provinces, and the middle-order cycles were mainly within a province. However, the intraregional middle-order cycles were dominant, the low-order cycles were scarce, and the high-order cycles were not robust, which resulted in the interregional imbalance of the circulation system. Finally, we analyzed the spatial and industrial structures of economic circulation flow to confirm the above findings, and found that the evolution of industrial structures in all the regions can lead to changes in circular structure and promote internal and external effects in the MLYR.
The empirical findings of the MLYR can specifically contribute to several aspects of the theory of imbalanced economic development. Firstly, intraregional multiplier, interregional spillover, and feedback effects are effective measurements of the imbalance in regional economic development. Secondly, to a certain extent, the imbalanced economic development can be potentially determined by the circular mechanism in industrial cycles. For example, in some regions, the inner cycles and outer cycles have strong influence and stability, and growth of those regions is obviously advantageous, while in some other regions it is the opposite. Meanwhile, the number of middle-order cycles in relatively stable industrial chains is dominant, while the proportions of high-order cycles and new low-order cycles formed by interregional industrial chains are relatively low, which can further strengthen the advantages of relatively developed regions. This interlinkage of industrial structures can further aggravate the imbalance in economic development in the MLYR. Thirdly, we provided an important perspective on, and feasible path for, promoting regional coordination and sustainable economic development. Technological progress is achieved through scientific and technological innovation, and the economic development path can be transformed. By decomposing or extending the middle-order circular industrial chains in regions, cross-regional new low-order cycles and high-order cycles can be produced, forming a new economic growth path. In addition, we should promote participation of development and knowledge sharing of all the regions, all the industrial sectors, all kinds of market, and social players including individuals, enterprises, institutions, governments, and so on. In essence, the collaboration among high-order, middle-order, and low-order cycles needs to be strengthened, and value sharing and corporate responsibility need to be transmitted to society. Wider use of digital technology is also the key. In addition, according to the definition of sustainable development, sustainable economic growth cannot be separated from conservation of resources and environment. For example, the stability of the supply chain (industrial cycle) also needs to be matched with environmental resources in a sense. Therefore, strengthening green low-carbon production, protecting the ecological environment, and using new energy are guarantees for sustainable economic growth. Combining the perspectives of geographical adjacency and industrial complementarity, the following recommendations are given.
Firstly, policymakers should build a multi-dimensional innovation system to promote coordinated scientific and technological development in the MLYR. Scientific and technological innovation is a necessary condition for promoting high-quality economic development. The government can build industries and support companies that will embed and standardize scientific and technological innovation systems in its mission of sustainable development [2]. Enterprises can contribute to society through business investment, technology research and development, and by fulfilling social responsibilities, and thus promote sustainable development of regional economy [56,57]. The government can support innovative cooperation and industrial development by subsidies and joint projects. Through innovation collaboration of enterprises, universities, scientific research institutes, government agencies, financial institutions, and other multiple entities, the linkage and sharing of knowledge, technology, information, and platforms should be improved in the MLYR. Focusing on key business procedures, such as technology research and development, resource sharing, technology transfer and transformation, and product testing, we should build a regional information-sharing database, a comprehensive science and technology service platform, a technology transformation service platform, and a technology transfer alliance, to provide support for collaborative innovation and trade in the MLYR. In addition, it is necessary to establish a unified market, break separation and closure among industries and regions, and then strengthen the connection between innovation entities and the market.
Secondly, policymakers should take the new digital technology as the means to support industrial digitalization, digital industrialization, and economic and social intelligence, and promote connectivity of economic development in the MLYR. We should accelerate construction of digital communication, computing, and integrating infrastructures in the MLYR, including infrastructures for 5G base stations, gigabit optical fiber networks, satellite communication networks, data centers, artificial intelligence, blockchain, Industrial Internet of Things, Internet of Vehicles, and digital finance [58]. Development and application of new digital technologies contribute to narrowing economic development gap caused by the digital divide. Shandong should be responsible for taking the lead in developing blockchain, cloud computing, artificial intelligence, and other core digital technologies to serve the common basic requirements of the regions in the MLYR. Henan should focus on development of digital technology applications in the industries, including integrated circuits and intelligent terminals, and then the relative mature technologies should be effectively diffused and absorbed in other regions, such as Shanxi and Inner Mongolia. Further, the government should give priority to the development of new emerging digital technology services and induce investment in industrial clusters, such as software and information services, outsourced to each region in the MLYR. It should also support cooperation on software development, system integration, digital content, business process outsourcing, integrated circuit design, and industrial design.
Thirdly, policymakers should actively promote energy conservation and emission reduction in industries, and application of new energy technologies, so as to build green industrial chains and a circular ecosystem in the MLYR. Reducing energy consumption can promote coordinated economic development [59,60,61]. We should improve waste comprehensive utilization, energy cascade utilization, and resource recycling in traditional industries such as coal, chemical, non-ferrous metals, building materials, textiles, and light industries. For example, Shanxi should subsidize the centralized utilization of coal and improve the electrification rate in industrial terminals. In addition, as the Yellow River basin is abundant in new energy, new green energy industry should be an important option. Wind power, photovoltaic power, and offshore wind power in the MLYR should be promoted. New business programs integrating offshore wind power, marine ranching, hydrogen production and storage, seawater desalination, and marine chemicals should be fostered. The decentralized wind power and distributed photovoltaic bases in the Yellow River basin should be constructed and new energy development funds in the MLYR should be established. Leading enterprises in industrial chains, universities, and research and development institutions should take the lead in setting up sub-funds. The funding should mainly focus on leveraging the financial capital, attracting diversified social capital to participate in the development of a new energy industry.
Due to the lag of input–output tables, this study has some limitations, highlighting future research opportunities. In future research, we should pay attention to the updating method of input–output tables to better describe the current situation. Construction of carbon and water circular networks in the MLYR, and measurement of feedback and diffusion effects of carbon flow and water flow in the circulation system, can be studied in the future. In addition, we can further explore how controllers promote synchronization of the circular network based on network simulation technology, and how econometric, machine learning, and other methods are combined with input–output methods and even industrial networks to better grasp the essence of economic structure and development.

Author Contributions

Conceptualization, C.Y. and Y.C.; methodology, C.Y. and Y.C.; software, Y.C. and Y.L.; validation, C.Y., Y.C. and Y.L.; formal analysis, C.Y. and Y.C.; investigation, C.Y. and Y.C.; resources, C.Y., Y.C. and Y.L.; data curation, Y.C. and Y.L.; Supervision, C.Y.; writing—original draft preparation, C.Y. and Y.C.; writing—review and editing, C.Y., Y.C and Y.L.; visualization, Y.C.; supervision, C.Y.; project administration, C.Y. and Y.C.; funding acquisition, C.Y. All authors have read and agreed to the published version of the manuscript.

Funding

This research was supported by Planned Fund on Humanities and Social Sciences Research of Ministry of Education (grant number NO.22A10431011) and Shandong Humanities and Social Sciences Project (grant number 2021-JCGL-06).

Data Availability Statement

The original data used in this study are from the multiregional input-output tables of China from Science Data downloaded in CEADS. The data used to support the findings of this study are available from the corresponding author upon request.

Conflicts of Interest

The authors declare no conflict of interest.

Appendix A. Name and Number of Industrial Sectors

NO.Industrial SectorsSectors after MergerNO.Industrial SectorsSectors
after Merger
NO.Industrial SectorsSectors after Merger
1Agriculture, Forestry, Animal Husbandry and FisheryAgriculture15Manufacture of metal productsMetal and non-metal29Wholesale and retail tradesService
2Mining and washing of coalMining and dressing16Manufacture of general-purpose machineryEquipment manufacturing30Transport, storage, and postal services
3Extraction of petroleum and natural gas17Manufacture of special purpose machinery31Accommodation and catering
4Mining and processing of metal ores18Manufacture of transport equipment32Information transfer, software and information technology services
5Mining and processing of nonmetal and other ores19Manufacture of electrical machinery and equipment33Finance
6Food and tobacco processingFood and tobacco20Manufacture of communication equipment, computers and other electronic equipment34Real estate
7Textile industryTextile and clothing 21Manufacture of measuring instruments35Leasing and commercial services
8Manufacture of leather, fur, feather and related products22Other manufacturingOther manufacturing36Scientific research and polytechnic services
9Processing of timber and furnitureWood processing23Comprehensive use of waste resources37Administration of water, environment, and public facilities
10Manufacture of paper, printing and articles for culture, education and sport activityPapermaking and printing24Repair of metal products, machinery and equipment38Resident, repair and other services
11Processing of petroleum, coking, processing of nuclear fuelPetrochemical25Production and distribution of electric power and heat powerElectrical and water supply39Education
12Manufacture of chemical products26Production and distribution of gas40Health care and social work
13Manufacture of non-metallic mineral productsMetal and non-metal27Production and distribution of tap water41Culture, sports, and entertainment
14Smelting and processing of metals28ConstructionConstruction42Public administration, social insurance, and social organizations

References

  1. Bakare, O.; Okuonghae, N. Information Managers as Change Agents in achieving Sustainable Development in the 21st Century. J. Environ. Sci. Econ. 2022, 1, 58–66. [Google Scholar] [CrossRef]
  2. Maiwada, U.D.; Ahmad, A.J. Using Science, Technology, and Innovation (STI); in Achieving Sustainable Development in Developing Countries (DCS). J. Technol. Innov. Energy 2022, 1, 23–27. [Google Scholar] [CrossRef]
  3. Wang, L.H.; Zhao, X. Factor spatial flow, heterogeneous industrial agglomeration types and regional economic growth: An analysis based on the Yangtze River Delta and Northeast China. Study Explor. 2020, 1, 116–122. [Google Scholar]
  4. Zhao, X.Y.; Miao, X.T. On Development, Capital Investment and Regional Economic Growth-empirical Analysis Based on Data from Northeast China. J. Henan Norm. Univ. (Philos. Soc. Sci. Ed.) 2022, 49, 76–83. [Google Scholar]
  5. Zhu, J.Z.; Zhou, J.J. A study on the coordinated development of Beibu Gulf urban agglomeration with economic social environment coupling-taking Zhanjiang, Nanning and Haikouas examples. Mark. Wkly. 2022, 35, 39–43. [Google Scholar]
  6. Liu, Q.; Zhang, X.Q. Research on the Complex System of “Economy Society Environment” for High Quality Development of Green Economy in Shanghai in the New Era. Shanghai Qual. 2022, 8, 51–57. [Google Scholar]
  7. Ren, B.P.; Fu, Y.M.; Yang, Y.C. Measurement and improvement path of high-quality development level in Yellow River Basin. Stat. Inf. Forum 2022, 37, 89–99. [Google Scholar]
  8. National Bureau of Statistics. China Statistical Yearbook 2020; China Statistics Press: Beijing, China, 2021.
  9. Ning, Y.; Liu, Y.L.; Du, J.Q.; Yang, Y.Q.; Wang, Y.F. Sustainable development assessment of the Yellow River Basin and the coordinated development strategy. Acta Ecol. Sin. 2022, 42, 990–1001. [Google Scholar]
  10. Xu, G.Y.; Xue, D. Drive High-quality Development of the Yellow River Basin with High-level ecological Protection. Acad. J. Zhongzhou 2021, 10, 26–32. [Google Scholar]
  11. Li, J.; Liu, Y. China’s national economic circulation: A perspective of the structural and regional network relations. Econ. Res. J. 2022, 57, 27–42. [Google Scholar]
  12. Kolade, O.; Odumuyiwa, V.; Abolfathi, S.; Schröder, P.; Wakunuma, K.; Akanmu, I.; Whitehead, T.; Tijani, B.; Oyinlola, M. Technology acceptance and readiness of stakeholders for transitioning to a circular plastic economy in Africa. Technol. Forecast. Soc. Chang. 2022, 183, 121954. [Google Scholar] [CrossRef]
  13. Cheng, Y.; Wang, J.J.; Wang, Z.P.; Zhang, L.L.; Chen, W. Spatio-temporal evolution and innovation-driven development of China’s regional circular economy performance. ChinaPopul. Resour. Environ. 2022, 32, 115–125. [Google Scholar]
  14. Shang, Y.P.; Song, M.L.; Zhao, X. The development of China’s Circular Economy: From the perspective of environmental regulation. Waste Manag. 2022, 149, 186–198. [Google Scholar] [CrossRef]
  15. Gao, C.K.; Gao, C.B.; Song, K.H.; Fang, K.J. Pathways towards regional circular economy evaluated using material flow analysis and system dynamics. Resour. Conserv. Recycl. 2020, 154, 104527. [Google Scholar] [CrossRef]
  16. Franco, M.A. A system dynamics approach to product design and business model strategies for the circular economy. J. Clean. Prod. 2019, 241, 118327. [Google Scholar] [CrossRef]
  17. Škrinjarić, T. Empirical assessment of the circular economy of selected European countries. J. Clean. Prod. 2020, 255, 120246. [Google Scholar] [CrossRef]
  18. Kang, D.W.; Zheng, Y.J.; Qin, Y. Study on the Coordinated Development Level and Influencing Factors of Dual Circulation Economy. J. Tech. Econ. Manag. 2022, 8, 97–102. [Google Scholar]
  19. Gao, A.G.; Gong, X. Research on the Measurement and Influencing Factors of China’s Digital Economy Dual Circulation Preference. J. Wuling 2022, 47, 35–43. [Google Scholar]
  20. Sonis, M.; Hewings, G.J.D.; Gazel, R. The structure of multi-regional trade flows: Hierarchy, feedbacks and spatial linkages. Ann. Reg. Sci. 1995, 29, 409–430. [Google Scholar] [CrossRef]
  21. Sun, L.Y.; Luo, Y.F. The spatial spillover effect of economic growth in Sichuan and Chongqing region: Based on inter-regional input-output tables. J. Chongqing Univ. Technol. (Soc. Sci.) 2021, 8, 37–48. [Google Scholar]
  22. Wang, T.; Xiao, S.; Yan, J.; Zhang, P. Regional and sectoral structures of the Chinese economy: A network perspective from multi-regional input–output tables. Phys. A Stat. Mech. Its Appl. 2021, 581, 126196. [Google Scholar] [CrossRef]
  23. Li, Y.; Luo, E.; Zhang, H.; Tian, X.; Liu, T. Measuring interregional spillover and feedback effects of economy and CO2 emissions: A case study of the capital city agglomeration in China. Resour. Conserv. Recycl. 2018, 139, 104–113. [Google Scholar] [CrossRef]
  24. Malik, A.; Lafortune, G.; Carter, S.; Li, M.; Lenzen, M.; Kroll, C. International spillover effects in the EU’s textile supply chains: A global SDG assessment. J. Environ. Manag. 2021, 295, 113037. [Google Scholar] [CrossRef] [PubMed]
  25. Miller, R.E.; Blair, P.D. Input-Output Analysis: Foundations and Extensions; Cambridge University Press: Cambridge, UK, 1985. [Google Scholar]
  26. Round, J.I. Decomposing Multipliers for Economic Systems Involving Regional and World Trade. Econ. J. 1985, 378, 383–399. [Google Scholar] [CrossRef]
  27. Dietzenbacher, E. Interregional Multipliers: Look backward, looking forward. Reg. Stud. 2002, 2, 125–136. [Google Scholar] [CrossRef]
  28. Wang, L.F.; Xie, R.; Yang, L.G.; Chen, X.J.; Xie, H.X. Two-way Spillover Effects of Economic Growth between China and Countries along the “Belt and Road”. China Soft Sci. 2020, 12, 153–167. [Google Scholar]
  29. Kim, D.H.; Seung, C.K.; Seo, Y.I. Multi-regional economic impacts of recreational fisheries: Analysis of Small Sea Ranch in Gyeong-Nam Province, Korea. Mar. Policy 2017, 84, 90–98. [Google Scholar] [CrossRef]
  30. Sun, L.Y.; Luo, Y.F. Research on the spillover effects of the three growth poles on the Chengdu-Chongqing economic circle. Resour. Dev. Mark. 2022, 1–11. Available online: http://kns.cnki.net/kcms/detail/51.1448.n.20220808.0943.005.html (accessed on 24 September 2022).
  31. Kim, Y.J.; Lee, S.G.; Trimi, S. Industrial linkage and spillover effects of the logistics service industry: An input–output analysis. Serv. Bus. 2021, 15, 231–252. [Google Scholar] [CrossRef]
  32. Erkok, B. Current Account Deficit and Automotive Sector Nexus in Turkey: An Input-Output Analysis. Sosyoekonomi 2021, 29, 113–129. [Google Scholar] [CrossRef]
  33. Kim, K.H.; Kim, J.H.; Yoo, S.H. An Input-Output Analysis of the Economic Role and Effects of the Mining Industry in South Korea. Minerals 2020, 10, 624. [Google Scholar] [CrossRef]
  34. Norbu, N.P.; Tateno, Y.; Bolesta, A. Structural transformation and production linkages in Asia-Pacific least developed countries: An input-output analysis. Struct. Chang. Econ. Dyn. 2021, 59, 510–524. [Google Scholar] [CrossRef]
  35. Stamopoulos, D.; Dimas, P.; Tsakanikas, A. Exploring the structural effects of the ICT sector in the Greek economy: A quantitative approach based on input-output and network analysis. Telecommun. Policy 2022, 46, 102332. [Google Scholar] [CrossRef]
  36. Leontief, W. The economy as a circular flow. Struct. Chang. Econ. Dyn. 1991, 2, 181–212. [Google Scholar] [CrossRef]
  37. Tang, M.; Hong, J.; Liu, G.; Shen, G.Q. Exploring energy flows embodied in China’s economy from the regional and sectoral perspectives via combination of multi-regional input–output analysis and a complex network approach. Energy 2019, 170, 1191–1201. [Google Scholar] [CrossRef]
  38. Xun, Y.; Shi, W.S.; Liu, T. Research on the Structural Characteristics of Entertainment Industrial Correlation in China: Based on Dual Perspective of Input-Output and Network Analysis. Complexity 2021, 2021, 6426123. [Google Scholar] [CrossRef]
  39. Xiang, X.M. Research on inter-city economic linkage structure within a province: Based on the correction of Kij in the gravity model. Technol. Econ. 2020, 39, 128–137. [Google Scholar]
  40. Sharifkhani, A.; Simutin, M. Feedback loops in industry trade networks and the term structure of momentum profits. J. Financ. Econ. 2021, 141, 1171–1187. [Google Scholar] [CrossRef]
  41. Chen, G.Q.; Xiao, W.W. Research on the industrial association of financial industry in Shandong Province from the perspective of industrial network. Rev. Econ. Res. 2013, 47, 77–82. [Google Scholar]
  42. Yin, C. Modeling Industry Technology Flow Network and its Structural Effects. Sci. Technol. Prog. Policy 2017, 34, 62–70. [Google Scholar]
  43. Yin, C.; Ding, Q.Y.; Yang, Z.Y.; Cui, Y.X. Industrial Technology Diffusion Mechanism and Innovation Synergy Effect of Central Plains Urban agglomeration. Sci. Technol. Manag. Res. 2021, 41, 35–43. [Google Scholar]
  44. Yin, C. Introduction to Industrial Network Analysis; Social Science Literature Press: Beijing, China, 2018. [Google Scholar]
  45. Giscard, P.L.; Wilson, R.C. A centrality measure for cycles and subgraphs ii. Appl. Netw. Sci. 2018, 3, 9. [Google Scholar] [CrossRef] [PubMed] [Green Version]
  46. Huang, R.L.; Zhang, X. A Comparative Study of Industrial Multiplier, Spillover and Feedback Effect in the Yangtze River Delta Region-based on Multi-Region Input-output Model. Financ. Econ. Xinjiang 2020, 3, 17–28. [Google Scholar]
  47. Pan, W.Q. Regional economic development in China: An analysis based on spatial spillover effect. J. World Econ. 2015, 38, 120–142. [Google Scholar]
  48. Ye, Z.Y.; Jiang, Q.W. Industrial Linkage and Spatial Spillover Effects under Regional Integration of Yangtze River Delta. J. Nanjing Univ. Financ. Econ. 2020, 4, 34–44. [Google Scholar]
  49. Chen, X.Z. Comparative analysis of industrial cycle structure in Shandong Province. Dongyue Trib. 2015, 36, 98–102. [Google Scholar]
  50. Tian, L.; Di, Z.R.; Yao, H. Effect of distribution of weight on the efficiency of weighted networks. Acta Physica Sin. 2011, 60, 803–808. [Google Scholar] [CrossRef]
  51. Goswami, S.; Das, A.K.; Nandy, S.C. Sparsity of weighted networks: Measures and applications. Inf. Sci. 2021, 577, 557–578. [Google Scholar] [CrossRef]
  52. Yang, M.; Ma, L.; Wang, X.; Huang, M.; He, Q. An improved network structural balance approach based on weighted node-to-node influence with evolutionary algorithm. Appl. Soft Comput. 2020, 94, 106323. [Google Scholar] [CrossRef]
  53. Tan, Q.L.; Han, J.; Liu, Y. Correlation analysis and risk transfer of provincial virtual water flow based on input-output model. China Soft Sci. 2021, 6, 144–152. [Google Scholar]
  54. Zheng, H.; Bai, Y.; Wei, W.; Meng, J.; Zhang, Z.; Song, M.; Guan, D. Chinese provincial multi-regional input-output database for 2012 and 2017. Sci. Data 2021, 8, 244. [Google Scholar] [CrossRef] [PubMed]
  55. Wang, Y. The multiplier effect, spillover effects and feedback effects of the economic relationship between China and Japan. J. Int. Trade 2016, 4, 83–94. [Google Scholar]
  56. Jamil, M.N.; Rasheed, A.; Mukhtar, Z. Corporate Social Responsibility impacts sustainable organizational growth (firm performance): An empirical analysis of Pakistan stock exchange-listed firms. J. Environ. Sci. Econ. 2022, 1, 25–29. [Google Scholar] [CrossRef]
  57. Cristobal-Cipriano, C.M.; Arroyo, J.; Romualdo, A. Corporate Social Responsibility (CSR) Programs in Sarangani Province: Promotion of the Triple Bottom Line Framework of Sustainability. J. Environ. Sci. Econ. 2022, 1, 67–77. [Google Scholar] [CrossRef]
  58. Su, Y.; Li, Z.; Yang, C. Spatial Interaction Spillover Effects between Digital Financial Technology and Urban Ecological Efficiency in China: An Empirical Study Based on Spatial Simultaneous Equations. Int. J. Environ. Res. Public Health 2021, 18, 8535. [Google Scholar] [CrossRef] [PubMed]
  59. Jamil, M.N. Critical Analysis of Energy Consumption and Its Impact on Countries Economic Growth: An empirical analysis base on Countries income level. J. Environ. Sci. Econ. 2022, 1, 1–12. [Google Scholar] [CrossRef]
  60. Adebanjo, S.A.; Shakiru, T.H. Dynamic relationship between Air pollution and Economic growth in Jordan: An Empirical Analysis. J. Environ. Sci. Econ. 2022, 1, 30–43. [Google Scholar] [CrossRef]
  61. Jia, S.; Yang, C.; Wang, M.; Failler, P. Heterogeneous Impact of Land-Use on Climate Change: Study from a Spatial Perspective. Front. Environ. Sci. 2022, 10, 840603. [Google Scholar] [CrossRef]
Figure 1. Schematic diagram of interregional circulation effect.
Sustainability 14 12922 g001
Figure 2. Schematic diagram of indicators: (a) Principle of cycle length and relative frequency; (b) Principle of the average cycle correlation; (c) Principle of the influence of the industrial cycle; (d) principle of the interactions of the weighted cycle.
Sustainability 14 12922 g002
Figure 3. The industrial circular network structure in the MLYR. (a) ICN–2012; (b) ICN–2017.
Sustainability 14 12922 g003
Figure 4. The industrial circulation dynamic mechanism in the MLYR: (a) CF; (b) AC; (c) AI; (d) WI.
Sustainability 14 12922 g004
Figure 5. The regional flow structure of product trade in the MLYR (CNY 100 million): (a) 2012; (b) 2017.
Sustainability 14 12922 g005
Figure 6. The flow structure of product trade among various industrial sectors in the MLYR: (a) 2012; (b) 2017.
Sustainability 14 12922 g006
Figure 7. The proportion of industries’ trade flows of each region in the MLYR: (a) inflow–2012; (b) inflow–2017; (c) outflow–2012; (d) outflow–2017.
Sustainability 14 12922 g007
Table 1. The ME, SE, and FE in the MLYR.
RegionMESEFE
201220172012201720122017
Shanxi97.85193.7958.01410.2550.1670.191
Inner Mongolia116.53290.24011.3678.0680.4101.252
Shandong184.404182.53342.82626.8230.6570.138
Henan132.580110.43719.77920.3810.3530.628
Shaanxi106.96289.9839.3488.3270.5810.499
Publisher’s Note: MDPI stays neutral with regard to jurisdictional claims in published maps and institutional affiliations.

