Article

The Measurement and Spatiotemporal Evolution Analysis of an Ecological Niche for the High-Quality Development of Resource-Based Cities in China

1
Research Center of Energy Economics, School of Business Administration, Henan Polytechnic University, Jiaozuo 454003, China
2
Fanli Business School, Nanyang Institute of Technology, Nanyang 473004, China
*
Authors to whom correspondence should be addressed.
Sustainability 2022, 14(19), 12846; https://doi.org/10.3390/su141912846
Submission received: 31 July 2022 / Revised: 4 October 2022 / Accepted: 5 October 2022 / Published: 9 October 2022
(This article belongs to the Topic Resilience of Interdependent Urban Systems)

Abstract

:
The global carbon neutrality target and policy context of China’s high-quality development cause pressure to and are the driving forces of the transformation and development of resource-based cities. The current paper constructs an indicator system based on the ecological niche theory to measure and spatiotemporally analyze the ecological niche for the high-quality development in 115 resource-based cities in China. The results show that, firstly, the high-quality-development niches in resource-based cities are clustered on a medium level. Secondly, the differences in the sub-dimensional niche breadths are greater overall, with minor differences in the niche of resource and energy and considerable differences in the niche of innovation potential. Thirdly, we characterize the overall development imbalance following a more pronounced temporal evolution from the low to high niche over the decade. Based on the results, recommendations are made for resource-based cities to pinpoint and classify their strategies. The exploration of the comparative status, evolutionary dynamics and development paths for high-quality development in Chinese resource-based cities in this paper provides a systematic reference for building a new pattern of synergistic and sustainable development under the new normal of China’s economy.

1. Introduction

Over one third of prefecture-level cities in China are resource-based cities, with resource extraction and resource processing as the leading industries. The development of resource-based industries has produced significant benefits to the regional economic development for a certain period of time, but long-term resource dependence also causes weak economic growth, and thus, city development is not strong enough [1]. Meanwhile, resource-based industries are major carbon emitters, which add pressure to the regional ecological environment, and the contradiction between economic growth and the environment is acute [2]. At present, China has clarified the time frame of their carbon neutrality target. In order to reduce carbon emissions and adjust the energy consumption structure, corresponding policy adjustments are inevitable for resource-based cities [3]. In 2017, the Chinese government announced that China’s economy shifted from the stage of high-speed growth to the stage of high-quality development, focusing on meeting people’s aspirations for a better life and upholding the innovative, coordinated, green, open and shared development [4]. Subsequently, the relevant departments issued the “14th Five-Year Plan for Promoting High-Quality Development in Resource-based Areas”, which proposed more realistic goals and tasks for the high-quality development of resource-based cities [5]. Exploring the path of high-quality development in resource-based cities is not only beneficial for resource-based cities themselves to achieve more sustainable development, but it is also an important part of achieving China’s national strategic goals.
Regarding historical processes and the dilemma of resource-based cities, scholars have explored their high-quality development. In order to achieve a more thorough understanding of this, scholars have mostly focused on the five major aspects of the new development philosophy and analyzed the high-quality development of resource-based cities [6]. For example, Xu et al. understood the high-quality transformational development of resource-based cities as the path of the innovative development of resource-based cities concerning the development dilemma and analyzed the connotations of the high-quality development of a resource-based economy from six perspectives, such as a reasonable economic growth rate, optimized industrial structure, strong innovation drive, improved openness level, more sustainable development and shared development results [7]. Some scholars have attempted to establish an index system to evaluate high-quality development [8]. Some of the scholars used the five aspects highlighted by the new development philosophy to construct an evaluation system to measure the high-quality development of resource-based cities [9]. Some other scholars commonly considered resource-based cities as an economic–social–environmental synergistic development system [10,11], such as Liu et al., who evaluated the transformation effect of 81 resource-based cities in China from 2006 to 2017 based on the resource endowment perspective and life cycle theory [12]. By establishing and measuring an indicator system containing economic, social, and environmental aspects, it can be observed that the urban transformation effects in each economic region present an upward trend. Additionally, the industrial structure is one of the entry points for the research regarding the high-quality development of resource-based cities [13,14]. Many scholars have studied the impact of industrial structure upgrading and transformation and industrial green development on high-quality development in resource-based cities [15,16]. Long et al. proposed a method for selecting alternative industrial paths for resource-depleted cities by establishing a matrix of comparative advantages within the region [17]. In terms of the research region, it mostly focuses on a certain province or watershed area; for example, more attention is paid to the northeastern region [18,19,20], the Yellow River Basin [21], and the Ruhr region in Germany [22,23], while the exploration of spatial relationships from an integrated perspective is lacking.
The ecological niche theory was first proposed by the British biologist Grinnell [24]. He considered the ecological niche as “the ecological space occupied by an individual or a population” and defined the functional ecological niche as the space and condition necessary for the survival of a species. Through the research and exploration conducted by scholars, the ecological niche theory has gradually been applied to the fields of regional economy [25,26], industrial economy [27,28] and enterprise management [29,30,31,32], providing the direction and foundation for economic geography and urban development research [33,34,35,36]. Moreover, Zhu proposed that the ecological niche includes two aspects, “state” and “potential”, where “state” is a reflection of past development achievements and “potential” is a reflection of future growth [37]. The “potential” is the future growth potential [38]. From an ecological perspective, a resource-based city can be observed as a complex ecosystem, whose development depends on many resources and functions, including economic, social and environmental factors, and is constrained by the space it occupies. The goals and connotations of high-quality development in resource-based cities imply the state at present and the potential in the future of the city as a result of the resources on which it depends, as well as the state and space–time of past development and the interaction of the resources.
Since the existing literature on the high-quality development of resource-based cities is still in its initial stage, it is mostly an understanding of the status of past development and exploration in a considerable spatial scope. In China, the numerous numbers of resource-based cities and their wide spatial distribution, as well as the different resource endowments and development stages of each city, make it difficult for the past studies to practically solve the dilemma of choosing the paths of high-quality development for cities at different development levels under a comprehensive perspective. Therefore, the aim of this study is to address the issue of path selections for the differentiated development of China’s numerous resource-based cities from an integrated perspective.
Based on the ecological niche theory and the goal of the high-quality development of resource-based cities, the current paper constructs an indicator system and conducts a measurement using data obtained during 2009–2018. The high-quality-development niche of 115 resource-based cities is classified based on the measurement. Then, the niche breadth and differentiation index are measured based on the niche values. The characteristics and laws for the high-quality development of resource-based cities are examined from the perspective of the dynamic evolution of an ecological niche in terms of state and potential in this paper. Following that, by summarizing the evolution of the ecological niche, this paper addresses the issue of how resource-based cities with different ecological niches should choose differentiated paths for high-quality development.
The innovation of this paper mainly lies in the exploration of the comparative status, evolutionary trends and differentiated development paths for the high-quality development of resource-based cities in China from the perspective of ecological niches. Moreover, for the marginal contribution, the study of the high-quality development of resource-based cities in China will not only contribute to the national strategic goal of high-quality development in China, but also engender systematic approaches to the goal of promoting sustainable development for other countries with comparable resource endowments and populations, such as Brazil and India, at the national scale.

2. Materials and Methods

2.1. Construction of the Indicator System for the High-Quality-Development Niche

The construction of a systematic and scientific indicator system is the prerequisite for measuring the high-quality-development niche. According to the ecological niche theory of state and potential, the attributes of an ecological status include a state that represents the result of the interaction and accumulation of its resources and functions, as well as its influence on and dominance over the present and the future [39]. Based on the ecological niche theory, the current paper suggests that in the process of the development and evolution of resource-based cities, the various resources on which they rely and the various functions they perform form a relationship that is similar to the ecological niche changes among species in ecology. Based on this, this study defines the ecological niche of resource-based cities for high-quality development as the sum of the location, resources and functions that resource-based cities occupy in time and space under the constraints of certain environmental factors.
According to the interpretation of the concept of ecological niches for the high-quality development of resource-based cities, through the synthesis of the existing relevant research results and previous scholars’ understanding and classification of the ecological niche [39,40,41,42], the construction of the niche indicator system for the high-quality development of resource-based cities implies theoretical and practical considerations in three aspects. First, since economic, social, and environmental elements constitute the universal urban system, a vast amount of research concerning the transformation and sustainable development of resource-based cities is mostly based on the economic–social–environmental complex system [43]. Therefore, in this paper, we also selected the niche of economic base, the niche of people’s livelihood services and the niche of ecological environment to correspond to ecological niche sub-dimensions. In addition, considering the unique attributes of the resource endowment of resource-based cities, the niche of resource and energy was included as one of the ecological niches in the sub-dimension. Meanwhile, combined with innovation as the driving force of kinetic-energy transformation for China’s high-quality development goals, the niche of innovation potential was included as one of the sub-dimensional ecological niches. This constituted the indicator system of ecological niches for the high-quality development of resource-based cities in China.
Table 1 presents the indicator system for measuring the ecological niche for the high-quality development of resource-based cities in China. It consists of 39 indicators in 5 sub-dimension niches.
As shown in Table 1, the ecological niche for the high-quality development of economic base refers to the sum of the elements on which the economic development of this resource-based city relies, and eight indicators were selected. The indicators of economic development efficiency, industrial structure, financial capacity and economic decentralization reflect the connotation of coordinated, shared and openness developments in the high-quality development of resource-based cities.
The ecological niche for the high-quality development of resource and energy refers to the interaction between population distribution and the process of resource and energy development and utilization within the spatial scope of the city. Seven indicators were selected to reflect the high-quality green, coordinated and shared developments of the city in terms of the production of resources and the utilization of resources in resource-based cities. Among them, the indicator of resource dependence was selected to reflect the percentage of employees in the mining industry, which reflected the characteristics of resource endowment of resource-based cities [44].
The ecological niche for the high-quality development of ecological environment is the sum of resources utilized by economic activities and the ecological environment in the process of development and circulation within the spatial scope of the city, and eight indicators were selected to reflect the high-quality green and coordinated developments of resource-based cities.
The ecological niche for the high-quality development of people’s livelihood services is the sum of public-service resources and functions required by the resource-based city to meet the requirements of economic and social activities and people’s livelihoods. Nine indicators were selected to reflect the high-quality coordinated and shared development of the resource-based city.
The ecological niche for the high-quality development of the innovation potential is the sum of various inputs and outputs required for science and technology innovations in the city. Seven indicators were selected to reflect the driving role and development potential of high-quality innovative mechanisms, innovative subjects, and innovative outputs in resource-based cities [45].

2.2. Methods

2.2.1. Measurement of the High-Quality-Development Niche

The measurement of the high-quality-development niche takes a two-part approach. Firstly, the entropy weight TOPSIS method was chosen to measure the high-quality-development niche. Following this, the natural breaks classification method was used to classify the measurement results of the high-quality-development niche.
  • Measurement method
Most of the measurements of ecological niche are evaluated by establishing a system of indicators. However, there is not a uniform approach to the measurement of ecological niche. Although some scholars have studied the ecological niche breadth as the ecological niche, this study attempts to calculate the breadth of ecological niche based on objective weighting evaluation. Therefore, the entropy weight TOPSIS method was chosen as the method to measure the high-quality-development niche.
TOPSIS is a multi-objective approach to decision analysis [46]. It constructs positive and negative ideal solutions. The approach closes to the positive ideal solution and that at a distance from the negative ideal solution were taken as the evaluation basis, and the relative sticking progress was used to measure the degree to which each plan was close to the positive ideal solution and a distance from the negative ideal solution. Finally, the schemes were sorted according to the degree of closeness. The entropy method is a relatively common evaluation method used for objective weighting [47]. The weight of the evaluation index depends on the degree of variation in the index value, which can eliminate human factors and subjective evaluation to a certain extent, reflecting the relative importance of the indexes. The entropy weight TOPSIS method combines the advantages of the entropy weight and TOPSIS methods, effectively eliminates the deviation caused by subjectivity and calculates the distance between the measurement object and the optimal and worst solutions [48]. The number of calculations is small, and it is relatively intuitive.
The current study used the entropy weight TOPSIS method to measure the high-quality-development niche. First, use the entropy method to calculate the weights of 39 indicators. Then, the TOPSIS method is used to obtain the distance between each city and the best ideal solution. Subsequently, calculate the relative closeness of each city, that is, the niche value. Finally, rank the cities according to the relative closeness which is the high-quality-development niche in the current research. For each sub-dimensional niche, the same steps are repeated for the measurements.
The specific steps of the entropy weight TOPSIS model are as follows:
Step 1: Standardize the indicators to obtain a standardized matrix Z i j .
The attributes of each indicator in the evaluation system produced different dimensions and orders of magnitude. The original index data needed to be standardized so that the indicators of different units or magnitudes can be compared and weighted, making the data comparable. This study used the extreme value method to achieve the standardization of the original data [49].
Let X i j ( i = 1 , 2 , 3 , 4 , , n ,   j = 1, 2, 3, 4, …, m; n = 115, m = 39), the observation of the   j th index of the   i th city value, create matrix X = [ x 11 x 1 m x n 1 x n m ] . Firstly, standardize X i j to obtain Z i j :
Z i j = x i j m i n ( x i j ) m a x ( x i j ) m i n ( x i j ) , Z i j   is   the   positive   indicator
Z i j = m a x ( x i j ) x i j m a x ( x i j ) m i n ( x i j ) , Z i j   is   the   negative   indicator
Step 2: Use the Equation (3) to calculate the weight of the   i th city in the   j th indicator for that indicator, and then calculate the information entropy of each index   e j by using Equation (4).
P i j = Z i j i = 1 n Z i j
e j = 1 l n m i = 1 m p i j l n ( p i j )  
Step 3: Calculate the weight coefficient W j of the j th index.
W j = ( 1 e j ) j = 1 m ( 1 e j )  
Step 4: Determine the positive and negative ideal solutions Q i + and Q i of the city. Set Q i + as the maximum value of the   i th city in the   j th indicator among the objects, that is, the positive ideal solution. Set Q i as the minimum value of the   i th city in the   j th indicator among the objects, that is, the negative ideal solution. After determining the weight coefficient, use the TOPSIS method to select the decision-making plan. Establish a weighted matrix r i j of the niche indicators for the high-quality development of resource-based cities in China.
r i j = W j Z i j
Step 5: Let the maximum and minimum values of the j th index in 115 cities be represented by Q i + and Q i , respectively, and use Equations (7) and (8) to calculate the Euclidean distances D i + and D i :
D i + = j = 1 m ( Q j + r i j ) 2
D i = j = 1 m ( Q j r i j ) 2
Step 6: Calculate the relative closeness C i between each city i and the ideal solution by using Equation (9):
C i = D i ( D i + + D i )
  • Classification method
In order to classify the measurement results of the high-quality-development niche, resource-based cities should be classified based on the niche values. In this study, with the help of ArcGIS 10.2 software, the natural breaks classification (NBC) method is used to classify the high-quality-development niche in resource-based cities [50]. The natural breaks classification method is an objective method for analyzing statistical distributions in an attribute space. This method applies the thinking of cluster analysis, which is used to determine the classification intervals so that the similarity within each group is maximum, while the dissimilarity between external groups is maximum [51]. However, unlike clustering, which does not focus on the number and range of elements in each class, the natural breaks classification method lies in the fact that it also considers that the range and number of elements between each group are as similar as possible. The natural breakpoint classification method allows similar values to be grouped most appropriately, which minimizes the variation across categories [52]. This study proposes the use of natural breaks classification to classify the high-quality-development niche of resource-based cities into five classes, including low-niche cities, relatively low-niche cities, medium-niche cities, relatively high-niche cities and high-niche cities.

2.2.2. Measurement of the High-Quality-Development Niche Breadth

The measurement of the high-quality-development niche breadth is firstly calculated using the niche breadth model based on the theory of state and potential. Following this, the Spearman’s correlation test is used to verify the specific degree of influence of the sub-dimensional niche breadth on the high-quality-development niche.
  • The niche breadth model
The niche breadth for the high-quality development refers to the collection of all ecological factors possessed or available for the high-quality development of cities and is based on the measurement of the extent of the resources occupied by each ecological factor. The higher the value of the niche breadth, the higher the resource utilization rate and the higher the high-quality development of the city. In this study, resource-based cities are viewed as organisms in the ecological niche breadth theory, and their resource utilization is measured by measuring the ecological niche breadth of each sub-dimension of each city.
The current research measured the niche breadth based on the niche theories of the state and potential, indicating that the breadth of the niche was determined by the state and potential of the niche [39]. “State” describes the reality of the high-quality development of resource-based cities. “Potential” refers to the rate of change in the high-quality development of resource-based cities and the potential future development trends. The breadth of the niche depends on the state and potential of the resources it can obtain. The indicator of the potential takes every n year as the time scale, and the dimensional conversion coefficient is 1/n. Drawing lessons from the previous research conducted by scholars [42], the specific calculation equation is as follows:
N i = S i + A i P i j = 1 n ( S j + A j P j )
S i and P i are the state and potential of city   i . S j and P j are the state and potential of city j . A i and A j are the dimension conversion coefficients. n is the number of cities. ( S i + A i P i ) can be regarded as the absolute niche of city i . N i is the relative niche breadth of city i .
  • Spearman’s correlation
Spearman’s correlation was used to investigate the relationship between the niche and the sub-dimensional niches for high-quality development in resource-based cities to reveal the degree of influence of sub-dimensional niche breadth on the niche of high-quality development. The specific calculation equation is as follows:
r x y = 1 n i n ( R ( x i ) R ( x ) ¯ ) ( R ( y i ) R ( y ) ¯ ) ( 1 n i n ( R ( x i ) R ( x ) ¯ ) 2 ) ( 1 n i n ( R ( y i ) R ( y ) ¯ ) 2 )  
x and y are the parameters.   R ( x ) and   R ( y ) are ranks of the x and y variables. R ( x ) ¯ and R ( y ) ¯ are mean ranks. n is the total number of observations. i is the number of observations.

2.2.3. Measurement of the High-Quality-Development Niche Differentiation Index

  • Niche differentiation index model
In order to obtain the niche differences between cities in the study areas and to systematically understand the structural changes and spatial laws of the niche, a niche differentiation index is constructed as Equation (12) referring to the research of the relevant scholars [41]:
C = i = 1 n [ ( N i / N ¯ ) 1 ] 2 / n
C is the niche differentiation index of the study areas. N i is the niche breadth of city i . N ¯   is the mean value of the niche breadths. n is the number of cities.

2.3. Study Area and Data Sources

The subject of research of the current study was the resource-based cities in China, with the uneven process of urbanization all over the country [53]. Based on the National Sustainable Development Plan for Resource-based Cities (2013–2020), a total of 126 resource-based cities in China’s prefecture-level administrative regions were listed, including prefecture-level cities, regions, autonomous regions and leagues. To ensure data availability and reliability, 115 resource-based prefecture-level cities in China were ultimately selected for the study after excluding cities with severe data deficiencies.
As shown in Figure 1, the green areas are the resource-based, prefecture-level cities selected for this study at the national scale in China, with a total of 115 cities.
The data obtained for the 10 years from 2009 to 2018 were selected and then quantitatively analyzed. The data sources were the China City Statistical Yearbook, the statistical yearbooks of Chinese provinces and cities, and the statistical bulletins on the national economic and social development of Chinese cities. The PM2.5 data were obtained from the global PM2.5 concentration distribution map published in the International Geoscience Information Network of Columbia University. Missing data for individual cities and individual years were supplemented by the method of missing value estimation.

3. Results

In this section, the data calculation and results analysis were performed. Following the standardization of the raw data, based on the indicator system established in Section 2.1, the high-quality-development niche of resource-based cities is measured in Section 3.1 using the entropy weight TOPSIS model, and the natural breaks classification is used to classify the high-quality-development niches into five types. Following this, the results are analyzed spatially, temporally and evolutionarily. Based on the niche theories of the state and potential, the niche breadth model is used to measure and analyze the high-quality-development niche breadth. According to the niche breadth results presented in Section 3.2, the differentiation index for the high-quality-development niche of resource-based cities in China is measured and analyzed in Section 3.3.

3.1. Analysis of the High-Quality-Development Niche

By collating and calculating the data of the indicators, the raw data of each indicator of the 115 resource-based cities from 2009 to 2018 were globally standardized according to the indicator system presented in Table 1; the weights of each indicator were derived by using the entropy weight method, and the values of the high-quality-development niche and the sub-dimensional niche were calculated separately by using the TOPSIS method.
In terms of the overall measurement results, four cross-sections were selected for analysis: 2009, 2012, 2015, and 2018. The measurement results show that, from 2009 to 2018, the high-quality-development niche of resource-based cities presents an overall upward trend over the 10-year period, indicating that the high-quality-development niche of resource-based cities presents a positive and upward trend. In terms of growth trends, cities with high average growth rates over the calendar year included Karamay, Dazhou, Huzhou, Nanchong and Dongying, which are mainly western and eastern cities, while cities with low average growth rates over the calendar year included Hulunbeier, Hegang, Linfen, Liaoyuan and Anshan, which are mainly northeastern and western cities.

3.1.1. Analysis of the Classifications of the Niche Types

Based on the measurement results of the high-quality-development niche of resource-based cities, the natural breaks classification method was used to fracture 115 resource-based cities into five types of the high-quality-development niche, which were high-niche cities, relatively high-niche cities, medium-niche cities, relatively low-niche cities, and low-niche cities. Cities with a niche value above 0.3833 are high-niche cities. Cities with a niche value between 0.3728 and 0.3833 are relatively high-niche cities. Cities with a niche value between 0.3678 and 0.3728 are medium-niche cities. Cities with a niche value between 0.3636 and 0.3678 are relatively low-niche cities. Cities with a niche value below 0.3636 are low-niche cities.
Table 2 shows the classification and coding of the high-quality-development niche in resource-based cities, using 2018 as an example, and this set of codes is used in this paper later on. Due to space constraints, the measurement results of the high-quality-development niche of 115 resource-based cities in 2009, 2012, 2015 and 2018 can be reviewed in Table A1 in the Appendix A.
As presented in Table 2, it can be observed that in 2018, 75 of the 115 resource-based cities did not attain the mean value of high-quality-development niche of 0.3727, accounting for 65.21%, indicating that the high-quality-development niche of resource-based cities included space for upward mobility in general. At the same time, as can be seen from the percentages in Table 2, in 2018, fewer cities were in high and low niches of high-quality development, and more cities were in relatively low to relatively high niches, indicating that the high-quality-development niches in resource-based cities are clustered on a medium level.

3.1.2. Spatial and Temporal Evolution Analysis of the High-Quality-Development Niche

Once the high-quality-development niche was measured and classified, this section presents a spatial and temporal evolution analysis. Figure 2 shows the spatial evolution of the distributions of the high-quality-development niche in 2009, 2012, 2015 and 2018 in resource-based cities in China.
Figure 2 presents the spatial distributions in the years of 2009, 2012, 2015 and 2018 for the high-quality-development niches of resource-based cities in China. It can be observed that the relatively scattered high-niche cities and the relatively clustered and contiguous low-niche cities are the distinctive features of the spatial distribution for the high-quality-development niches of resource-based cities in China. Specifically, on the one hand, high-niche cities (Karamay, Huzhou, Dongying, etc.) were scattered, except for the northeastern cities. On the other hand, low-niche cities mainly accumulate in the provinces of Yunnan, Sichuan, Guangxi and Shanxi, and the accumulation areas were mainly in the western and central regions. Overall, the high-quality-development niche of resource-based cities in China present the spatial distribution characteristics of a decreasing development quality from east to west in that order.
By specifically observing the four regions in the Chinese landscape, including the northeast, east, west and central regions. Of the 115 resource-based cities, 19 are the north-eastern cities, 20 are the eastern cities, 39 are the western cities and 37 are the central cities. As presented in Table 3, it can be observed that the eastern resource-based cities consistently exhibit higher niches for high-quality development than the other three regions. A review of the measurement and classification results reveals that a total of 60% of the resource-based cities in the eastern region were the relatively high-niche cities and above-rated, while only 10.53% of the resource-based cities in the northeastern region were in this range. In contrast, 66.09% of all resource-based cities in the western and central regions were the middle-niche cities or the lower ranges, with 66.67% and 64.86% in these ranges, respectively.
In terms of the development trends, as presented in Table 3, 115 resource-based cities in China in the four regions exhibit a general upward trend in their high-quality-development niche in the time cross-section, with the greatest average increase rate being presented for cities in the eastern region and the lowest value in the northeast region. Specifically, the northeast region experienced a decline in its high-quality-development niche from 2012 to 2015, with a negative rate of increase, then continued to rise, and following a decade of development, its high-quality-development niche gradually lagged behind that of the western and eastern regions. In contrast, the growth rate of the high-quality-development niche in the western region accelerated, and the increasing trend was more evident from 2015 to 2018. Following the development, its high-quality-development niche increased from being lower than the other three regions in 2009 to a position second to only the eastern region, implying that the effect of high-quality-development niche was clearly presented.
Statistics on the distributions of the niche types for the high-quality development in resource-based cities in 2009, 2012, 2015 and 2018 help to portray the temporal evolution trend. Figure 3 illustrates the distributions of the niche for the high-quality development over the time cross-section as follows:
In terms of the temporal evolution, the period ranging from 2009 to 2018 presents an overall increase in high-quality-development niche, with significant fluctuations visible within the five niche types, with an increase in the number of high-niche cities and a decrease in the number of low-niche cities. In 2009, there were no high-niche cities for the high-quality development, but since then, a gradual increase occurred, with the number of high-niche cities gradually increasing from 2 (Huzhou and Panzhihua) to 10 between 2012 and 2018, and the proportion of the high-niche cities increased to 8.70% of all the resource-based cities in 2018. In relative terms, the number of the low-niche cities for high-quality development significantly decreased as a percentage over the decade. The proportion of low-niche cities decreased from 57.39% in 2009 to 33.04% in 2015, then plummeted to 3.48% in 2018; the proportion of medium-niche cities steadily increased while rising to the highest proportion, with 32.17% of the medium-niche cities present in 2018. The shares of the relatively low-niche cities and the relatively high-niche cities presented a different state, with the share of relatively-low-niche cities slowly increasing and then slightly decreasing, still accounting for 29.57% of the value; the share of relatively high-niche cities slowly increased to 26.09%. By 2018, more resource-based cities were relatively low-niche cities, medium-niche cites and relatively high-niche cities, while fewer cities were at the two ends of the scale. As presented in Figure 3, the overall temporal evolution presents an aggregation from the low niche to the medium, followed by a transition to the higher niche. More resource-based cities in China were clustered towards the middle level following a decade of development.

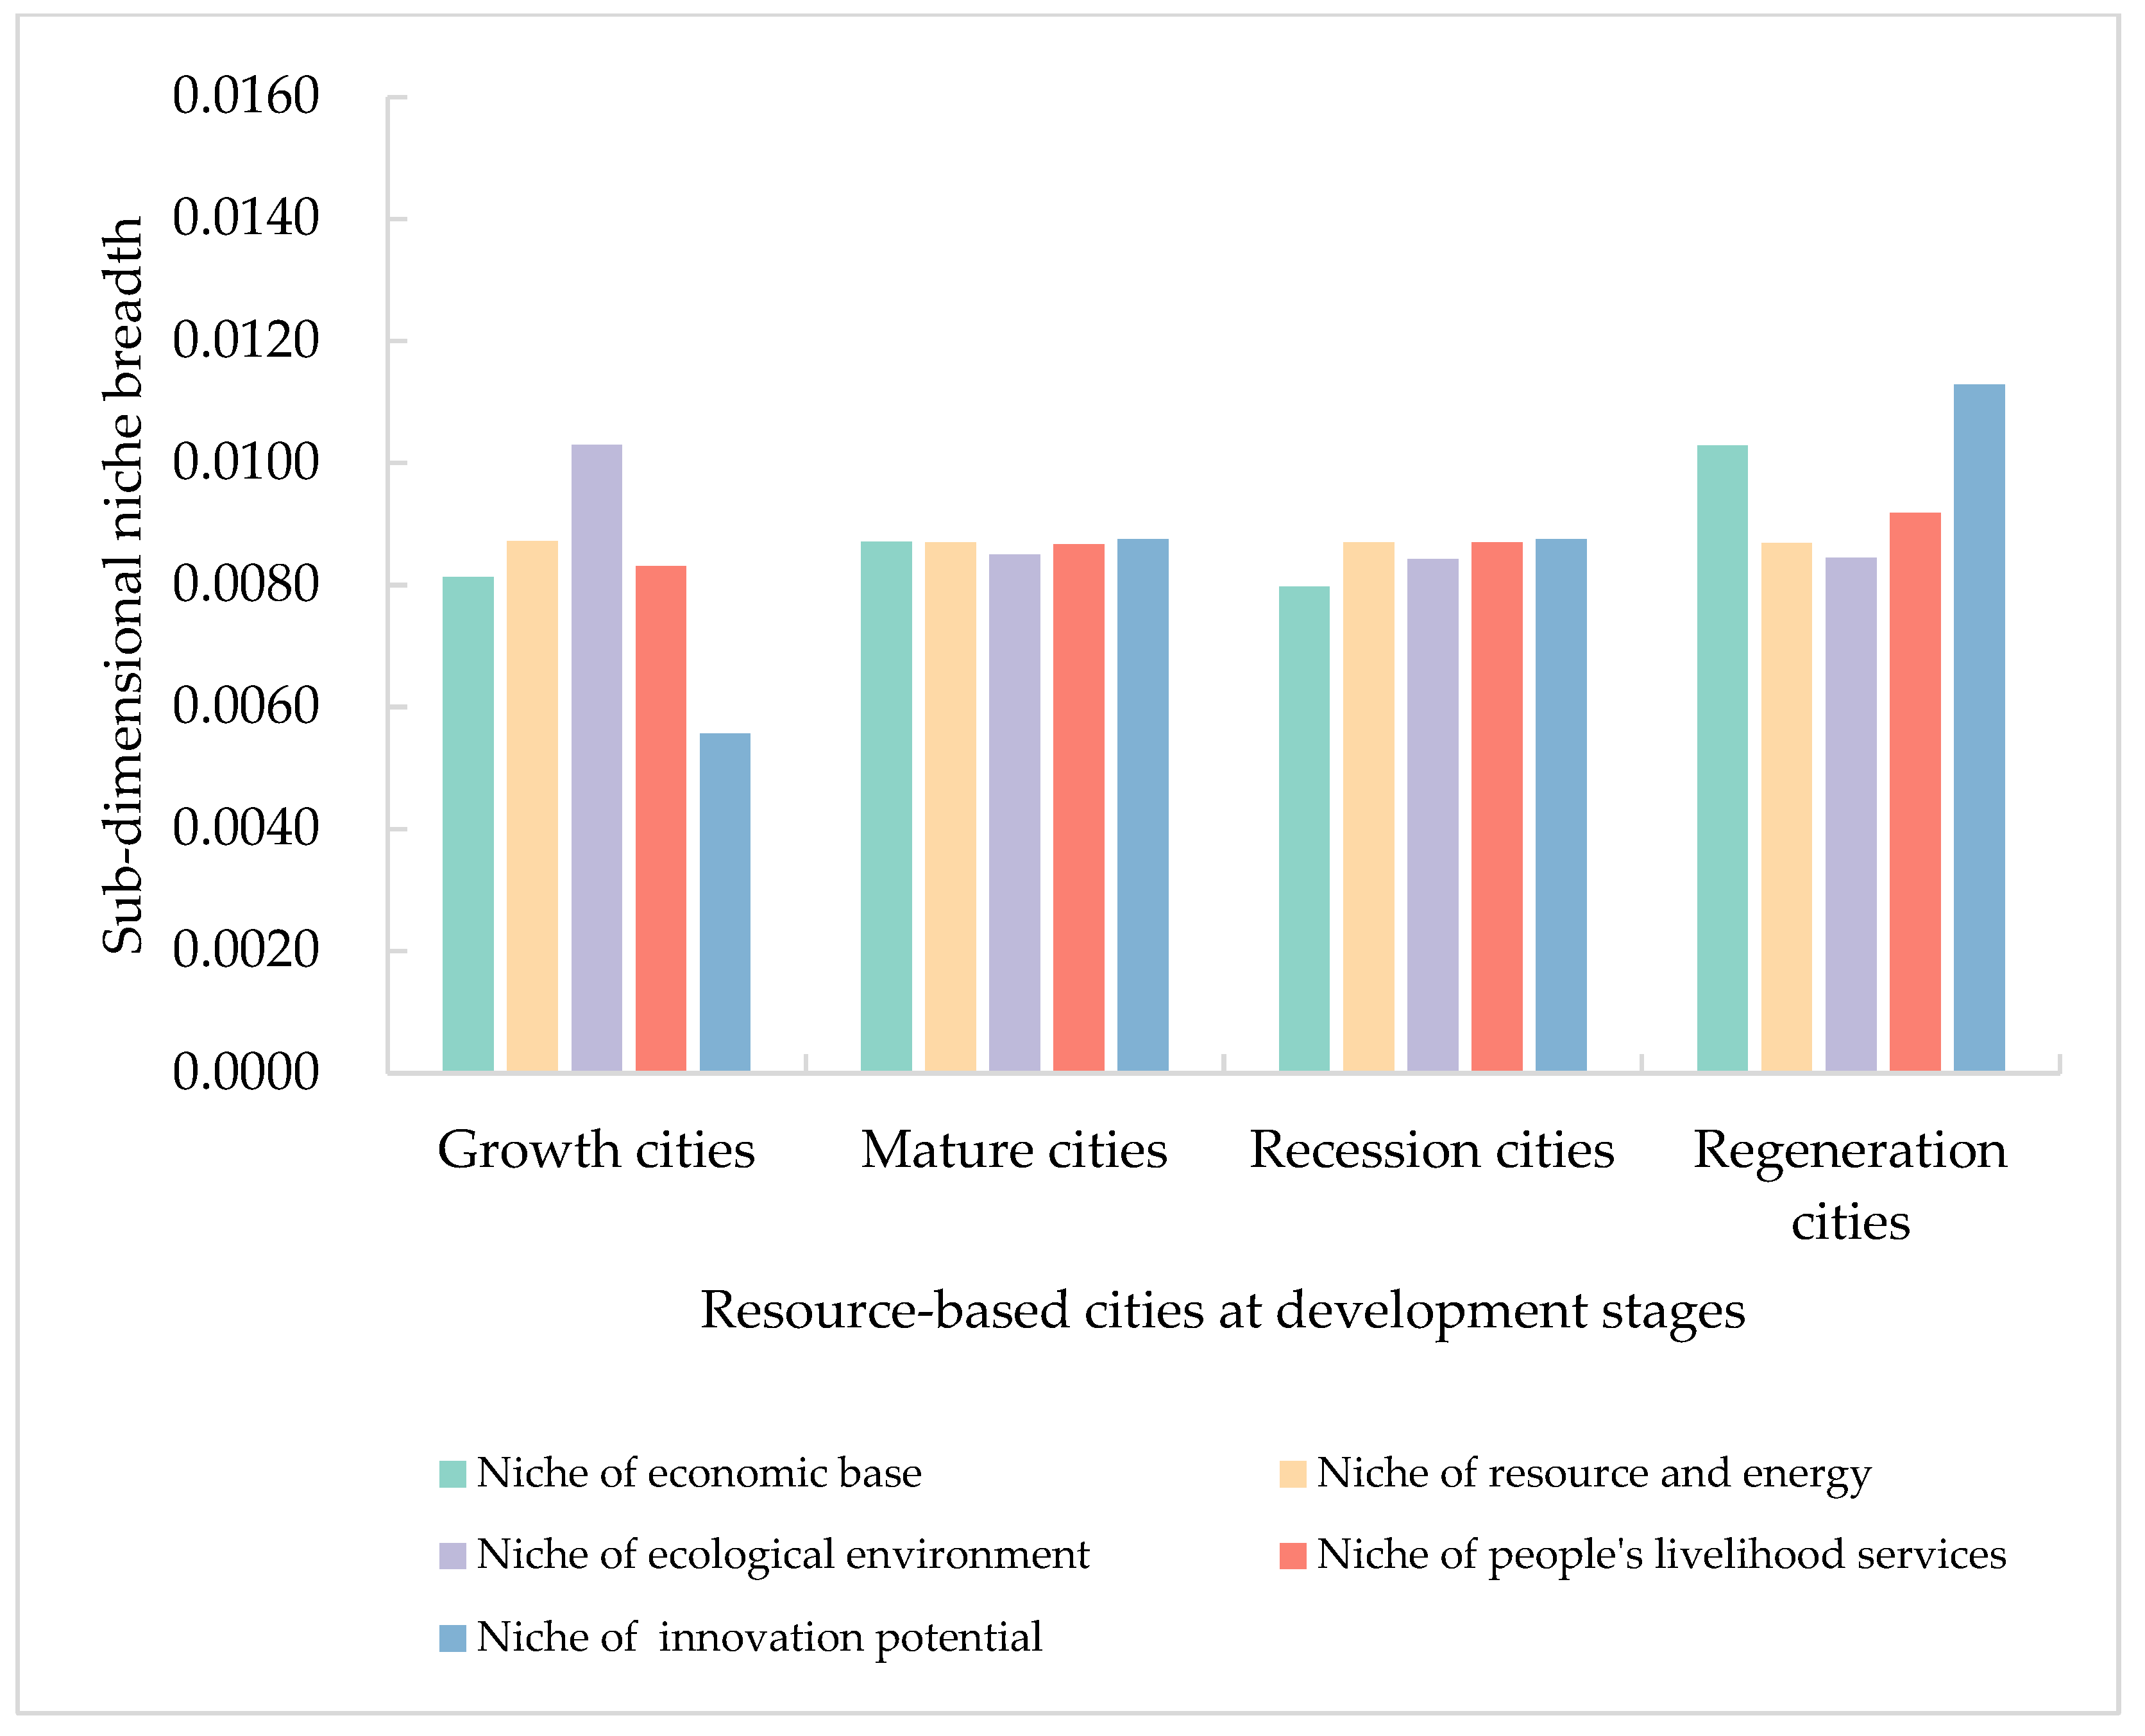
3.1.3. Analysis of the Niche of Resource-Based Cities in Different Development Stages

China’s resource-based cities were officially divided into four development stages including growth city, mature city, recession city and regeneration city in 2013. Therefore, the divergence in the niche for high-quality development in different development stages is also worth noting. Table 4 shows the temporal variation in the high-quality-development niche in resource-based cities in different development stages.
As shown in Table 4, in terms of the different development stages, there were 14 developing cities, 63 mature cities, 23 declining cities and 15 regenerating cities in the 115 resource-based cities. The average high-quality-development niche of resource-based cities in the different development stages exhibited an increasing trend during the decade. Among them, the regeneration cities presented the highest average-growth rate, while those in recession cities exhibited the lowest. At the same time, the high-quality-development niches of the regenerating resource-based cities were always higher than those in other growth stages, while the high-quality-development niches in growing, mature and recession cities were closer, with growth cities being the lowest.

3.2. Analysis of the High-Quality-Development Niche Breadth

Based on the niche theories of state and potential, we obtained the high-quality-development niche values of 115 resource-based cities as the “state” and the multi-year average growth as the “potential”. In the current paper, the selected time intervals were 3 years, 2 years, 2 years and 2 years, and the corresponding dimensional conversion coefficients were 0.33, 0.5, 0.5 and 0.5. The high-quality-development niche breadth of resource-based cities and the sub-dimensional niche breadth can be calculated according to Equation (10) in Section 2.2.2. The analysis of niche breadth for the high-quality development is then carried out in two aspects. Firstly, the sub-dimensional niche breadth is compared and analyzed, while later, the sub-dimensional niche breadth and the high-quality-development niche are tested for correlation to reveal the degree of influence.

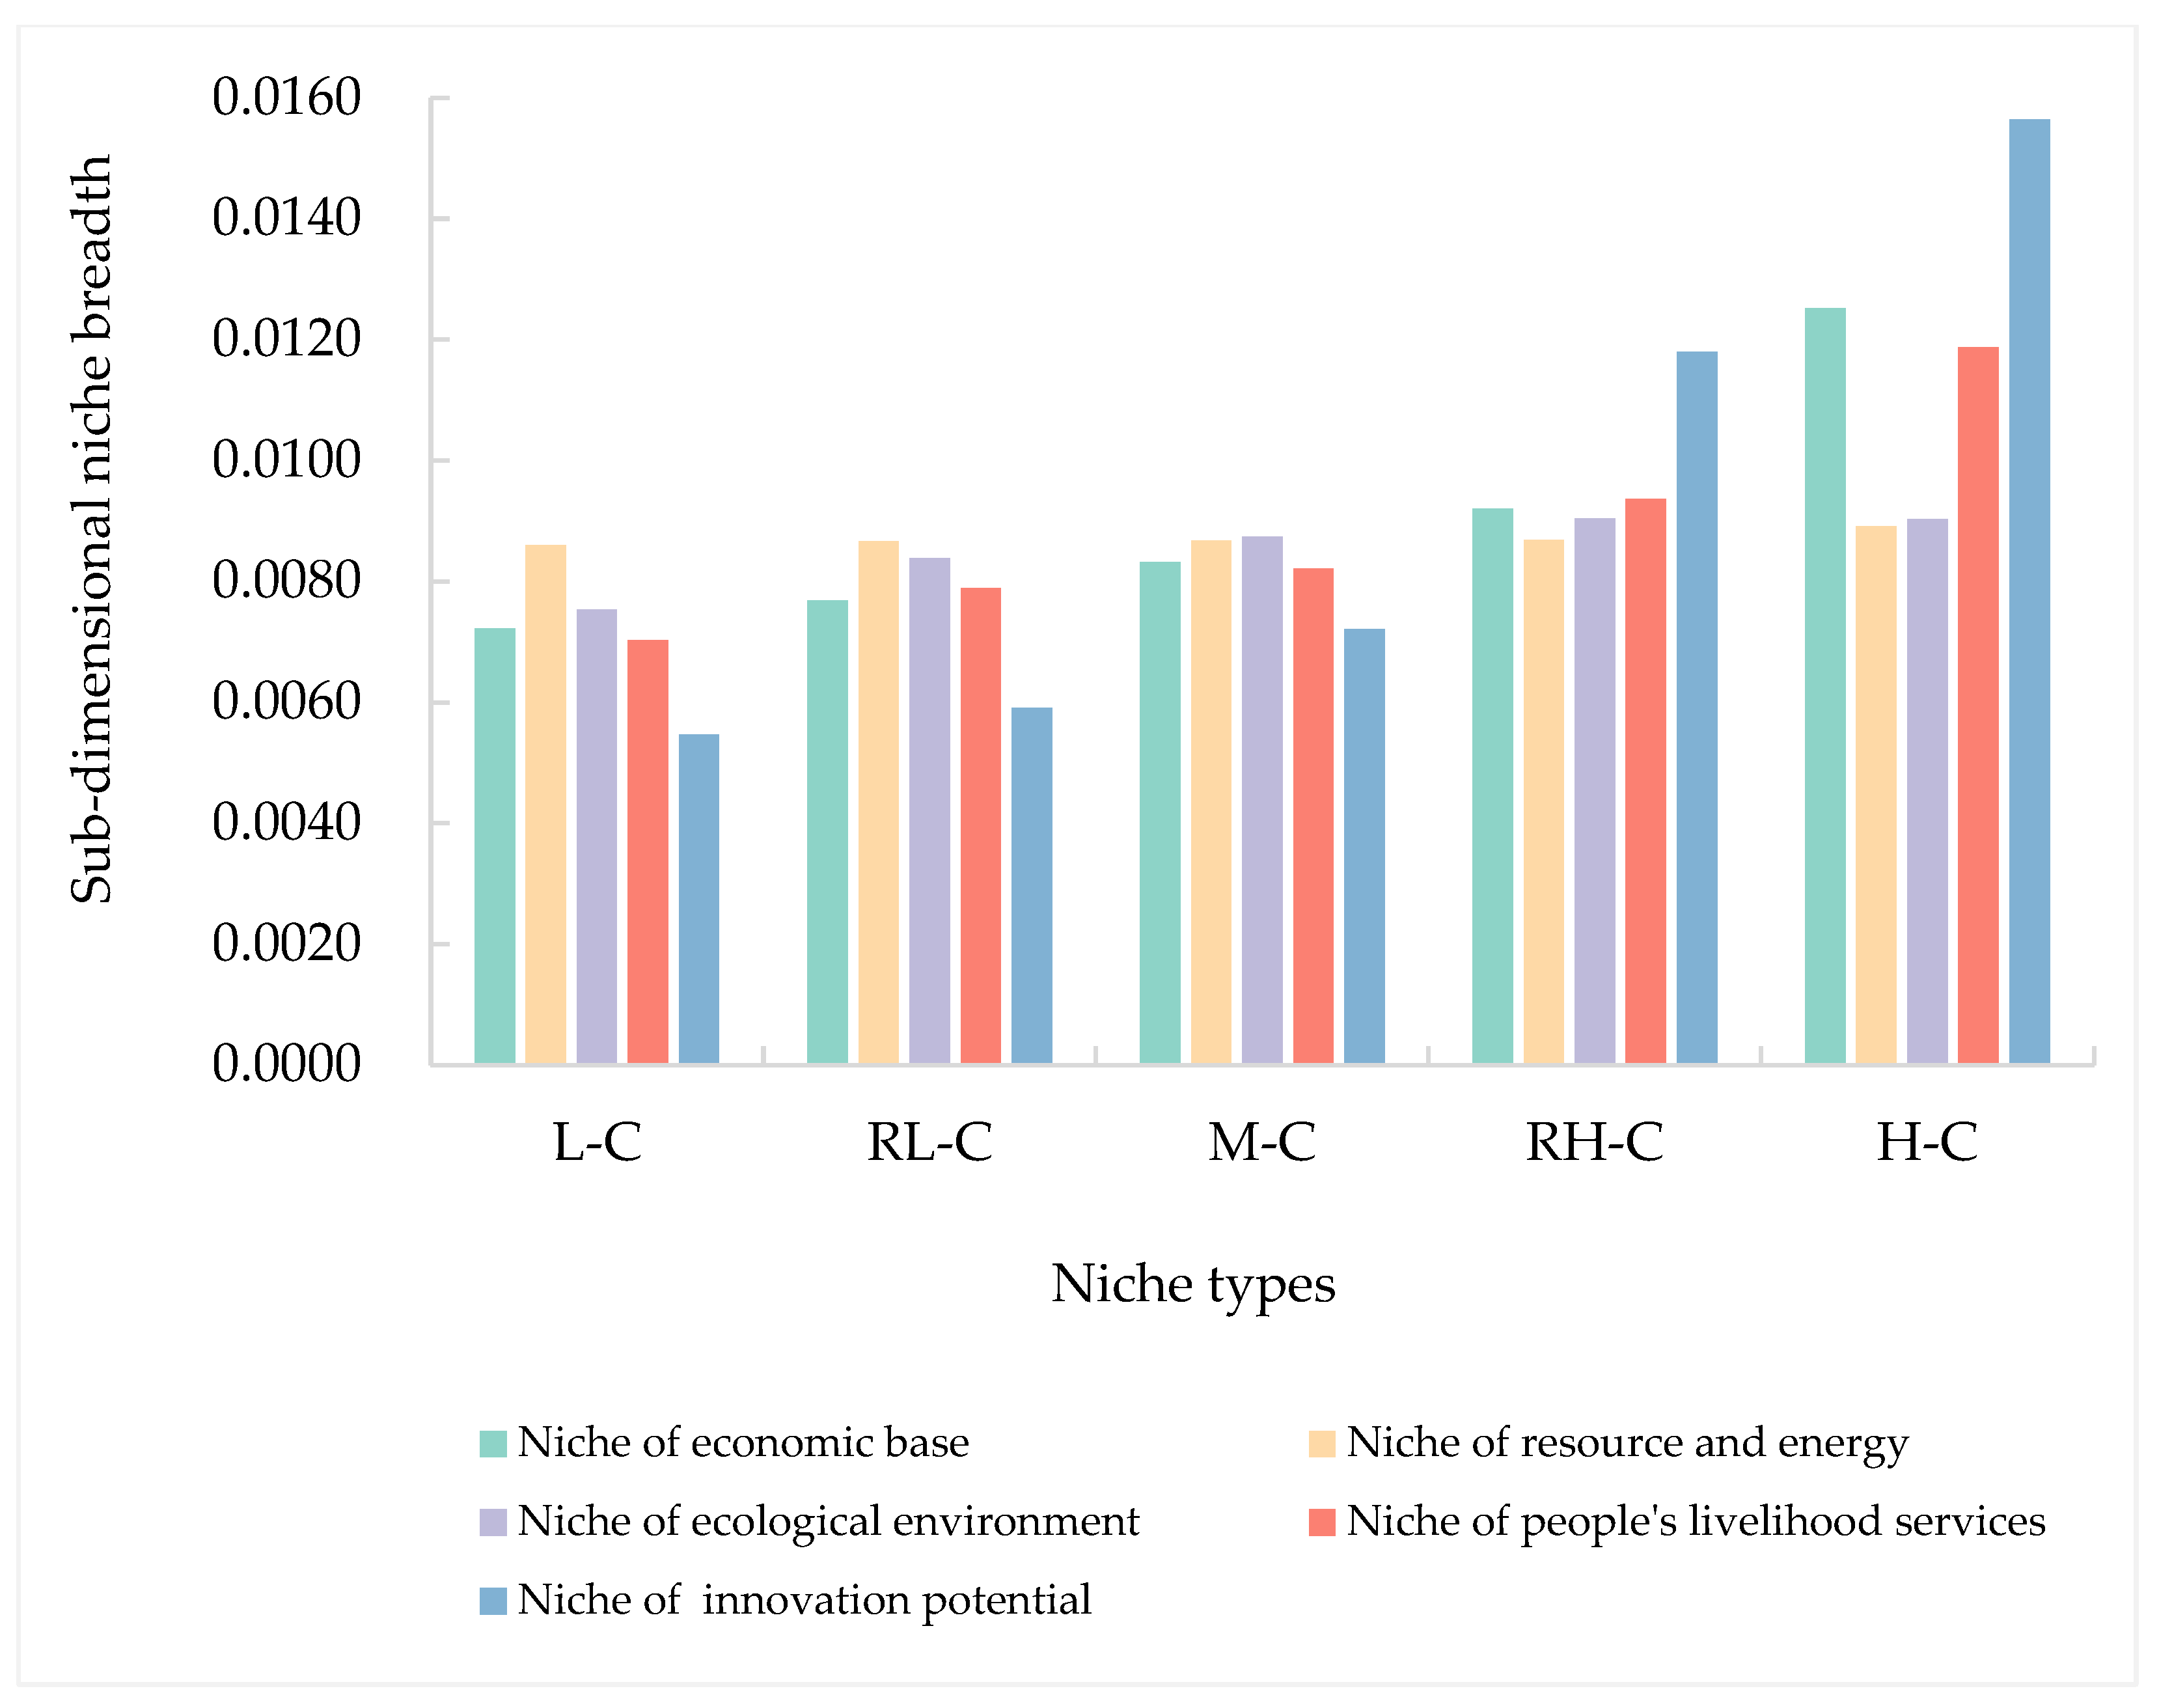
3.2.1. Analysis and Comparison of the Sub-Dimensional Niche Breadth

Since the sum of the niche breadths of all measured objects, i.e., 115 resource-based cities in China, was 1, the characteristics of the niche breadths of each sub-dimensional niche could be clearly presented and analyzed in the same bar chart. In Figure 4, the mean values of the sub-dimensional niche breadth are compared with the five niche types generated by the results of the natural breaks classification. It can clearly be observed that as the high-quality-development niche increased from low to high, its sub-dimensional niche breadth became wider overall.
From the sub-dimensional niche perspective, as can be observed in Figure 4, firstly, except for the sub-dimensional niche breadth of the ecological environment, which presents little fluctuating change, the high-quality-development niche breadth changed from narrow to wide as the high-quality-development niche transitioned from low to high. Secondly, the niche breadths of resource and energy did not vary considerably among the five niche types, and their extreme differences in niche breadth were the least among the five niche types, indicating that the differences in the potential of resource-based cities in terms of the levels of resource endowment, resource dependence, and consumption were relatively minor, and the degree of dependence and decoupling of resource-based industries and the transformation of development methods is supposed to be the key to the differences in the niche of resource and energy. Thirdly, the most varied niche breadth was the niche of innovation potential. Compared to the relatively high-niche cities and high-niche cities, with medium-niche cities and relatively low-niche cities being significantly narrower in terms of the niche breadth of the innovation potential, fully reflecting the connotations of innovation-driven high-quality development.
Figure 5 shows the sub-dimensional niche breadth in resource-based cities of four regions in China as follows:
In terms of the sub-dimensional niche breadths in the cities of four regions in China, as presented in Figure 5, resource-based cities in northeastern and western regions had significantly narrower sub-dimensional niche breadths of the innovation potential, while the resource-based cities in eastern and central regions were relatively wider in this sub-dimensional niche, and the niche breadth of the economic base presented similar characteristics.
Figure 6 shows the sub-dimensional niche breadth of resource-based cities in different development stages as follows:
In terms of the sub-dimensional niche breadths of resource-based cities in different development stages, as shown in Figure 6, the sub-dimensional niche of economic base, innovation potential, and people’s livelihood services presented a trend of widening at different rates as the growth stage progressed. It is noteworthy that the sub-dimensional niche breadths of resource and energy reduced at a slower rate, reflecting the trend that the resources on which resource-based cities can rely in the development process are decreasing in potential. The niche breadths of ecological environment, on the other hand, presented a more pronounced narrowing trend during their development. Therefore, for the high-quality development of resource-based cities, the challenges facing the niche of resource and energy were clearer and more daunting.

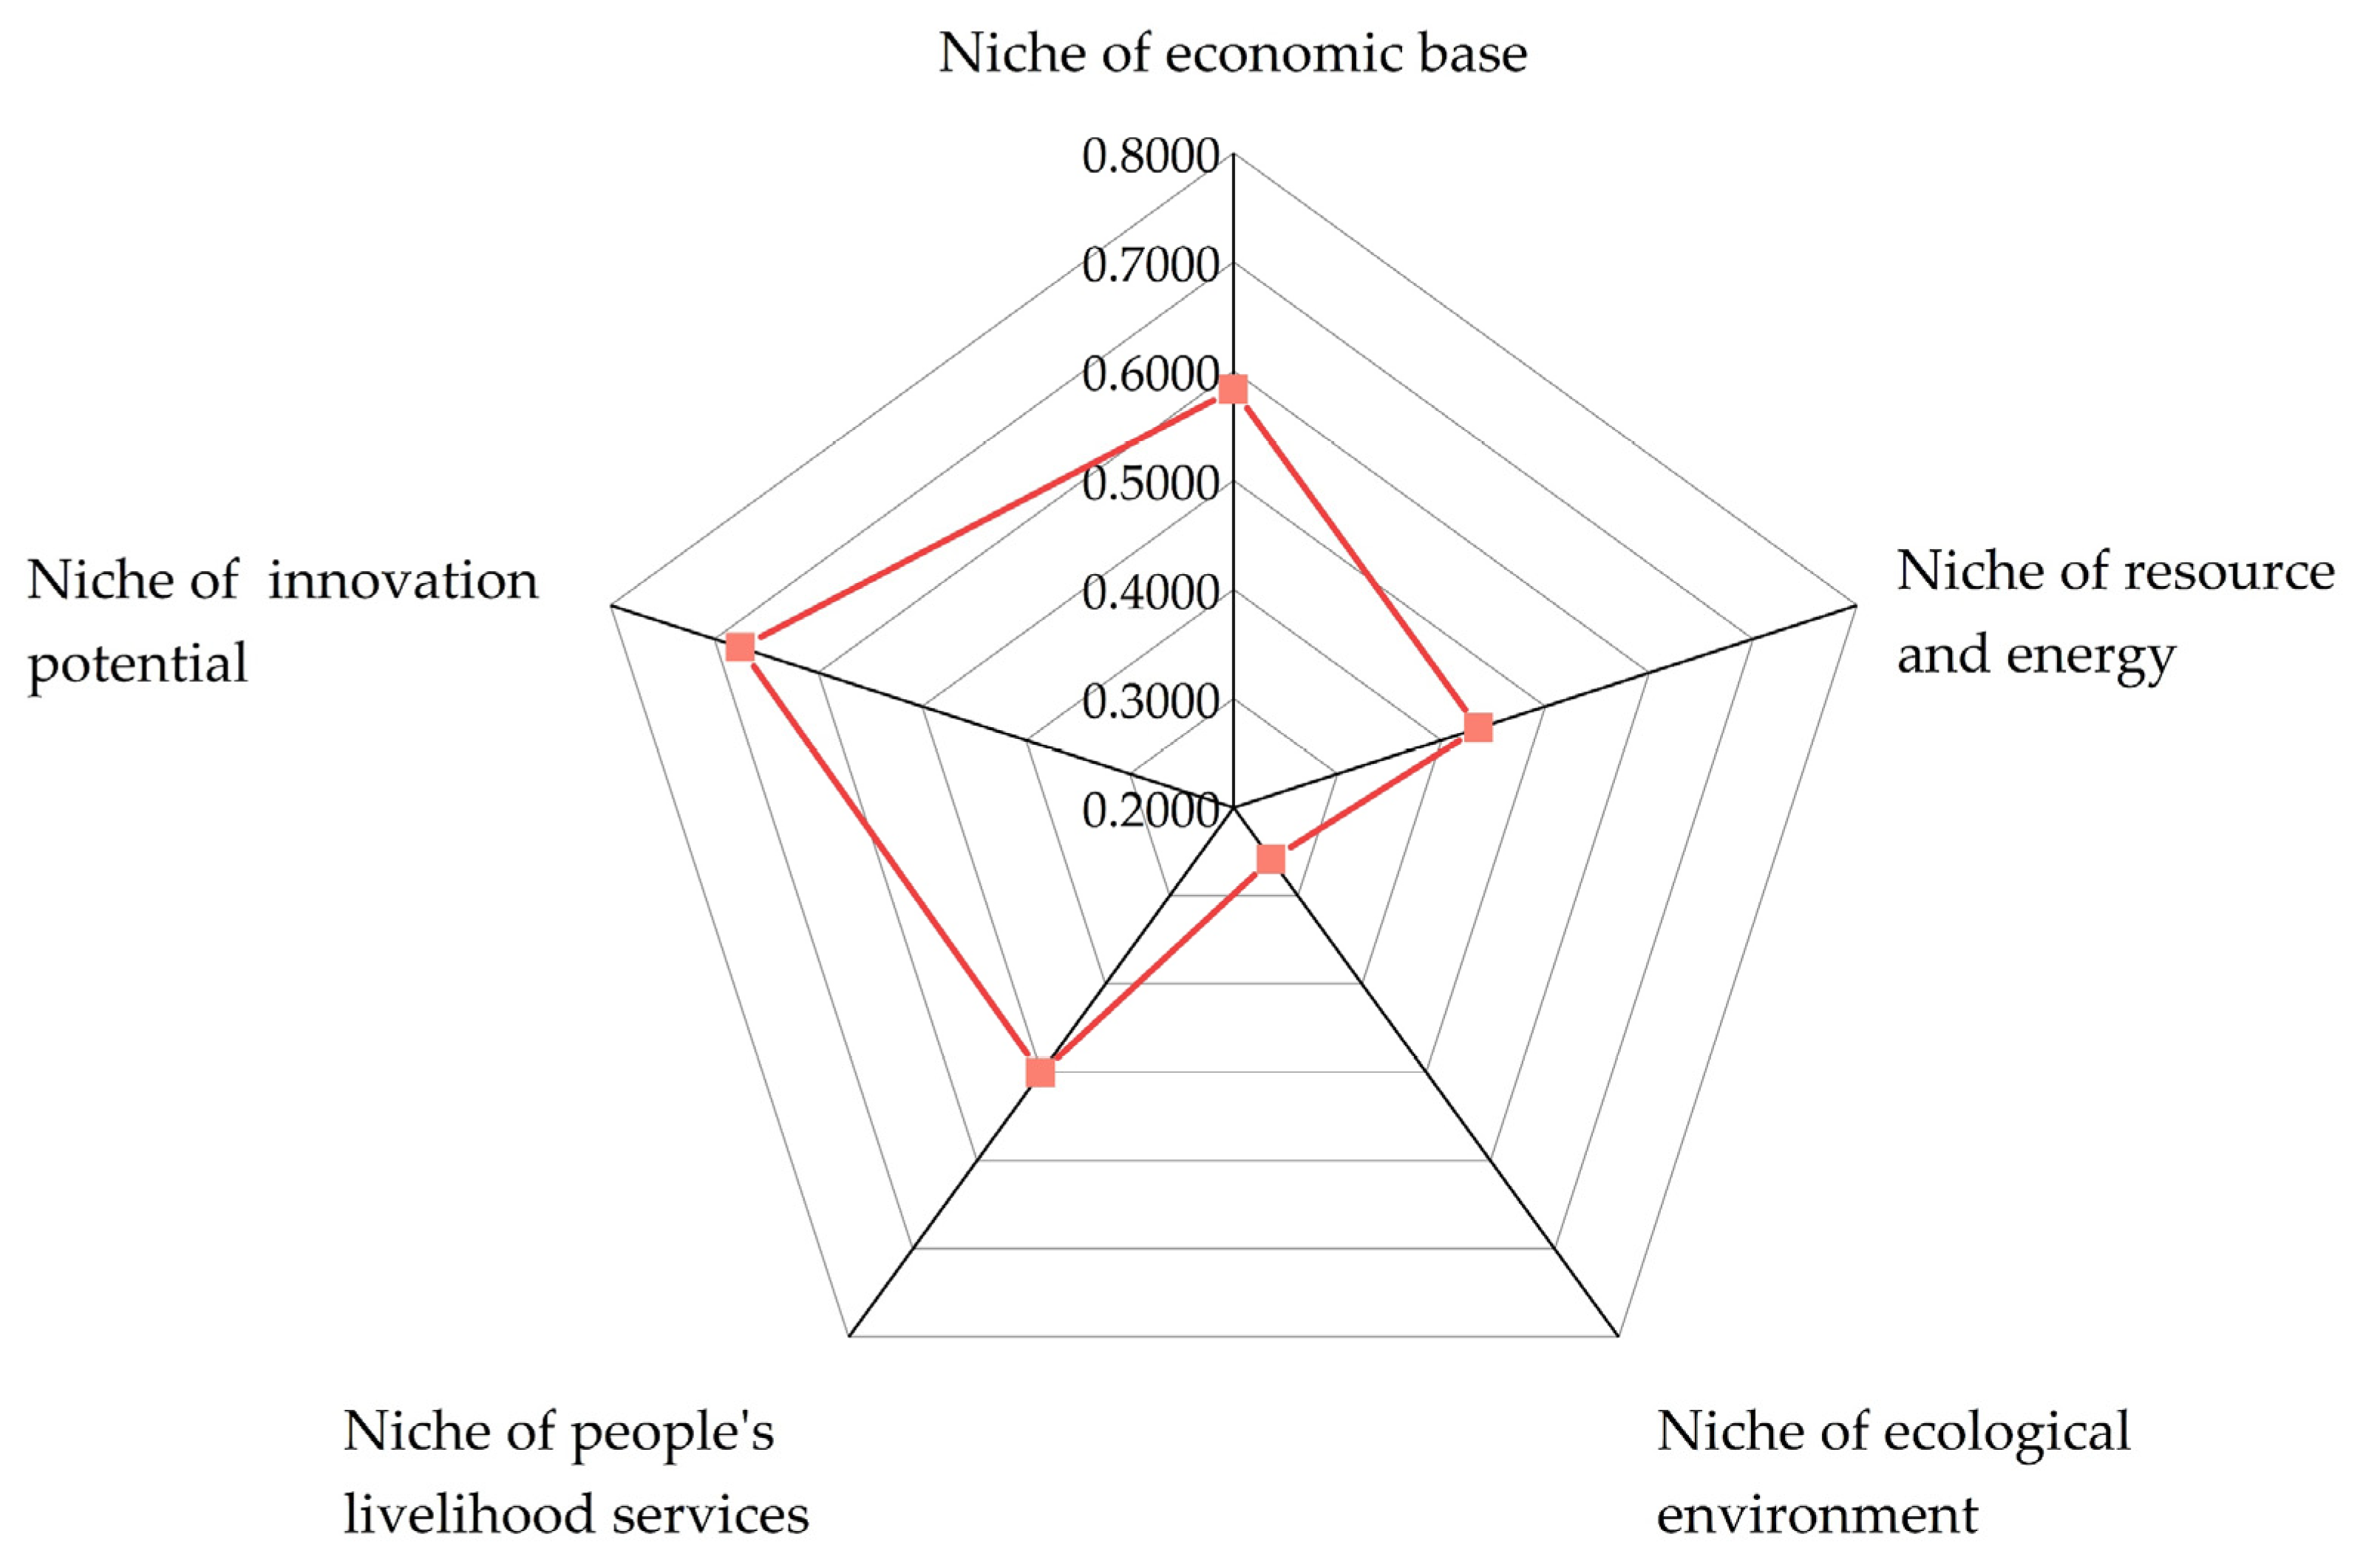
3.2.2. Analysis of the Relevance between the Sub-Dimensional Niche Breadth and the High-Quality-Development Niche

The correlation analysis was conducted in this subsection in order to investigate the correlation between the sub-dimensional niche breadths and the high-quality-development niche of resource-based cities in China. In this paper, Spearman’s correlation analysis was conducted between each of the five sub-dimensional niche breadths and the high-quality-development niche. Following the significance test, each of the five sub-dimensional niche breadths presented a significant positive correlation with the high-quality-development niche, and their correlations are presented in the radar plot shown in Figure 7.
As can be observed from the radar plot in Figure 7, the niche breadth of innovation potential has the highest correlation with the high-quality-development niche of resource-based cities, at 0.6749, indicating that the niche of innovation potential provides the greatest contribution to the high-quality-development niche of resource-based cities. In addition, the niche of economic base and people’s livelihood services follow, with their niche breadths correlating to 0.5829 and 0.5007, respectively. Meanwhile, the niche of ecological environment presents the lowest correlation value with the high-quality-development niche at 0.2588. Therefore, the niche of innovation potential was the most sensitive to the improvement of the high-quality-development niche of resource-based cities in China.

3.3. Analysis of the High-Quality-Development Niche Differentiation Index

By substituting the niche breadths and sub-dimensional niche breadths for the high-quality development of resource-based cities into Equation (12) in Section 2.2.3, the differentiation index for high-quality-development niches of resource-based cities ranging from 2009 to 2012, 2012 to 2014, 2014 to 2016 and 2016 to 2018 could be obtained.

3.3.1. Analysis of the Differentiation Indices of the Sub-Dimensional High-Quality-Development Niche

The differentiation indices of the sub-dimensional niches, as shown in Figure 8, present obvious structural variations over the decade.
As can be observed in Figure 8, on the one hand, the differentiation index of the niche of innovation potential is always greater than that of the other sub-dimensional niches, and fluctuates upwards, indicating that the spatial polarization of the dynamics of resource-based cities in the niche of innovation potential is obvious, while the differentiation index of the niche of economic base shows similar fluctuation characteristics.
On the other hand, the differentiation index of the niche of resource and energy is always the lowest and progresses downwards, indicating that resource-based cities have less variation in the development and utilization of resources and energy.
In addition, the differentiation index of the niche of ecological environment fluctuates most significantly during this decade, showing a trend of first decreasing and then significantly increasing, indicating that the differences in the ecological environment continue to become greater during the development of resource-based cities.

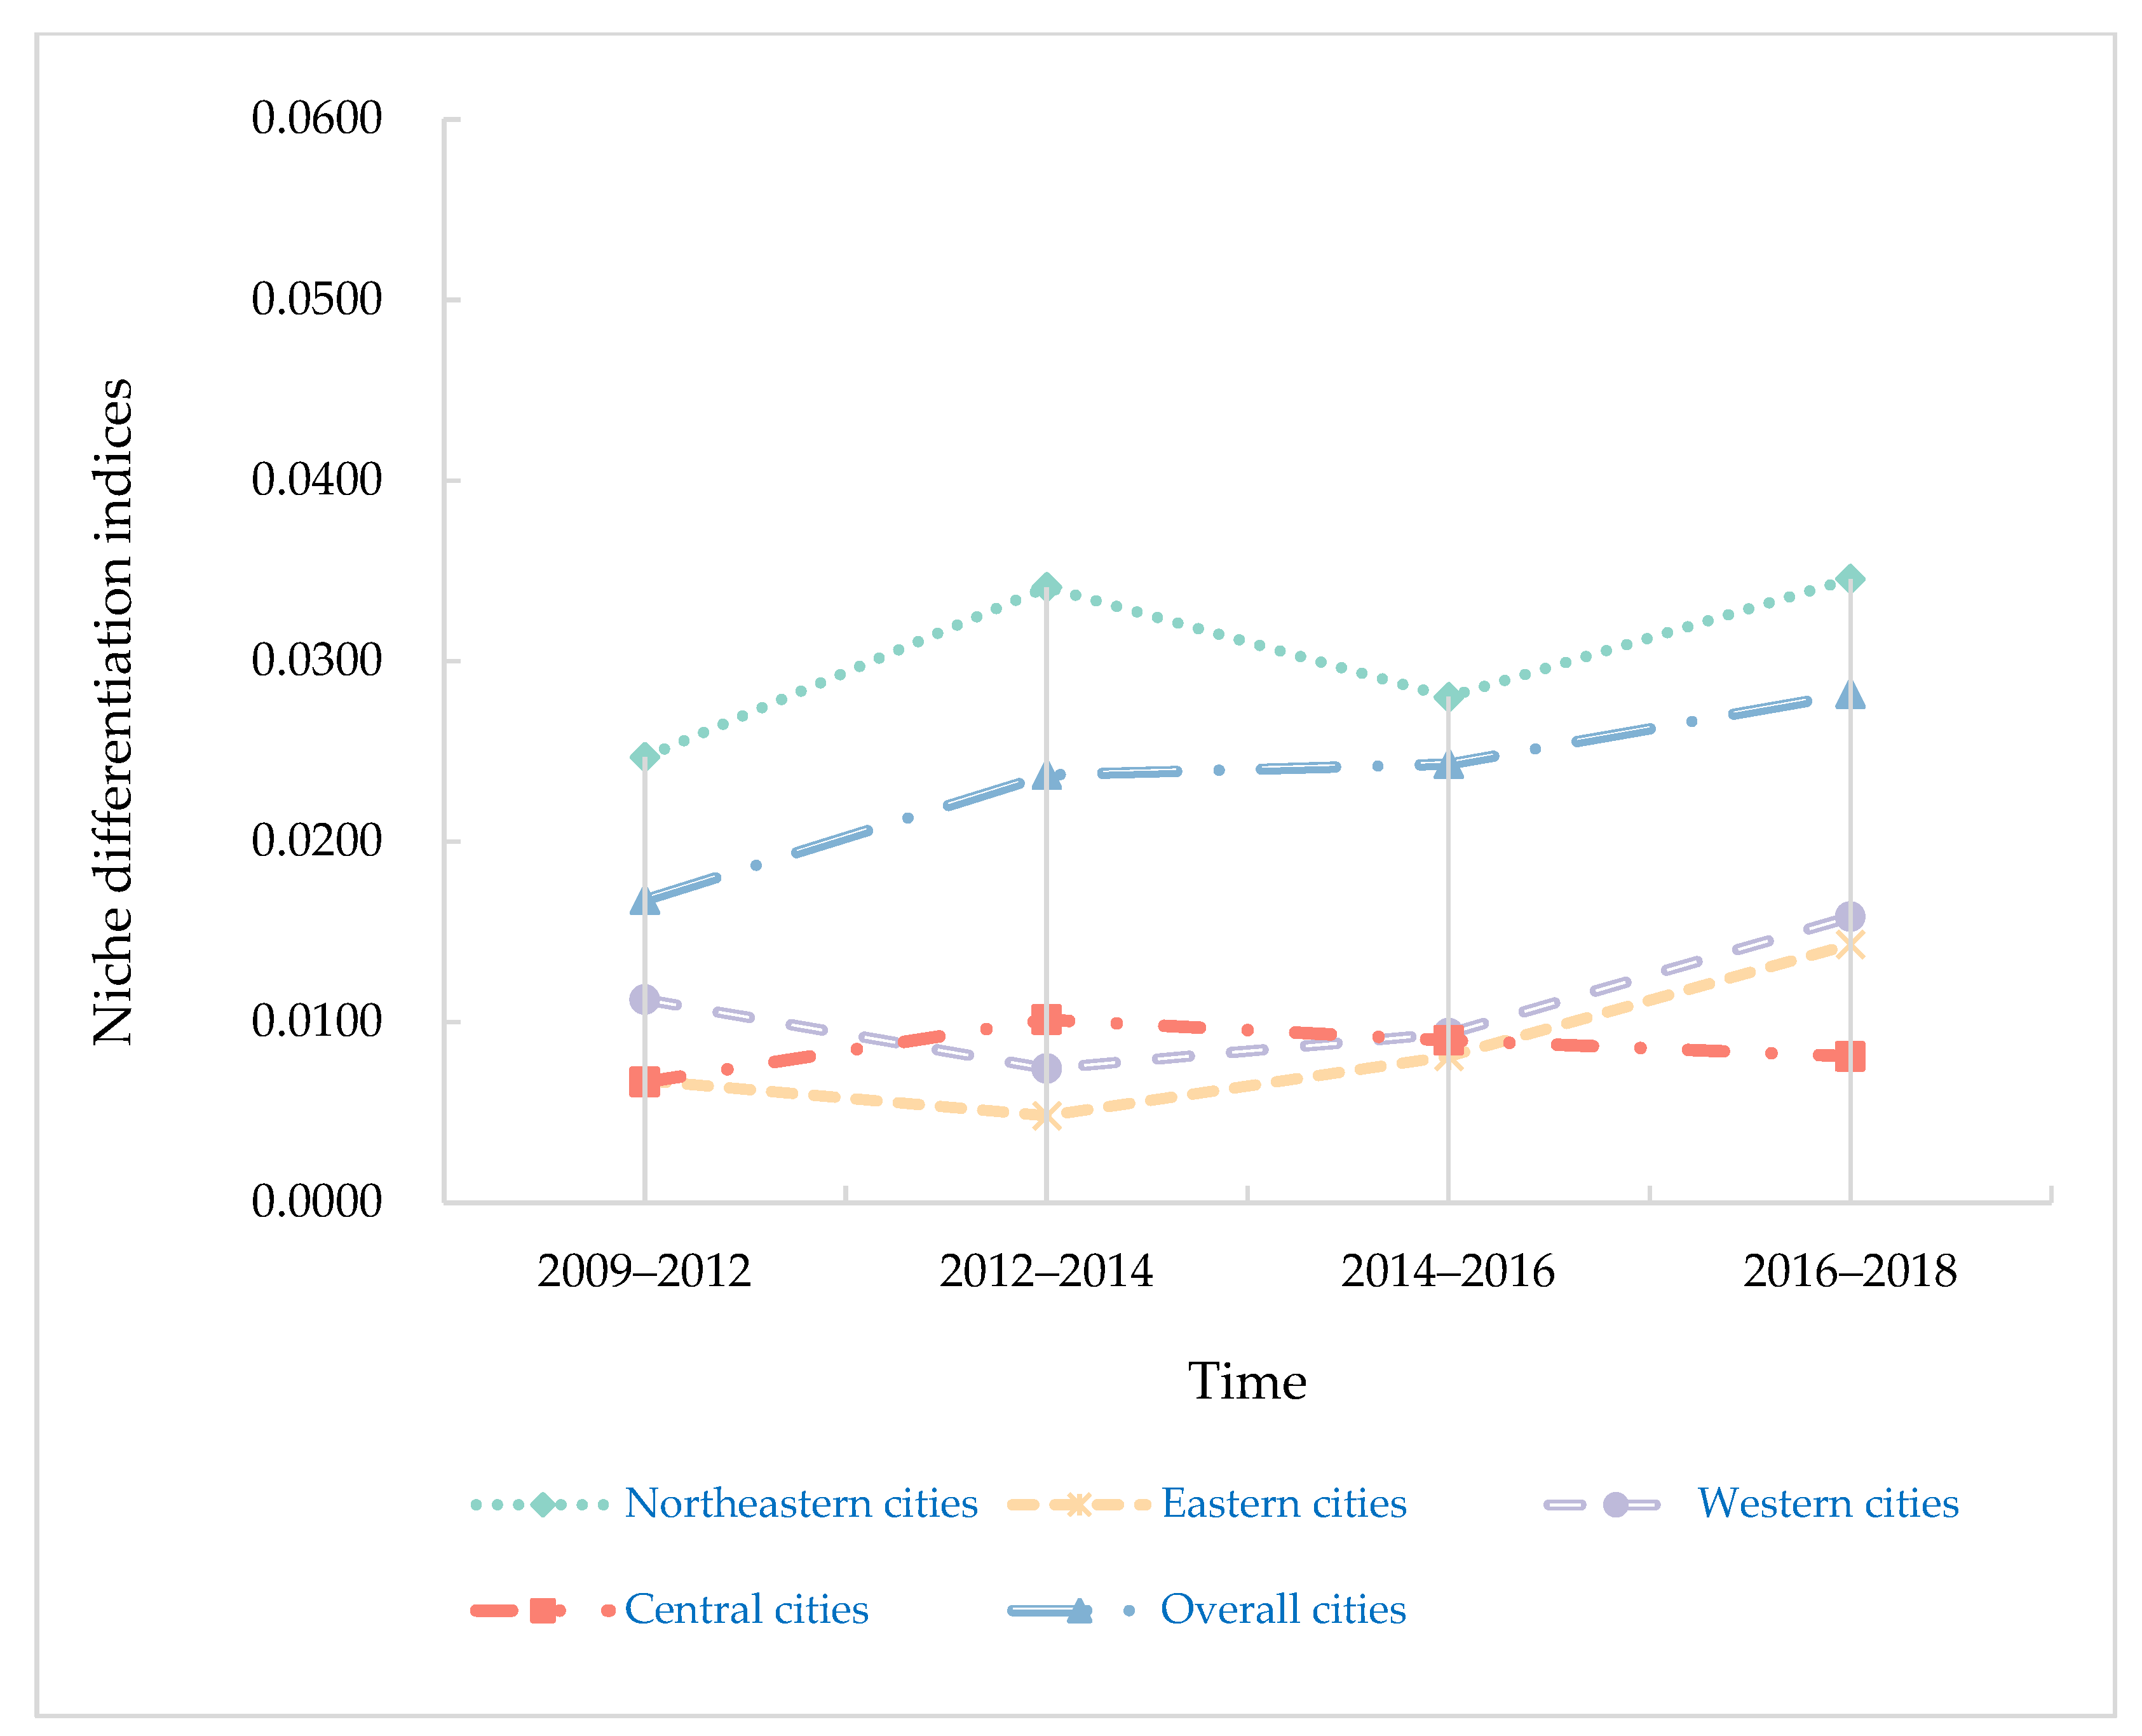
3.3.2. Analysis of the Differentiation Indices of the Overall High-Quality-Development Niche

Figure 9 shows the differentiation indices of the overall high-quality-development niche of 115 resource-based cities in China and in the four regions. It can be seen that the overall niche differentiation index is significantly lower compared to the sub-dimensional differentiation index, indicating that the overall development variation is smaller than the development variation in the sub-dimensional niches.
As shown in Figure 9, it can be observed that over the 10-year period, the differentiation indices of the overall niches for the high-quality development of resource-based cities in China fluctuate and present an upward trend, and the rate of increase tends to gradually slow down. The differentiation index curve of the overall high-quality-development niche sharply increases until 2014, indicating that the spatial differences in the high-quality-development niches of resource-based cities have gradually expanded. The continued increase in the spatial variation in the niche breadths indicates that the differences in the factor base conditions for the high-quality development that cities in each region are able to utilize are on the rise.
By regions, the niche differentiation index of the central cities expanded overall after rising and falling fluctuations, but the degree of divergence was at a lower level. While the index of the northeastern cities was higher than that in the other regions, and although it contracted from 2014 to 2016, the overall spatial difference was still expansion. In addition, resource-based cities in the western and eastern regions also presented an expansion trend, but their degree of differentiation was lower than the overall level.
To conclude, both overall and by regions, the phenomenon of a more uneven level of ecological niches for the high-quality development in resource-based cities has become more evident over the decade.

4. Discussions

4.1. Further Discussions

Since previous studies are mostly based on current and previous development statuses, they are different from the evolutionary trends revealed by the measurement of the niche based on the theory of state and potential. This paper examined the comparative situation and evolution for the high-quality development of resource-based cities in China from the perspective of ecological niches, and thus attempted to explore the selections of their differentiated paths. Unlike previous studies that focus on resource-based cities in a particular province or river basin, the introduction of the ecological niche theory raised the research perspective to the national scale [10,22]. Although the research results still confirm regional heterogeneity and agglomeration for the high-quality development of resource-based cities, this paper focused more on the implications of the results of ecological niche breadth for the exploration of differentiation paths [18].
The niche differentiation index indicates that the overall uneven development of resource-based cities has evolved more significantly over the decade. In previous studies, Liu et al. observed that the larger the study scale and ecological niche breadth, the greater the scale effect. In this paper, the scale effect was more clearly reflected because the research scale was based on the national [54]. This confirms the previous observations that the scale effect was stronger in more unevenly developed ecological niche dimensions. However, inconsistent with the findings of this paper, the results from the research of Liu et al. showed a narrowing of the differences in economic levels of high-quality economic development among regions [55]. In this study, the ecological niche approach treated all resource-based cities as a system whose changes in breadths imply competing relationships in time and space. However, the previous study only focused on economy-related indicators rather than a comprehensive perspective. Therefore, the goal of the high-quality development of resource-based cities implies more comprehensive and sustainable development and may also imply the inherent contradiction of unbalanced development [56].
When analyzing the sub-dimensional niche breadth in five types of the high-quality-development niche, it was observed that the differences in the niche breadths of resource and energy were generally less than the breadths of other niches, while the differences within the niche breadths of innovation potential were the greatest. In the previous studies, resource and energy and innovation potential were rarely considered as the main components of an evaluation system, and only the relationship between economic–social–environmental systems was generally discussed [34]. Since the ecological niche of high-quality development represents the resources and the location it occupies, the niche breadth implies the direction of the evolutionary dynamics of urban development, and thus, the measurement results of the two sub-dimensional niches at the national scale provide a more direct basis for exploring the paths of high-quality development in resource-based cities.

4.2. Policy Recommendations

The current research is based on the comparative situation and evolutionary characteristics of resource-based cities in terms of the high-quality development and tries to propose strategies to help differentiate their development paths. Due to uneven regional development, the overall idea of policy recommendations in this paper is therefore to adopt the advantageous ecological niche as the guide and complement the relatively weak ecological niche as the bottom line; the paper formulated high-quality development goals and strategies suitable for their own development. This is closely related to the ideas and conclusions of the study. In the process of dynamic development, we attempted to gradually reduce the development differences between regions and aimed to achieve high-quality development with balanced internal and external ecological niches of the city.
Firstly, for the relatively high-niche cities and high-niche cities, such as Karamay, Huzhou, Erdos and Dongying etc., the distribution characteristics of their sub-dimensional niche breadths were consistent and should have adopted an innovation-driven strategy to pursue the goal of higher-quality development in resource-based cities. The economic base of the relatively high-niche cities and high-niche cities was more than sufficient to support high-quality development. The main issue it faced was how to better leverage its strengths and maintain its momentum towards achieving higher-quality development, thereby enhancing the city’s competitiveness. Implementing innovation-driven strategies requires relying on abundant innovation resources and continuous innovation and changes to institutions and mechanisms, thereby improving the overall effectiveness of the city’s innovation system. On the one hand, the government should increase its investment in science and technology innovation, especially in financial support for innovation subjects, such as enterprises, universities and research institutions, and play an important role in supporting innovative subjects. At the same time, it should vigorously introduce and gather high-end talent, young talent and skilled talent and improve the incentive mechanism for technological innovation. On the other hand, the cultivation and development of new industries should be accelerated while accelerating the transformation of resource-based industries into new green industries that are of high value, environmentally friendly, clean and developed along the entire industrial chain. There should exist a more diversified development strategy for innovation and industry chains, with particular emphasis placed on support for new energy industries, including energy-saving technologies, energy-saving equipment, new energy vehicle industry chains and photovoltaic or wind-power industry chains.
Secondly, for the medium-niche cities, such as Xuzhou, Daqing, Linyi and Tongling etc., the main focus is on optimizing industrial structure and expanding the advantages of the niche of economic base. In response to the advantageous resources on which they rely, they should extend industrial and supply chains, promote diversified development, enhance the level of economic openness and construct a solid economic base, while making better use of resources and optimizing the environment. With the support of the economic base, the healthy development of livelihood services and innovation potential should simultaneously be promoted.
Thirdly, for the relatively low-niche cities and low-niche cities, such as Datong, Changzhi, Jincheng, Shuozhou, Yuncheng, Xinzhou, Linfen and Luliang (Shanxi Province); Nanchong, Guang’an and Dazhou (Sichuan Province); and Zhaotong, Baoshan, Pu’er and Qujing (Yunnan Province), low-value areas of the niches were significantly clustered, which exacerbated the imbalance in regional development. These cities should therefore adopt a development strategy based on their own resource endowments and the green development of resource-based industries, while competing for regional development. Under the premise of green development, these cities should focus on the diversified and effective development and utilization of resources. On the one hand, they should continue to enhance the clean and efficient utilization of coal resources, increase the extensive development of clean coal-related industrial chains and expand and enhance the advantages of resource-based industries in the entire industrial chain. Simultaneously, they should focus on regional competitive, complementary and synergistic developments of resources with other cities in the region, avoiding low-end competition and enhancing development efficiency.

4.3. Limitations and Prospects

The study of the ecological position of resource-based cities for high-quality development is complex and systematic work, and due to the limited space of the article, the paper has the following limitations.
Firstly, this paper constructed a system of indicators based on the perspective of ecological niches, aiming to be comprehensive and innovative. However, due to the limitations of the information and data, the indicator system still needs further improvement. An indicator system that can more objectively characterize the ecological status and development potential of resource-based cities needs to be further explored.
Secondly, relatively objective measures were selected from the existing literature to ensure the scientific validity of the study. However, the research still needs to further adopt different ecological niche measurement models in the future to compare and analyze the calculation results, so as to improve the scientific nature of ecological niche studies for the high-quality development. Meanwhile, this paper did not clarify the extent to which different types of cities are suitable for the selections of differentiated paths. The in-depth analysis of their ecological niche breadth and overlap is also needed in future research to determine their competitive dynamics. At the same time, more case studies are needed to prove their suitability and rationality.
Thirdly, the factors influencing the high-quality development of resource-based cities were complex and interacted with each other [57], such as urban development level, adequate funding sources, and government intervention etc. With a macro perspective that captures their spatial characteristics, future research should also examine the factors that influence the high-quality development of resource-based cities from a micro perspective and explore their driving mechanisms.

5. Conclusions

Based on the needs for resource-based cities to urgently create high-quality development paths in the context of carbon neutrality, this paper introduces the perspective of ecological niches to measure the ecological niche for high-quality development in resource-based cities in China and proposes a classification path for differentiated development based on their comparative status and dynamic evolutionary characteristics. The results of this are in line with China’s national conditions and the actual development situation.
The study found that firstly, the comparative ecological niche status of resource-based cities for high-quality development reveals their overall low ecological niche. The spatial distributions of the high-quality-development niche is characterized by a concentration of low-niche cities and a scattering of high-niche cities. The overall temporal evolution presents a trend from low to medium levels and then transitions to a high level. Secondly, the differences in the breadths of the niches of resource and energy among the cities in different niche types are generally less than those of other sub-dimensional niche breadths, while the difference within the niche breadths of innovation potential is the greatest. Finally, the overall uneven development characteristics of resource-based cities became more significant following ten years of evolution. Based on the research findings, targeted policy recommendations are made for resource-based cities to pinpoint their suitable paths for the high-quality development.
This study provides an integrated perspective and systematic thinking on the selection of differentiated development paths for resource-based, prefecture-level cities in China at the national scale. The methods and recommendations for classification approaches based on the development differences are of references and extension significance for applying an integrated perspective of ecological niches to solve the development problems of other specific types of cities or for other countries with resource-based cities.

Author Contributions

Conceptualization, Z.L., Y.W. and S.A.; methodology, Z.L., Y.W. and J.Z.; software, Z.L., Y.Z. and J.Z.; validation, Z.L. and Y.W.; formal analysis, Z.L.; resources, Z.L., Y.W. and S.A.; data curation, Z.L.; writing—original draft preparation, Z.L.; writing—review and editing, Z.L., Y.W., S.A. and Y.Z.; visualization, Z.L., Y.Z. and J.Z.; supervision, Y.W. and S.A.; project administration, Y.W. and S.A.; funding acquisition, S.A. and Y.W. All authors have read and agreed to the published version of the manuscript.

Funding

This research was funded by Post-grant Project of the National Social Science Foundation, grant number 21FJYB036; Soft Science Project of Henan Provincial Science and Technology Department, grant number 212400410303; Humanities Social Sciences Project in Henan Provincial Higher Education Institutions, grant number 2021-ZZJH-131; National Natural Science Foundation Project, grant number 42201297; Major Project of Philosophical and Social Science in Henan Provincial Higher Education Institutions, grant number 2022-YYZD-07 and Key Research Project of Henan Provincial Higher Education Institutions, grant number 20A170009.

Institutional Review Board Statement

Not applicable.

Informed Consent Statement

Not applicable.

Data Availability Statement

Not applicable.

Acknowledgments

The authors would like to thank the anonymous referees for their helpful suggestions and corrections in the earlier manuscript. In addition, the authors would like to thank Gu and Guo for their patient help and valuable suggestions during our work on this paper.

Conflicts of Interest

The authors declare no conflict of interest.

Appendix A

Table A1. The high-quality-development niche in 2009, 2012, 2015 and 2018.
CodeCity2009201220152018
1Karamay0.37190.38230.41480.4327
2Huzhou0.37910.38700.40400.4186
3Dongying0.37600.38250.38950.4031
4Erdos0.37830.38230.39510.3948
5Xuancheng0.37000.37740.39990.3923
6Maanshan0.37300.37520.38330.3909
7Zibo0.37330.38050.38230.3897
8Tangshan0.36620.37190.37410.3853
9Panzhihua0.38230.38400.38900.3847
10Yangquan0.36770.37310.37210.3834
11Daqing0.37320.37890.37950.3821
12Shizuishan0.36750.36600.36990.3808
13Chuzhou0.36220.36790.37390.3801
14Lijiang0.36280.36380.36970.3795
15Tongling0.37570.37890.39370.3791
16Jingdezhen0.36990.36980.37080.3790
17Baotou0.37530.37850.37850.3788
18Wuhai0.36740.36850.37390.3787
19Xuzhou0.36440.37150.37230.3781
20Luoyang0.36550.36690.37090.3773
21Jiaozuo0.36480.36710.37060.3768
22Jinchang0.36400.36820.37440.3768
23Laiwu0.36720.37080.37620.3766
24Jinzhong0.36340.36370.36840.3764
25Taian0.36700.36740.37030.3760
26Longyan0.36330.36700.37040.3759
27Xinyu0.37130.37100.37280.3756
28Anshun0.35990.36100.36810.3754
29Pingxiang0.36280.36490.36760.3754
30Xianyang0.36150.36270.36390.3753
31Zhangye0.36370.36180.36550.3745
32Suqian0.36580.37060.37060.3744
33Guangyuan0.35950.36340.36270.3744
34Ya’an0.36000.36420.36780.3742
35Zaozhuang0.36330.36370.36580.3741
36Jining0.36590.36910.37080.3741
37Linyi0.36520.36690.36690.3740
38Hebi0.36230.36450.36740.3737
39Huangshi0.36350.36760.36950.3737
40Benxi0.36810.36990.37350.3732
41Sanming0.36380.36700.37380.3726
42Zigong0.36440.36390.36520.3725
43Mudanjiang0.36730.37150.36660.3725
44Baoji0.36220.36330.36460.3724
45Ganzhou0.36270.36280.36270.3723
46Tongchuan0.36570.36450.36730.3721
47Wuwei0.36360.36350.36270.3720
48Lincang0.36000.36100.36110.3719
49Sanmenxia0.36200.36490.36340.3719
50Songyuan0.36240.36370.36530.3718
51Qingyang0.36620.36820.36890.3718
52chizhou0.36280.36480.36940.3716
53Ezhou0.36300.36460.36740.3715
54Shaoguan0.36260.36370.36750.3711
55Longnan0.36640.36740.36830.3711
56Yichun0.36140.36180.36520.3709
57Yan’an0.36340.36160.36360.3708
58Hezhou0.36080.36480.36390.3707
59Heihe0.36580.36880.36680.3704
60Bozhou0.36880.36220.36490.3704
61Fushun0.36340.36830.36580.3703
62Panjin0.36850.36800.36740.3703
63Puyang0.36100.36190.36480.3702
64Baishan0.36180.36360.36250.3702
65Hengyang0.36140.36400.36580.3700
66Nanping0.36320.36430.36660.3699
67Chenzhou0.36170.36300.36590.3698
68Luzhou0.36320.36430.36630.3692
69Huaibei0.36430.36830.36840.3692
70Yichun0.36410.36430.36160.3691
71Baiyin0.35890.36120.36450.3690
72Jilin0.36590.36600.36630.3687
73Fuxin0.36270.36580.36120.3687
74Hulunbeier0.37020.36640.36690.3680
75Liupanshui0.35780.35890.36270.3680
76Qitaihe0.36310.36230.36250.3679
77Xingtai0.36400.36430.36390.3679
78Nanyang0.36160.36200.36330.3678
79Anshan0.36770.36970.36780.3677
80Shaoyang0.36080.35940.36190.3676
81Tonghua0.36230.36420.36450.3676
82Chifeng0.36180.36300.36200.3671
83Chengde0.36120.36310.36290.3670
84Pingdingshan0.36200.36240.36410.3669
85Liaoyuan0.36690.36350.36380.3668
86Jincheng0.36210.36560.36460.3668
87Yulin0.36380.36500.36480.3667
88Huainan0.36450.36720.36990.3667
89Shuangyashan0.36200.36360.36620.3665
90Jixi0.36190.36350.36190.3664
91Huludao0.36130.36350.35670.3663
92Zhaotong0.36460.35790.36000.3660
93Handan0.36360.36630.36650.3660
94Xinzhou0.35960.36080.36150.3660
95Suzhou0.36010.35980.36450.3658
96Zhangjiakou0.36210.36170.36120.3657
97Baoshan0.36500.36120.36200.3656
98Shuozhou0.36230.36320.36230.3656
99Yuncheng0.36070.36140.36060.3656
100Changzhi0.36280.36320.36220.3652
101Hegang0.36330.36450.36240.3650
102Yunfu0.36050.36180.36560.3650
103Linfen0.36520.36230.36160.3648
104Baise0.36080.35980.36220.3647
105Datong0.36190.36260.36320.3646
106Pu’er0.36310.36140.36100.3644
107Loudi0.35960.36360.36210.3644
108Guang’an0.35960.35510.36130.3643
109Dazhou0.32270.35650.35850.3637
110Lvliang0.36040.35950.35930.3636
111Pingliang0.36130.36040.36050.3636
112Qujing0.36050.35940.35990.3635
113Nanchong0.33700.36330.36270.3633
114Weinan0.35900.36020.36060.3621
115Hechi0.35970.35730.35980.3612

References

  1. Auty, R.; Warhurst, A. Sustainable development in mineral exporting economies. Resour. Policy 1993, 19, 14–29. [Google Scholar] [CrossRef]
  2. Li, Q.; Guo, Q.; Zhou, M.; Xia, Q.; Quan, M.Q. Analysis on the Mechanism and Influencing Factors of the Coordinated Development of Economy and Environment in China’s Resource-Based Cities. Sustainability 2022, 14, 2929. [Google Scholar] [CrossRef]
  3. Daily, C. China’s Road to Carbon Neutrality. Available online: https://global.chinadaily.com.cn/a/202010/30/WS5f9b5e09a31024ad0ba82058.html (accessed on 3 July 2021).
  4. Qiushi Journal. Understanding the New Development Stage, Applying the New Development Philosophy, and Creating a New Development Dynamic. Available online: http://en.qstheory.cn/2021-07/08/c_640514.htm (accessed on 1 October 2021).
  5. The State Council. The 14th Five-Year Plan to Promote High-Quality Development of Resource-Based Regions1. No. 1559. Beijing, China, 5 November 202. Available online: http://www.ccud.org.cn/article/24498.html (accessed on 30 July 2022).
  6. Yang, H.; Wang, R.; Peng, M.; Wang, J. Definition, Dilemma and Path of High-Quality Transformation and Development of China’s Resource-Based Cities: A Review of Literature. Resour. Ind. 2022, 24, 10–18. [Google Scholar] [CrossRef]
  7. Xu, J.; Ge, X.; Wang, X.; Jia, Q. Research on the mechanism and path of high-quality transformational development of resource-based cities—Based on the dual-wheel drive perspective of demand side and supply side. Guangxi Soc. Sci. 2020, 12, 53–61. [Google Scholar]
  8. Deng, W. Evaluating Transformation Efficiency of Resource-based Coastal Cities: An AHP and DEA Based Analysis. J. Coast. Res. 2019, 94, 878–882. [Google Scholar] [CrossRef]
  9. Du, J.; Zhang, J.; Li, X. What Is the Mechanism of Resource Dependence and High-Quality Economic Development? An Empirical Test from China. Sustainability 2020, 12, 8144. [Google Scholar] [CrossRef]
  10. Chen, W.; Shen, Y.; Wang, Y. Evaluation of economic transformation and upgrading of resource-based cities in Shaanxi province based on an improved TOPSIS method. Sust. Cities Soc. 2018, 37, 232–240. [Google Scholar] [CrossRef]
  11. Yang, Y.; Guo, H.; Chen, L.; Liu, X.; Gu, M.; Ke, X. Regional analysis of the green development level differences in Chinese mineral resource-based cities. Resour. Pol. 2019, 61, 261–272. [Google Scholar] [CrossRef]
  12. Liu, E.-n.; Wang, Y.; Chen, W.; Chen, W.; Ning, S. Evaluating the transformation of China’s resource-based cities: An integrated sequential weight and TOPSIS approach. Socio-Econ. Plan. Sci. 2021, 77, 101022. [Google Scholar] [CrossRef]
  13. Hou, G.L.; Zou, Z.; Zhang, T.R.; Meng, Y. Analysis of the Effect of Industrial Transformation of Resource-Based Cities in Northeast China. Economies 2019, 7, 40. [Google Scholar] [CrossRef] [Green Version]
  14. Wu, X.; Shi, C.; Gao, J. A Study on Scientific Connotation and Institutional Innovation of Resource-based Economy’s High-quality Development. Econ. Probl. 2020, 12, 11–17. [Google Scholar]
  15. Li, Q.; Zeng, F.e.; Liu, S.; Yang, M.; Xu, F. The effects of China’s sustainable development policy for resource-based cities on local industrial transformation. Resour. Policy 2021, 71, 101940. [Google Scholar] [CrossRef]
  16. Tan, J.T.; Hu, X.H.; Hassink, R.; Ni, J.W. Industrial structure or agency: What affects regional economic resilience? Evidence from resource-based cities in China. Cities 2020, 106, 102906. [Google Scholar] [CrossRef]
  17. Long, R.; Chen, H.; Li, H.; Wang, F. Selecting alternative industries for Chinese resource cities based on intra- and inter-regional comparative advantages. Energy Policy 2013, 57, 82–88. [Google Scholar] [CrossRef]
  18. Lu, C.; Xue, B.; Lu, C.; Wang, T.; Jiang, L.; Zhang, Z.; Ren, W. Sustainability Investigation of Resource-Based Cities in Northeastern China. Sustainability 2016, 8, 1058. [Google Scholar] [CrossRef] [Green Version]
  19. Tan, J.; Lo, K.; Qiu, F.; Liu, W.; Li, J.; Zhang, P. Regional Economic Resilience: Resistance and Recoverability of Resource-Based Cities during Economic Crises in Northeast China. Sustainability 2017, 9, 2136. [Google Scholar] [CrossRef] [Green Version]
  20. Chen, Y.; Zhang, D. Multiscale assessment of the coupling coordination between innovation and economic development in resource-based cities: A case study of Northeast China. J. Clean Prod. 2021, 318, 128597. [Google Scholar] [CrossRef]
  21. Zhang, G.; Feng, Z. Research on the Measurement of High-quality Development of Resource-based Cities in the Yellow River Basin. Ecol. Econ. 2021, 37, 20–26. [Google Scholar]
  22. Hui, L.; Chen, R.; Huang, B. Rearch on High Quality Development of Resource-based Cities from the Perspective of New Strutural Economics: Taking the industrial transformation and strategic choice of Ruhr area of Germany as an example. J. Macro-Qual. Res. 2020, 8, 100–113. [Google Scholar]
  23. Tao, Y.; Wang, Q. Quantitative Recognition and Characteristic Analysis of Production-Living-Ecological Space Evolution for Five Resource-Based Cities: Zululand, Xuzhou, Lota, Surf Coast and Ruhr. Remote Sens. 2021, 13, 1563. [Google Scholar] [CrossRef]
  24. Fordyce, G. Some Variations in the Genus Vanessa (Pyrameis). Psyche A J. Entomol. 1918, 25, 6. [Google Scholar] [CrossRef] [Green Version]
  25. Boschma, R.; Coenen, L.; Frenken, K.; Truffer, B. Towards a theory of regional diversification: Combining insights from Evolutionary Economic Geography and Transition Studies. Reg. Stud. 2017, 51, 31–45. [Google Scholar] [CrossRef] [Green Version]
  26. Liu, B.; Ma, W.; Yang, D.; Li, M.; He, Z. The evolution of the ecostate and ecorole of economic niche in the emerging Xiamen-Zhangzhou-Quanzhou metropolitan area. Ecol. Sci. 2018, 37, 150–157. [Google Scholar]
  27. Jiang, L.; Liu, G.; Wang, J. A research on the regional disparity and spatial correlation of the equipment manufacturing industry: An analysis based on the niche theory. Sci. Res. Manag. 2020, 41, 132–141. [Google Scholar]
  28. Susur, E.; Martin-Carrillo, D.; Chiaroni, D.; Hidalgo, A. Unfolding eco-industrial parks through niche experimentation: Insights from three Italian cases. J. Clean Prod. 2019, 239, 118069. [Google Scholar] [CrossRef]
  29. Vezzoli, C.; Ceschin, F.; Diehl, J.C.; Kohtala, C. New design challenges to widely implement ‘Sustainable Product-Service Systems’. J. Clean Prod. 2015, 97, 1–12. [Google Scholar] [CrossRef]
  30. Chen, Y.; Lei, H.; Hsu, W. A Study on the Sustainable Development Strategy of Firms: Niche and Social Network Theory. Sustainability 2019, 11, 2593. [Google Scholar] [CrossRef] [Green Version]
  31. Lei, Y.; Liu, Q.; Chen, G. A study on the relationship between system stability and innovation niche in network perspective. Stud. Sci. Sci. 2019, 37, 535–544. [Google Scholar]
  32. Yin, S.; Li, B. Academic research institutes-construction enterprises linkages for the development of urban green building: Selecting management of green building technologies innovation partner. Sust. Cities Soc. 2019, 48, 101555. [Google Scholar] [CrossRef]
  33. Shi, J.; Zhang, Y.; Wu, G. Contrastive analysis of urban competitive niche on vital signs. China Popul. Resour. Environ. 2018, 28, 35–43. [Google Scholar] [CrossRef] [PubMed]
  34. Salvati, L. The ‘niche’ city: A multifactor spatial approach to identify local-scale dimensions of urban complexity. Ecol. Indic. 2018, 94, 62–73. [Google Scholar] [CrossRef]
  35. Huang, H.; Xiao, Y.; Wang, H. Ecological Niche Evaluation of the Socio-economic and Natural Complex Ecosystem in Chengdu-Chongqing Urban Agglomeration. Soft Sci. 2018, 7, 113–117. [Google Scholar] [CrossRef]
  36. Shen, Y.; Shi, S.; Li, X.; Cao, Y. Analysis of Spatial Coupling between Urban Expansion and Niche Change in the Beijing-Tianjin-Hebei Joint Region. Geogr. Geo.-Inf. Sci. 2020, 36, 100–107. [Google Scholar]
  37. Zhu, C. The ecological niche ecostate-ecorole theory and expansion hypothesis. Acta Ecol. Sin. 1997, 17, 324–332. [Google Scholar]
  38. Liu, W. A Dynamic Comprehensive Evaluation Model Based on the Niche Theory. Appl. Math. Inf. Sci. 2013, 7, 359–362. [Google Scholar] [CrossRef]
  39. Xiao, Y.; Mao, X. Urban Niche Theory and It’s Application. China Popul.·Resour. Environ. 2008, 5, 41–45. [Google Scholar]
  40. Zhou, B.; Zhong, L.; Chen, T.; Zhang, A.; Qi, J. The Ecotourism Potential of the Sino-Russian Border River of Heilongjiang Based on Niche Theory. Resour. Sci. 2014, 36, 1142–1151. [Google Scholar]
  41. Xie, B.; Chen, Y.; Li, X. The “Beautiful China” Evaluation System Based on Niche Theory. Econ. Geogr. 2015, 35, 36–42. [Google Scholar]
  42. Sun, Y.; Fan, J.; Zhao, J. The Cooperative Relationship of Core Cities in Xinjiang Silk Road Economic Belt Based on Niche Theory. Math. Pract. Aware. 2020, 50, 252–262. [Google Scholar]
  43. Liu, D.; Huang, A.; Yang, D.; Lin, J.; Liu, J. Niche-Driven Socio-Environmental Linkages and Regional Sustainable Development. Sustainability 2021, 13, 1331. [Google Scholar] [CrossRef]
  44. Benalcazar, P.; Orozco, L.F.; Kaminski, J. Resource Dependence in Ecuador: An Extractives Dependence Index Analysis. Gospod Surowcami Min. 2019, 35, 49–62. [Google Scholar] [CrossRef]
  45. Chen, L.M.; Huo, C.J. The Measurement and Influencing Factors of High-Quality Economic Development in China. Sustainability 2022, 14, 9293. [Google Scholar] [CrossRef]
  46. Hwang, C.; Kwangsun, Y. Multiple Attribute Decision Making–Methods and Applications; Springer: Berlin/Heidelberg, Germany; New York, NY, USA, 1981. [Google Scholar]
  47. Shannon, C.E. A Mathematical Theory of Communication. Bell Syst. Tech. J. 1948, 27, 379–423. [Google Scholar] [CrossRef]
  48. Chen, P. Effects of normalization on the entropy-based TOPSIS method. Expert Syst. Appl. 2019, 136, 33–41. [Google Scholar] [CrossRef]
  49. Dou, Z.; Sun, Y.; Wang, T.; Wan, H.; Fan, S. Exploring Regional Advanced Manufacturing and Its Driving Factors: A Case Study of the Guangdong–Hong Kong–Macao Greater Bay Area. Int. J. Environ. Res. Public Health 2021, 18, 5800. [Google Scholar] [CrossRef]
  50. Lu, Y.; He, T.; Xu, X.; Qiao, Z. Investigation the Robustness of Standard Classification Methods for Defining Urban Heat Islands. IEEE J. Sel. Top. Appl. Earth Obs. Remote Sens. 2021, 14, 11386–11394. [Google Scholar] [CrossRef]
  51. Li, A.; Wang, A.; Liang, S.; Zhou, W. Eco-environmental vulnerability evaluation in mountainous region using remote sensing and GIS—A case study in the upper reaches of Minjiang River, China. Ecol. Model. 2006, 192, 175–187. [Google Scholar] [CrossRef]
  52. Hou, K.; Zhou, J.; Li, X.; Ge, S. Study on GIS Visualization in Evaluation of the Human Living Environment in Shenyang-Dalian Urban Agglomeration. Scientifica 2016, 2016, 7462832. [Google Scholar] [CrossRef] [Green Version]
  53. Min, Z.; Yuyu, Z.; Xuecao, L.; Weiming, C.; Chenghu, Z.; Ting, M.; Manchun, L.; Kun, H. Mapping urban dynamics (1992–2018) in Southeast Asia using consistent nighttime light data from DMSP and VIIRS. Remote Sens. Environ. 2020, 248, 111980. [Google Scholar] [CrossRef]
  54. Liu, D.; Huang, A.; Yang, D.; Lin, J.; Cui, Y. Scale effect of urban niche in Zhejiang Province. Acta Ecol. Sin. 2022, 42, 528–538. [Google Scholar]
  55. Liu, J.; Bian, Z. Research on the Measurement of Economic High-quality Development Level of Resource-based Cities—Based on the New Development Concept. Inq. Into Econ. Issues 2022, 1, 92–111. [Google Scholar]
  56. Cui, D.; Bu, X.; Xu, Z.; Li, G.; Wu, D. Comprehensive evaluation and impact mechanism of high-quality development of China’s resource-based cities. Acta Geogr. Sin. 2021, 76, 2489–2503. [Google Scholar]
  57. Zhao, F.; Zhang, S.; Du, Q.; Ding, J.; Luan, G.; Xie, Z. Assessment of the sustainable development of rural minority settlements based on multidimensional data and geographical detector method: A case study in Dehong, China. Socio-Econ. Plan. Sci. 2021, 78, 101066. [Google Scholar] [CrossRef]
Figure 1. The study areas.
Sustainability 14 12846 g001
Figure 2. Spatial distributions of the niche types of high-quality development. (a) Spatial distributions of the niche types of high-quality development in 2009. (b) Spatial distributions of the niche types of high-quality development in 2012. (c) Spatial distributions of the niche types of high-quality development 2015. (d) Spatial distributions of the niche types of high-quality development in 2018.
Sustainability 14 12846 g002aSustainability 14 12846 g002b
Figure 3. Distributions of the high-quality-development niche in 2009, 2012, 2015 and 2018.
Sustainability 14 12846 g003
Figure 4. Sub-dimensional niche breadth of five niche types.
Sustainability 14 12846 g004
Figure 5. Sub-dimensional niche breadth of resource-based cities in four regions in China.
Sustainability 14 12846 g005
Figure 6. Sub-dimensional niche breadth of resource-based cities in different development stages.
Sustainability 14 12846 g006
Figure 7. Relevance between the sub-dimensional niche breadth and the high-quality-development niche.
Sustainability 14 12846 g007
Figure 8. The sub-dimensional niche differentiation indices for the high-quality development.
Sustainability 14 12846 g008
Figure 9. The niche differentiation indices for the high-quality development.
Sustainability 14 12846 g009
Table 1. The indicator system for measuring the high-quality-development niche.
Sub-Dimensional NicheFactor LayerIndicator LayerAttribute
Niche of economic baseEconomic efficiencyGDP growth rate (%)+
Per capita GDP (CNY)+
Fixed-asset investment rate (%)+
Industrial structureSecondary industry as percentage to GDP (%)-
Tertiary industry as percentage to GDP (%)+
Financial capacityFinancial self-sufficiency rate (%)+
Economic decentralizationAmount of foreign capital actually utilized to GDP (%)+
Total import and export to GDP (%)+
Niche of resource and energyAgricultural resourcesPer capita grain production (kg)+
Infrastructure resourcesPer capita area of city-paved roads at year-end (m2)+
Area of green land per ten thousand people (hectare)+
Total gas supply (coal gas, natural gas) (ten thousand m3)+
Resource consumptionHousehold water consumption for residential use (ton)-
Growth rate of energy consumption per unit of GDP (%)-
Resource dependenceProportion of employees in the mining industry (%)-
Niche of ecological environmentEnvironmental statusAnnual mean concentration of PM2.5 (ug/m3)-
Volume of industrial waste-water discharged (ten thousand tons)-
Volume of industrial sulfur dioxide emissions (ton)-
Volume of industrial soot (dust) emissions (ton)-
Ecological constructionRatio of industrial solid wastes comprehensively utilized (%)+
Ratio of consumption wastes treated (%)+
Ratio of centralized, treated sewage-work waste-water (%)+
The proportion of the green-covered area as the built-up area (%)+
Niche of people’s livelihood servicesPopulation sizeNatural population growth rate (‰)+
Urban–rural gapIncome ratio of urban and rural residents (times)-
Income and expenditurePer capita household-saving deposits at year-end (CNY)+
Per capita average wage of employed staff and workers (CNY)+
Per capita total retail sales of consumer goods (CNY)+
People’s livelihood protectionNumber of licensed (assistant) doctors per ten thousand people (person)+
Number of beds in hospital health centers per ten thousand people (unit)+
Number of buses and trolley buses under operation at year-end per ten thousand people (unit)+
Per capita collections of public libraries (copy)+
Niche of innovation potentialInnovative mechanismsR&D internal outlay to GDP (%)+
The proportion of science expenditure (%)+
The proportion of education expenditure (%)+
Innovative subjectsNumber of industrial enterprises above designated size per ten thousand people (unit)+
Number of full-time teachers in regular institutions of higher education per ten thousand people (person)+
Innovative outputsNumber of students in regular institutions of higher education per ten thousand people (person)+
Number of patent authorizations per ten thousand people (piece)+
Table 2. The classifications of the high-quality-development niche in 2018.
Niche TypesCodeNiche ValuesCities
High-niche citiesH-CC > 0.3833Karamay, Huzhou, Dongying, Ordos, Xuancheng, Ma’anshan, Zibo, Tangshan, Panzhihua and Yangquan
Relatively high-niche citiesRH-C0.3728 < C ≤ 0.3833Daqing, Shizuishan, Chuzhou, Lijiang, Tongling, Jingdezhen, Baotou, Wuhai, Xuzhou, Luoyang, Jiaozuo, Jinchang, Laiwu, Jinzhong, Taian, Longyan, Xinyu, Anshan, Pingxiang, Xianyang, Zhangye, Suqian, Guangyuan, Ya’an, Zaozhuang, Jining, Linyi, Hebi, Huangshi and Benxi
Medium-niche citiesM-C0.3678 < C ≤ 0.3728Sanming, Zigong, Mudanjiang, Baoji, Ganzhou, Tongchuan, Wuwei, Lincang, Sanmenxia, Songyuan, Qingyang, Chizhou, Ezhou, Shaoguan, Longnan, Yichun, Yan’an, Hezhou, Heihe, Bozhou, Fushun, Panjin, Puyang, Baishan, Hengyang, Nanping, Chenzhou, Luzhou, Huaibei, Yichun, Baiyin, Jilin, Fuxin, Hulunbeir, Liupanshui, Qitaihe and Xingtai
Relatively low-niche citiesRL-C0.3636 < C ≤ 0.3678Nanyang, Anshan, Shaoyang, Tonghua, Chifeng, Chengde, Pingdingshan, Liaoyuan, Jincheng, Yulin, Huainan, Shuangyashan, Jixi, Huludao, Zhaotong, Handan, Xinzhou, Suzhou, Zhangjiakou, Baoshan, Shuozhou, Yuncheng, Changzhi, Hegang, Yunfu, Linfen, Baise, Datong, Pu’er, Loudi, Guang’an, Dazhou, Luliang and Pingliang
Low-niche citiesL-C0 < C ≤ 0.3636Qujing, Nanchong, Weinan and Hechi
Table 3. The high-quality-development niche of resource-based cities in four regions in China.
YearNiche Values in Northeastern CitiesNiche Values in Eastern CitiesNiche Values in Western CitiesNiche Values in Central Cities
20090.36480.36590.36250.3639
20120.36650.36910.36450.3654
20150.36540.37210.36750.3681
20180.36950.37730.37270.3720
Table 4. The high-quality-development niche of resource-based cities in different development stages.
YearNiche of Growth CitiesNiche of Mature CitiesNiche of Recession CitiesNiche of Regeneration Cities
20090.36270.36330.36480.3664
20120.36490.36540.36600.3690
20150.36650.36820.36780.3703
20180.37110.37250.37210.3761
Publisher’s Note: MDPI stays neutral with regard to jurisdictional claims in published maps and institutional affiliations.

