Article

Does Innovative City Policy Improve Green Total Factor Energy Efficiency? Evidence from China

1
School of Economics and Management, Ningxia University, Yinchuan 750021, China
2
Guangdong Institute for International Strategies, Guangdong University of Foreign Studies, Guangzhou 510420, China
*
Authors to whom correspondence should be addressed.
Sustainability 2022, 14(19), 12723; https://doi.org/10.3390/su141912723
Submission received: 7 September 2022 / Revised: 30 September 2022 / Accepted: 3 October 2022 / Published: 6 October 2022
(This article belongs to the Topic Energy Economics and Sustainable Development)

Abstract

:
Relying on innovation to drive green energy efficiency improvement has emerged as the key to achieving the Sustainable Development Goals (SDGs) under the pressure of the global economic downturn and carbon emission reduction targets. Using the multi-period difference-in-difference (DID) method and panel data of the 282 cities between 2004 and 2019, this study evaluates and examines the effects, channels, and heterogeneity of the impact of the national innovative city pilot policy (NICPP) on the green total factor energy efficiency (GTFEE). The results are as follows: (1) the baseline regression results show that the NICPP has a positive impact on GTFEE, and the conclusions are still valid after robustness tests and instrumental variables approach to solve endogeneity problems; (2) channel tests show that the NICPP can enhance GTFEE through three channels: industrial structure transformation, green technology innovation, and resource allocation improvement; (3) heterogeneity analysis shows that the NICPP is more effective in improving GTFEE in cities with rich science and education resources, newer industrial bases, and higher initial industrial concentration. This study offers encouraging empirical support and policy implications for employing innovative city policies to improve GTFEE, cities should adapt to local conditions to encourage sustainable development-oriented innovation, industrial clustering, and optimize the market-based allocation of energy.

1. Introduction

Under the uncertainty of the COVID-19 pandemic, the global economic slump, and the world’s frequent local conflicts, high-quality economic and social development is confronted with the critical issues and dual difficulties of climate change and energy transformation [1]. According to BP’s Statistical Review of World Energy 2022, global primary energy consumption rebounded sharply in 2021, global carbon emissions have also increased by 5.7%, the promise of net zero carbon emissions has yet to be fully translated into real progress (https://www.bp.com/en/global/corporate/energy-economics/statistical-review-of-world-energy.html, accessed on 27 September 2022), and sustainable development process continues to slow down. The Sustainable Development Goals (SDGs) designed by United Nations, set the goals that world development must balance social, economic, and environmental sustainability by 2030 (https://www.undp.org/sustainable-development-goals, accessed on 27 September 2022). To be specific, Goal 7 of affordable and clean energy and Goal 11 of sustainable cities and communities state that reducing the carbon intensity of energy is a key to achieving long-term climate goals, and Goal 9 of industry, innovation, and infrastructure and Goal 12 of responsible consumption and production state that cities should promote innovation and infrastructure to strengthen the capacity of cities to cope with climate change, and promote the efficient use of resources and energy [2]. Therefore, cities should undertake the critical responsibility for ensuring the sustainable development of national economies, promoting the clean and efficient use of energy, and achieving the goal of carbon peak and carbon neutrality ultimately [3,4].
Worldwide, a new round of global technological revolution and industrial change is emerging, driven by new energy and intelligence and other technological advances and rapidly declining costs; the model of economic growth that relies solely on material consumption, factor inputs and low-cost comparative advantage is no longer sustainable, and resource shortages and ecological deficits have become a major obstacle to economic and social development today. Under the serious resource and carbon emission constraints, insistence on being innovation driven, taking innovation as the first driving force to lead the development and enhancing the innovation capability and green utilization efficiency of energy has become an important part of sustainable development [
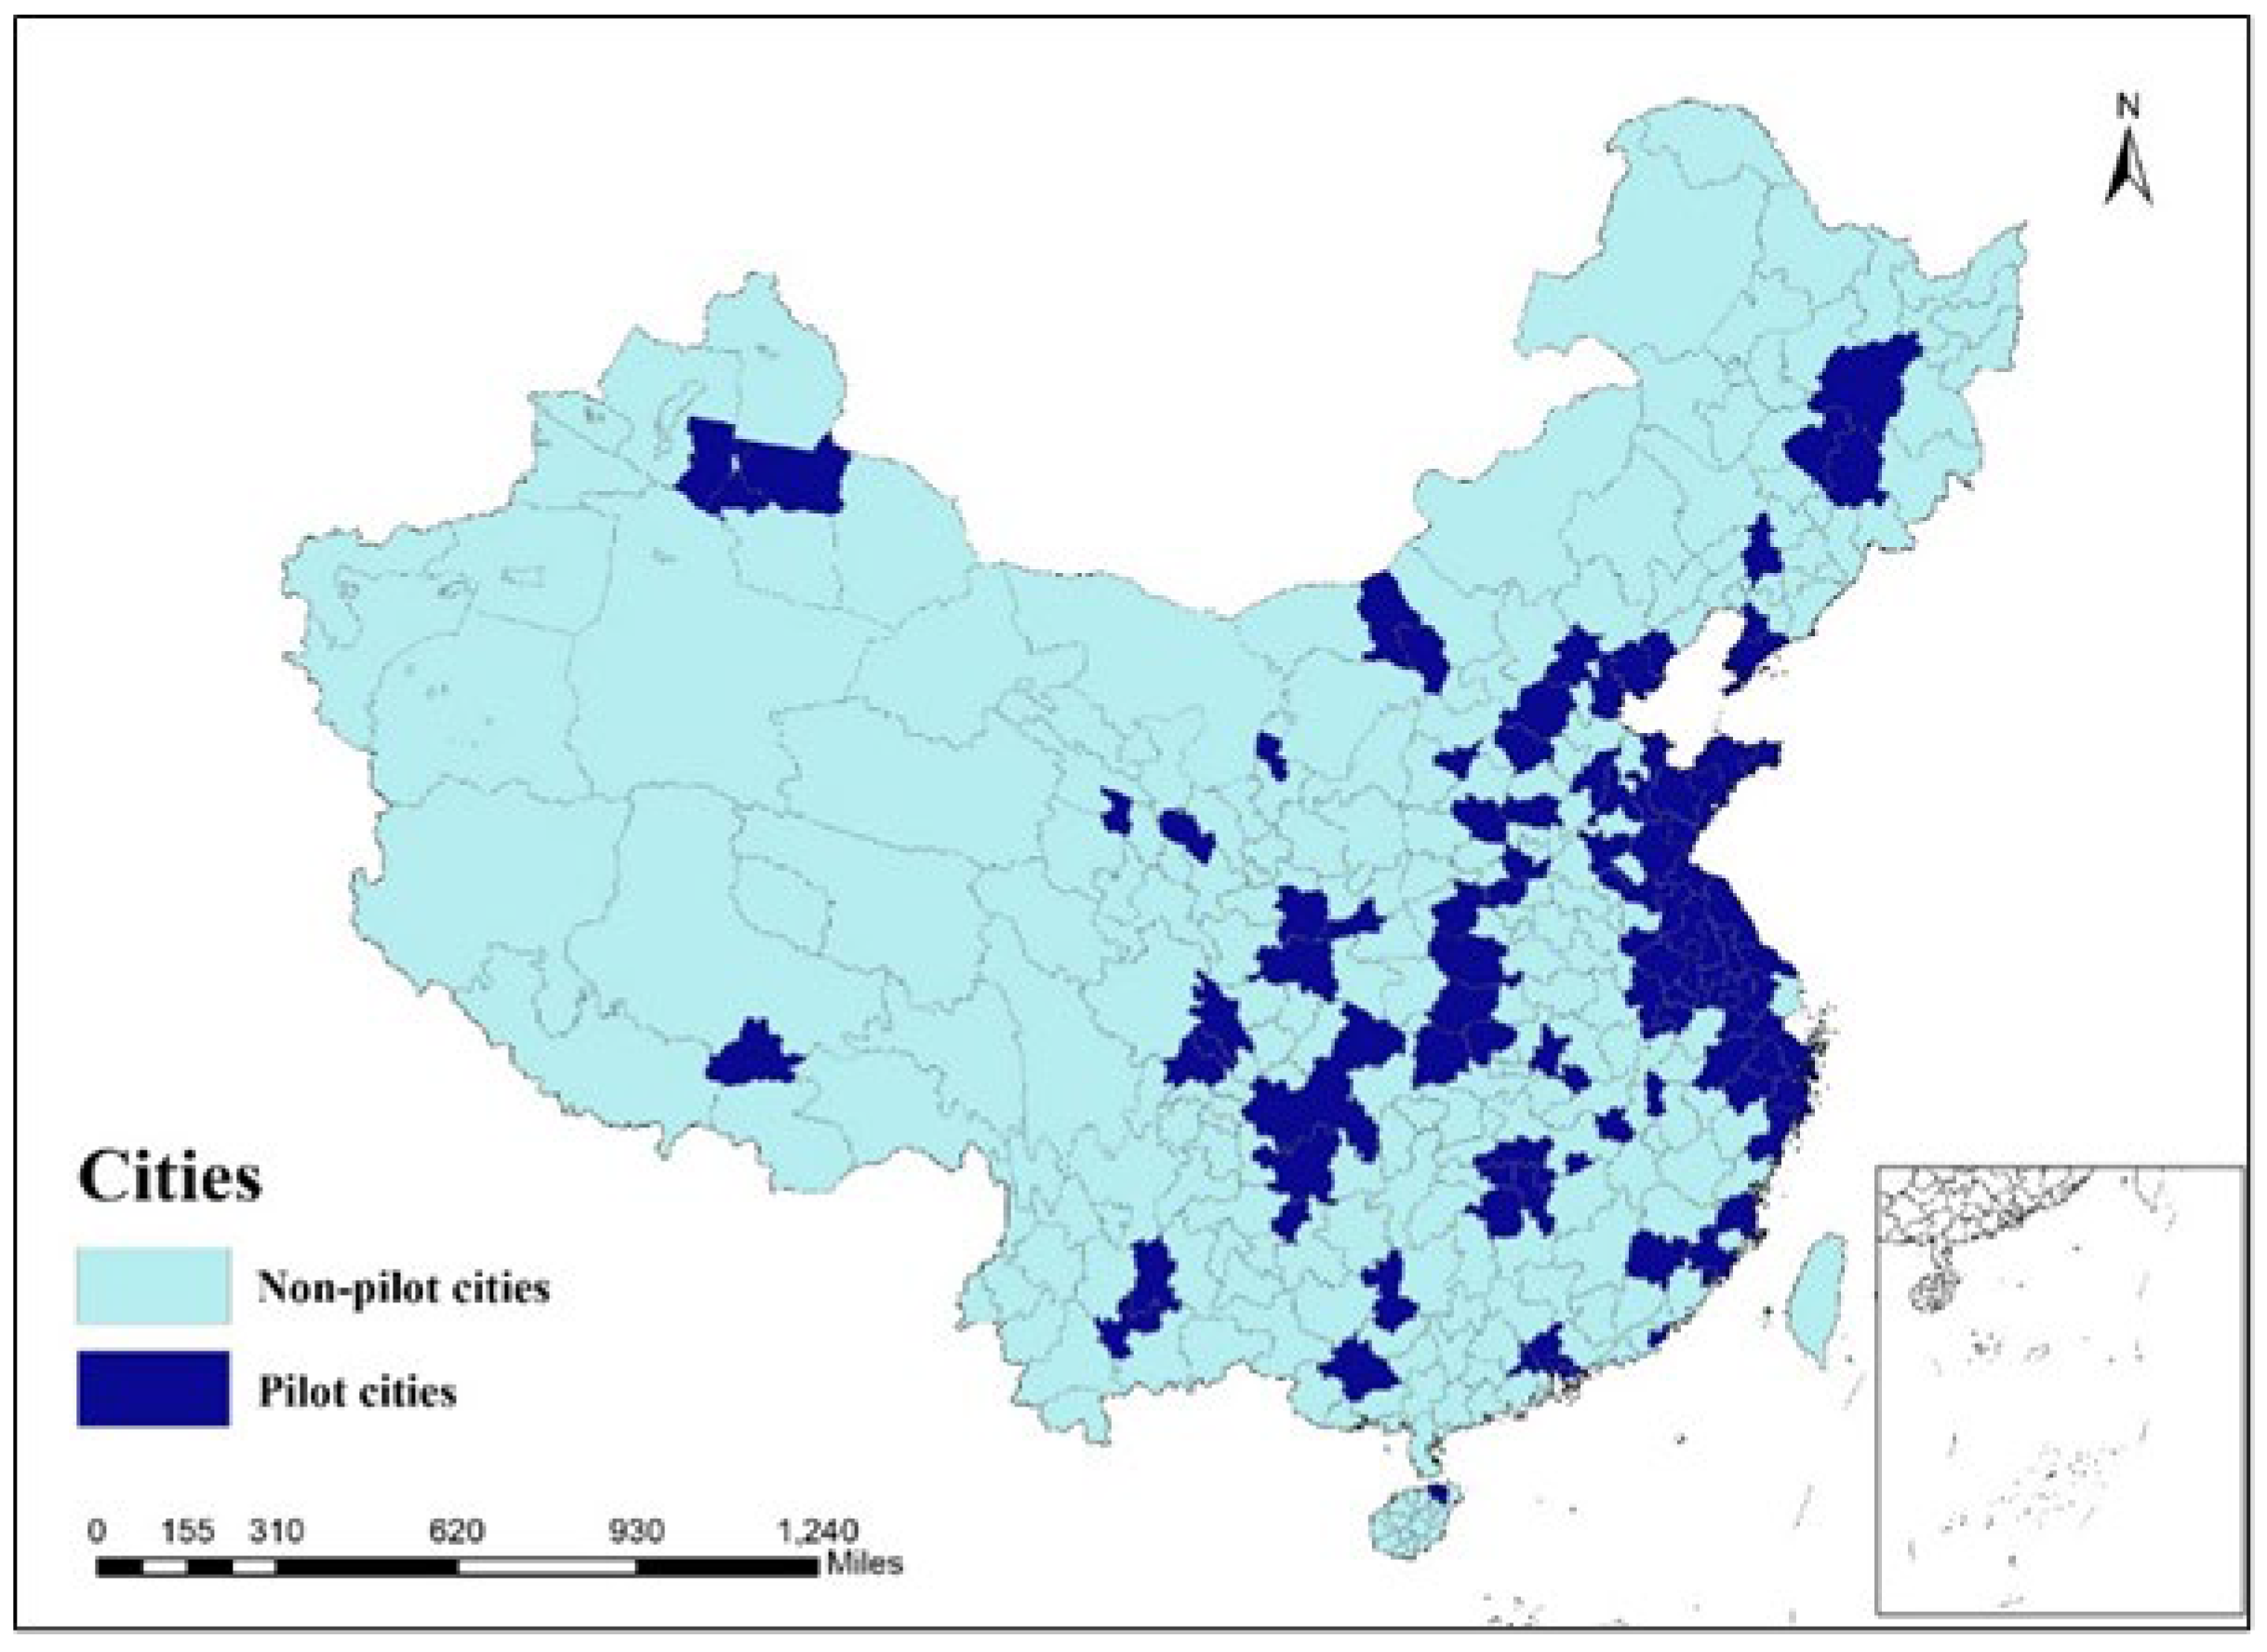
5]. Cities can develop their economies over time in a sustainable manner, and they can lead and help shape the future of countries worldwide despite severe resource constraints and the demands of low-carbon development. To maintain their competitive advantage and sustain their growth into the future, cities around the world, in both developed and developing countries, have developed innovative urban development strategies. Since Shenzhen was approved as the first batch of innovative pilot cities in 2008 (http://www.gov.cn/jrzg/2008-06/24/content_1026347.htm, accessed on 13 May 2022), the Chinese government has made efforts to implement the national innovative city pilot policy (NICPP) to promote the transformation of urban economic development from being traditionally factor driven to innovation driven, improve independent innovation capability and stimulate endogenous growth momentum [6,7]. The pilot cities might rely on its science and technology innovation advantage, which is obtained from the innovation-driven policies, to crack the resource utilization problem [8]; they could also benefit from the policy so that they have a more rational industrial structure and equitable market environment, improving the sustainable development of energy indirectly [9].
Since its reform and opening up, an important experience of China’s rapid and stable economic development has been the “Chinese style decentralized” economic system and the active use of economic policies [10]. In addition, local governments follow the guidance of the central government to introduce economic policies that promote economic growth and achieve economic development through the incentive model of “promotion tournaments” [11]. However, behind the rapid economic development, local governments often pursue only the growth of economic volume, ignoring the accompanying energy and environmental problems of high pollution, high energy consumption, and inefficient development [12]. Given this, this paper uses panel data of 282 Chinese cities from 2004 to 2019 and employs a multi-period difference-in-differences method to focus on answering the following questions: First, can the innovative city pilot policy, as an economic policy issued by the central government and independently explored and implemented by local subjects, achieve green total factor energy efficiency improvement in cities? Second, if the NICPP has a promotion effect on GTFEE, what are the transmission channels? Third, does each city’s innovation base, industrial base, and industrial development base have a heterogeneous influence on the policy effect of GTFEE enhancement? The solution to the above questions is related to how to further implement the pilot policy of innovative cities and how to use policy tools to enhance the green total factor energy efficiency, which has important research value for achieving energy saving and green development. Therefore, this study tries to fully explore the relationship between innovation-driven policy and the sustainable development of energy efficiency by taking China’s national innovative city pilot policy and green total factor energy efficiency as an example. Moreover, this study seeks to offer important implications for achieving the Sustainable Development Goals (SDGs) adopted by the United Nations.
The remainder of the paper is structured as follows: Section 2 is a literature review, Section 3 is the policy background and theoretical hypotheses, Section 4 is the model construction and variable selection, Section 5 is the empirical analysis, Section 6 is the channels testing and further discussion, Section 7 is the main conclusions and policy recommendations, and Section 8 is the future research proposals.

2. Literature Review

The improvement of energy use efficiency is an important tool to address the issues of economic development and environmental governance. In studies related to energy efficiency, previous works in the literature often used the GDP output per unit of energy consumed in the production process to measure the energy efficiency of a sector or the whole economy [13,14]. However, this approach relies on a single input, ignoring other important inputs, such as capital and labor, and the measurement is too simple to accurately assess true energy efficiency. Some researchers proposed the concept of total factor energy efficiency, arguing that in addition to capital and labor, energy consumption should also be considered as an input, which fully considers the mutual substitution effect between multiple input factors and overcomes the drawback of considering only one kind of output and input for single factor energy efficiency [15]. However, the traditional total factor energy efficiency does not include non-desired outputs and does not consider pollutants in the model. Researchers have gradually included environmental pollution factors into the model, which is called green total factor energy efficiency [16]. Many scholars tested that energy efficiency without considering non-desired outputs significantly overestimates GTFEE considering both desired and non-desired outputs [17,18,19], so there is a strong need to use the GTFEE to measure the energy efficiency of the region.
How to improve urban energy efficiency, especially GTFEE, is currently a hot topic of great interest to academia, politics, and business, and there are extensive works in the literature on what factors affect and how to influence GTFEE [20,21,22]. A part of the literature examines the causal effects of industrial structure, resource allocation, and other factors on GTFEE from the city- and industry-level factors and explores the channels and mechanisms of influence [21,22,23,24,25,26,27,28,29,30]. In terms of industrial structure transformation and technological innovation, some researchers using the spatial econometric model, concluded that positive industrial structure adjustment can significantly contribute to the improvement of GTFEE [29,30]. Internet development indirectly improves GTFEE by reducing the degree of resource mismatch, enhancing regional innovation capacity, and promoting industrial structure upgrading; other researchers argued that information and communication technology (ICT) development has a positive contribution to GTFEE through the technological innovation effect and industrial structure effect, and the positive effect of resource mismatch on both has a non-linear threshold effect [21]. From the perspective of environmental regulation, Wang and Yuan (2018) [27] using industry-level data, argued that the impact of environmental regulation on GTFEE in industrial industries has a significant inhibitory effect in the short run and heterogeneity in the long run. Hao et al. (2022) [25] argued that environmental regulation enhances the differential impact of ICT development on GTFEE generally, while there is a non-linear relationship between different environmental regulation intensities. In terms of resource misallocation, Hao et al. (2020) [24] used spatial measures and threshold models to empirically conclude that local corruption exacerbates the inhibitory effect of labor resource mismatch on GTFEE. Guo and Liu (2022) [23] argued that the impact of energy price fragmentation on green total factor energy efficiency shows an inverted U-shaped curve, while at this stage, reducing the market fragmentation of energy prices in China is beneficial for green total factor energy efficiency. In micro-level studies, cross-regional investment significantly improves the GTFEE of territorial firms through the mediating effect of technological innovation [28], while price distortion significantly reduces the energy efficiency of firms [26].
Another series of literature explores the impact of various regional policies on GTFEE and their channels of action from a policy evaluation perspective [22,31,32,33,34,35,36]. Among the foreign opening policies, Jiang et al. (2021) [31] used the synthetic control method (SCM) to study the impact of free trade zone policies on GTFEE, arguing that the main driver is technological progress. Among environmental regulation-type policies, a large number of studies have shown that environmental regulation can promote GTFEE [32]: Shi and Li (2020) [33] argued that the intensity of green innovation significantly increased the contribution of the emissions trading system to the improvement of GTFEE; Chen et al. (2021) [34] found that the carbon emissions trading scheme improved energy efficiency by promoting the technological innovation of enterprises, and the level of marketization enhanced the enhancement effect of this policy on GTFEE; Hong et al. (2022) [22] examined the impact of environmental regulation on GTFEE at the theoretical level by constructing a general equilibrium model and empirically tested that the carbon emissions trading scheme significantly improved urban GTFEE through green innovation and resource allocation channels; Dong et al. (2022) [35], using the synthetic control method, analyzed that smart city policy (SCP) promotes innovation by increasing the level of intelligence (including information technology, human capital, and technology), thus increasing urban ETFEE, and that public participation and market conditions play a positive moderating role; and Cao et al., (2021) [36] concluded that National E-commerce Demonstration Cities affect urban GTFEE through the industrial structure upgrading effect, non-productive cost reduction effect, and green innovation incentive effect.
In the policy evaluation of the NICPP, a typical innovation policy, many studies have focused on the impact of the policy on environmental, energy, and innovation factors [10,37,38]. The most similar studies to this paper focused on the impact of NICPP on energy efficiency, energy productivity, and eco-efficiency: Li et al. (2021) [39] used the SBM-DEA method to measure ecological efficiency and concluded that NICPP can positively affect urban eco-efficiency through technological innovation, industrial restructuring, and direct government intervention effects; Yu et al. (2022) [6], using the stochastic frontier analysis (SFA) method to construct an energy productivity index, concluded that NICPP can improve energy productivity by enhancing innovation quality, R&D expenditure, and innovation behavior; and Yang et al. (2022) [9] conducted a study using single-factor energy efficiency and concluded that NICPP improves energy efficiency directly or indirectly by establishing evaluation indicators, optimizing industrial structure, and promoting the level of urban innovation, but did not consider the inclusion of non-desired outputs, which would result in a large deviation from the reality.
After combing through a large amount of literature, we found that most of the existing studies focus on the policy effects of the industrial structure, resource allocation, and other factors as well as environmental regulation policies on GTFEE, and the research on the policy effects of NICPP mainly focuses on innovation, environment, industrial structure, etc. However, the existing literature still suffers from several deficiencies, and this study contributes to the literature on the following three grounds. First, the existing literature has not considered the impact of innovation-driven policies on the greening of energy efficiency; this study uses indicators of green total factor energy efficiency measured by the DEA method that includes environmental pollution to assess for the policy effects of NICPP on GTFEE enhancement, which provides a reliable and realistic basis for innovation and energy efficiency enhancement in a wide range of developing countries. Second, there is no unified research framework for the impact of innovation-driven policies on energy efficiency. The impact mechanism of NICPP on GTFEE in this study is explored from three channels—industrial structure transformation, green technology innovation, and resource allocation improvement—to gain insight into how innovation policies affect green development and to complement the research in the field of innovation and energy. Third, existing studies on the heterogeneity of innovative cities are vague. Unlike the traditional governmental mandatory policies, the NICPP, a non-mandatory central governmental cooperation policy, gives each local government more freedom in policy implementation, so it is still necessary to consider the heterogeneous effects of different types of cities, especially in terms of scientific and educational resources, industrial foundation, and industrial agglomeration, when examining the policy effects.

3. Policy Background and Theoretical Hypothesis

3.1. Policy Background

Innovation is the first impetus and key pillar for constructing a modern economic system, and it is also the primary driving force of government and social progress. [6,37]. An innovative city regards scientific and technological advancement as the primary engine of economic and social progress, with abundant innovation resources and a dynamic innovation environment. As innovative cities are built, cities will gradually master an abundance of innovation resources, lively innovation subjects, effective innovation services, and government governance, as well as a favorable atmosphere for creativity and innovation [9,37,38].
To ensure the smooth implementation of the national innovative city pilot policy and accelerate innovation-driven development, the National Development and Reform Commission (NDRC) approved Shenzhen as the first innovative pilot city in 2008. A typical progressive procedure pattern of the interaction between central and local governments, China’s execution of its national innovative city program approximately followed a progression from small-scale pilot to large-scale implementation. On 6 January 2010, 16 cities, including Beijing, were designated as pilot cities by NDRC. In October of the same year, the Ministry of Science and Technology approved 20 cities (districts) as pilot cities (districts). Since then, the pilot scope has been expanded one after another, with 5, 2, and 10 cities being approved as pilot cities in 2011, 2012, and 2013 respectively, and 17 more cities were approved to build national innovation cities in April 2018. As of August 2022, there were 103 innovative pilot cities in China (http://www.gov.cn/zhengce/zhengceku/2022-01/09/content_5667250.htm, access on 1 May 2022), and their spatial distribution is shown in Figure 1.
It can be noted that the formation of innovative pilot cities is mostly located in the eastern coastal areas and regions with strong economic development levels in the central and western regions, with the majority of them being provincial capital cities and sub-provincial cities. These cities have higher administrative levels, a superior economic base, comparatively strong strength, abundant innovation resources, innovation potential, and an innovative environment for executing innovation policies when compared to other unapproved pilot cities. The factors listed above play an important supporting and leading role in the development of an innovative country.
Unlike the mandatory regulatory policies, the NICPP sets up several assessment indicators for each pilot city by establishing an innovation index system to guide the construction direction and target tasks, which is a major project of independent innovation to coordinate economic, scientific and technological, and educational development to implement the construction of the innovative cities [9]. The NICPP requires systematically promoting urban innovation, industrial innovation, and enterprise innovation to realize development mode transformation and promote healthy economic development.
Since the implementation of the NICPP, the central government has mainly issued, for example, the Guidance on Further Promoting the Pilot Work of Innovative Cities released in 2010 and the Guidelines for Building Innovative Cities released in 2016, as well as the monitoring and evaluation indexes for the construction of innovative cities to regularly monitor and evaluate the construction process. At the same time, the local governments of the pilot cities have also continued to issue many construction plans, such as the Shenzhen National Innovative City Master Plan (2008–2015) released in 2008 and the Nanjing Action Plan for Accelerating the Construction of Leading National Innovative Cities released in 2022, which have formed a new mechanism of coordinated regional development with the central and local linkage of innovation policies and realized a virtuous cycle of promoting urban innovation development.

3.2. Theoretical Analysis and Research Hypotheses

The measurement of green total factor energy efficiency (GTFEE) includes factor inputs, such as capital and labor, desired outputs of economic efficiency, and non-desired outputs, such as pollution, so the improvement of GTFEE includes the improvement of desired outputs and the reduction of non-desired outputs under the condition of constant input factors. With the rapid expansion of urban scale, the huge demand for energy and the consequent environmental pressure is increasing, and reconciling economic growth, energy efficiency and environmental pollution has become the key to high-quality economic growth and sustainable development. As an economic policy to promote the high-quality development of industry, environment, and energy by enhancing the innovation ability of cities and local enterprises, in the pilot policy of innovative cities, as proposed in the 2016 Guidelines for Building Innovative Cities (https://most.gov.cn/xxgk/xinxifenlei/fdzdgknr/fgzc/gfxwj/gfxwj2016/201612/t20161213_129574.html, accessed on 1 May 2022), one of its key tasks is to rely on scientific and technological innovation to crack the problem of green development, accelerate the construction of a resource-saving and environment-friendly society and set clear energy efficiency targets; the comprehensive energy consumption per unit of GDP and carbon emission intensity per unit of GDP will be used as assessment indicators. Therefore, Hypothesis 1 is proposed as follows.
Hypothesis 1:
The implementation of the national innovative city pilot policy can improve green total factor energy efficiency.
The national innovative city pilot policy may affect the energy efficiency of cities through various influence channels. First is the industrial structure transformation. In the guiding document “Building Innovative Cities Indicator System” (https://most.gov.cn/xxgk/xinxifenlei/fdzdgknr/fgzc/gfxwj/gfxwj2016/201612/W020161213625137030814.pdf, accessed on 1 May 2022) issued by the Chinese government, the requirements of innovation indicators are clearly defined, such as the proportion of the gross business income of national and provincial high-tech industrial development zones to regional GDP, and the proportion of the added value of knowledge-intensive service industries to regional GDP. The pilot cities can only pass the acceptance assessment if they complete the relevant index assessment before the end of the construction period. Therefore, the index assessment will prompt the pilot cities to pay more attention to the development of high-tech industries, which is conducive to the optimization of the industrial structure. Innovative cities have strong independent innovation capability, which can effectively support the upgrading of traditional industries and lead the development of strategic emerging industries. Take Hangzhou as an example; in the master plan of the innovative city, it is pointed out that strategic emerging industries are vigorously developed, traditional advantageous industries are upgraded and transformed, and clear targets of output value and scale are put forward for the transformation and upgrading of each industry to promote industrial transformation and innovation development. At the same time, a large amount of literature shows that when the industrial structure of a region is shifted from industries with low energy utilization to industries with higher energy utilization, the energy efficiency of the region is also greatly enhanced [40], and the industrial structure characteristics determine to some extent the industrial distribution pattern of energy consumption and pollution emissions. That is, the energy consumption and pollution emissions of modern service industries, such as those that are knowledge-intensive, are significantly lower than those of capital-intensive and energy-intensive industries [36]. Therefore, it can be argued that the NICPP promotes the optimization and upgrading of the industrial structure by supporting the development of service industries and replacing high-energy-consuming and high-pollution-emitting industries, thus promoting the growth of GTFEE in pilot cities.
Second is green technology innovation. Relying on scientific and technological innovation to crack the green development problem is one of the pilot policy implementation goals of innovative cities. In Foshan City, for example, it is proposed in the implementation plan of building a national innovative city to focus on the demonstration of green environmental technology innovation, such as urban ecological restoration, industrial pollution prevention and control, and research on energy-based comprehensive utilization technology systems and major equipment. At the same time, the Chinese government has also clearly stated in the Carbon Neutral Work Views (http://www.gov.cn/zhengce/2021-10/24/content_5644613.htm, accessed on 13 May 2022) that it is necessary to “strengthen major green and low-carbon science and technology research and application, and significantly improve energy use efficiency”. Green innovation has been an important means to alleviate the contradiction between rapid economic growth and severe environmental pollution [41], and under resource and environmental constraints, various government policies also tend to promote green innovation rather than traditional technological innovation to increase energy productivity while improving enterprise productivity [42] and reducing pollution emissions [43]. Innovative city pilot policies reduce energy consumption and environmental pollution per unit of product generated by encouraging firms to increase their share of green innovation [36]. A large number of studies at the micro-firm and city levels have also shown that firms with higher innovation activity are more willing to adopt existing energy-efficient technologies and improve GTFEE through process innovation [8]. Therefore, it can be assumed that the NICPP promotes the growth of GTFEE in pilot cities by improving the green technology innovation system of modern industries with enterprises as the main body and combining industry–university–research, thus promoting the green innovation level enhancement channel through enterprises.
Third is resource allocation improvement. Resource mismatch refers to the difference in the value of the marginal output of different industries and enterprises, which deviates from the state of “efficient allocation”, and this distortion of factor allocation will bring about efficiency loss [44]. One of the objectives of the pilot policy of innovative cities is to cultivate a fair and orderly market environment, play a decisive role in the market allocation of innovation resources, build a market-oriented mechanism for technological innovation, and improve innovation services. For example, in the innovative city construction 2025 plan, Chengdu city proposes to “broaden the channels and fields of international cooperation, and enhance the ability to effectively allocate and utilize global innovation resources” and “take independent innovation as the leading role, and gather and allocate innovation resources in the regional, national and even global competitive system”, i.e., using innovative policies to enhance the ability to allocate resources. In addition, the Chinese government proposed in the 14th Five-Year Plan for Modern Energy Systems to “integrate and optimize the allocation of scientific and technological resources” to promote the improvement of energy utilization efficiency and the reduction of economic costs. Therefore, it can be assumed that the NICPP can significantly improve GTFEE by improving the degree of resource mismatch and achieving a greening of the environment and energy use. At the same time, information imperfections and transaction cost problems may make rational producers tend to purchase and produce highly polluting and energy-consuming intermediate and final goods, thus reducing GTFEE [45]. A large number of studies have shown that negative marketization factors, such as factor price distortion, government corruption, and market segmentation, can negatively affect GTFEE [23,24,46]. Therefore, based on the above analysis, Hypothesis 2 is proposed as follows.
Hypothesis 2:
The implementation of the national innovative city pilot policy can improve green total factor energy efficiency through three intermediary channels: industrial structure transformation, green technology innovation, and resource allocation improvement.
In addition, innovative cities inevitably have heterogeneous policy effects on different types of cities during the piloting process [37]. First, from the perspective of heterogeneity of science and education resources, the main body of innovative cities is human capital, which, according to the endogenous economic growth theory, is an important source of technological progress in a country [47] and is an important guarantee for promoting the optimal allocation and efficient use of innovation resources and building innovative cities. At the micro-level, there is ample evidence that well-educated family members have higher ecological and energy awareness [48]; at the macro level, the improvement and optimization of science and education have a significant positive effect on improving the energy science, technology, and industrial innovation system [25]. Second, from the perspective of industrial base heterogeneity, regions with traditional industries as the main development model may suffer from the “resource curse” [49], such as sloppy development, backward infrastructure, and serious environmental pollution. In contrast to the emerging cities, the single resource-based industry has crowded out the development of final product industries and high-tech industries with high technological content and added value, so there may be a time-lag effect on the energy efficiency improvement brought by the innovation policy in the short term. At the same time, the heterogeneity of cities in terms of initial industrial agglomeration needs to be taken into account, as there are significant differences in the dominant industries among pilot cities, and the innovative city policy will have heterogeneous policy effects on each city. Numerous studies have shown that industrial agglomeration is beneficial to mitigate environmental pollution [22,34,37]. The agglomeration of enterprises generates economic scale effects and technological spillover effects among enterprises, which are conducive to the diffusion and use of industrial clean technologies and advanced energy technologies [50], so the industrial agglomeration in the region is conducive to the recycling of resources, and thus it can be argued that the pilot policy of innovative cities has a more pronounced effect on the enhancement of GTFEE in cities with high industrial agglomeration. Based on the above analysis, Hypothesis 3 is proposed in this paper as follows.
Hypothesis 3:
The improvement effect of the national innovative city pilot policy on GTFEE is heterogeneous in three types of cities: scientific and educational resources, industrial base, and industrial agglomeration.
Therefore, the channels and heterogeneity between NICPP and GTFEE above can be explained by the following diagram (Figure 2).

4. Model Development and Variable Description

4.1. Models and Data

This study primarily examined whether and how effectively the NICPP has improved cities’ GTFEE in China. The difference-in-differences (DID) method is favored by scholars for its simplicity and the advantage of avoiding endogeneity in the assessment of the economic effects of policy implementation. The traditional DID model assumes that all individuals in the experimental group have the same point in time when they start to be affected by the policy [51], but when the policy implementation nodes are inconsistent, a multi-period DID model should be used [52].
Since the NICPP was implemented intensively during the sample period, it can be considered a great “quasi-natural experiment”; therefore, a multi-period DID model is chosen for the baseline regression part of this paper to accurately assess the impact of policy implementation on the GTFEE of the city. In this paper, the first-level difference is the city level and the second-level difference is the year level, so we choose a multi-period DID model to accurately assess the impact of policy implementation on green total factor energy efficiency in cities [6]. To test the effect of the NICPP on GTFEE, the following two-way fixed-effect model of cities and years was built using the DID methodology for the baseline regression:
l n G T F E E i t = α + β d i d i t + γ X i t + φ i + μ t + ε i t
where i , t represent city and time, respectively; the explanatory variable l n G T F E E i t is a measure of the green total factor energy efficiency indicator for city i in year t; d i d i t represents a dummy variable for whether city i is an innovative pilot city in year t, where if the city in the year i is approved as a pilot, it equals 1; otherwise, it equals 0; X i t is a control variable for city characteristics, as set out in Section 4.4; φ i and μ t represent city and year fixed effects, respectively; and ε i t is a random disturbance term. In this study, Equation (1) is taken as the baseline model to test whether the impact of the NICPP on GTFEE is consistent with Hypothesis 1.
The empirical strategy of this paper is as follows. Firstly, a baseline regression of the causal relationship between NICPP and GTFEE is conducted using a multi-period DID model [52]. Secondly, an event study approach is used to ensure the validity of the DID model [52,53]. Next, as a further test of the validity of the DID estimates, we provide a series of robustness analyses, including a placebo test for the random assignment of NICPP. We match each treatment group sample to a specific control group sample, which makes the quasi-natural experiment approximately random with the PSM-DID method. We replace the explanatory variables with the energy efficiency measured by other methods, adding other control variables, a counterfactual test for advancing the policy implementation node, excluding other relevant policy interventions in the same period, and a city-specific sample of the DDD approach [22,33,36,54,55]. Finally, endogeneity test regressions are performed using historical-city and Confucian culture as instrumental variables to overcome the influence of endogenous factors as much as possible [56,57]. Details are shown in Section 5.

4.2. Explained Variables (GTFEE)

The core explanatory variable in this paper is green total factor energy efficiency (GTFEE). Among the studies related to the measurement of green total factor energy efficiency, the literature closely related to this paper is the measurement of GTFEE using the data envelopment analysis (DEA) method, which does not require the setting of specific functional forms and thus can avoid the structural bias caused by traditional accounting methods and SFA methods due to misset production functions. It is most widely used in efficiency evaluation [21,29,33].
Given this, the non-parametric hybrid radial super-efficient EBM model (super-epsilon-based measure model) based on non-desired output combined with the global Malmquist–Luenberger index is chosen in this paper, which is more in line with the actual production conditions and is also widely used for the measurement of eco-efficiency and energy efficiency. The selected measurement indexes are shown in Table 1. As shown, the labor force (L), capital (K), and energy consumption (energy) are selected as inputs, the gross regional product of city (GDP) as the desired output, and industrial sulfur dioxide emissions, industrial wastewater, and industrial smoke and dust emissions as undesired outputs for measurement. Among them, GDP data are calculated in real prices with 2004 as the base period. The perpetual inventory method of Hu and Kao (2007) [58] is used to calculate the capital stock, which is calculated by K t = I t + 1 δ K t 1 and the depreciation rate is taken as δ = 10 . 96 % [59]. Since official energy consumption data are only released at the provincial level, and satellite lighting data have been widely used to measure economic activities in recent years, this paper adopts a linear model without intercept to decompose provincial energy data into prefecture-level cities by lighting data values [33]. The underlying logic of this approach is that higher nighttime light levels in cities indicate more nighttime economic activity and energy consumption [60].
Figure 3 shows the trend of the mean GTFEE values of pilot cities and non-pilot cities calculated using the EBM-DEA method. The mean values of both types of cities fluctuate and increase from year to year, and the mean GTFEE values of innovative pilot cities are higher than those of non-pilot cities. Therefore, whether the NICPP has brought about an improvement in urban energy efficiency needs to be determined by a more precise method (Figure 4). For the spatial and temporal distribution of total factor energy efficiency in the sample cities in 2005 and 2019, it can be seen that China has a general upward trend in GTFEE during the 15 years and China’s energy transition is more successful.

4.3. Core Explanatory Variables

The core explanatory variable in this paper is the dummy variable for the pilot policy of innovative cities d i d i t , which is set to 1 in the year that the city becomes an innovative pilot city and in subsequent years, and 0 if the city is not an innovative pilot city or has not yet become a pilot city in that year. The list of cities in the treatment group is shown in Table 2. The list of cities in the treatment group is shown below.

4.4. Control Variables

Based on the previous studies [21,22,29,36,37], and combined with this study, we choose the following control variables as follows.
Level of economic development (lnpgdp): Measured using real GDP per capita [32]. A large body of literature suggests that economic growth positively contributes to energy efficiency improvements through channels such as scale effects and technological progress [21]. Therefore, we introduce the economic development level to examine whether it satisfies the EKC hypothesis at the city level.
Level of external openness (fdigdp): This paper uses the share of actual FDI in GDP for the year. FDI may have a “pollution sanctuary” effect and a “pollution halo” effect on the host country [61,62]. For newly industrialized countries, increased dependence on foreign investment may lead to increased energy consumption, but also increased energy efficiency through both product–technology spillovers from foreign investment liberalization and “Learning By Doing”. Therefore, we introduce the external openness level to control the foreign investment at the city level.
Level of infrastructure (lnroad). In this paper, we use the road area per capita to measure the level of urban infrastructure development. On the one hand, strengthening urban infrastructure construction is conducive to alleviating intra-city resource mismatch and improving urban productivity, thus enhancing GTFEE [63]; on the other hand, excessive infrastructure construction may increase pollution emissions and have a negative impact on GTFEE. In this study, we control infrastructure development to distinguish its impacts from the explanatory factors.
Level of financial development (lnfin). Measured using year-end financial institution deposit and loan balances as a share of GDP [35]. Numerous studies have shown that the level of financial development can contribute to energy efficiency through a variety of channels. The improvement of financial markets can, to varying degrees, increase the amount of loanable funds for various types of enterprises, reduce the risk of corporate investments and loans, and give enterprises the ability to invest more capital in projects with high technological content and less pollution [64], ultimately achieving an increase in energy efficiency. Therefore, we separate financial effects from the NICPP policy effects.
The degree of government intervention (lnfisc): This paper uses the local general public budget revenue for the local general public budget expenditure ratio measure [21]. The GTFEE of each city is closely related to government interventions, such as attracting investment and increasing financial support, which will promote productivity; however, excessive government intervention will cause inefficiency in the market and negatively affect the GTFEE. So, this study adds the public budget revenue and expenditure ratio to control variables for avoiding omitted variable bias.
Population density (popdensity): In this paper, population density is measured using population per unit area. Population density may increase energy efficiency by increasing economies of scale, cost savings, and technology spillovers to reduce pollution emissions through agglomeration effects [65]; however, as total emissions per unit area increases, the concentration of economic activity may also increase which can lead to scale effects, which can then lead to increased pollution and reduced energy efficiency [66]. Therefore, the effect of population density on GTFEE depends on the relative magnitude of the agglomeration and scale effects. Therefore, we should control population so that it can no longer act as a confounder in the model.
Science and technology expenditures (scindgdp): This paper uses a measure of society-wide science and technology expenditure as a share of GDP [24]. Existing studies are controversial regarding the changes in energy efficiency brought about by S&T innovation. On the one hand, S&T innovation can improve the production technology of enterprises and continuously increase the utilization of resources through the transformation of results; on the other hand, technological progress may trigger a “rebound effect” while promoting economic growth, leading to an increase in energy consumption [43]. In summary, the role of science and technology on GTFEE cannot be ignored.
Table 3 shows the descriptive statistics (observations, means, standard deviations, minimum and maximum values) for the main variables used in this paper.

4.5. Data Sources

This paper selected a total of 282 cities in China from 2004 to 2019, and the original data of statistical variables of each city were obtained from China Statistical Yearbook, China Urban Statistical Yearbook, China Environmental Statistical Yearbook, statistical yearbooks of provinces and cities, etc. Provincial energy data were obtained from China Energy Statistical Yearbook, and nighttime-light data were obtained from the National Qinghai-Tibet Plateau Science and Technology Center (http://data.tpdc.ac.cn, accessed on 20 May 2022) [67]. The data on green innovation of listed enterprises were obtained from the State Patent and Intellectual Property Office (SIPO) (http://epub.cnipa.gov.cn/, accessed on 6 June 2022), and other firm-level data were obtained from CSMAR, WIND, CNRDS. The raw data of industrial output value were obtained from the database of Chinese industrial enterprises.

5. Empirical Analysis

5.1. Baseline Regression

Based on the baseline regression Equation (1), this study uses the multi-period difference-in-differences method and the OLS estimation with fixed effects model. Table 4 reports the specific results of the baseline regression. The results in Column (1) show that the estimated coefficient of the DID term is significantly positive at the significance level of 1% when no control variables are included. This result verifies the correlation between NICPP and GTFEE. Columns (2)–(4) add control variables to Column (1) and control only for year fixed effects and city fixed effects, respectively, and the estimated coefficient of the DID term remains significantly positive at the 1% level of significance. Column (5) adds both year fixed effects, city fixed effects and control variables; the regression results are more plausible. The results show that after becoming an innovative pilot city, the city’s GTFEE increases by about 5.96% on average, and the GTFEE of the pilot city is higher than that of the non-pilot city, all other things being equal. That is, the innovative city pilot policy significantly contributes to the increase in urban GTFEE; in other words, the cities’ GTFEE increases by about 5.96% on average after becoming pilot cities, a result consistent with existing studies [6,9]. Thus, Hypothesis 1 was initially tested. The rest of the control variables are largely consistent with expectations.

5.2. Parallel Trend Test

An important prerequisite for assessing policy effects using the difference-in-differences method is that the explanatory variables need to satisfy the common trend assumption between the treatment and control groups, i.e., in the absence of a policy shock, the trends in the outcome variables should be the same for both groups. This study draws on Beck et al. (2010) [52] and McGavock (2020) [53], where the baseline regressions of the DID method are tested for parallel trends using the event study method, i.e., the year before the innovation city pilot policy is used as the comparison benchmark, and the year dummy variables of 14 years before and 11 years after the implementation of the policy are constructed with the cross-product terms of the corresponding policy dummy variables, which are modeled as
l n G T F E E i t = α   + s = 2 14 β p r e s D p r e s + β c u r r e n t D c u r r e n t + s = 1 11 β p o s t s D p o s t s + γ X i t + φ i + μ t + ε i t
In Equation (2), D p r e _ s , D c u r r e n t , and D p o s t _ s represent the cross-multiplication of the dummy variables with the corresponding policy dummy variables for the years before, during, and after the launch of the innovation city pilot policy respectively, and β p r e _ s , β c u r r e n t , and β p o s t _ s are the corresponding coefficients. The results are shown in Figure 5, with a confidence interval of 90%. There is no significant difference in the temporal trend of GTFEE before the cities participate in the innovation city pilot policy and none of them are significant, satisfying the common trend hypothesis. In addition, the subsequent regressions of the dynamic test show that the pilot policy of innovative cities significantly improves the GTFEE of the cities from the time of the implementation of the pilot policy until the 9th year after its establishment, but the improvement effect is not significant from the 10th year.

5.3. Robustness Tests

5.3.1. Placebo Test

The placebo test serves to exclude pseudo-regressions caused by missing variables and ensure a valid assessment of policy effects. In the case of empirical analysis using DID data over many years, there may be problems of standard error bias caused by serial correlation, which in turn leads to the over-rejection of the null hypothesis in regression tests [68]. All pilot cities and their policy periods were randomly sampled without repetition. A total of 75 cities were selected as virtual treatment groups each time (the sample of pilot cities in the baseline regression in this paper was 75, so 75 dummy treatment groups were also randomly selected for testing in the placebo test), and the corresponding random policy time points were randomly selected. The rest of the cities were used as virtual control groups. This process was repeated 1000 times, and the DID regression estimation coefficients of interaction between 1000 virtual treatment groups and virtual policy time were obtained [36]. The test results are shown in Figure 6. As shown, the dark line is the probability density distribution of DID coefficients corresponding to the placebo test, and the light line is the normal distribution. It can be seen that the vertical dashed line on the right side indicates the DID estimated coefficients in Column (5) of the baseline regression, which are all located in the low-tailed position of the coefficient distribution in the replacement test. The mean value of DID is close to 0 and follows a normal distribution. It means that the NICPP has no effect on city EE and that the promotion effect of the NICPP on city GTFEE described in this study is not influenced by random chance [69], so the baseline regression results of this paper pass the placebo test.

5.3.2. Propensity Score Matching Difference-in-Differences (PSM-DID) Method

Commonly supporting the hypothesis, the original hypothesis was that there was no significant difference between the experimental and control group covariates. By comparing the kernel density estimates of propensity scores before and after matching, we can see that the degree of overlap of propensity scores between the two groups is significantly higher after matching, which is consistent with the common trend hypothesis. A year-by-year PSM equilibrium test was then performed to compare the logit regression results for different years before and after matching, and the results showed that the covariate coefficient values decreased and turned insignificant in all years after matching, indicating that there was no systematic bias in the covariates between the two groups in different years [54].
The kernel density plots before and after PSM are shown in Figure 7. Both kernel density curves deviated more before matching, but the distance of the mean line was shortened after matching, and the two curves were closer, so to some extent, it can indicate that year-by-year matching is effective. Subsequently, the DID regressions were performed using the weighted non-null sample, the sample satisfying the common support assumption and the matched frequency weighting after PSM, respectively, and the results are as shown in Table 5, and it can be seen that the baseline regression results remain robust when the selection bias problem is taken into account.
In addition, considering that the pilot policy of innovative cities was implemented in 2008 and the policy effect emerged, the policy may change the changes in relevant economic variables in the pilot area. This paper only matches the year-by-year propensity scores for the sample before the policy impact (i.e., the sample from 2005 to 2007). This is done as follows: The control variables in Equation (1) are used as covariates for year-by-year propensity score matching, and only those sample points within the range of public values in each matching year are retained. Finally, only those samples within the range of common values are subjected to a multi-period difference in difference test. The regression model is the same as in Equation (1), and the results in Table 6 show that the coefficients of the multi-period DID variables are significantly positive at the 1%–5% level, regardless of the matching method used [70].

5.3.3. Replacing the Explanatory Variables

Since the explanatory variable green total factor energy efficiency in this paper still belongs to the category of energy efficiency, to avoid variable selection and calculation method bias, both the traditional single factor energy efficiency, which is calculated by GDP output per unit of energy consumption, and GTFEE, calculated by the Super-SBM model with the DEA method [29], are used to measure the explanatory variable. The model regression results are as follows (Table 7). Columns (3) and (4) represent the single factor energy efficiency, while Columns (5) and (6) represent the GTFEE calculated by the Super-SBM model. The result shows that the DID term is still significantly positive regardless of whether control variables are added or not, indicating that the causal relationship between innovative city construction and energy efficiency obtained in this paper is accurate, and the baseline regression results are robust.

5.3.4. Adding Other Control Variables

When exploring the effect of innovative city piloting on GTFEE, it is not possible to exhaust all influencing factors during the model-setting process, and the problem of missing variables may arise. Therefore, in the selection of control variables, the inclusion of other control variables that may affect the innovative city pilot makes the pilot, whether or not it becomes random, independent of the random disturbance term. In this paper, we consider adding control variables that reflect the education level of the city, such as the number of colleges and universities, the number of college students in school, and the share of education expenditure in GDP, as proxy variables for regression; the regression results are shown in Table 8. From the regression results, after adding each control variable again, the DID terms are all significantly positive at the 5% significance level, which can indicate that the baseline regression results are robust.

5.3.5. Counterfactual Test

In this study, the year of implementing the innovation city pilot policy in each city is uniformly advanced by 1 to 4 years for the test, and the results are shown in Table 9. As shown, the relative coefficients of the policies are negative and insignificant after 1–3 years of advancement, indicating that there is indeed no systematic difference in the trend of total factor energy efficiency between pilot and non-pilot cities after removing the shock of the innovative city pilot policies, which also ensures the robustness of the common trend test in the previous section.

5.3.6. Exclusion of Other Related Policy Interference in the Same Period

Other related policies in the same period may also affect energy efficiency in the pilot areas, thus interfering with the identification of policy effects in the pilot innovative cities. Given this, this paper excludes policies that may also have an impact on total factor energy efficiency, such as the emissions trading system implemented in 2007, the low-carbon city policy piloted since 2010, the smart city construction implemented in 2012, the pilot carbon market trading policy implemented in 2013, etc. [33,34,35,71,72]. Specifically, the dummy variables of each policy are introduced and brought into Equation (1). The regression results obtained in the model are shown in Table 10. From the regression results, whether the above pilot policies are added to the model alone or all pilot policies are added to the model, the DID term of innovative city construction is significant at a 1% level of significance. This result is similar to that of Cao et al. (2021) [36], which to a certain extent indicates that the findings of this paper are still robust after excluding the interference of other related policies in the same period.

5.3.7. Difference-in-Difference-in-Differences (DDD) Method

The above robustness tests can exclude some policy interference to a certain extent, but it is difficult to exhaust the impact of the differences among other cities on the model estimation results because the experimental group of cities in this paper includes municipalities directly under the central government, cities listed in the plan, sub-provincial administrative cities, and provincial capitals, which have greater independence and policy specificity in political, economic and financial aspects, which may have an impact on the regression results of this paper. At the same time, to some extent, most of the policies piloted or implemented by the Chinese government are tilted toward economically developed or specific types of cities, and in view of this, this study sets some innovative pilot cities, such as sub-provincial cities, provincial capitals, and the top two cities in the province in terms of economic size as a new treatment group, and constructs a triple difference model as in Equation (3) of the triple difference model [55,73]. The regression results are shown in Table 11. As shown, after excluding other factors that are difficult to observe, the innovative city pilot policy still significantly improves GTFEE, indicating that the previous findings are highly robust.
G T F E E i t = α + β 1 t r e a t m e n t × p e r i o d × g r o u p i t + β 2 t r e a t m e n t × p e r i o d i t + β 3 p e r i o d × g r o u p i t + β 4 t r e a t m e n t × g r o u p i t + γ X i t + φ i t + μ t + ε i t

5.4. Endogenous Processing

The DID method can subtly overcome the endogeneity problem by comparing the experimental group with the control group, provided that the selection of innovative pilot cities is randomly conducted in all prefecture-level cities. In fact, the selection of innovative pilot cities may be influenced by other potential factors that can interfere with or affect the accuracy of the DID results. Therefore, this study draws on Cai et al. (2016) [74], and further adopts the instrumental variable method to overcome the influence of endogenous factors as much as possible.
It is a common practice in the existing literature to look for instrumental variables from the perspective of historical data since existing historical facts do not have an impact on the current green total factor energy efficiency [57]. In the process of innovation city piloting, the cultural characteristics of the city, represented by cultural accumulation and historical details, are important elements to be considered, and the growth of a city into an innovation city is a process of historical evolution and endogenous drivers of continuous transformation and upgrading. Therefore, we use historical-city as an instrumental variable and multiply it with policy implementation nodes (period) to form an interaction term (historycity*period) [75]. First, historical capital cities have a profound historical influence on today’s urban development [76]. Innovative city pilot policies, when selected, will inevitably choose cities with strong representation and influence for piloting. Second, whether it is a historical capital city is determined by historical conditions and is not related to the control variables in the sample period of this paper, thus satisfying the relevance and exclusivity of the instrumental variables. The dynasty information was obtained from the Chinese Historical Chronology Summary Table (Central Government Portal Yearbook of the People’s Republic of China, http://www.gov.cn/guoqing/2005-09/13/content_2582651.htm, accessed on 6 June 2022), and the final manual collation resulted in 22 ancient capital cities. The 22 cities are Beijing, Handan, Taiyuan, Datong, Yuncheng, Chifeng, Harbin, Nanjing, Yangzhou, Hangzhou, Fuzhou, Nanping, Kaifeng, Luoyang, Shangqiu, Jingzhou, Changsha, Guangzhou, Chengdu, Xi’an, Xianyang, and Yinchuan.
In addition, Confucianism, as the dominant cultural school in China since the Han Dynasty, has had a profound impact on traditional Chinese society and even today. Confucian culture advocates trust, “People cannot be established without trust” and “If people do not have trust, they do not know what they can do”, and a cultural environment of integrity helps to alleviate corporate agency conflicts and provides a basis for innovation [77]. The Confucian culture also advocates a sense of worry, emphasizing the spirit of innovation, such as “pushing out new ideas”, “reforming the old and bringing in the new”, and “if the new is new, the new is new every day”. In the process of selecting the pilot cities, the innovation base of the cities must be considered, and the relevance and exclusivity of the instrumental variables must be satisfied. In this paper, we use the number of schools, the number of academies, and the number of Confucian temples as proxy variables for Confucian culture in ancient China [56]. The original data are obtained from the Comprehensive Catalogue of Chinese Local Records, the Dictionary of Chinese Schools, the First Unified Records of the Great Ming Dynasty, the First Unified Records of the Great Qing Dynasty, and the manual collation of local records from the Ming and Qing dynasties.
Regression is performed using two-stage least squares (2SLS) for the two instrumental variables, and the results are shown in Table 12. In the first-stage regression, the coefficients of the interaction terms of the instrumental and temporal variables are significant, indicating that the instrumental variables satisfy the correlation condition; in the second-stage regression, the DID term is still significant, and the direction of the effect on the explanatory variable GTFEE is the same as the baseline regression, indicating that the pilot policy of innovative cities can still significantly improve green total factor energy efficiency after eliminating the endogeneity problem in the selection of cities in the experimental group. This indicates that the regression results of the DID model are not caused by the bias of sample selection.

6. Discussion

6.1. Channels Analysis

The results of the baseline regression and robustness tests verify that the research Hypothesis 1 that innovative city pilot policies promote urban GTFEE growth holds. Next, we still need to further explore and test the impact of innovative city pilot policies on urban GTFEE. In this paper, we argue that innovative city pilot policies promote urban GTFP growth through three channels: industrial structure transformation, green technology innovation and resource misallocation improvement. So, we use the DID variables of NICPP to conduct regression verification on the mediating variables corresponding to each channel, and the model is set as Equation (4).
M e d i a t o r i t = α 0 + α 1 d i d i t + α 2 X i t + φ i + μ t + ε i t
where M e d i a t o r i t is the channel variable and the rest of the variables have the same meaning as in Equation (1). If the DID term variable α 1 is significant and the channel variable is theoretically and intuitively correlated with the explanatory variables, it indicates that the influence channel exists [78,79].

6.1.1. Industrial Structure Transformation

This section uses the ratio of the value added of the tertiary sector to the secondary sector as a proxy variable for industrial structural transformation for testing. The regression results are shown in Table 13, Column (1). The results show that the implementation of the NICPP significantly increases the ratio of the value added of the tertiary industry to the value added of the secondary industry, i.e., the innovative pilot policy significantly promotes the transformation of the industrial structure from the secondary industry to the tertiary industry. At the same time, a large number of studies have shown that the transformation and optimization of industrial structure will significantly improve GTFEE, promote the optimization of the energy structure, and enhance output cleanliness [36]. Therefore, the industrial structure transformation channel is established.

6.1.2. Green Technology Innovation

This section uses the total number of green invention patents granted to Chinese A-share listed companies in urban jurisdictions from 2005 to 2019 as the moderating variable for industrial structure transformation, and the listed companies’ patent data are obtained from the State Intellectual Property Office of China. The regression results are shown in Table 13, Column (2). The DID regression coefficient is significantly positive, indicating that the pilot policy of innovative cities significantly boosts the total number of green invention patents. Meanwhile, the transition to green technologies is considered one of the key solutions to address climate change and energy intensity [43], making green technology a key determinant of energy efficiency. A large body of literature empirically demonstrates that green technology enhancements can improve energy efficiency [80]. Therefore, the green technology innovation channel is validated.

6.1.3. Resource Allocation Improvement

The degree of resource mismatch can reflect the efficiency of urban resource allocation. The existing literature generally uses the degree of dispersion of firm efficiency to measure the degree of resource mismatch [22,81], which is calculated by Equation (5).
M A = σ T F P
where MA represents the degree of resource mismatch, and σ T F P represents the deviation of total factor productivity of enterprises, where a larger value represents a higher degree of resource mismatch. In existing studies, the database of Chinese industrial enterprises and Chinese A-share listed companies are commonly used as the sample of micro-enterprises. In this paper, the standard deviation of total factor productivity of enterprises is measured as a proxy variable for the degree of resource mismatch at the city level by using the data of Chinese A-share listed companies matched with their cities. The study sample interval of this paper is 2004–2019, while the database of Chinese industrial enterprises is only updated to 2014, and limited to data availability. The total factor productivity deviation of Chinese A-share listed companies is chosen to measure the degree of resource mismatch at the city level. The regression results are shown in Table 13, Column (3), which shows that the DID term is significantly negative, i.e., innovative city construction significantly suppresses resource mismatch. Meanwhile, a large number of studies prove that resource mismatch reduces economic growth and welfare, thus exacerbating environmental pollution and reducing GTFEE [46,82,83]. Therefore, Hypothesis 2 is proven: innovative city pilot policies will enhance GTFEE by reducing the degree of resource mismatch in cities.

6.2. Heterogeneity Analysis

The Working Guidelines for Building Innovative Cities state that each city should highlight the basic advantages and characteristics of the city according to its basic conditions, such as resource endowment, industrial characteristics, location advantages, and development level. Therefore, this section explores whether the pilot policies of innovative cities have heterogeneous inter-city effects on GTFEE in terms of the scientific and educational resources, city industrial base, and industrial agglomeration level. Drawing on the method of Beck et al. (2010) [52], this paper conducts the heterogeneity test by introducing moderating variables, and the formula is expressed as follows:
l n G T F E E i t = α + β 1 d i d i t + β 2 d i d i t M o d e r a t o r i t + β 3 M o d e r a t o r i t + γ X i t + φ i + μ t + ε i t
where M o d e r a t o r i t is the moderating variable that distinguishes the heterogeneous characteristics of cities, and the rest of the variables are the same as in Equation (1). The rest of the variables have the same meaning. In the heterogeneity analysis, the focus is on the coefficient of the interaction term, i.e., the coefficient of the d i d i t × M o d e r a t o r i t term, and the three heterogeneity cases are analyzed separately.

6.2.1. Heterogeneity of Science and Education Resources

Innovative cities inevitably have heterogeneous policy effects on GTFEE in cities with different science education capabilities. Higher education institutions play a key role in urban innovation and are an important link between scientific research and enterprise production in cities. Based on this, this paper selects the number of city-owned colleges and universities as a proxy variable for urban science education resources, multiplies the dummy variable of science education resources quality with the pilot policy dummy variable, and substitutes it into the equation for regression. The regression results are shown in Table 14, Column (1). The regression results show that the pilot innovative cities can promote the GTFEE of science and education resource-rich cities to a greater extent than those cities with a smaller number of universities. Columns (2)–(4) show robustness tests using the number of cities with “double first-class” universities, the number of university students, and the number of scientific and technical service personnel, respectively. (The Chinese government approved the implementation of the Double First Class University Plan (“Double First Class”) for the construction of world-class universities and first-class disciplines in January 2017, and released the lists of the first and second rounds of construction universities in September 2017 and February 2022, respectively. Whether it is selected as “Double First Class” has become an important criterion to measure the quality of science and education development of universities, and also an important criterion to represent the strength of science and education of cities.).

6.2.2. Industrial Foundation Heterogeneity

China laid out and built many industrial bases during the “First Five-Year Plan”, “Second Five-Year Plan”, and “Third Line” construction periods, and these cities have more developed industrial bases, which have different industrial bases from other cities for the upgrading and development of GTFEE. Therefore, the dummy variable of whether the city is an old industrial base is introduced, i.e., the old industrial base is recorded as 1 and the non-old industrial base is recorded as 0. The results are shown in Table 14, Column (5). For non-old industrial bases that are mostly emerging cities, they are more influenced by policies. The possible reason is that most of the non-old industrial bases are more market-oriented cities with more developed economies, which have more demands on environmental quality and are more motivated to participate in the pilot policy of innovative cities, which eventually results in higher green total factor energy efficiency improvement effects.

6.2.3. Industrial Agglomeration Heterogeneity

The methods to measure industrial agglomeration include the Hoover index, industry division of labor index, Ellison–Glaser index, etc. [84]. We choose the Herfindahl index (HHI) as a measure of industrial agglomeration [84,85], and its expression is as in Equation (7).
H H I i t = i = 1 n ( X k i t X k t ) 2
where X k t represents the total industrial output of industry k in year t, X k i t represents the total industrial output of industry k in city i in year t, and the ratio of the two represents the market share of industry k in city i in year t. If the total output of all industries is equally distributed across all cities, then H H I i t is equal across all cities and tends to zero. To accurately characterize the degree of industrial agglomeration in each city, the data on Chinese industrial enterprises from 2005 to 2007 are processed and summed at the city level in this paper. The sample scope of this database is all state-owned industrial enterprises and non-state-owned industrial enterprises above 5 million in size. As the subject of microeconomic activities, the use of enterprise-level data can better reflect the degree of industrial agglomeration in the region. Since the pilot innovative cities in this sample were first established in 2008, the HHI index for 2007 is chosen as a proxy for the initial industrial agglomeration level; the 50% quantile level of the HHI index is used to distinguish between high and low industrial agglomeration; and the values of 1 and 0 are assigned to Equation (6). The regression results are shown in Table 15, Column (1). The regression results indicate that the coefficient of the interaction term is significantly positive at the 5% significance level, indicating that cities with high initial industrial agglomeration significantly increase the promotion effect of NICPP on GTFEE, i.e., industrial agglomeration moderates the promotion effect of innovative city pilot policy on GTFEE. Meanwhile, in order to increase the robustness of the conclusion, this paper considers using the HHI index in 2006, the HHI index in 2005, and the average HHI index from 2005–2007 for further testing. The regression results are shown in Table 15; Columns (2)–(4) show that the heterogeneous effect of initial industrial agglomeration on the pilot policy of innovative cities on GTFEE enhancement holds. Hypothesis 3 holds.

7. Conclusions and Policy Implications

7.1. Key Findings

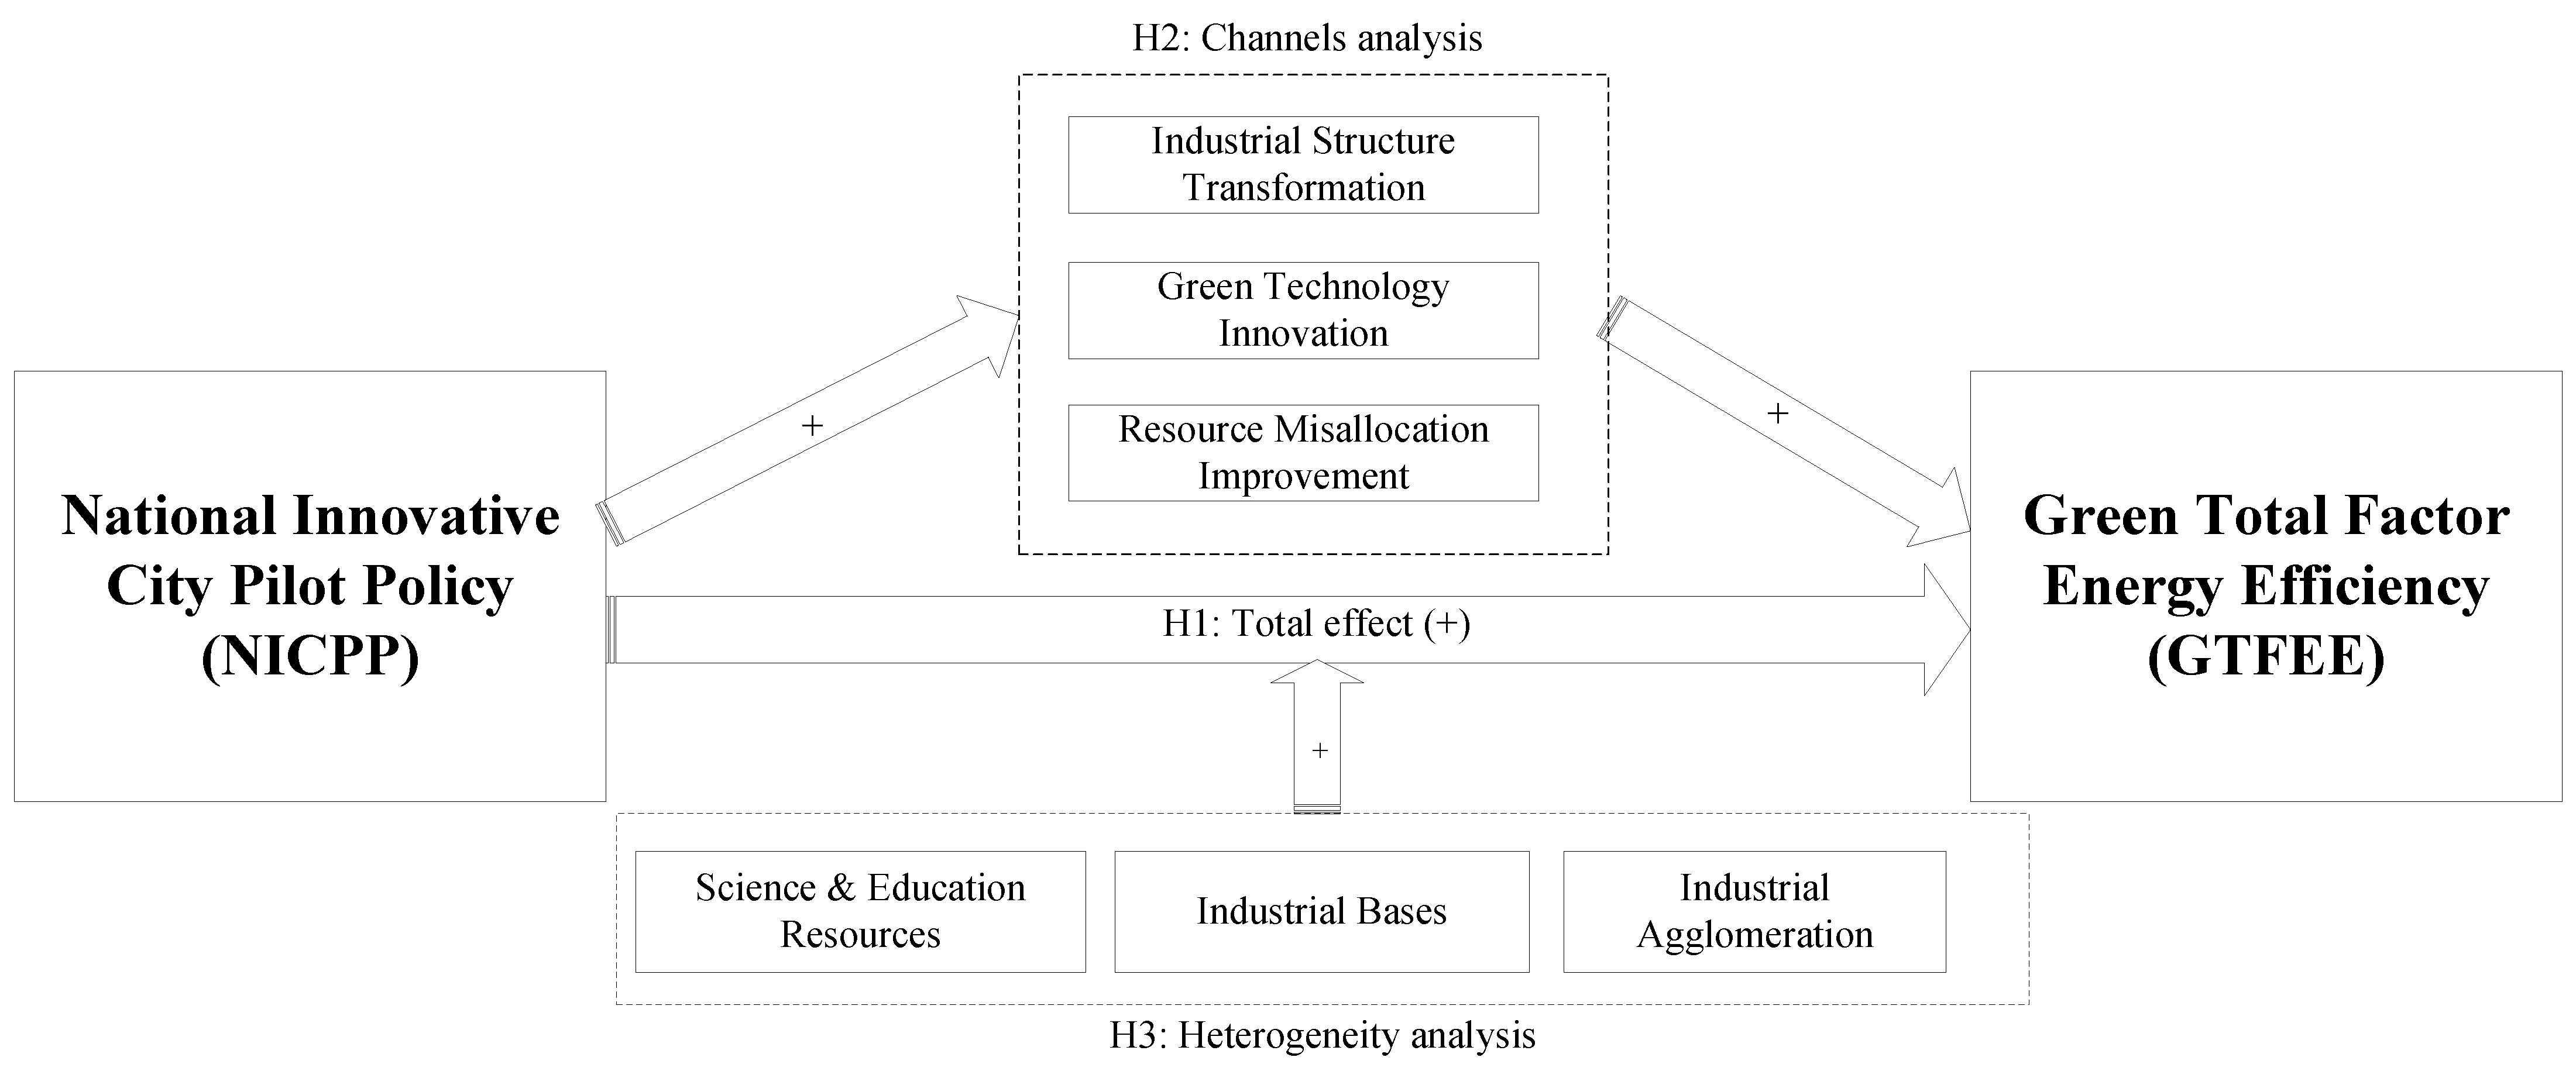
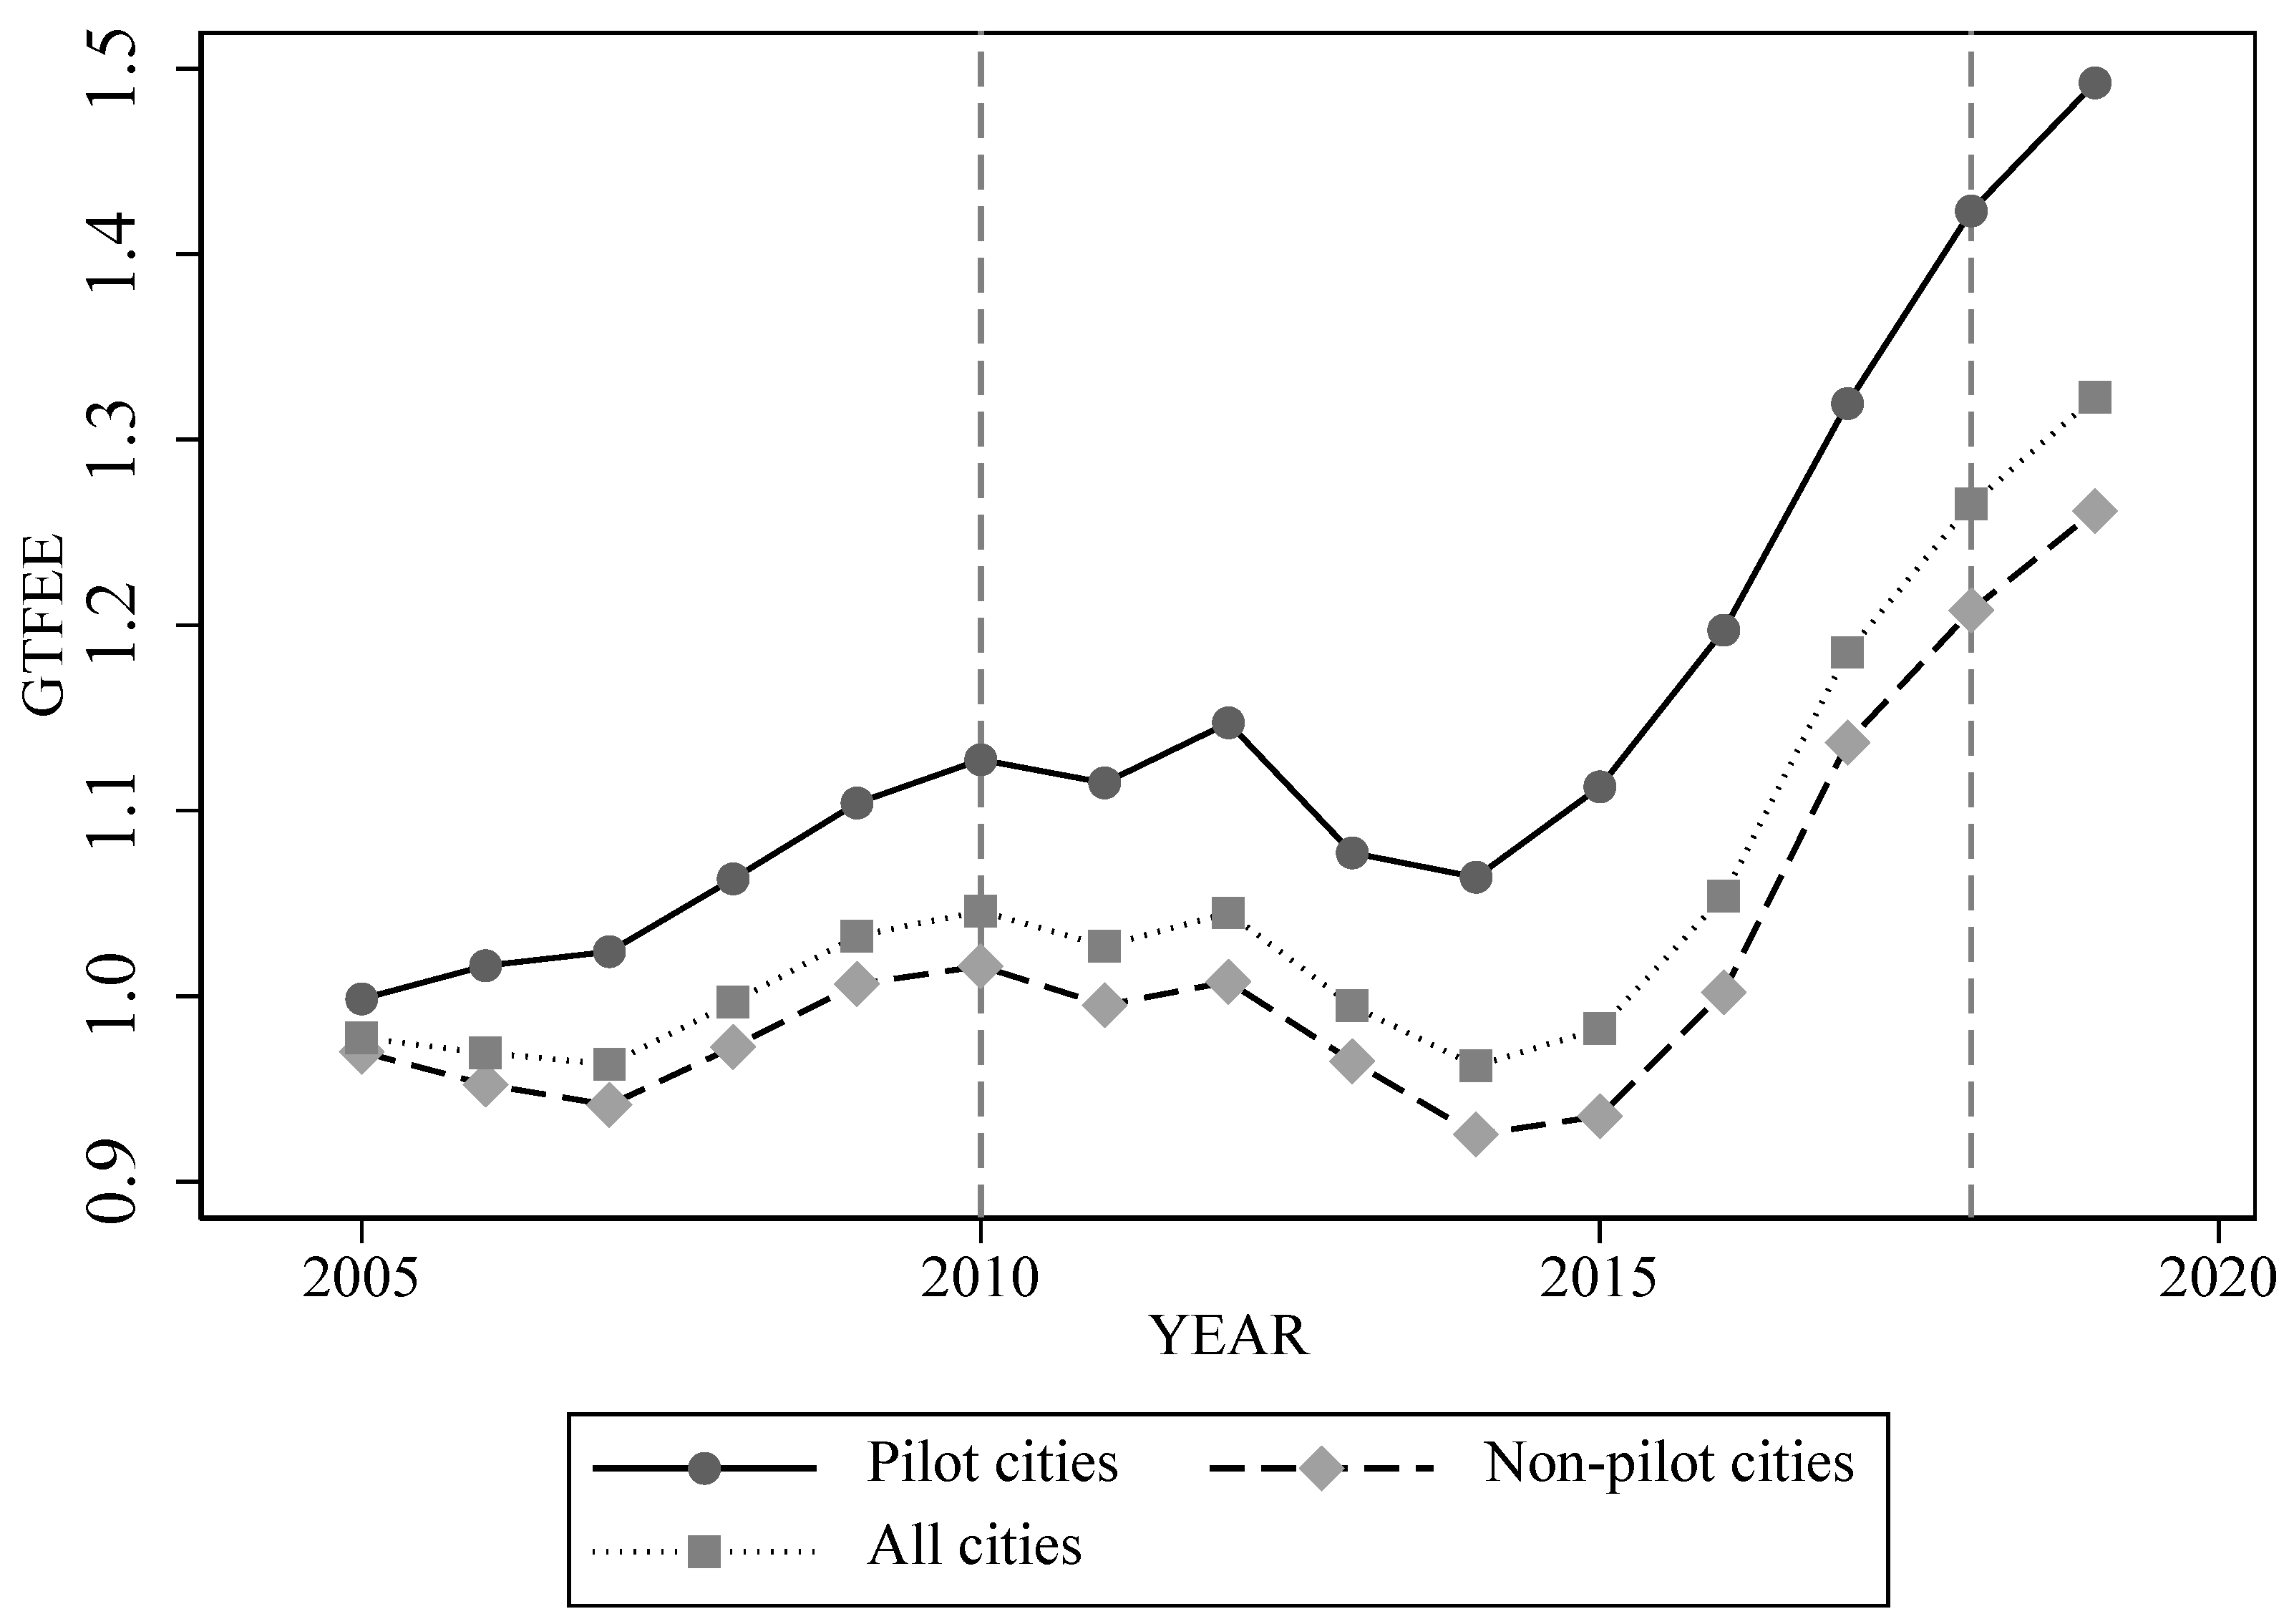
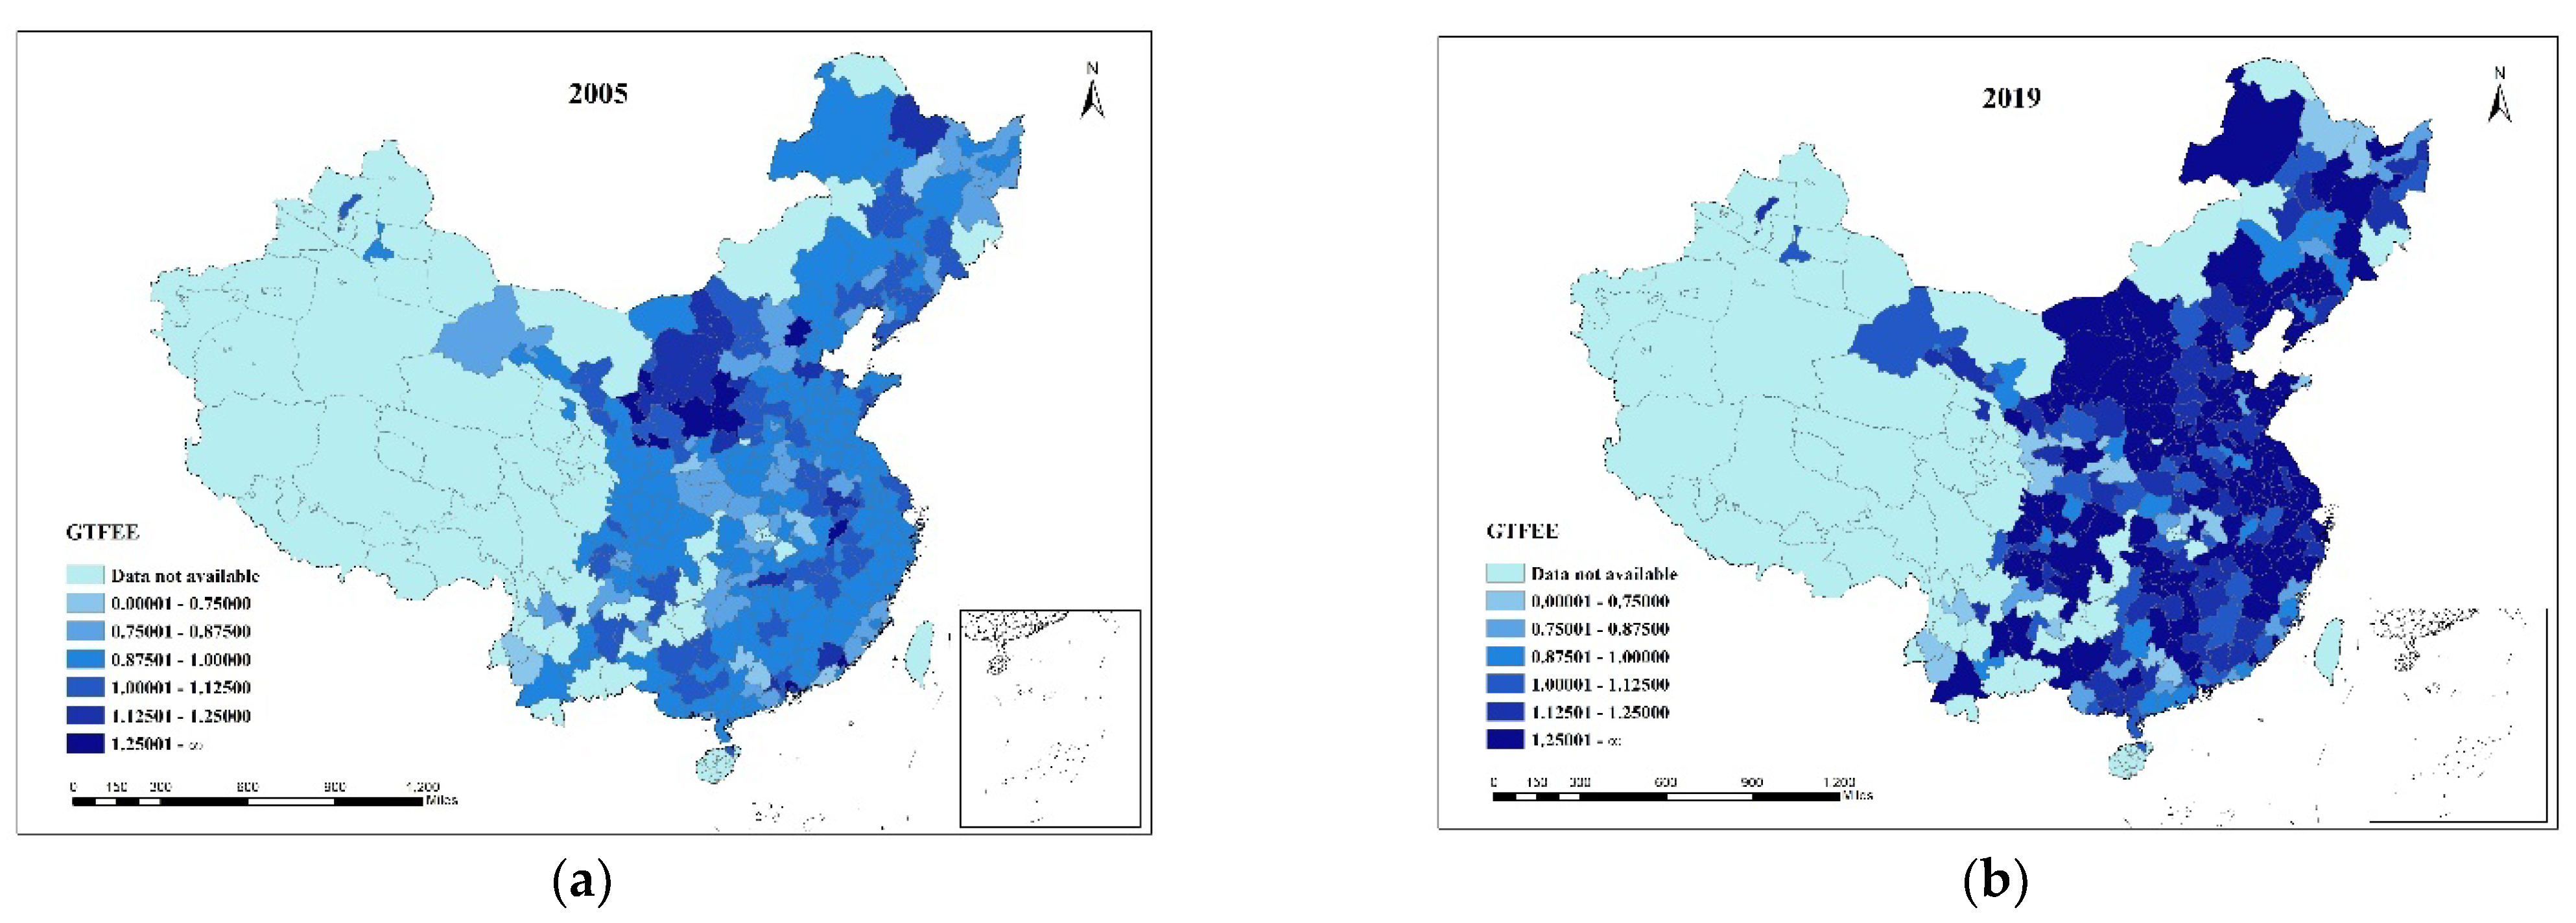
This paper constructs city-level green total factor energy efficiency (GTFEE) indicators using the Super-EBM-DEA method combined with the global Malmquist–Luenburger index using panel data for 282 cities in China from 2004 to 2019, and regards the “national innovative city pilot policy (NICPP)” as a quasi-natural experiment. The impact of this policy on GTFEE and its channels of action are assessed using a multi-period DID method. The findings of this paper mainly include the following aspects.
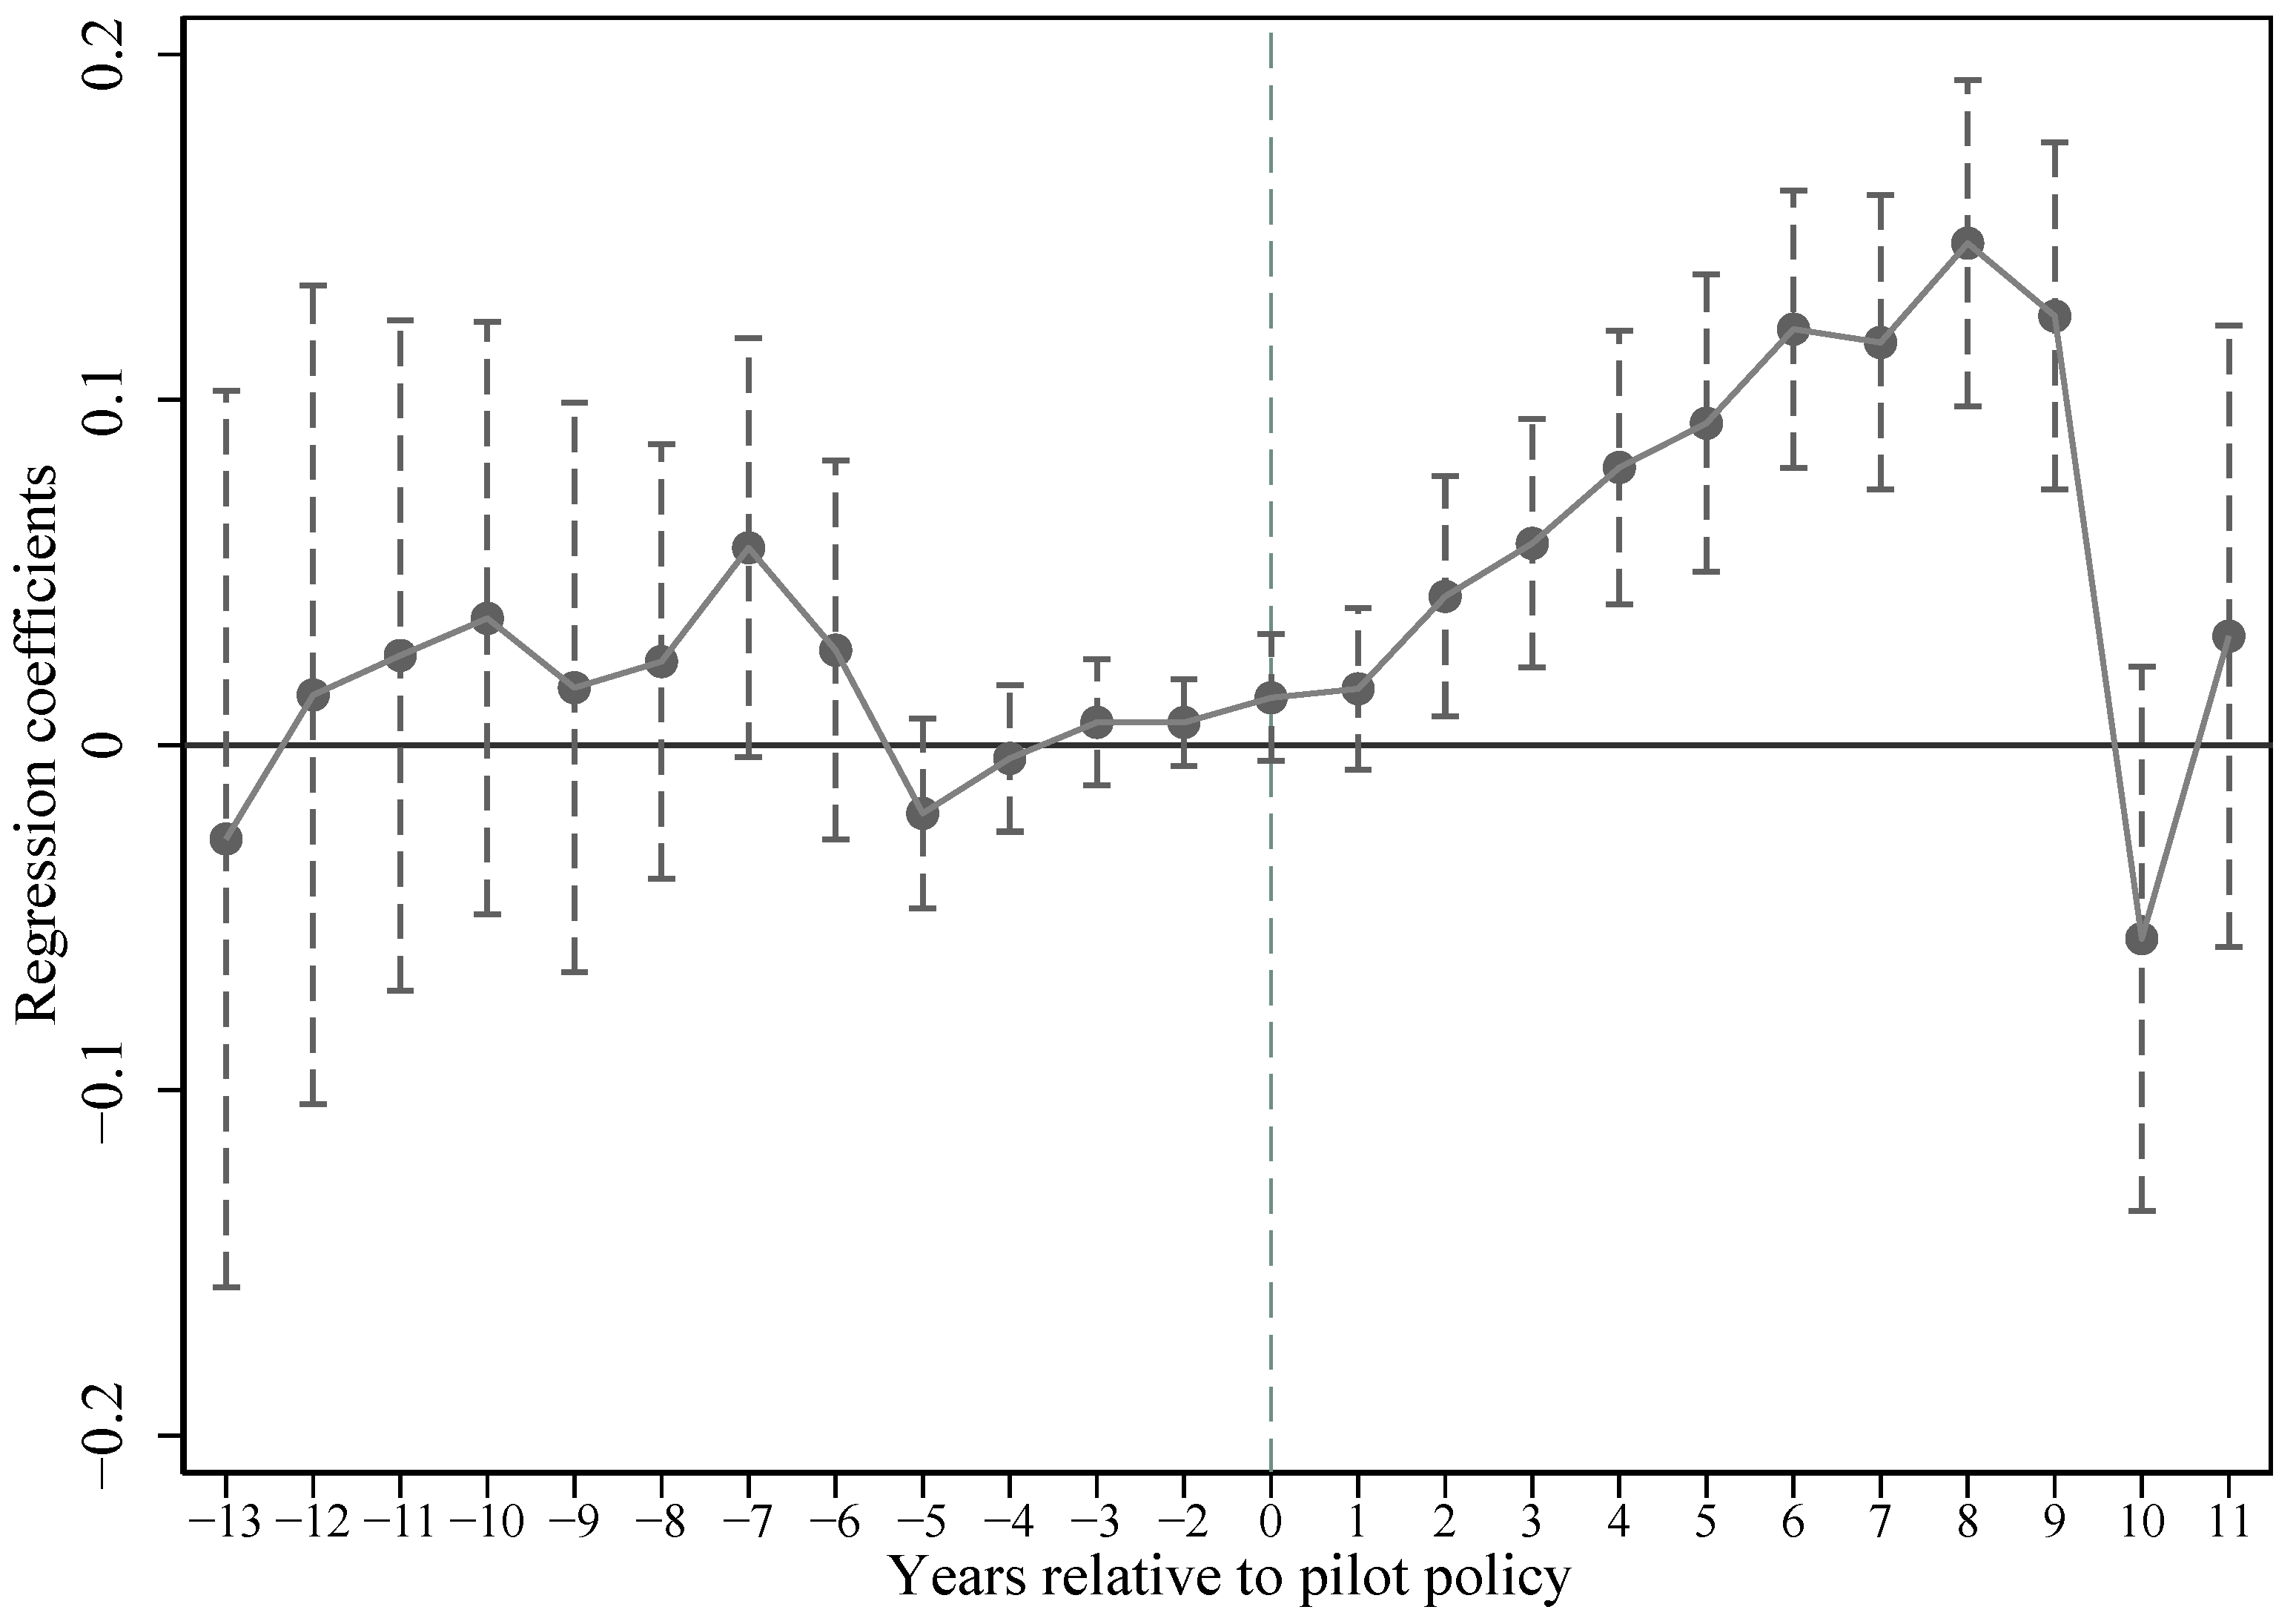
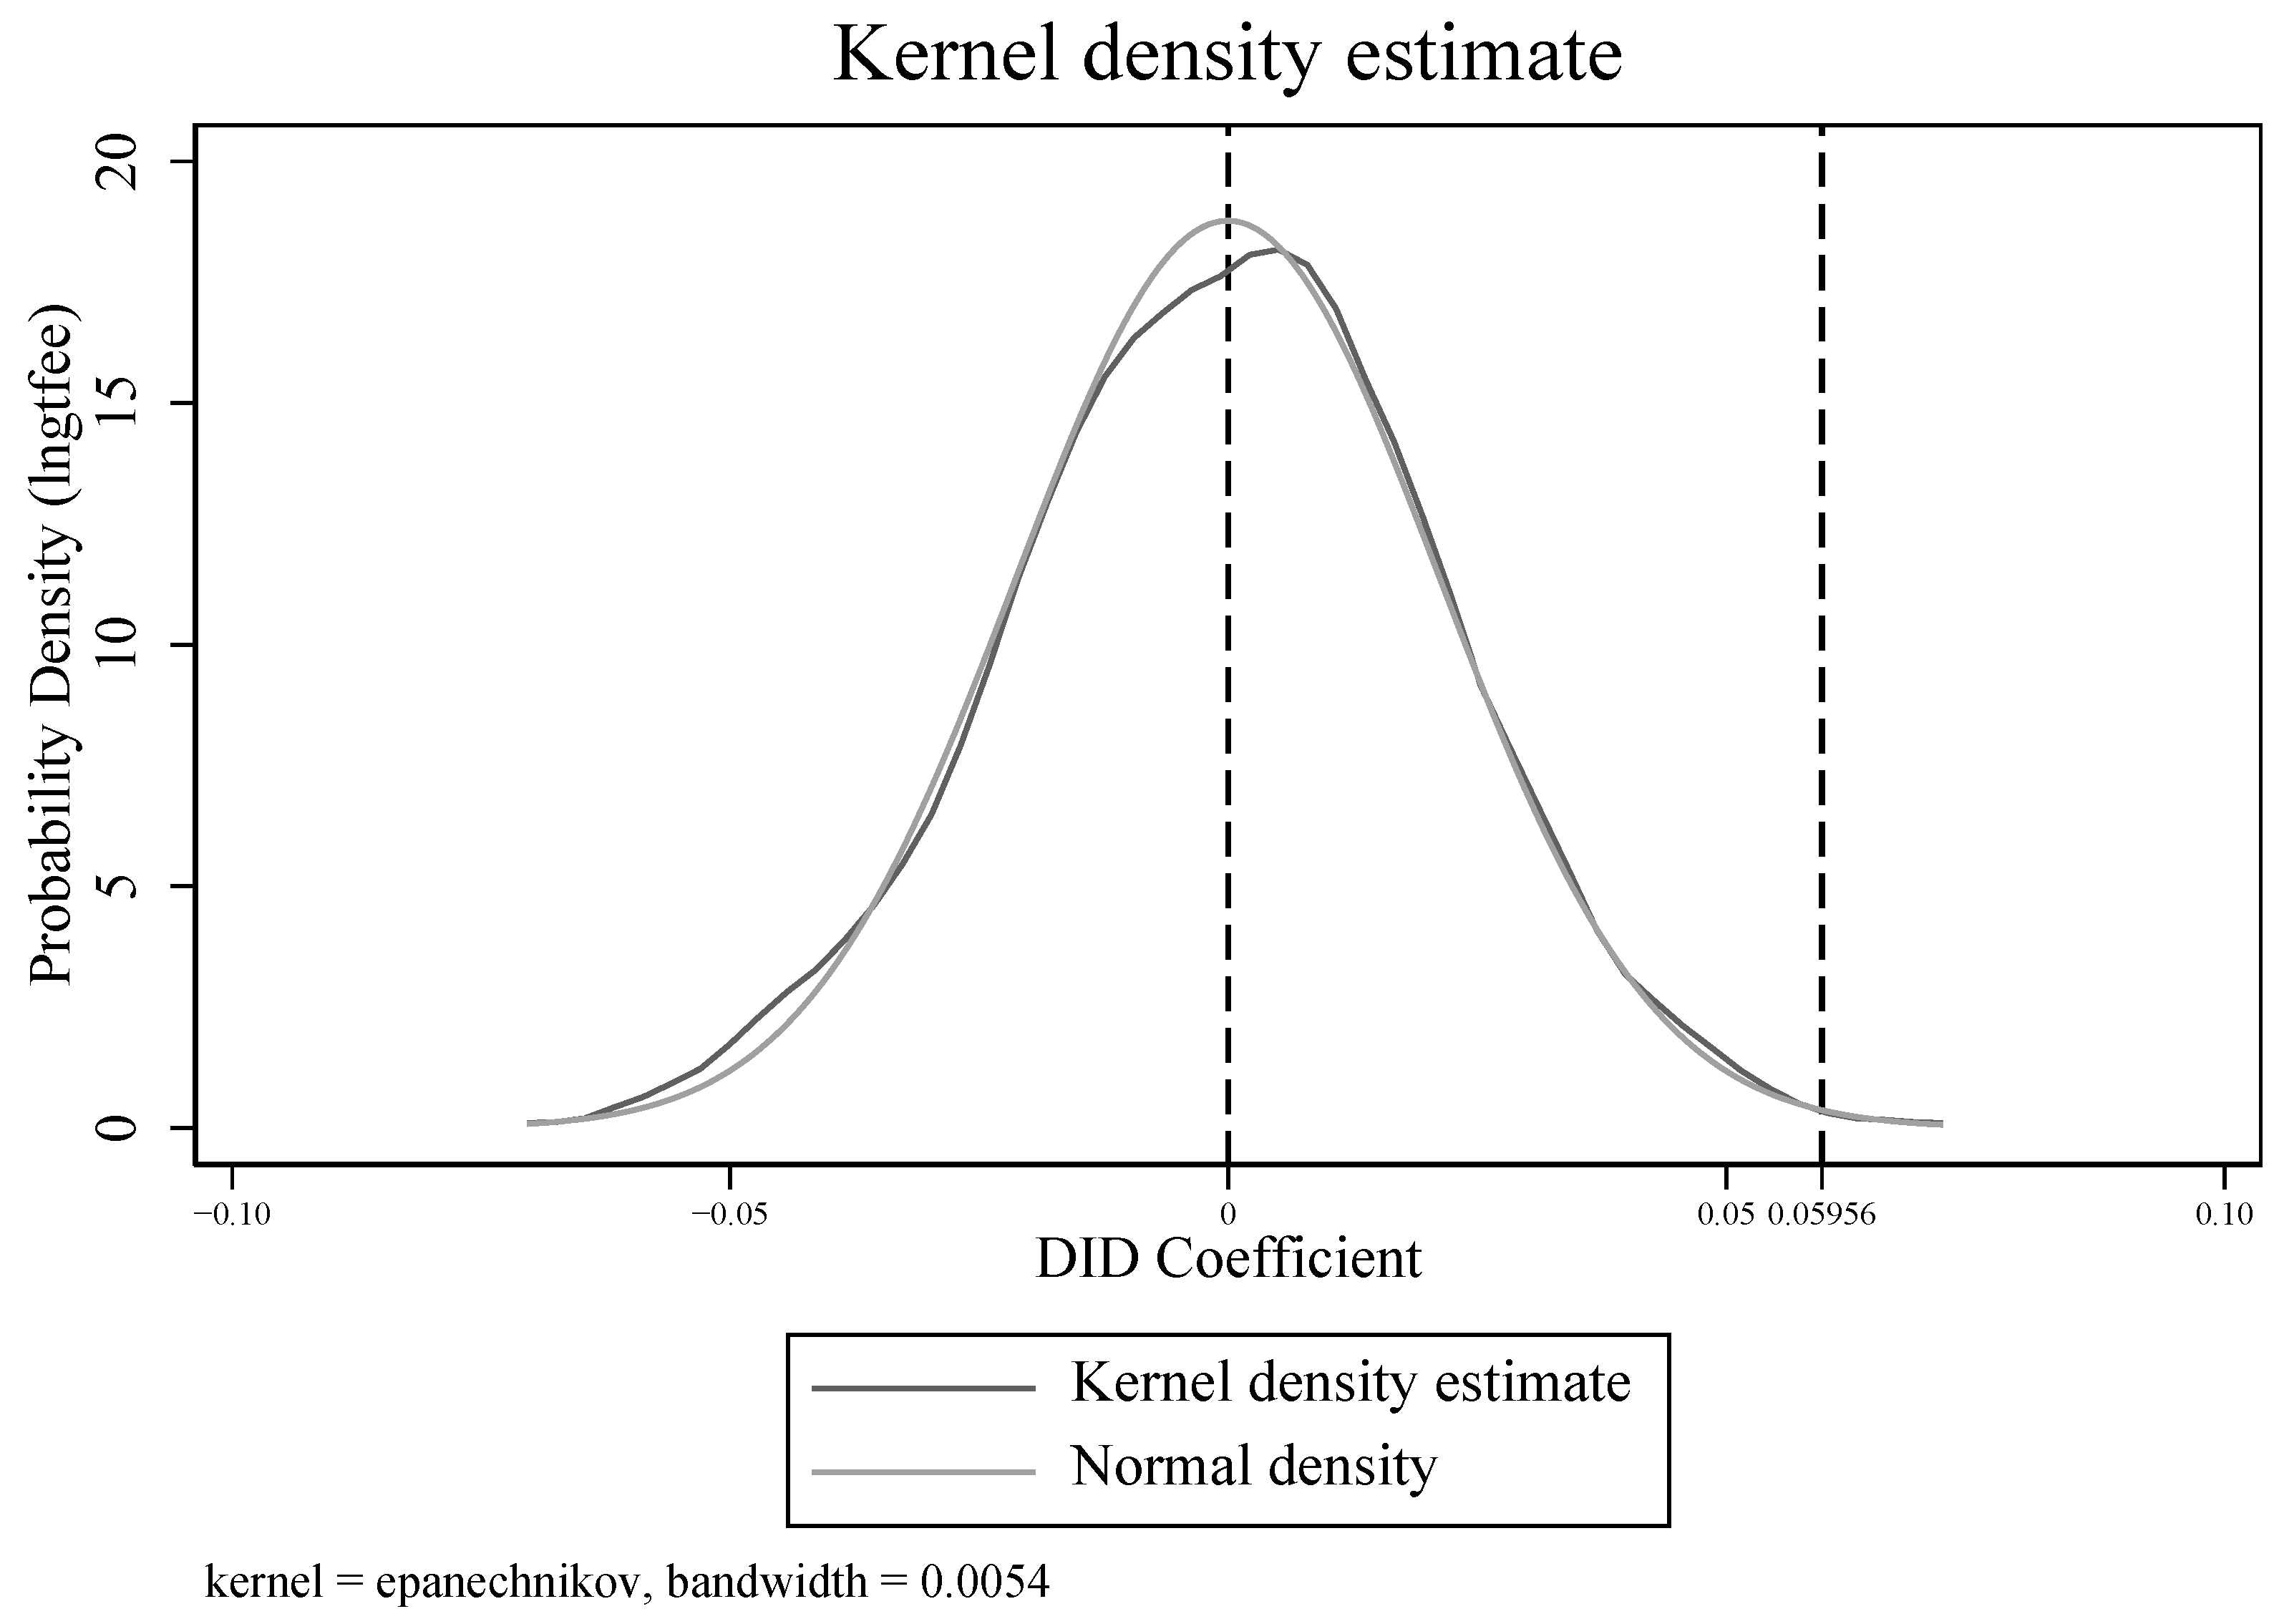
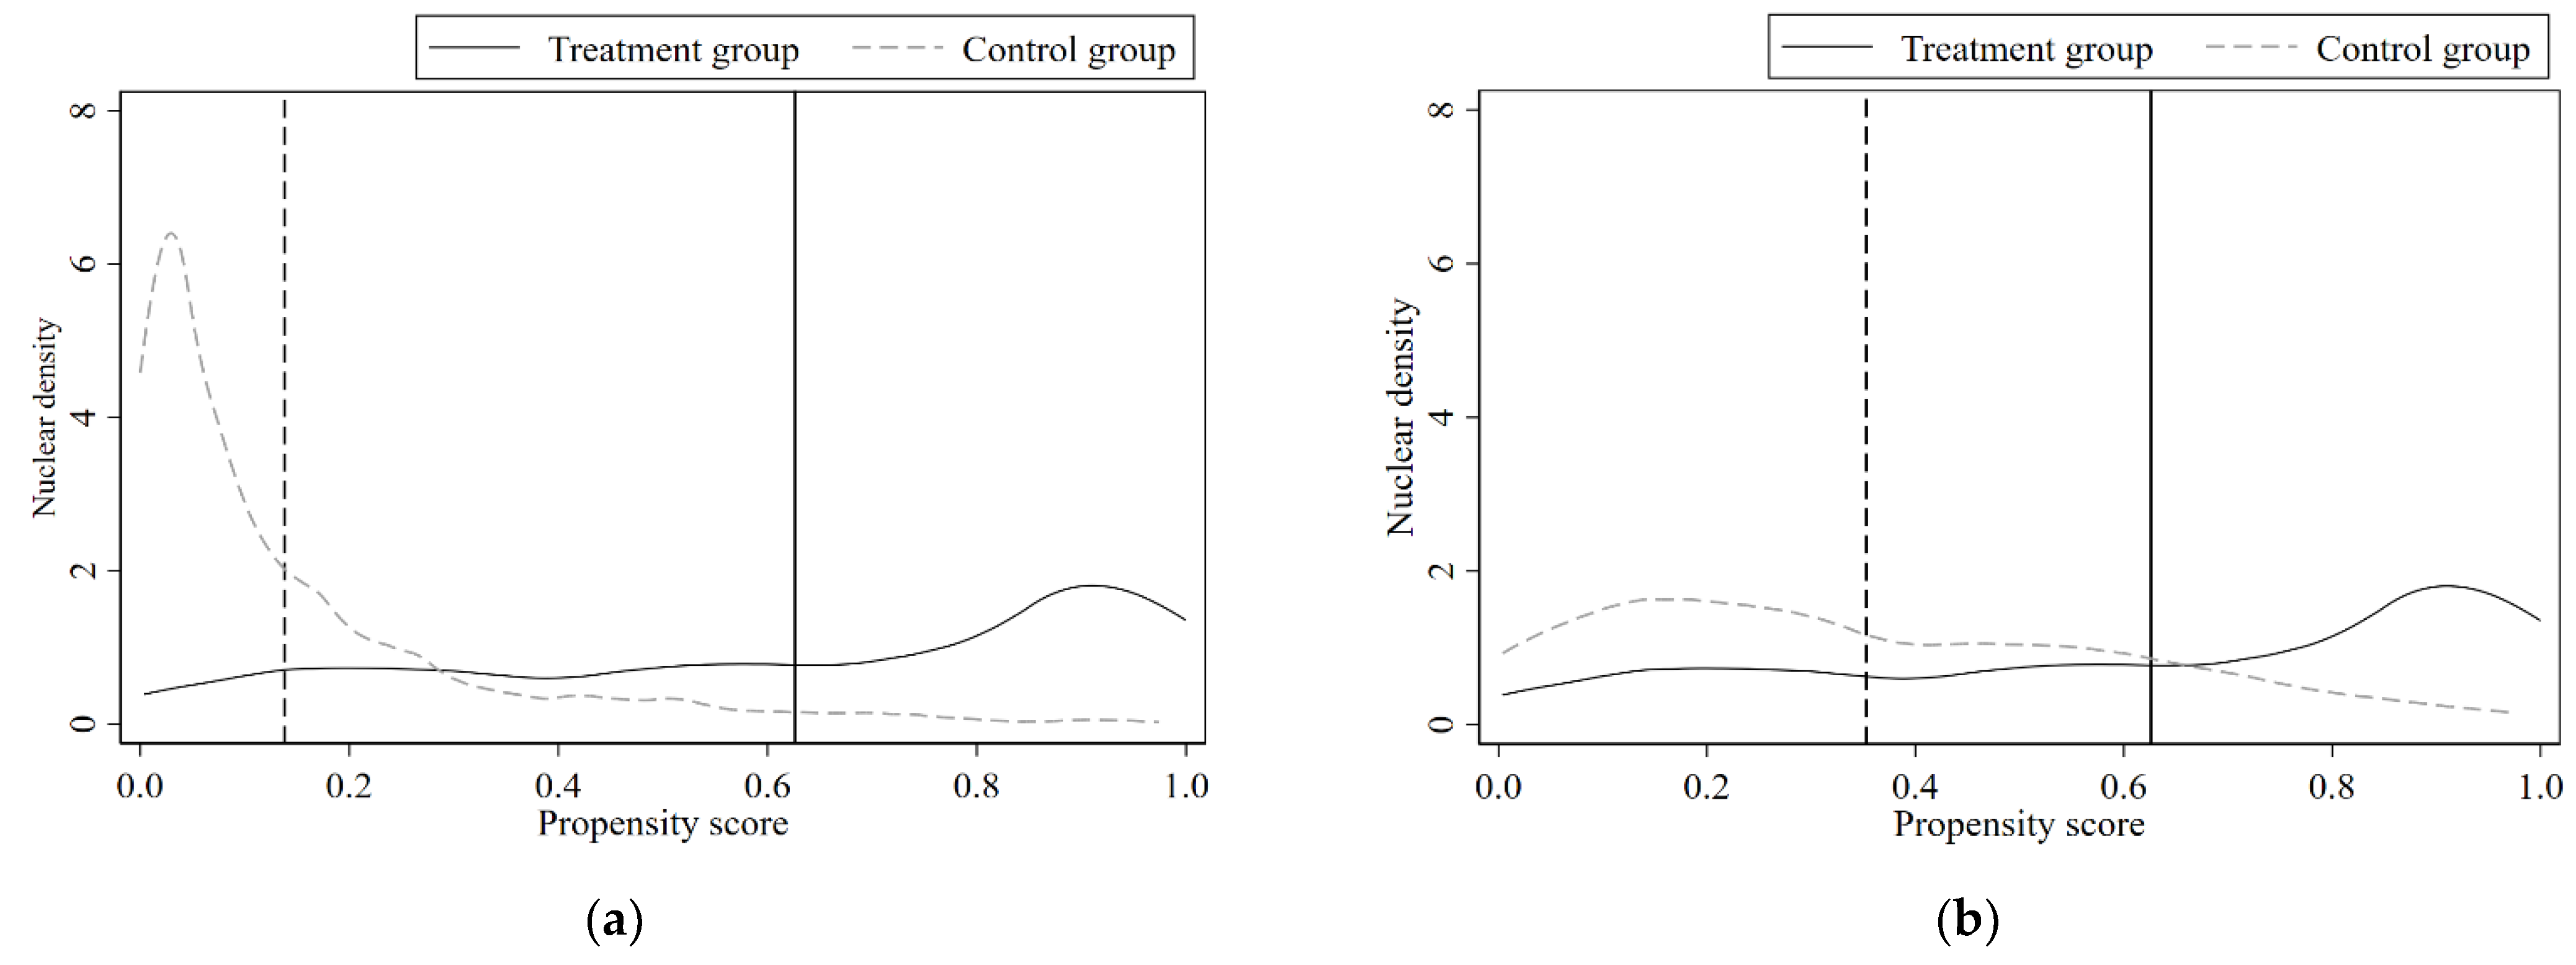
First, the results of the benchmark regressions suggest that cities’ GTFEE increases by about 5.96% on average after becoming pilot cities, and the NICPP policy has promoted the improvement of urban GTFEE. A series of robustness tests and instrumental variable method also support the above conclusion. Second, the impact channel test shows that the NICPP improves the GTFEE through three channels: industrial structure transformation, green technology innovation and market relationship improvement. Third, the heterogeneity analysis shows that the positive effect of NICPP on GTFEE is heterogeneous in three aspects: scientific and educational resources, industrial base, and initial industrial agglomeration degree of each city. Among them, the NICPP can promote cities’ GTFEE with relatively rich scientific and educational resources and non-old industrial bases to a greater extent, and the cities with high initial industrial agglomeration have a more significant effect on the GTFEE of the pilot innovative cities. In conclusion, this study adds to the existing empirical studies on the causal relationship between innovation and energy efficiency, and it proposes several unique ideas for channel and heterogeneity testing.

7.2. Policy Implications

First, insist on implementing and improving innovative city construction, and different types of cities need to differentiate their governance. Technological innovation is one of the main ways to improve GTFEE and realize green energy utilization. Cities need to further stimulate green and low-carbon oriented innovation practices and promote the coordinated implementation of pilot policies of innovative cities with an emission trading pilot policy, low-carbon city pilot policy and smart city pilot policy to realize green optimization and transformation of energy structure. In addition, cities with different scientific and educational resources, industrial bases and industrial agglomeration levels need to propose differentiated innovation policies according to their own developmental stages and make full use of institutional dividends to achieve the optimal solution for energy efficiency improvement and economic growth. Cities should provide clean and more efficient energy in all countries by implementing innovative urban policies, expanding infrastructure and upgrading technology, which will encourage growth and help protect the environment to achieve the Sustainable Development Goals (SDGs) by 2030.
Second, increase support for enterprise technology research and development, especially green technology innovation, and encourage enterprises to improve energy utilization efficiency and reduce pollution emissions through technological innovation. Through the pilot policy of innovative cities, we will promote the optimal allocation and resource sharing of research forces from industry–academia–research, and stimulate the innovation energy of enterprises and talents. At the same time, each industry can take advantage of various innovation policies to promote multi-energy coordination and comprehensive echelon utilization in the energy consumption field through electric energy substitution and electrification transformation to achieve energy saving, emission reduction and energy efficiency improvement. The government should build a market-oriented green technology innovation system, continue to carry out green technology innovation and research actions, and carry out green energy efficiency improvement actions in key industries and key products. This is also in accordance with the SDG development goals, which ensure sustainable consumption and production patterns (Goal 12), support cities to strengthen scientific and technological capacity and adopt more sustainable production and consumption patterns.
Third, governments should continue to support the market’s dominant role in resource allocation and the marketization process. In order to increase GTFEE, marketization to a high degree can be used as a creative city pilot strategy. Therefore, we must work to reform the market as well as the government, deepen the reform of the energy sector, use the market as a mechanism for incentive and constraint, and further the reform of linked sectors. Both state and local governments should rationalize inefficient fossil fuel subsidies that encourage wasteful use and minimize market distortions, such as restructuring taxes and phasing out damaging subsidies to reflect their environmental effect, which corresponds with Goal 12 of ensuring sustainable consumption and production patterns in SDGs. Moreover, governments need to improve the market environment, hasten the development of a stable, open, competitive, and orderly electricity, coal, oil, and natural gas market, and work to establish a pattern of organic unity, complementarity, and cooperation between the market and the government. Reduce barriers to entry into the energy market, maximize the distribution of energy resources based on the market, and create a national, unified energy market that focuses on the aim of SDGs by 2030.
The greening of energy efficiency is a crucial step in resolving climate issues and promoting economic growth. As the world’s largest carbon emission and energy consumption country, China plays an important role in global energy and environmental governance and also faces the dual challenges of high total demand and high proportion of fossil energy. China should take a major responsibility to reduce emissions and increase efficiency under severe resource and carbon emission constraints. The Chinese government has recently improved urban GTFEE through its unique program of innovative cities, setting an example for the majority of developing nations to follow. To attain the ultimate aim of energy-saving, emission-reduction, and high-quality economic development, central and local governments, as the primary leaders and decision makers, should concentrate on the long term and encourage businesses to increase their energy efficiency through well-planned incentive systems.

8. Future Research Proposals

Although this paper investigates how innovation-driven policies affect the green total factor energy efficiency and explores the channels and heterogeneity of their effects at city level, it also has several limitations. First, it would be interesting to examine whether NICPP implementation improves GTFEE at the individual, household, industry or firm level. Second, whether NICPP would generate technology spillovers and whether it would have a positive impact on energy efficiency are also topics worthy of future research. Third, because of the availability of data, we could only explore the average treatment effect of NICPP, though not all measures will promote energy efficiency. Therefore, in future research, we will more specifically refine the policy measures for NICPP, explore which measures have the greatest promotional effect, and figure out the importance of each transmission channel in relation to the typology and specificities of the cities.

Author Contributions

Conceptualization, S.Y. and D.D.; methodology, D.D. and C.S.; software, D.D.; validation, S.Y., D.D. and C.S.; formal analysis, S.Y., D.D. and C.S.; investigation, S.Y.; resources, S.Y., D.D. and C.S.; data curation, D.D.; writing—original draft preparation, D.D.; writing—review and editing, S.Y., D.D. and C.S.; visualization, D.D.; supervision, S.Y. and C.S.; project administration, S.Y., D.D. and C.S.; funding acquisition, S.Y., D.D. and C.S. All authors have read and agreed to the published version of the manuscript.

Funding

This research was funded by Ningxia University (No. CXXM202204) and the Major Program of National Fund of Philosophy and Social Science of China (No. 18ZDA039).

Institutional Review Board Statement

Not applicable.

Informed Consent Statement

Not applicable.

Data Availability Statement

The data presented in this study are all from the statistical data officially released by China and are explained in Section 4.5.

Conflicts of Interest

The authors declare no conflict of interest.

References

  1. Chong, C.T.; Fan, Y.V.; Lee, C.T.; Klemeš, J.J. Post COVID-19 ENERGY sustainability and carbon emissions neutrality. Energy 2022, 241, 122801. [Google Scholar] [CrossRef]
  2. Sachs, J.D.; Schmidt-Traub, G.; Mazzucato, M.; Messner, D.; Nakicenovic, N.; Rockström, J. Six Transformations to achieve the Sustainable Development Goals. Nat. Sustain. 2019, 2, 805–814. [Google Scholar] [CrossRef]
  3. Camagni, R.; Capello, R.; Nijkamp, P. Towards sustainable city policy: An economy-environment technology nexus. Ecol. Econ. 1998, 24, 103–118. [Google Scholar] [CrossRef]
  4. Sanchez Rodriguez, R.; Ürge-Vorsatz, D.; Barau, A.S. Sustainable Development Goals and climate change adaptation in cities. Nat. Clim. Change 2018, 8, 181–183. [Google Scholar] [CrossRef]
  5. Sun, H.; Edziah, B.K.; Kporsu, A.K.; Sarkodie, S.A.; Taghizadeh-Hesary, F. Energy efficiency: The role of technological innovation and knowledge spillover. Technol. Forecast. Soc. Change 2021, 167, 120659. [Google Scholar] [CrossRef]
  6. Yu, Y.; Chen, X.; Zhang, N. Innovation and energy productivity: An empirical study of the innovative city pilot policy in China✰. Technol. Forecast. Soc. Change 2022, 176, 121430. [Google Scholar] [CrossRef]
  7. Zhou, Y.; Li, S. Can the innovative-city-pilot policy promote urban innovation? An empirical analysis from China. J. Urban Aff. 2021, 1–19. [Google Scholar] [CrossRef]
  8. Sun, H.; Edziah, B.K.; Sun, C.; Kporsu, A.K. Institutional quality, green innovation and energy efficiency. Energy Policy 2019, 135, 111002. [Google Scholar]
  9. Yang, J.; Xiong, G.; Shi, D. Innovation and sustainable: Can innovative city improve energy efficiency? Sustain. Cities Soc. 2022, 80, 103761. [Google Scholar]
  10. Yan, H.; Sun, J.; Jiang, Z. Innovative Cities, Ownership Differences and Business Innovation: A Perspective Based on Performance Appraisal. J. World Econ. 2021, 11, 75–101. (In Chinese) [Google Scholar]
  11. Zhou, L.-a. Governing China’s local officials: An analysis of promotion tournament model. Econ. Res. J. 2007, 7, 36–50. (In Chinese) [Google Scholar]
  12. Yin, Z.; Nie, H. Corruption, Officials Governance and Economic Development. China Econ. Q. 2020, 02, 411–432. (In Chinese) [Google Scholar]
  13. Gillingham, K.; Newell, R.G.; Palmer, K. Energy Efficiency Economics and Policy. Annu. Rev. Resour. Econ. 2009, 1, 597–620. [Google Scholar] [CrossRef]
  14. Patterson, M.G. What is energy efficiency?: Concepts, indicators and methodological issues. Energy Policy 1996, 24, 377–390. [Google Scholar] [CrossRef]
  15. Hu, J.-L.; Wang, S.-C. Total-factor energy efficiency of regions in China. Energy Policy 2006, 34, 3206–3217. [Google Scholar] [CrossRef]
  16. Li, L.-B.; Hu, J.-L. Ecological total-factor energy efficiency of regions in China. Energy Policy 2012, 46, 216–224. [Google Scholar] [CrossRef]
  17. Färe, R.; Grosskopf, S.; Lindgren, B.; Roos, P. Productivity changes in Swedish pharamacies 1980–1989: A non-parametric Malmquist approach. J. Product. Anal. 1992, 3, 85–101. [Google Scholar] [CrossRef]
  18. Lin, B.; Tan, R. Ecological total-factor energy efficiency of China’s energy intensive industries. Ecol. Indic. 2016, 70, 480–497. [Google Scholar] [CrossRef]
  19. Yörük, B.K.; Zaim, O. Productivity growth in OECD countries: A comparison with Malmquist indices. J. Comp. Econ. 2005, 33, 401–420. [Google Scholar] [CrossRef] [Green Version]
  20. Chen, Y.; Lin, B. Understanding the green total factor energy efficiency gap between regional manufacturing—Insight from infrastructure development. Energy 2021, 237, 121553. [Google Scholar] [CrossRef]
  21. Gao, D.; Li, G.; Yu, J. Does digitization improve green total factor energy efficiency? Evidence from Chinese 213 cities. Energy 2022, 247, 123395. [Google Scholar] [CrossRef]
  22. Hong, Q.; Cui, L.; Hong, P. The impact of carbon emissions trading on energy efficiency: Evidence from quasi-experiment in China’s carbon emissions trading pilot. Energy Econ. 2022, 110, 106025. [Google Scholar] [CrossRef]
  23. Guo, W.; Liu, X. Market fragmentation of energy resource prices and green total factor energy efficiency in China. Resour. Policy 2022, 76, 102580. [Google Scholar] [CrossRef]
  24. Hao, Y.; Gai, Z.; Wu, H. How do resource misallocation and government corruption affect green total factor energy efficiency? Evidence from China. Energy Policy 2020, 143, 111562. [Google Scholar] [CrossRef]
  25. Hao, Y.; Guo, Y.; Wu, H. The role of information and communication technology on green total factor energy efficiency: Does environmental regulation work? Bus. Strategy Environ. 2022, 31, 403–424. [Google Scholar] [CrossRef]
  26. Liu, Z.-m.; Deng, M.-y.; Yang, D.; Ma, Y. Can Reducing the Energy Cost of Enterprises Improve Energy Efficiency and Social Welfare—Analysis from the Perspective of Cross Subsidy. China Ind. Econ. 2020, 3, 100–118. (In Chinese) [Google Scholar]
  27. Wang, Q.; Yuan, B. Air pollution control intensity and ecological total-factor energy efficiency: The moderating effect of ownership structure. J. Clean. Prod. 2018, 186, 373–387. [Google Scholar] [CrossRef]
  28. Wang, X.; Yeung, G.; Li, X.; Wang, L. Does inter-regional investment by publicly listed companies promote local green total factor productivity? A study of the mediation effects of green patents in China. J. Clean. Prod. 2022, 339, 130582. [Google Scholar] [CrossRef]
  29. Wu, H.; Hao, Y.; Ren, S.; Yang, X.; Xie, G. Does internet development improve green total factor energy efficiency? Evidence from China. Energy Policy 2021, 153, 112247. [Google Scholar] [CrossRef]
  30. Yu, B. Industrial structure, technological innovation, and total-factor energy efficiency in China. Environ. Sci. Pollut. Res. 2020, 27, 8371–8385. [Google Scholar] [CrossRef] [PubMed]
  31. Jiang, Y.; Wang, H.; Liu, Z. The impact of the free trade zone on green total factor productivity—Evidence from the shanghai pilot free trade zone. Energy Policy 2021, 148, 112000. [Google Scholar] [CrossRef]
  32. Feng, Y.; Wang, X.; Liang, Z.; Hu, S.; Xie, Y.; Wu, G. Effects of emission trading system on green total factor productivity in China: Empirical evidence from a quasi-natural experiment. J. Clean. Prod. 2021, 294, 126262. [Google Scholar] [CrossRef]
  33. Shi, D.; Li, S. Emissions trading system and energy use efficiency—Measurements and empirical evidence for cities at and above the prefecture level. China Ind. Econ. 2020, 9, 5–23. [Google Scholar]
  34. Chen, Z.; Song, P.; Wang, B. Carbon emissions trading scheme, energy efficiency and rebound effect—Evidence from China’s provincial data. Energy Policy 2021, 157, 112507. [Google Scholar] [CrossRef]
  35. Dong, F.; Li, Y.; Li, K.; Zhu, J.; Zheng, L. Can smart city construction improve urban ecological total factor energy efficiency in China? Fresh evidence from generalized synthetic control method. Energy 2022, 241, 122909. [Google Scholar] [CrossRef]
  36. Cao, X.; Deng, M.; Li, H. How does e-commerce city pilot improve green total factor productivity? Evidence from 230 cities in China. J. Environ. Manag. 2021, 289, 112520. [Google Scholar] [CrossRef]
  37. Gao, K.; Yuan, Y. The effect of innovation-driven development on pollution reduction: Empirical evidence from a quasi-natural experiment in China. Technol. Forecast. Soc. Change 2021, 172, 121047. [Google Scholar] [CrossRef]
  38. Zhang, S.; Wang, X. Does innovative city construction improve the industry–university–research knowledge flow in urban China? Technol. Forecast. Soc. Change 2022, 174, 121200. [Google Scholar] [CrossRef]
  39. Li, Y.; Zhang, J.; Yang, X.; Wang, W.; Wu, H.; Ran, Q.; Luo, R. The impact of innovative city construction on ecological efficiency: A quasi-natural experiment from China. Sustain. Prod. Consum. 2021, 28, 1724–1735. [Google Scholar] [CrossRef]
  40. Elliott, R.J.R.; Sun, P.; Zhu, T. The direct and indirect effect of urbanization on energy intensity: A province-level study for China. Energy 2017, 123, 677–692. [Google Scholar] [CrossRef]
  41. Tang, M.; Mihardjo, L.W.W.; Haseeb, M.; Khan, S.A.R.; Jermsittiparsert, K. The dynamics effect of green technology innovation on economic growth and CO2 emission in Singapore: New evidence from bootstrap ARDL approach. Environ. Sci. Pollut. Res. 2021, 28, 4184–4194. [Google Scholar]
  42. Li, J.; Zhang, X.; Ali, S.; Khan, Z. Eco-innovation and energy productivity: New determinants of renewable energy consumption. J. Environ. Manag. 2020, 271, 111028. [Google Scholar] [CrossRef]
  43. Acemoglu, D.; Aghion, P.; Bursztyn, L.; Hemous, D. The Environment and Directed Technical Change. Am. Econ. Rev. 2012, 102, 131–166. [Google Scholar] [CrossRef] [Green Version]
  44. Wen, D. Resource Misallocation, TFP and Growth Potential in China’s Manufacturing. China Econ. Q. 2019, 18, 617–638. (In Chinese) [Google Scholar]
  45. Howarth, R.B.; Andersson, B. Market barriers to energy efficiency. Energy Econ. 1993, 15, 262–272. [Google Scholar] [CrossRef] [Green Version]
  46. Lin, B.; Chen, Z. Does factor market distortion inhibit the green total factor productivity in China? J. Clean. Prod. 2018, 197, 25–33. [Google Scholar] [CrossRef]
  47. Barro, R.J. Human Capital and Growth. Am. Econ. Rev. 2001, 91, 12–17. [Google Scholar] [CrossRef]
  48. Zhang, J.; Koji, K. The determinants of household energy demand in rural Beijing: Can environmentally friendly technologies be effective? Energy Econ. 2012, 34, 381–388. [Google Scholar]
  49. Frankel, J.A. The Natural Resource Curse: A Survey; National Bureau of Economic Research: Cambridge, MA, USA, 2010. [Google Scholar]
  50. Krugman, P. Space: The Final Frontier. J. Econ. Perspect. 1998, 12, 161–174. [Google Scholar] [CrossRef]
  51. Abadie, A. Semiparametric Difference-in-Differences Estimators. Rev. Econ. Stud. 2005, 72, 1–19. [Google Scholar] [CrossRef]
  52. Beck, T.; Levine, R.; Levkov, A. Big Bad Banks? The Winners and Losers from Bank Deregulation in the United States. J. Financ. 2010, 65, 1637–1667. [Google Scholar] [CrossRef] [Green Version]
  53. McGavock, T. Here waits the bride? The effect of Ethiopia’s child marriage law. J. Dev. Econ. 2021, 149, 102580. [Google Scholar] [CrossRef]
  54. Rosenbaum, P.R.; Rubin, D.B. The central role of the propensity score in observational studies for causal effects. Biometrika 1983, 70, 41–55. [Google Scholar] [CrossRef]
  55. Anderson, D.M. In School and Out of Trouble? The Minimum Dropout Age and Juvenile Crime. Rev. Econ. Stat. 2014, 96, 318–331. [Google Scholar] [CrossRef]
  56. Yan, Y.; Xu, X.; Lai, J. Does Confucian culture influence corporate R&D investment? Evidence from Chinese private firms. Financ. Res. Lett. 2021, 40, 101719. [Google Scholar]
  57. Acemoglu, D.; Johnson, S.; Robinson, J.A. The Colonial Origins of Comparative Development: An Empirical Investigation. Am. Econ. Rev. 2001, 91, 1369–1401. [Google Scholar] [CrossRef]
  58. Hu, J.-L.; Kao, C.-H. Efficient energy-saving targets for APEC economies. Energy Policy 2007, 35, 373–382. [Google Scholar] [CrossRef]
  59. Zhang, J.; Wu, G.; Zhang, J. The Estimation of China’s provincial capital stock: 1952–2000. Econ. Res. J. 2004, 10, 35–44. (In Chinese) [Google Scholar]
  60. Engstrom, R.; Hersh, J.; Newhouse, D. Poverty from Space: Using High Resolution Satellite Imagery for Estimating Economic Well-being. World Bank Econ. Rev. 2022, 36, 382–412. [Google Scholar] [CrossRef]
  61. Antweiler, W.; Copeland, B.R.; Taylor, M.S. Is Free Trade Good for the Environment? Am. Econ. Rev. 2001, 91, 877–908. [Google Scholar] [CrossRef] [Green Version]
  62. Keller, W.; Levinson, A. Pollution Abatement Costs and Foreign Direct Investment Inflows to U.S. States. Rev. Econ. Stat. 2002, 84, 691–703. [Google Scholar] [CrossRef]
  63. Sun, D.; Zeng, S.; Lin, H.; Meng, X.; Yu, B. Can transportation infrastructure pave a green way? A city-level examination in China. J. Clean. Prod. 2019, 226, 669–678. [Google Scholar] [CrossRef]
  64. Liu, G.; Zhang, J.; Feng, C. Financial system reform and economic efficiency improvement in China: Some evidence from provincial panel data. Manag. World 2017, 6, 9–22. (In Chinese) [Google Scholar]
  65. Glaeser, E.L.; Kahn, M.E. The greenness of cities: Carbon dioxide emissions and urban development. J. Urban Econ. 2010, 67, 404–418. [Google Scholar] [CrossRef] [Green Version]
  66. Ohlan, R. The impact of population density, energy consumption, economic growth and trade openness on CO2 emissions in India. Nat. Hazards 2015, 79, 1409–1428. [Google Scholar] [CrossRef]
  67. Zhang, L.; Ren, Z.; Chen, B.; Gong, P.; Fu, H.; Xu, B. A Prolonged Artificial Nighttime-Light Dataset of China (1984–2020); National Tibetan Plateau Data Center: Beijing, China, 2021. [Google Scholar]
  68. Bertrand, M.; Duflo, E.; Mullainathan, S. How Much Should We Trust Differences-In-Differences Estimates? Q. J. Econ. 2004, 119, 249–275. [Google Scholar] [CrossRef] [Green Version]
  69. Bu, C.; Zhang, K.; Shi, D.; Wang, S. Does environmental information disclosure improve energy efficiency? Energy Policy 2022, 164, 112919. [Google Scholar] [CrossRef]
  70. Chen, Y.J.; Li, P.; Lu, Y. Career concerns and multitasking local bureaucrats: Evidence of a target-based performance evaluation system in China. J. Dev. Econ. 2018, 133, 84–101. [Google Scholar] [CrossRef]
  71. Yu, Y.; Zhang, N. Low-carbon city pilot and carbon emission efficiency: Quasi-experimental evidence from China. Energy Econ. 2021, 96, 105125. [Google Scholar] [CrossRef]
  72. Ding, L.; Wu, M.; Jiao, Z.; Nie, Y. The positive role of trade openness in industrial green total factor productivity—Provincial evidence from China. Environ. Sci. Pollut. Res. 2022, 29, 6538–6551. [Google Scholar] [CrossRef]
  73. Kellogg, R.; Wolff, H. Daylight time and energy: Evidence from an Australian experiment. J. Environ. Econ. Manag. 2008, 56, 207–220. [Google Scholar] [CrossRef]
  74. Cai, X.; Lu, Y.; Wu, M.; Yu, L. Does environmental regulation drive away inbound foreign direct investment? Evidence from a quasi-natural experiment in China. J. Dev. Econ. 2016, 123, 73–85. [Google Scholar] [CrossRef]
  75. Ren, S.; Zheng, J.; Liu, D.; Chen, X. Does emissions trading system improve firm’s total factor productivity—Evidence from chinese listed companies. China Ind. Econ. 2019, 5, 5–23. (In Chinese) [Google Scholar]
  76. Zhao, H.; Hu, Y. Who Affects the Rise and Fall of Capital City Location in China during the Past Two Thousand Years?—An Empirical Analysis Based on the Econometric Economic History. China Econ. Q. 2019, 01, 281–310. (In Chinese) [Google Scholar]
  77. Xu, X.; Li, W. Confucian Tradition and Corporate Innovation: The Power of Culture. J. Financ. Res. 2019, 09, 112–130. (In Chinese) [Google Scholar]
  78. Chen, D. Trade Barrier Reduction and Environmental Pollution Improvement: New Evidence from Firm-level Pollution Data in China. Econ. Res. J. 2020, 12, 98–114. (In Chinese) [Google Scholar]
  79. Dell, M. The Persistent Effects of Peru’s Mining Mita. Econometrica 2010, 78, 1863–1903. [Google Scholar] [CrossRef]
  80. Wurlod, J.-D.; Noailly, J. The impact of green innovation on energy intensity: An empirical analysis for 14 industrial sectors in OECD countries. Energy Econ. 2018, 71, 47–61. [Google Scholar] [CrossRef] [Green Version]
  81. Hsieh, C.-T.; Klenow, P.J. Misallocation and Manufacturing TFP in China and India. Q. J. Econ. 2009, 124, 1403–1448. [Google Scholar] [CrossRef] [Green Version]
  82. Acemoglu, D.; Akcigit, U.; Alp, H.; Bloom, N.; Kerr, W. Innovation, Reallocation, and Growth. Am. Econ. Rev. 2018, 108, 3450–3491. [Google Scholar] [CrossRef] [Green Version]
  83. Lin, B.; Du, K. The Energy Effect of Factor Market Distortion in China. Econ. Res. J. 2013, 09, 125–136. (In Chinese) [Google Scholar]
  84. Chen, D.; Chen, S.; Jin, H. Industrial agglomeration and CO2 emissions: Evidence from 187 Chinese prefecture-level cities over 2005–2013. J. Clean. Prod. 2018, 172, 993–1003. [Google Scholar] [CrossRef]
  85. Fan, C.C.; Scott, A.J. Industrial Agglomeration and Development: A Survey of Spatial Economic Issues in East Asia and a Statistical Analysis of Chinese Regions. Econ. Geogr. 2003, 79, 295–319. [Google Scholar] [CrossRef]
Figure 1. The spatial distribution of pilot cities and non-pilot cities up to August 2022.
Sustainability 14 12723 g001
Figure 2. Channels and mechanism diagram.
Sustainability 14 12723 g002
Figure 3. Change in average GTFEE in pilot and non-pilot cities. Data source: author’s calculations.
Sustainability 14 12723 g003
Figure 4. Spatial and temporal distribution of GTFEE in the sample cities in (a) 2005 and (b) 2019.
Sustainability 14 12723 g004
Figure 5. Parallel trend test and policy dynamic effects.
Sustainability 14 12723 g005
Figure 6. Empirical cumulative distribution of placebo test coefficients (1000 times Monte Carlo simulation results of randomly constructed experimental group).
Sustainability 14 12723 g006
Figure 7. (a) Before matching; (b) after matching. Kernel density plot before and after propensity score matching.
Sustainability 14 12723 g007
Table 1. Selection of Super-EBM measurement indicators.
CategoryMeaningIndicators
InputsLabor forceNumber of employees in urban units at the end of the period
CapitalFixed asset investment adjusted for capital stock
Energy consumptionTotal city energy consumption
Expected outputRegional GDPDeflated regional GDP
Undesired outputsIndustrial wasteIndustrial smoke and dust emissions
Industrial sulfur dioxide emissions
Industrial wastewater discharge
Table 2. Sample of NICPP treatment groups. Note: The three pilot cities of Lhasa, Shihezi and Changji were excluded due to limited data availability.
YearQuantityCity
20081Shenzhen
201043Dalian, Qingdao, Xiamen, Shenyang, Xi’an, Guangzhou, Chengdu, Nanjing, Hangzhou, Jinan, Hefei, Zhengzhou, Changsha, Suzhou, Wuxi, Yantai, Beijing (Haidian District), Tianjin (Binhai New Area), Chongqing (Shapingba District), Shanghai (Yangpu District), Tangshan, Baotou, Harbin, Ningbo, Jiaxing, Luoyang, Wuhan Lanzhou, Guiyang, Nanning, Yinchuan, Xining, Kunming, Shijiazhuang, Taiyuan, Changzhou, Fuzhou, Nanchang, Haikou, Baoji, Jingdezhen
20115Lianyungang, Zhenjiang, Qinhuangdao, Changchun, Hohhot
20122Urumqi, Nantong
201310Yichang, Yangzhou, Taizhou, Yancheng, Huzhou, Pingxiang, Jining, Nanyang, Xiangyang, Zunyi
201817Jilin, Xuzhou, Shaoxing, Jinhua, Maanshan, Wuhu, Quanzhou, Longyan, Weifang, Dongying, Zhuzhou, Hengyang, Foshan, Dongguan, Yuxi, Hanzhong
Table 3. Descriptive statistics of variables.
VariablesDefinitionNMeansdMinMax
lngtfeeGreen total factor energy efficiency42300.00780.3040−1.65101.2740
didNICPP dummy variable45120.13000.336001
lnpgdpEconomic development45120.81500.8170−1.55003.6480
lnfiscGovernment intervention4512−0.87700.5370−3.66400.4330
lnfinFinancial level451210.14000.46508.542012.6500
lnroadInfrastructure level45122.23100.6850−3.91204.6860
fdigdplevel of opening45120.02370.02490.00000.2930
popdensityPopular density45120.42700.33100.00062.6620
scindgdpScience and technology expenditure45121.34000.66900.033817.6500
lngdpecSingle-factor energy efficiency4512−0.09180.7880−3.94802.1280
Table 4. Baseline regression results. Note: Standard errors in parentheses are clustered at the city level; *** p < 0.01, ** p < 0.05, * p < 0.1.
(1)(2)(3)(4)(5)
did0.0645 ***0.0749 **0.0458 **0.0473 ***0.0596 ***
(0.0184)(0.0300)(0.0178)(0.0178)(0.0181)
lnpgdp 0.1295 ***0.2022 ***0.2002 ***0.2954 ***
(0.0284)(0.0218)(0.0192)(0.0494)
lnfin −0.0540−0.0931 ***−0.0871 ***−0.1297 ***
(0.0417)(0.0260)(0.0239)(0.0357)
lnroad 0.0234−0.0124−0.0104−0.0081
(0.0206)(0.0116)(0.0111)(0.0101)
lnfisc 0.0169−0.1318 ***−0.1163 ***−0.0295
(0.0397)(0.0271)(0.0234)(0.0256)
fdigdp −0.64850.32400.28180.3600
(0.4791)(0.2465)(0.2366)(0.2202)
popdens −0.04010.1322 *0.07490.2367 ***
(0.0407)(0.0777)(0.0504)(0.0604)
scindgdp 0.0142−0.0397 **−0.0374 **−0.0116
(0.0215)(0.0172)(0.0164)(0.0114)
_cons−0.00110.40950.6742 ***0.6464 ***0.9596 **
(0.0025)(0.4323)(0.2429)(0.2212)(0.3906)
Year fixed effectsYesYesNoNoYes
City fixed effectsYesNoYesNoYes
Observations42304230423042304230
R-squared0.81190.22930.76840.17720.8349
Table 5. Full-sample PSM-DID regression results. Note: Standard errors in parentheses are clustered at the city level; *** p < 0.01, ** p < 0.05, * p < 0.1.
(1)(2)(3)
PSM-DID
Weights Are Not Empty SamplesMeet the Common Support Hypothesis SampleFrequency-Weighted Regression
did0.0723 *0.0743 **0.1056 ***
(1.9270)(2.2002)(2.7021)
Control variablesYesYesYes
Year fixed effectsYesYesYes
City fixed effectsYesYesYes
Observations138537082299
R-squared0.20570.20420.1901
Table 6. PSM-DID regression results for the first three years of policy implementation only. Note: Standard errors in parentheses are clustered at the city level; *** p < 0.01.
(1)(2)(3)
Radius MatchingNearest Neighbor MatchingNuclear Matching
DID0.1273 ***0.1362 ***0.1295 ***
(0.0347)(0.0370)(0.0352)
Control variablesYesYesYes
Year fixed effectsYesYesYes
City fixed effectsYesYesYes
Observations126011701230
R-squared0.84390.84140.8386
Table 7. Regression results for replacing the explanatory variables. Note: Standard errors in parentheses are clustered at the city level; *** p < 0.01.
(1)(2)(3)(4)(5)(6)
lngtfee(EBM)lngdpeclngtfee(SBM)
did0.0645 ***0.0596 ***0.0745 ***0.0716 ***0.1691 ***0.1394 ***
(0.0184)(0.0181)(0.0221)(0.0177)(0.0493)(0.0478)
Control variablesNoYesNoYesNoYes
Year fixed effectsYesYesYesYesYesYes
City fixed effectsYesYesYesYesYesYes
Observations423042304230423042304230
Within R-squared0.81190.83490.96830.98000.69640.7069
Table 8. Regression results by adding other control variables. Note: Standard errors in parentheses are clustered at the city level; *** p < 0.01, ** p < 0.05, * p < 0.1.
(1)(2)(3)(4)
Baseline RegressionNumber of Enrolled UniversitiesJoin the Number of College StudentsAdd Education Expenses
did0.0596 ***0.0589 ***0.0500 ***0.0413 **
(0.0181)(0.0181)(0.0187)(0.0174)
University 0.0002 ***
(0.0000)
Students 0.0018 *
(0.0010)
edugdp −3.2600 ***
(0.6058)
Other control variablesYesYesYesYes
Year fixed effectsYesYesYesYes
City fixed effectsYesYesYesYes
Observations4230423042304230
R-squared0.83490.83510.83520.8413
Table 9. Counterfactual test regression results. Note: Standard errors in parentheses are clustered at the city level; *** p < 0.01.
(1)(2)(3)(4)
Baseline Regression1 Year Ahead2 Year Ahead3 Year Ahead
did0.0596 ***0.0671 ***0.0628 ***0.0638 ***
(0.0181)(0.0166)(0.0158)(0.0156)
t1did −0.0166
(0.0163)
t2did −0.0147
(0.0171)
t3did −0.0214
(0.0190)
Control variablesYesYesYesYes
Year fixed effectsYesYesYesYes
City fixed effectsYesYesYesYes
Observations4230423042304230
R-squared0.83490.843040.84270.8425
Table 10. Regression results excluding other interfering policies in the same period. Note: Standard errors in parentheses are clustered at the city level; *** p < 0.01, ** p < 0.05, * p < 0.1.
(1)(2)(3)(4)(5)(6)
Baseline RegressionEmissions Trading PilotLow Carbon City PilotSmart City PilotCarbon Market Trading PilotAll Pilots
did0.0596 ***0.0563 ***0.0614 ***0.0558 ***0.0594 ***0.0545 ***
(0.0181)(0.0179)(0.0183)(0.0181)(0.0182)(0.0181)
ET 0.0403 ** 0.0361 *
(0.0187) (0.0186)
LC −0.0300 −0.0204
(0.0216) (0.0237)
SC 0.0519 ** 0.0448 *
(0.0254) (0.0257)
CMT −0.0376−0.0234
(0.0269)(0.0297)
Control variablesYesYesYesYesYesYes
Year fixed effectsYesYesYesYesYesYes
City fixed effectsYesYesYesYesYesYes
Observations423042304230423042304230
R-squared0.83490.83560.83540.83560.83540.8367
Table 11. Results of DDD regression. Note: Standard errors in parentheses are clustered at the city level; *** p < 0.01.
(1)(2)
DDD0.0917 ***0.0927 ***
(0.0351)(0.0353)
DID0.005570.0008
(0.0306)(0.0318)
Control variablesNoYes
Year fixed effectsYesYes
City fixed effectsYesYes
Observations42304230
R-squared0.81300.8360
Table 12. Regression results of instrumental variables. Note: Standard errors in parentheses are clustered at the city level; *** p < 0.01, ** p < 0.05, * p < 0.1.
(1)(2)(3)(4)
Ancient CapitalConfucianism
Phase IPhase IIPhase IPhase II
historycity × period0.8119 ***
(0.0269)
confucian × period 0.3180 ***
(0.0079)
did 0.0878 ***
(0.0452)
0.0458 **
(0.0196)
Control variablesYesYesYesYes
Year fixed effectsYesYesYesYes
City fixed effectsYesYesYesYes
Observations4230423042304230
R-squared0.70020.83450.92610.8348
Table 13. Test results of influence channels. Note: Standard errors in parentheses are clustered at the city level; *** p < 0.01.
(1)(2)(3)
IndustryGreen InnovationMisallocation
DID0.1079 ***0.8195 ***−0.3359 ***
0.0290(0.0978)(0.1085)
Control variablesYesYesYes
Year fixed effectsYesYesYes
City fixed effectsYesYesYes
Observations423042302338
R-squared0.86300.79770.7206
Table 14. Regression results of heterogeneity of scientific and educational resources and industrial base. Note: Standard errors in parentheses are clustered at the city level; *** p < 0.01, ** p < 0.05.
Science and Education ResourcesIndustrial Base
(1)(2)(3)(4)(5)
Number of Colleges and Universities 0–1Whether There are “Double First-Class” Universities 0–1Number of College Students 0–1Number of Scientific Researchers 0–1Whether It Is an Old Industrial Base 0–1
DID−0.01640.0187−0.0122−0.03680.0828
(0.0359)(0.0249)(0.0379)(0.0339)(0.0196)
DID × Moderator0.0847 **0.0825 ***0.0805 **0.1011 ***−0.0601 **
(0.0350)(0.0308)(0.0383)(0.0357)(0.0344)
Control variablesYesYesYesYesYes
Year fixed effectsYesYesYesYesYes
City fixed effectsYesYesYesYesYes
Observations42304230423042304230
R-squared0.83540.83590.83540.83550.8354
Table 15. Regression results of industrial agglomeration heterogeneity. Note: Standard errors in parentheses are clustered at the city level; ** p < 0.05.
(1)(2)(3)(4)
2007 Industry Aggregation2006 Industry Aggregation2005 Industry Aggregation2005–2007 Industry Aggregation
did−0.01410.00320.00330.0039
(0.0312)(0.0341)(0.0265)(0.0274)
did × Moderator0.0864 **0.0726 **0.0705 **0.0690 **
(0.0343)(0.0329)(0.0309)(0.0315)
Control variablesYesYesYesYes
Year fixed effectsYesYesYesYes
City fixed effectsYesYesYesYes
Observations4230423042304230
R-squared0.83540.83530.83540.8353
Publisher’s Note: MDPI stays neutral with regard to jurisdictional claims in published maps and institutional affiliations.

