Article

The Evolution of the Construction Waste Recycling System and the Willingness to Use Recycled Products in China

1
School of Civil Engineering, Henan Polytechnic University, Jiaozuo 454000, China
2
Xi’an Traffic Enginering Institute, Xi’an 710300, China
3
School of Architecture, Tianjin University, Tianjin 300072, China
*
Author to whom correspondence should be addressed.
Sustainability 2022, 14(19), 12541; https://doi.org/10.3390/su141912541
Submission received: 20 August 2022 / Revised: 22 September 2022 / Accepted: 26 September 2022 / Published: 1 October 2022
(This article belongs to the Collection Waste Utilization and Resource Recovery)

Abstract

:
This paper establishes a recycling system for construction waste and simulates the operation of its four links using the theory and method of system dynamics. In addition, based on the technology acceptance model and the theory of planned behavior, a research model on the willingness of purchasers to use recycled products of construction waste is established, and the factors influencing willingness to use recycled products are analyzed using structural equations. Results show that the operation trend of the building waste recycling subsystem and information feedback subsystem is relatively poor. Purchasers’ perceived ease of use of recycled products correlates positively with their perceived usefulness, and attitude toward use correlates positively with behavioral intention, which promotes willingness to use. The attitudes toward use, behavioral intention, and intention to use are all negatively correlated with purchasers’ perceived risk of recycled products, with the negative correlation being stronger for behavioral intention and attitude toward use. The results of this study provide a theoretical foundation for promoting the process of recycling construction waste.

1. Introduction

Construction and demolition waste (C&DW) production in China is increasing year by year with the advance of urbanization. According to statistics, the total amount of C&DW produced in China is measured in tons every year, accounting for about 35 percent of the total urban waste [1]. Recycling construction waste can reduce the discharge of solid waste and the pollution of groundwater, as well as save resources and realize the effective utilization of resources. In July 2021, the National Development and Reform Commission issued the “14th Five-Year Plan for Circular Economy Development”, which put forward the target requirement that “by 2025, the recycling efficiency will be greatly improved and the comprehensive utilization rate of construction waste will reach 60%” [2]. However, at present, the utilization rate of CWR in China is only about 10%. The system of CWR is not perfect. There is low market recognition, and the negative attitude of purchasers seriously hinders the promotion and utilization of CWR products, thus restricting the development of construction waste resources. Therefore, studying the structure of the CWR system and the willingness to use recycled products to find out weak links in the development of CWR and the main factors that affect buyers’ willingness to use recycled products is conducive to the continuous advancement of construction waste reduction in China.
Many experts and scholars at home and abroad have performed a lot of research on CWR and its recycled products. In terms of CWR, Xu Yubo et al. [3] studied the payment mechanisms for CWR and discussed the problems of high cost and the unprofitable CWR industry. Li Qiang et al. [4] comprehensively analyzed the shortcomings and future development direction of China’s CWR resource system from aspects of C&DW reduction, reuse, and sustainability. Lei Du et al. [5] investigated and analyzed the decision-making behavior of stakeholders in the CWR system and found that the government’s reward and punishment measures can effectively reduce the illegal dumping of C&DW, but excessive reward and punishment measures have limitations in controlling illegal dumping. Li Ma et al. [6] established a dynamic evolution game model of construction waste recycling and analyzed the biological evolution of the behavior of construction enterprises and recycling enterprises with or without government incentives. Ding Zhikun et al. [7] adopted Agent simulation technology and the Repast Simphony platform and concluded that the effective management of C&DW was related to the attitude of stakeholders. In the aspect of recycled products of C&DW, Cui can et al. [8] evaluated the ecological risk of heavy metal pollution in recycled products of construction waste and concluded that the ecological risk level of recycled products was lower than the potential ecological risk of heavy metals in C&DW. Shi Shiying et al. [9] analyzed the matching between the supply and demand of recycled products and found that when the ratio of supply and demand of recycled products fluctuated between 0.1 and 0.25, there was a significant mismatch between supply and demand. Wang Chuan et al. [10] used C&DW as the main raw material to synthesize iron-loaded zeolite ceramsite for arsenic adsorption. Ding Zhikun et al. [11] studied the influence of media on consumers’ willingness to buy products recycled from C&DW and argued that media can significantly influence consumers’ perceptions and purchase decisions. By constructing the perceived value model, they also assert that the improvement of perceived value is helpful in promoting stakeholders to buy C&DW recycled products [12].
Existing studies on CWR mainly focus on payment mechanisms, the decision-making behavior of stakeholders, and evolutionary games. There is a lack of research on the overall evolution of the CWR system to find out the reasons for the slow progress of CWR in China. In addition, research on recycled products mainly focuses on risk, technology, and supply and demand balance. Although some scholars have studied the factors affecting the use of recycled C&DW products, most of them focus on the influence of single factors or subjects relating to the intention to use recycled products, such as media and perceived value, ignoring the relationship between buyers’ intention and behavior.
Therefore, the purpose of this study is to identify the weak parts in the CWR system, analyze purchasers’ willingness to use recycled products, consider the relationship between buyers’ willingness and behavior, and promote the development of the CWR industry. In this paper, the recycling system of C&DW is divided into four subsystems, and the weak parts that affect it are identified by using the principles and methods of system dynamics. Secondly, based on the theory of planned behavior and technology acceptance model, a structural equation model of the willingness to use recycled products of C&DW is constructed to explore the factors influencing purchasers’ willingness to guide the government and stakeholders to make appropriate behavior decisions, and to provide a reference for continuously improving the level of recycling of C&DW, promoting the sustainable development of cities and the social economy.

2. Materials and Methods

2.1. Establishment of a Recycling System Model for Construction Waste

2.1.1. System Boundary Determination

The determination of system boundary is the basis for establishing the system dynamics model. The CWR system involves many stakeholders, mainly including the government, scientific research institutions, construction enterprises, CWR enterprises, and the masses. Based on the subjects within the CWR system, a reasonable system boundary can be determined.
The government is a guide of C&DW resourcing. It can implement reward and punishment mechanisms to incentivize and regulate the recycling enterprises and construction enterprises, publicize the knowledge of CWR, and enhance the mass awareness of recycling and protecting environment. Construction enterprises are both providers of materials to businesses that recycle C&DW and consumers of recycled goods, with incentives and restrictions from the government. Scientific research institutions are technical providers for CWR. With the support of the government and other relevant departments, they provide construction waste recycling enterprises with technical support, mainly including CWR and harmless disposal technology [13]. CWR enterprises use CWR technologies to convert C&DW into recycled products and provide them to construction companies or the masses. For the masses, as the consumers of CWR, their awareness of recycling plays a great role in promoting the development of society and can also effectively promote the research, development, and innovation of new technologies by scientific research institutions. When recycled products are used, the quality and price problems are communicated to scientific research institutions and recycling companies. After receiving this feedback, scientific research institutions and resource-based companies are able to improve technically based on their own conditions and actual conditions in order to achieve better sales results.
As a result of the above relationships between the subjects of the CWR system, the system boundaries are defined as main subjects and the factors that influence their behavior. Based on the production and operation process of recycled products, construction waste recycling system is divided into four subsystem boundaries: government governance, technology supply, recycled product utilization, and information feedback of recycled products. Government departments, construction enterprises, CWR enterprises, scientific research institutions, and the masses are the primary subjects of the government governance subsystem. Scientific research institutions and recycling businesses are the primary subjects of the technology supply subsystem. The recycling enterprises, construction enterprises, and the masses are the primary subjects of the subsystem for the use of recycled products. The masses, scientific research institutions, and CWR enterprises are the primary subjects of the information feedback subsystem. As shown in Figure 1, the integrated four subsystems form a construction waste resource system.

2.1.2. Causality Construction

A causality diagram is an important system dynamics analysis tool that can clearly show the dynamic influence relationship of various stakeholders in a system [14]. Promotion of the CWR process requires the coordination and cooperation of the various subjects within the system, as well as the regulation and promotion of external mechanisms. In addition to the main subjects such as the government, scientific research institutions, construction enterprises, CWR enterprises, and the general public, the operating C&DW resource system has other components such as the market environment, investment costs, scientific research environment, education and publicity, and material supply.
The operation of the government governance subsystem is primarily influenced by cooperation among the general public, construction companies, CWR companies, and research institutions, as well as the strength of education and publicity and financial support. The technology supply subsystem is mainly influenced by policy support, demand from CWR enterprises, social environment, market environment, research environment, and financial support. The recycled product utilization subsystem is mainly influenced by user demand, market environment, social environment, raw material supply, policy support, mass media promotion, and financial investment. The information feedback subsystem is mainly influenced by factors such as user satisfaction, user interest, technical level, economic efficiency, environmental efficiency, and social efficiency.
The causal relationship of the factors of the four subsystems can be integrated into a causal relationship within the C&DW resource utilization system, as shown in Figure 2.

2.1.3. Establishment of Construction Waste Recycling System Model

A logistic function is a common sigmoid function that is widely used in many fields [15]. In the process of CWR, various influencing factors have the characteristics of diminishing marginal utility. The logistic function is primarily used in this paper to analyze the behavior of various stakeholders and the impact of their decisions on CWR. The basic form of the logistic function is as follows:
dy dx = kx N x
x t = N 1 + Ce kNt
where y is the resource utilization level, x is the work intensity, N is the saturated capacity, k is the growth rate of the resource utilization level, and t is the time. Set the recycling capacity range of C&DW to [ 0 ,   1 ] . According to Formulas (1) and (2), we can obtain:
y = 1 1 + Ce kx
Set the current level of resource utilization as y 0 , and after continuing to invest in ∆x, the level of resource utilization will increase to y . By studying the level of resource utilization and the input changes of work intensity, this paper studies the degree of influence of stakeholders on the resource utilization of C&DW. Therefore, according to Formulas (1)–(3), we can obtain:
y = y     y 0 = 1 1 + 1     y 0 y 0 e xk   y
The change of government administration effect is mainly determined by such variables as the cooperation of the public (P), construction enterprises (CE), resource enterprises (RE), scientific research institutions (SR), education and publicity (EP), financial support (FS), and so on. The relevant equations of government administration effect are shown in Formulas (5)–(7).
GI = 1 a 1 , 1 + a 1 , 2 + a 1 , 3 + a 1 , 4 + a 1 , 5 + a 1 , 6 + a 1 , 7 + a 1 , 8   a 1 , 1 P G + a 1 , 2 CE G + a 1 , 3 RE G + a 1 , 4 SR G + a 1 , 5 EP G + a 1 , 6 FS G + a 1 , 7 1 1 + a 1 , 9 a 1 , 10 ES + a 1 , 8 1 1 + 1 G G a 1 , 10 ES
GD = a 1 , 12 PE   ×   G + a 1 , 13
G = INTEG   GI GD G 0
where a 1 , 1 8 is the influence weight of each variable that affects the governance effect, a 1 , 9 is the parameter C of logistic function, a 1 , 10 11 is the parameter K of logistic function, a 1 , 12 is the influence of poor social environment (PE) on governance effect, a 1 , 13 is the influence of other factors, G is the government governance effect, GI is the government governance effect increases, GD is the government governance effect decreases, and G 0 is the initial value of governance effect.
The technology supply subsystem mainly reflects its running trend by the technology supply capacity (T), which has an accumulation effect. With the influence of various factors, the resource technology supply capacity is enhanced. The main influencing factors of technology supply capacity are policy support (PS), resource enterprise demand (RD), social environment (SE), market environment (ME), scientific research environment (SRE) and capital support (CF). The related equations of technical supply capacity are shown in Formulas (8)–(10).
TI = 1 a 2 , 1 + a 2 , 2 + a 2 , 3 + a 2 , 4 + a 2 , 5 + a 2 , 6 + a 2 , 7 + a 2 , 8   a 2 , 1 PS T + a 2 , 2 RD T + a 2 , 3 SE T + a 2 , 4 ME T + a 2 , 5 SRE T + a 2 , 6 CF T + a 2 , 7 1 1 + a 2 , 9 a 2 , 10 CF + a 2 , 8 1 1 + 1 T T a 2 , 10 CF
TD = a 2 , 12 MC × T + a 2 , 13
T = INTEG TI TD T 0
where a 2 , 1 8 represents the influence weight of each influencing factor, a 2 , 9 represents the parameter C of logistic function, a 2 , 10 11 represents the parameter K of logistic function, a 2 , 12 represents the influence of market competition level (MC) on technology supply capacity, a 2 , 13 represents the influence of other factors, TI represents the enhancement of technology supply capacity, TD represents the weakening of technology supply capacity, and T represents the initial value of technology supply capacity.
The utilization subsystem of recycled products is mainly reflected by the increase or decrease in the utilization rate of recycled products (PR). The utilization rate of recycled products has cumulative effect, and the utilization rate increases with the influence of various factors. The increase and decrease in product utilization rate are mainly determined by factors such as user demand (UD), market environment (ME), social environment (SE), raw material supply (MS), policy support (PS), publicity and promotion of mass media (MP), and capital investment (CI). The relevant calculation equations for the utilization rate of recycled products are as follows in (11)–(13).
PRI = 1 a 3 , 1 + a 3 , 2 + a 3 , 3 + a 3 , 4 + a 3 , 5 + a 3 , 6 + a 3 , 7   a 3 , 1 UD PR + a 3 , 2 ME PR + a 3 , 3 SE PR + a 3 , 4 MS PR + a 3 , 5 PS PR + a 3 , 6 1 1 + a 3 , 1 e a 3 , 8 MP PR + a 3 , 7 1 1 + a 3 , 9 e a 3 , 11 CI PR
PRD = a 3 , 12 MC   ×   PR + a 3 , 13
PR = INTEG   PRI PRD   PR 0
where a 3 , 1 7 is the weight of each influencing factor, a 3 , 8 9 and a 3 , 10 11 are the parameters C and K of logistic function, a 3 , 12 is the influence of market competition level on product utilization, a 3 , 13 is the influence of other factors, PRI is the increase in recycled product utilization, PRD is the decrease in recycled product utilization, and PR0 is the initial value of the utilization rate of recycled products.
The information feedback subsystem of recycled products is mainly reflected by the increase or decrease in product favorable rate (FR). The favorable rate of recycled products has a certain cumulative effect, and the favorable rate will increase with the effect of factors. The factors that affect the increase and decrease in the favorable rate of CWR products are customer satisfaction (CS), customer benefits (CB), technical level (TL), economic benefits (EB), environmental benefits (EB1), social benefits (SB), etc. The related equations of the favorable rate of recycled products are shown in the Formulas (14)–(16).
FRI = 1 a 4 , 1 + a 4 , 2 + a 4 , 3 + a 4 , 4 + a 4 , 5 + a 4 , 6   a 4 , 1 CS FR + a 4 , 2 ( CB FR ) + a 4 , 3 TL FR + a 4 , 4 EB FR + a 4 , 5 EB 1 FR + a 4 , 6 SB FR
FRD = a 4 , 7 MC   ×   FR + a 4 , 8
FR = INTEG FRI FRD FR 0
where a 4 , 1 6 is the weight of each influencing factor on product favorable rate, a 4 , 7 is the influence of market competition level on product favorable rate, a 4 , 8 is the influence of other factors on product favorable rate, PRI is the increase in product favorable rate, PRD is the decrease in product favorable rate, and FR 0 is the initial value of product favorable rate.
In order to analyze the efficient operation of the CWR system, the system dynamics models of the above four subsystems are integrated to establish the CWR system. The system dynamics model is shown in Figure 3.

2.2. Model and Research Design of Using Willingness of Recycled Products for Construction Waste

2.2.1. Research and Model Establishment

Perceived usefulness refers to the degree of increase in work performance perceived by individuals after accepting and using information technology systems [16]. In this paper, perceived usefulness refers to the purchasers’ belief that the raw materials of recycled products are sufficient to meet demand while also conserving resources. Perceived ease of use is the degree of difficulty that buyers perceive when using recycled products. According to the TAM theory, a user’s perceived usefulness and ease of use will affect their attitude toward using, and the perceived ease of use has a positive correlation with perceived usefulness, which in turn has a positive effect on the attitude of use, and perceived usefulness will also positively promote behavior [17]. Therefore, the following assumptions are made:
Hypothesis 1.
Purchasers’ perceived ease of use of recycled products positively affects perceived usefulness;
Hypothesis 2.
Purchasers’ perceived ease of use of recycled products has a positive impact on their attitudes towards use;
Hypothesis 3.
Purchasers’ perceived usefulness of recycled products positively affects their attitudes towards use;
Hypothesis 4.
Purchasers’ perceived usefulness of recycled products positively affects their behavioral intentions.
Subjective norms refer to the social pressure that an individual feels when deciding whether or not to adopt a certain behavior [18]. In this paper, the subjective norms mainly include the recognition of recycled products, relevant government promotion policies, and the market environment of recycled products. Behavioral intention is the degree of tendency of an individual to perform a certain behavior. Subjective norms will control the strength of behavioral intentions. For example, if the public has a higher degree of recognition of recycled products from resources, the behavioral intentions of purchasers will increase. Subjective norms also play an important role in attitude formation. Positive behavioral attitude will promote the generation of behavioral intention [19], which will then affect their behavioral willingness. This puts forward the following hypotheses:
Hypothesis 5.
Purchasers’ subjective norms of recycled products have a positive impact on their attitudes towards use;
Hypothesis 6.
Purchasers’ subjective regulation of recycled products positively affects his behavioral intentions;
Hypothesis 7.
Purchasers’ attitude towards the use of recycled products positively affects his behavioral intentions;
Hypothesis 8.
Purchasers’ behavioral intentions on recycled products have a positive impact on their willingness to use.
Perceived risk believes that human behavior is uncertain and needs to bear risks [20]. In this paper, perceived risk refers to the concerns and worries of purchasers in terms of quality, price, and safety when using recycled products. With the buyer’s perceived risk increasing, it will affect buyer’s attitude to use, which in turn affects behavioral intentions and willingness to use. Perceived risk has a significant negative impact on purchasers’ attitudes, behavioral intentions, and willingness to use [21]. Therefore, the following hypotheses are proposed:
Hypothesis 9.
Purchasers’ perceived risk of recycled products negatively affects their attitudes towards use;
Hypothesis 10.
Purchasers’ perceived risk of recycled products negatively affects their behavioral intentions;
Hypothesis 11.
Purchasers’ perceived risk of recycled products negatively affects their willingness to use.
Based on the above discussion, a theoretical research model is constructed, as shown in Figure 4.

2.2.2. Variable Measurement

This article studies the influencing factors of the willingness to use CWR products. According to the 7 latent variables proposed by the research model, such as willingness to use, behavioral intention, attitude toward using, subjective norms, perceived risk, perceived usefulness, and perceived ease of use, the buyer’s willingness to use CWR products was studied. A total of 29 items were set based on the mature scales of domestic and foreign related research. The specific items and sources are shown in Table 1.

2.2.3. Questionnaire Design

Through in-depth interviews with experts, scholars, and government officials, as well as related literature, we determined the questionnaire options and designed a preliminary questionnaire. A preinvestigation was conducted before the questionnaire was formally sent out, and expert opinions were asked on whether the items in the questionnaire were reasonable, the factors were complete, and the expression was incorrect. The final questionnaire was formed after the questionnaire was revised. The questionnaire is mainly divided into two parts. The first part uses the Likert scale method to measure the buyer’s perception using CWR products. Scores from 1 to 5 represent different degrees of perception, in which the higher the score, the stronger degree of perception. The second part collects interviewees’ opinions and suggestions and the factors that they think influence purchasers’ use of recycled products.

2.3. Data Sources

The parameter assignment of the model simulation is determined by the expert scoring method, because there are many stakeholders and the influencing factors are complicated in CWR system. After scoring, the arithmetic average is calculated as an initial value of the corresponding index through regression analysis. In order to ensure the reliability and validity of the simulation results, the nonquantifiable indicators are standardized through a linear dimensionless processing method. The dimensionless standard functions are shown in Equations (17) and (18), respectively. The weights between various influencing factors are also determined by expert scoring method. Due to the limited space, we cannot repeat them here. Some results are shown in Table 2.
β i = 1 ;   α i   α min α max α i α max α min ; α min < α i < α max 0 ; α i   α max
β i = 1   ;   α i     α max α i α min α max α min ;   α min < α i < α max   0   ;   α i     α min
The data of research on the buyers’ willingness to use CWR products were obtained through questionnaire survey. The subjects of questionnaire mainly included construction enterprises, purchasers, other related enterprises, and personnel that use CWR products or similar products, as well as a small number of experts and scholars. The questionnaires were mainly distributed in two ways: offline paper questionnaires and online e-mails such as WeChat, QQ, and other forwarding channels. A total of 436 questionnaires were distributed and 436 were recovered. Thirty-nine questionnaires with missing items, inconsistent answers, and obvious rules were removed from the recovered questionnaires, and 397 questionnaires were effectively recovered, with an effective recovery rate of 91.1%. The specific data are shown in Table 3.

3. Results

3.1. Analysis on the Evolution of Construction Waste Recycling System

3.1.1. Simulation Results

The obtained data were substituted into the system dynamic equation, and the running trends of the four subsystems were analyzed by computer simulation, as shown in Figure 5.
Figure 5 shows that: (1) the administration effect of the government is on the rise in the initial stage. At this time, the policies have just been promulgated, and the attitudes of all participants in CWR system are more positive and the administration effect of the government is enhanced. However, with the interest conflicts and contradictions among various stakeholders gradually revealed, the government’s administrative effect was blocked and its growth became slow. In the later stage, with the government constantly strengthening top-level design, perfecting supporting system, and establishing an all-round and multi-level incentive mechanism for recycling products, the administration effect of the government has been continuously improved. (2) The technology supply capacity increased rapidly at the initial stage, and the growth became slow after reaching the level of 0.5. In the early stage, China helps to develop the CWR industry by drawing foreign technologies and management experiences. However, due to the differences in industrial structure, economic level, and population between China and foreign countries, the foreign management and technical experiences are not suitable actual situations for China, which requires the research and development of new technologies, and the application progress is slow. (3) In the initial stage, due to policy constraints, construction enterprises, resource enterprises, and scientific research institutions cooperate effectively and the utilization rate of recycled products is relatively high. However, with conflicts of interest and contradictions, the quality and price of recycled products are questioned by users, resulting in a low willingness to use recycled products, and the increase in utilization rate is not significant. (4) The favorable rate of recycled products increased rapidly at the initial stage under the influence of national policies, but due to the influence of technical level, price, and quality, the utilization rate of recycled products is relatively low, which in turn affect the public’s objective evaluation, resulting in the favorable rate basically not increasing at the later stage.

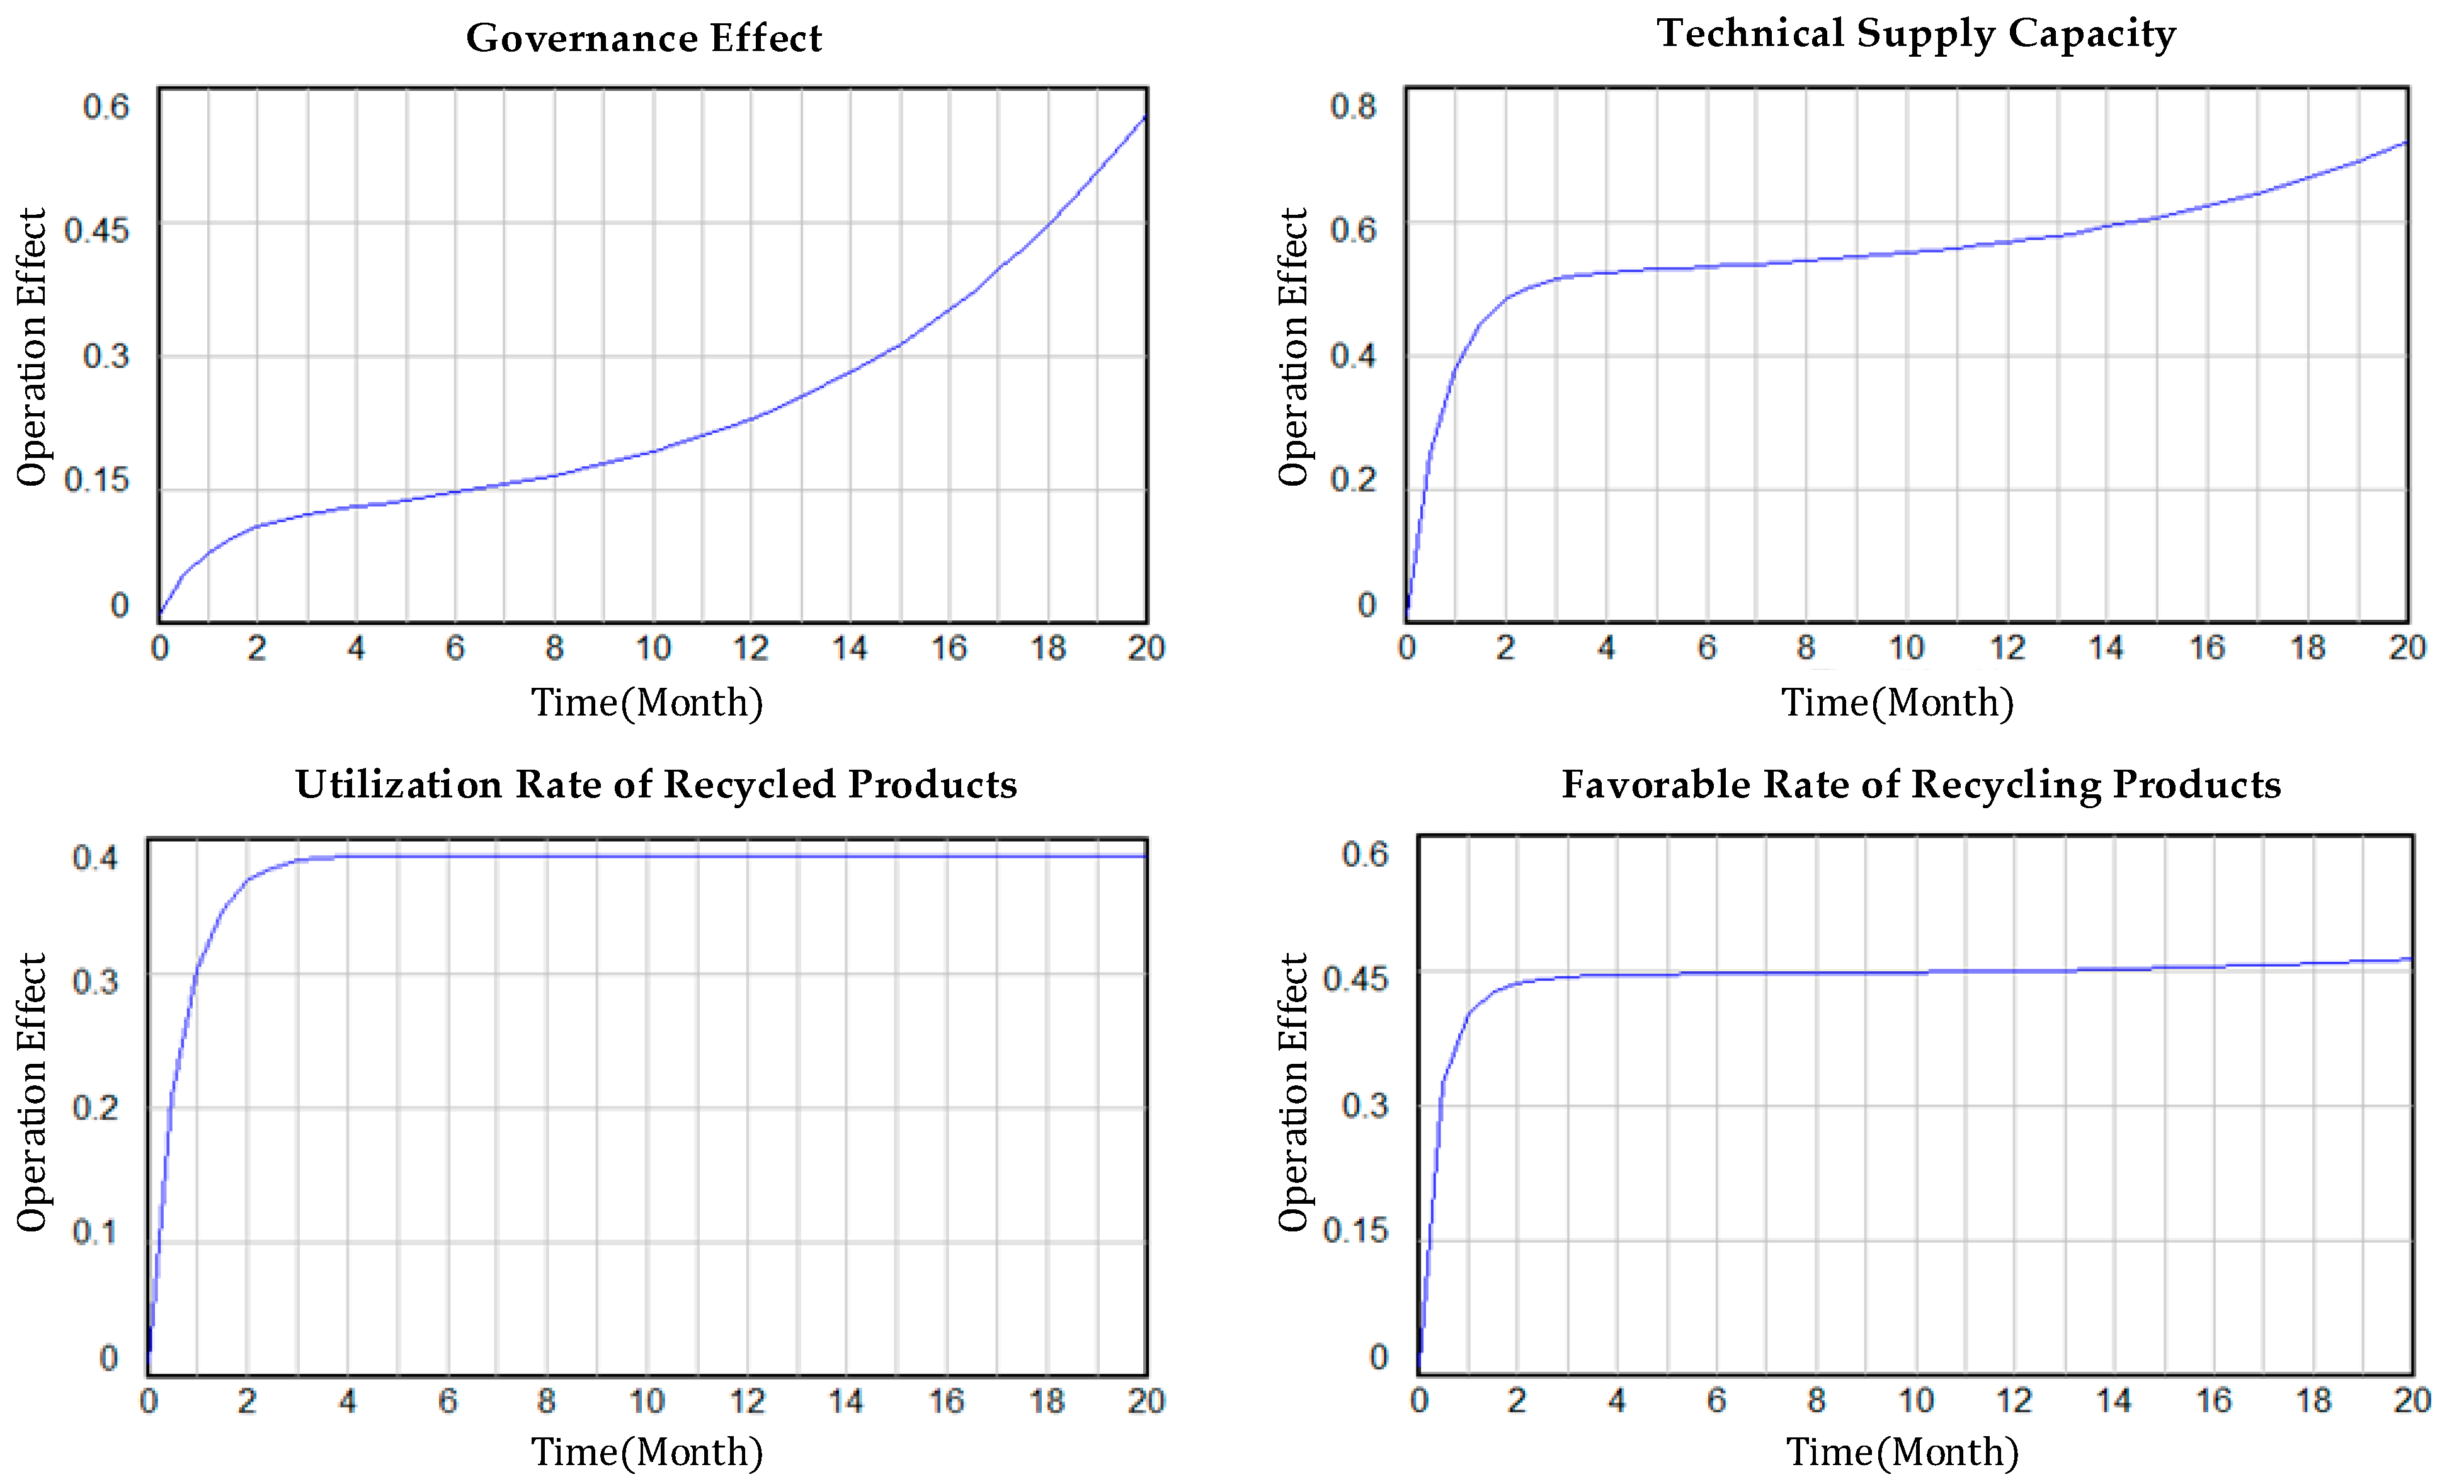
3.1.2. Comparative Analysis of Operation Trends of Each Subsystem

The high-speed operation of the CWR system depends on the better operation trend of each subsystem. It can be seen from the running trend diagram of each subsystem of the CWR system that although the effect of government administration was not very good at the beginning of the period, it was growing, and it grew rapidly in the later period. The technical supply capacity increased rapidly at the beginning of the period, and then the growth rate slowed down, but it also kept growing all the time. However, the utilization rate and good evaluation of recycled products of construction waste increased rapidly at the beginning of the period, and after a certain period of time, the growth rate was very slow. The utilization rate of recycled products was particularly significant, but its value was the smallest. Overall, the government’s administrative subsystem and resource technology supply subsystem run well, while the information feedback subsystem and utilization subsystem of recycled products run poorly, which are important subsystems that affect the efficient operation of the CWR system.

3.2. Model Test and Analysis of Willingness to Use Construction Waste Recycling Products

3.2.1. Descriptive Statistics

Through the statistics of the sample data, the basic information of the respondents on the willingness to use recycled products of construction waste is shown in Table 4.
According to Table 4, the men account for about 70%. This is in line with the characteristics of more men being in the construction industry. The respondents under 40 years old accounted for 73.6%, and the overall age was young. Most of them have bachelor’s degrees or above, accounting for 68.7%. There are many undergraduate degrees, and the working life is generally about five years. Their willingness to use recycled products of C&DW is representative and conforms to the research scope. Respondents do not know much about the recycling of C&DW and recycled products, but most of them agree and express their willingness to accept construction waste recycling products.
The data related to buyers’ willingness to use were statistically analyzed from four aspects: average, standard deviation, kurtosis, and skewness of each measurement item, and the specific data are shown in Table 5.
According to Table 5, the average value and standard deviation of the measurement items under each latent variable are relatively close, indicating that the data have a certain degree of stability and the sample collection is reasonable. The absolute value of measurement item skewness in the table is within 3. The absolute value of kurtosis is within 10. The sample tends to be normally distributed as a whole, and the next step of data analysis can be carried out.

3.2.2. Reliability and Validity Analysis

Reliability tests the stability and consistency of related variables in the test questionnaire. In this paper, Cronbach’s alpha coefficient is used to measure the reliability of each factor. Generally, the α coefficient is preferably above 0.8, and a range between 0.7–0.8 is acceptable. According to Table 6, it can be seen that the alpha coefficient value of each variable is greater than 0.8, and the total reliability coefficient is 0.959, indicating that the reliability of each variable of the model in this study is good and can be analyzed.
Validity reflects the degree to which the data reach the expected measurement result through a variety of measurement methods. Validity is divided into content validity and structure validity. The content validity is to measure whether the test has achieved the test purpose from the content of the test. Each measurement factor in this article is compiled based on a more mature scale, and experts are asked to make amendments. The content validity meets the research requirements. The test of construct validity is carried out from exploratory factor analysis and test factor analysis. During the test, it is found that the load of individual factors is small. In order to further refine the items of the common factors and improve the accuracy of the latent variables in the model analysis, according to the MI standard, some items are deleted and the test is performed again. In the confirmatory factor analysis results, the aggregate validity of each variable is measured by the extracted average variance (AVE) and combined reliability (CR). The standards are: AVE > 0.5, CR > 0.7. In the analysis results of this study, the KMO value is 0.945, and the average variance extraction (AVE) and combined reliability (CR) are all within the acceptable range. It shows that every potential variable has good validity. The specific results of each index are shown in Table 6.

3.2.3. Analysis of Model Fit

In structural equation model testing, there are many ways to estimate parameters. However, only when the model passes the fitness test can the next step of analysis be carried out. Under normal circumstances, some indicators are used to judge the degree of fit of the structural equation model, such as χ 2 / df (the ratio of chi-square degrees of freedom), CFI (comparative fit index), GFI (goodness of fit index), IFI (incremental fit index), TLI (Tucker–Lewis coefficient), NFI (Bentler-Bonett normed fix index), RMSEA (root mean square error of approximation), information index AIC, and so on. The specific fitting index standards and the fitting results of this study are shown in Table 7.
It can be seen from the data in Table 7 that most of the fitting indexes of the initial model calculation are acceptable; only χ 2 / df is not within the acceptable range, which is far from the ideal fitting index standard. After correcting the model by increasing the residual correlation path, all fitting indexes of the model are greatly improved. Among them, CFI, GFI, IFI, TLI, and NFI are all within the ideal range. χ 2 / df and RMSEA are also within the acceptable standard, and the overall agreement is good.

3.2.4. Path Analysis and Inspection

From the above analysis results, it can be seen that the fit of this research model is good, and path analysis can be carried out. This paper uses Amos 23 to test a structural equation model. At the same time, it is judged whether the research hypothesis passes the test through calculating the path coefficient between the latent variables. The data of each variable are imported into the model for calculation, and the test results are shown in Table 8.
In this paper, assuming that the regression coefficient is 0, the criterion for determining the critical ratio of C.R. is that its absolute value is greater than 1.96, and it is significant when the p value is less than 0.05. According to Table 8, the normalized path coefficient of perceived ease of use to perceived usefulness is 0.538, which indicates that Hypothesis 1 is correct. Perceived ease of use of resource-based recycled items is positively correlated with perceived usefulness. The normalized path coefficient of perceived usefulness on attitude toward use is 0.393, indicating that buyers’ perceived usefulness of resource-based recycled products influences their attitude toward use, and Hypothesis 3 is correct. The normalized path coefficient of subjective norms on usage attitudes is 0.487, indicating that purchasers’ subjective norms positively affect their usage attitudes, and Hypothesis 5 is true. The normalized path coefficient of behavioral intention on willingness to use is 1.053, indicating that purchasers’ behavioral intention influences their willingness to use positively, and Hypothesis 8 is true. The standardized path coefficient of perceived risk on attitude toward use is −0.234, indicating that buyers’ perceived riskiness of resource-based recycled products negatively affects their attitude toward use, and Hypothesis 9 is right. The standardized path coefficient of perceived riskiness on behavioral intention is −0.323, indicating that buyers’ perception of risk influences their purchasing behavior negatively, and Hypothesis 10 is true. The p value in H2 and H11 is less than 0.01 and greater than 0.001, and the absolute value of C.R is greater than 1.96, which is within the significant standard. Therefore, the above assumptions are all true. The absolute values of C.R. of H4 and H6 were both less than 1.96, and the p values were both greater than 0.05, which did not meet the standard and were not significant. The survey results show that only 11.5% of the respondents have a deep understanding of the utilization of C&DW.
As a result, most of the respondents cannot make accurate judgments on the usefulness of recycled products. Although a high level of cognition affects the attitude to use, it cannot directly affect the purchasers’ willingness to use it. As a result, Hypothesis H4 is not established. Subjective norms control the strength of behavioral intentions, and imperfect policies and systems also affect them. Although the government has issued relevant policies on the recycling of C&DW, in the specific implementation process, purchasers often first consider their own interests and do not respond to the policies actively. Bad market conditions also affect the behavioral intentions of purchasers. These may lead to Hypothesis H6 not being valid.

4. Discussion

Overall, this paper analyzes the operation trend of the government administration effect, technical supply, recycling product utilization, and information feedback subsystems, finding that the information feedback and utilization of recycling products of C&DW subsystems operate relatively poorly. The utilization and evaluation of recycled products are interconnected. Product utilization has a direct impact on the quantity of evaluation, which in turn affects the sales of the product. The promulgation and implementation of CWR-related policies have an important impact on source reduction, resource utilization, and harmless treatment of C&DW. Scientific and technological innovation is critical to the economy and development.
The transformation of C&DW into various reusable products through advanced technology and sophisticated equipment can not only improve the utilization rate of natural resources, but also reduce environmental pollution and achieve sustainable social development. Therefore, it is urgent to strengthen the publicity of CWR, use science and technology to improve the technical level of C&DW, and increase the utilization rate of recycled products and the praise rate, so as to promote an efficient operation of the CWR system.
As an important participant in the recycling of C&DW, purchasers’ willingness to use has an important impact on the use and development of recycled products. In this paper, a theoretical research model of purchasers’ willingness to recycle C&DW products is constructed. The intention of purchasers to use recycled products is empirically studied, and the influence of various factors on purchasers’ behavior is clarified, so as to provide theoretical support for the use and development of recycled products. In the perspective of behavioral decision making, the purchasers’ perceived ease of use, perceived usefulness, perceived risk, behavioral intention, and attitude to use can directly or indirectly affect their willingness to use. In terms of external influences, the government’s policy effectiveness and social environment will also affect the purchasers’ willingness to use. All participants involved in CWR consider their own interests when making decisions. The perceived interests of buyers directly affect their behaviors, and their perceptions of the usefulness, ease of use, and risk of recycled products are based on their own interests. Therefore, when buyers choose to use recycled products, they should not only consider meeting their own needs, but also reduce economic risks. Their behavioral willingness is mainly influenced by interests, and there are specific interest-influencing mechanisms to be further investigated.

5. Conclusions

This study divides the CWR system into four subsystems: government administration effect, technology supply, utilization of recycled products, and information feedback. The system dynamics theory is used to establish a model, and a computer simulation is used to analyze and study the operation trend of each subsystem of the CWR system. Based on the technology acceptance model and the planning behavior theory, a structural equation model is constructed, the purchaser’s willingness to use CWR products is studied, and the following conclusions are obtained:
(1)
The low utilization rate and positive evaluation rate of recycled products are important factors affecting the development of resource utilization. Among the four subsystems of CWR, the technical supply subsystem is a good running trend, followed by the government administration subsystem, while the information feedback subsystem and utilization subsystem of recycled products operate relatively poorly.
(2)
The purchasers’ perceived usability of recycled products of C&DW is positively correlated with perceived usefulness, and their perceived usefulness, subjective norms, and attitudes towards use are all positively correlated, with the influence of subjective norms being more significant.
(3)
The purchasers’ perceived risk is negatively correlated with their attitude, behavioral intention, and willingness to use, with a more significant negative effect on attitude to use and behavioral intention. Their attitude towards use is positively correlated with behavioral intention, which in turn positively affects willingness to use.
This study can provide guidance for the behavioral decisions of various stakeholders in CWR. There are a number of suggestions for the government to promote the development of CWR. The government should speed up the development of standards and norms for recycled products, strengthen supervision and quality management, and provide avenues for information exchange through the establishment of an information technology platform. In addition, it is necessary to intensify publicity, strive to popularize the concept of recycling construction waste, improve the perceived value of recycled products, and strive to eliminate public doubts.
There are some limitations to the study. The relationships of all parties involved in the CWR system are complicated, and their running rules are messy, making it difficult to describe all the relationships completely. Some parameters are determined through expert scoring, in which inevitably exists a certain degree of subjectivity. The choice of variables in the model of CWR products’ willingness to use may not be comprehensive enough, lacking consideration of factors such as the psychological expectations of buyers and the influence of the social environment. In the future, we can explore the intricate relationships among the relevant stakeholders involved in CWR, consider more thoroughly the factors influencing the willingness to use recycled products, and conduct an in-depth study in combination with the specific interest-influencing mechanism.

Author Contributions

Conceptualization, Y.W. and H.L.; methodology, Y.W.; software, H.L.; validation, Y.W., L.X. and H.L.; formal analysis, H.L. and L.X.; investigation, H.L.; resources, Y.W.; data curation, Y.W. and W.G.; writing—original draft preparation, Y.W., L.X. and H.L; writing—review and editing, Y.W., L.X. and W.G.; visualization, Y.W.; supervision, Y.W. and W.G.; project administration, Y.W.; funding acquisition, Y.W. All authors have read and agreed to the published version of the manuscript.

Funding

The Philosophy and Social Science Innovation Team of Colleges in Henan Province (2023-CXTD-06), the Annual Project of Philosophy and Social Sciences Planning of Henan Province (2022BZH004) in 2022, the Key R&D and Promotion Project of Henan Province (Soft Science Research) (212400410070) in 2021 and the Postdoctoral Research Project of Henan Province (2021-281) in 2021.

Institutional Review Board Statement

Not applicable.

Informed Consent Statement

Not applicable.

Data Availability Statement

Not applicable.

Conflicts of Interest

The authors declare no conflict of interest.

References

  1. Yan, H.D.; Feng, J.C.; Zhu, H. Application and Controversy on Concession Mode in Construction and DemolitionWaste Recycling Projects: Based on the Practical Enlightenment of Jiangsu Province. Chin. J. Environ. Manag. 2022, 14, 109–115. [Google Scholar]
  2. Anon. National Development and Reform Commission studies and deploys the implementation of the “14th Five-Year Plan for Circular Economy Development”. Recycl. Resour. Circ. Econ. 2021, 14, 11. [Google Scholar]
  3. Xu, Y.B.; Li, Y.; Fan, B. Discussion on the payment mechanism of construction waste resource utilization. Green Build. Mater. 2020, 175–177. [Google Scholar] [CrossRef]
  4. Li, Q.; Shen, L.; Chen, Q.Y. Literature review of construction waste resource utilization based on circular economy. Eng. Econ. 2020, 30, 68–72. [Google Scholar]
  5. Lei, D.; Ying, B.F.; Wei, L.; Ling, K.K.; Zhi, Y. Evolutionary game analysis of stakeholders’ decision-making behaviours in construction and demolition waste management. Environ. Impact Assess. Rev. 2020, 84, 106408. [Google Scholar]
  6. Li, M.; Lu, Z. Evolutionary game analysis of construction waste recycling management in China. Resour. Conserv. Recycl. 2020, 161, 104863. [Google Scholar]
  7. Ding, Z.K.; Wang, Y.F.; Wu, J.C. Simulation of Smart City Construction Waste Management System Based on ABMS. J. Civ. Eng. Manag. 2016, 33, 40–46. [Google Scholar]
  8. Cui, C.; Ren, F.M.; Hu, S.X.; Jia, J.M.; Ma, L.; Si, H.; Lu, T.; Liu, J.S. Environmental pollution risk assessment of construction waste and its recycled products in Shangqiu. Environ. Eng. 2022, 1–10. [Google Scholar] [CrossRef]
  9. Shi, S.Y.; Hu, M.M.; Zhang, J.S. Pressure-State-Response Model for Comprehensive Benefit Evaluation of Construction Waste Recycling. Eng. Res. Eng. Interdiscip. Perspect. 2017, 9, 616–627. [Google Scholar]
  10. Wang, C.; Chen, X.X.; Zhang, F.S. Method of Converting Construction Waste into Arsenic Adsorbent and Its Adsorption Performance. J. Environ. Eng. 2017, 11, 4251–4257. [Google Scholar]
  11. Ding, Z.K.; Zhang, Z.Y.; Chen, W.L. The Influence of Media in Purchasing Decisions for Recycled Construction and Demolition Waste Products: An Functional Near Infrared Spectroscopy Study. Front. Neurosci. 2022, 16, 881537. [Google Scholar] [CrossRef] [PubMed]
  12. Ding, Z.; Nie, W.; Wu, H. Investigating the connection between stakeholders’ purchase intention and perceived value of construction and demolition waste recycled products. Environ. Dev. Sustain. 2022, 24, 9285–9303. [Google Scholar] [CrossRef]
  13. Ye, X.S.; Shi, S.Y. Research on resource utilization of construction waste based on stakeholder theory. Constr. Econ. 2014, 101–106. [Google Scholar] [CrossRef]
  14. Brian, H.W.G.; Yang, M.G.; Karen, L.X.W. A system dynamics view of a behavior-based safety program in the construction industry. Saf. Sci. 2018, 104, 202–215. [Google Scholar]
  15. Lian, F.Z.; Ai, X.W.; Hong, J.W.; Lei, M.W. Representation of batch settling via fitting a logistic function. Miner. Eng. 2018, 128, 160–167. [Google Scholar]
  16. Davis, F.D. Perceived Usefulness, Perceived Ease of Use, and User Acceptance of Information Technology. MIS Q. 1989, 13, 318–340. [Google Scholar] [CrossRef] [Green Version]
  17. Tsai, H.T.; Chien, J.L.; Tsai, M.T. The influences of system usability and user satisfaction on continued Internet banking services usage intention: Empirical evidence from Taiwan. Electron. Commer. Res. 2014, 14, 137–169. [Google Scholar] [CrossRef]
  18. Viswanath, V.; Michael, G.M.; Gordon, B.D.; Fred, D.D. User Acceptance of Information Technology: Toward a Unified View. MIS Q. 2003, 27, 425–478. [Google Scholar]
  19. Warsame, M.H.; Ireri, E.M. Does the theory of planed behavior (TPB) matter in Sukuk investment decisions? J. Behav. Exp. Financ. 2016, 12, 93–100. [Google Scholar] [CrossRef]
  20. Bauer, R.A. Consumer Behavior as Risk Taking: Dynamic Marketing for a Changing World. In Proceedings of the 43rd National Conference of the American Marketing Assocation, Chicago, IL, USA, 15–17 June 1960; American Marketing Association: Chicago, IL, USA, 1960; pp. 389–398. [Google Scholar]
  21. Zhang, L.J. Research on the impact of product recall on consumer shopping behavior based on perceived risk. Mod. Mark. 2019, 84–85. [Google Scholar] [CrossRef]
  22. Li, A.Q.; Li, X.T. Research on farmers’ willingness and behavior of agricultural waste recycling based on the theory of planned behavior—taking crop straw recycling as an example. Arid. Land Resour. Environ. 2019, 33, 33–40. [Google Scholar]
  23. Francisco, J.M.; Antonio, C.; Sergio, R. Academic entrepreneurship in Spanish universities: An analysis of the determinants of entrepreneurial intention. Eur. Res. Manag. Bus. Econ. 2017, 23, 113–122. [Google Scholar]
  24. Joshua, P.; Laurens, R.; Jan, V.D.; Wolfgang, K. Preferences for car sharing services: Effects of instrumental attributes and psychological ownership. J. Environ. Psychol. 2017, 53, 121–130. [Google Scholar]
  25. Shi, S.Y.; Hu, M.M. Study on the decision-making behavior intention of project managers in waste classification under the background of no-waste city—based on the theoretical framework of planning behavior. Arid. Land Resour. Environ. 2020, 34, 22–26. [Google Scholar]
  26. Yong, H.A.; Young, H.K.; Sung, J.S. Contractors’ Transformation Strategies for Adopting Building Information Modeling. J. Manag. Eng. 2015, 32, 05015005. [Google Scholar]
  27. Justin, P.; Ashwin, M.; Jayesh, P. Predicting green product consumption using theory of planned behavior and reasoned action. J. Retail. Consum. Serv. 2016, 29, 123–134. [Google Scholar]
  28. Anita, K. Exploring young adults’ e-waste recycling behaviour using an extended theory of planned behaviour model: A cross-cultural study. Resour. Conserv. Recycl. 2019, 141, 378–389. [Google Scholar]
  29. Chen, S.Y. Using the sustainable modified TAM and TPB to analyze the effects of perceived green value on loyalty to a public bike system. Transp. Res. Part A 2016, 88, 58–72. [Google Scholar] [CrossRef]
  30. Shi, J.A.; Si, H.Y.; Wu, G.D.; Wang, H.M. Study on the willingness to use urban transportation sharing products from the perspective of sustainable development. China Popul. Resour. Environ. 2018, 28, 63–72. [Google Scholar]
  31. Hong, Y.S.; Jian-gang, S.; Dai, Z.T.; Guang, D.W.; Jing, L. Understanding intention and behavior toward sustainable usage of bike sharing by extending the theory of planned behavior. Resour. Conserv. Recycl. 2020, 152, 104513. [Google Scholar]
  32. Yang, R.X.; Zhang, M.J. Research on the risk perception factors of WeChat users. Mod. Inf. 2016, 6, 94–97. [Google Scholar]
  33. Liébana-Cabanillas, F.; Muñoz-Leiva, F.; Sánchez-Fernández, J. The impact of risk on the technological acceptance of mobile payment services. Glob. Bus. Perspect. 2013, 1, 309–328. [Google Scholar] [CrossRef] [Green Version]
  34. Lu, Z.; Da, Y.L.; Cui, C.C.; Sen, H.H. The influence of greenwashing perception on green purchasing intentions: The mediating role of green word-of-mouth and moderating role of green concern. J. Clean. Prod. 2018, 187, 740–750. [Google Scholar]
  35. Theresa, M.R.; Cristopher, S.K. Bridge the gap: Consumers’ purchase intention and behavior regarding sustainable clothing. J. Clean. Prod. 2021, 278, 123882–123897. [Google Scholar]
  36. Chen, C.F.; Chao, W.H. Habitual or reasoned? Using the theory of planned behavior, technology acceptance model, and habit to examine switching intentions toward public transit. Transp. Res. Part F Psychol. Behav. 2011, 14, 128–137. [Google Scholar] [CrossRef]
  37. Lee, M.C. Factors influencing the adoption of internet banking:an integration of TAM and TPB with perceived risk and perceived benefit. Electron. Commer. Res. Appl. 2009, 8, 130–141. [Google Scholar] [CrossRef]
  38. Zhu, D.J. Sustainability Science: An Analysis Model Based on Object-Process-Subject. China Popul. Resour. Environ. 2016, 26, 1–9. [Google Scholar]
  39. Jokar, N.K.; Noorhosseini, S.A.; Allahyari, M.S. Consumers’ acceptance of medicinal herbs: An application of the technology acceptance model (TAM). J. Ethno Pharmacol. 2017, 207, 203–210. [Google Scholar] [CrossRef]
  40. Fethi, C.; Ferah, C. The relation of interface usability characteristics, perceived usefulness, and perceived ease of use to end-user satisfaction with enterprise resource planning (ERP) systems. Comput. Hum. Behav. 2003, 20, 505–515. [Google Scholar]
Figure 1. Structural analysis framework of construction waste recycling system.
Sustainability 14 12541 g001
Figure 2. Overall causality diagram of construction waste recycling system.
Sustainability 14 12541 g002
Figure 3. Dynamic model of construction waste recycling system.
Sustainability 14 12541 g003
Figure 4. Theoretical research model.
Sustainability 14 12541 g004
Figure 5. The operation trend of each link of the construction waste recycling system.
Sustainability 14 12541 g005
Table 1. Measurement scale of each variable.
VariablesSources
Usage intention (UI)
  • Compared with other products, I am more willing to use recycling products of C&DW
  • I am willing to insist on using recycling products of C&DW
  • I would like to recommend the use of recycling products of C&DW to people around me
Venkatesh [18]
Davis [16]
Li Aoqun et al. [22]
Behavioral intention (BI)
  • When choosing products to use, I will first consider recycling products of C&DW
  • Even if few people use recycling products from C&DW, I will use them
  • I think it is a fashion to use recycling products from C&DW
  • I will use the recycling products of C&DW under the recommendation or requirement of others
Warsame [19]
Miranda [23]
Paundra [24]
Shi Shiying et al. [25]
Attitude toward using (AI)
  • It is a wise choice to use recycling products of C&DW
  • I am happy to use recycling products of C&DW
  • I think there are a lot of benefits to using recyclable products from C&DW
  • I think the recycling products of construction waste are some good products
Ahn Y H [26]
Paul J et al. [27]
Shi Shiying et al. [26]
Kumar [28]
Subjective norm (SN)
  • I am very satisfied with the use effect of recycling products of C&DW
  • I think the recognition of recycling products of C&DW is relatively high
  • CWR products are being vigorously promoted by the government
  • I think the production technology of recycling products of C&DW has been very mature
  • I am very clear about the technical production of recycling products of C&DW
  • I am very clear about the use of recycling products of C&DW
Chen [29]
Shi Jiangang et al. [30]
Li Aoqun et al. [22]
Davis [16]
Si et al. [31]
Perceived risk (PR)
  • The price of CWR will be very high
  • The use of recycling products from C&DW will cause financial losses
  • I am worried about the quality of recycling products of C&DW
  • There are hidden safety risks in the construction projects using recycling products of C&DW
Yang ruixian et al. [32]
Cabanillas [33]
Zhang et al. [34]
Theresa et al. [35]
Perceived usefulness (PU)
  • The use of recycling products of C&DW can help me solve some problems that other products cannot solve
  • I think the use of recycling products of C&DW is of great help to save resources
  • I think the use of recycling products of C&DW is of great help to protect the environment
  • I think the use of recycling products of C&DW is of great help to the construction of “waste-free city”
  • I think the use of recycling products of C&DW is of great help to the sustainable development of society
Davis [16]
Chen [36]
Lee [37]
Zhu D J [38]
Kumar [28]
Perceived ease of use (PE)
  • CWR products are easy to buy
  • The recycling products of C&DW are very convenient to use
  • The use of recycling products of C&DW can easily help me achieve the desired effect
Jokar [39]
Calisir [40]
Davis [16]
Kumar [28]
Table 2. The initial value assignment table of the main variables in the system dynamics flow diagram.
Variable NamesInitial ValueVariable NamesInitial Value
Social environment1Policy restraint0.4
Research environment0.75Bad social environment0.2
Market environment0.7Power of work0.6
Policy support0.9The salary0.8
Innovation investment0.63Technical support0.72
Propaganda and education0.6Level of market competition0.17
Public Opinion0.34Resource saving0.79
Scientific and technological progress0.86Social progress0.74
Table 3. Statistical table of questionnaire on the willingness to use recycled products of C&DW.
Questionnaire
Distribution Form
Quantity Issued
(Copies)
Proportion of the Total
Questionnaire (%)
Effective Quantity
(Copies)
Recovery Rate (%)
Paper10030%8484%
Network33670%31393.2%
Sum total436100%39791.1%
Table 4. Basic information distribution of interviewed persons.
Information CategoryFrequencyPercentage (%)
GenderMen 28571.7%
Women11228.3%
Age18–30 years old17343.6%
31–40 years old11930.0%
41–50 years old9223.1%
Above 50 years old133.3%
Education backgroundHigh school and below399.9%
College for professional training8521.4%
Undergraduate course20852.4%
Bachelor’s degree or above6516.3%
Working yearsLess than 3 years4110.3%
3–5 years22757.2%
6–10 years7518.9%
More than 10 years5413.6%
Table 5. Descriptive statistics of willingness to use.
MinimumMaximumMeanStandard DeviationSkewnessKurtosis
StatStatStatStatStatStandard ErrorsStatStandard Errors
PE11.005.003.33000.83752−0.3470.1220.6700.244
PE21.005.003.49370.70215−0.1100.1220.7780.244
PE31.005.003.49370.71286−0.0410.1220.7060.244
PU11.005.003.68260.80405−0.1250.1220.1230.244
PU21.005.003.95210.81664−0.4710.1220.3090.244
PU31.005.004.03270.80806−0.5500.1220.2740.244
PU41.005.003.98240.79276−0.6410.1221.0250.244
PU51.005.003.99240.79293−0.5970.1220.7480.244
PR11.005.003.70780.91025−0.2780.122−0.4290.244
PR21.005.003.51891.01393−0.3440.122−0.4890.244
PR31.005.003.61210.92423−0.1770.122−0.4580.244
PR41.005.003.56170.92624−0.2100.122−0.4650.244
SN11.005.003.65990.824340.2140.122−0.5180.244
SN21.005.003.49120.866340.0160.122−0.2200.244
SN31.005.003.57680.84821−0.0670.122−0.1220.244
SN41.005.003.41060.94023−0.0420.122−0.3000.244
SN51.005.003.48360.90334−0.0540.122−0.3150.244
SN61.005.003.48110.92538−0.0980.122−0.4290.244
AT11.005.003.77080.73879−0.0230.122−0.0580.244
AT21.005.003.75060.728760.0290.122−0.0460.244
AT32.005.003.77580.750500.0330.122−0.6010.244
AT41.005.003.75310.734790.0790.122−0.3620.244
BI12.005.003.69520.791560.0770.122−0.6350.244
BI21.005.003.68010.779100.1110.122−0.4360.244
BI31.005.003.68770.81537−0.2960.1220.3480.244
BI41.005.003.78590.75009−0.0600.122−0.0880.244
UI11.005.003.64230.833650.0680.122−0.5470.244
UI21.005.003.73300.784470.0360.122−0.4710.244
UI31.005.003.80600.76881−0.1890.1220.1570.244
Table 6. Test results of reliability and validity of measured variables.
VariablesReliability Coefficients α AVECR
Usage intention (UI)0.9160.7370.894
Behavioral intention (BI)0.9220.7050.877
Attitude toward using (AT)0.9100.6750.862
Subjective norm (SN)0.9150.5760.803
Perceived risk (PR)0.8970.6430.844
Perceived usefulness (PU)0.9530.7390.919
Perceived ease of use (PE)0.8830.6690.858
Table 7. Calculation results of model fitting index.
Fit Indices χ 2 / d f CFIGFIIFITLINFIRMSEAAICBCC
Ideal standards<2≥0.9≥0.9≥0.9≥0.9≥0.9<0.05The smaller the betterThe smaller the better
Acceptance criteria<3≥0.8≥0.8≥0.8≥0.8≥0.8<0.08The smaller the betterThe smaller the better
Initial model3.4740.9360.9000.9360.9270.9130.079700.000749.189
Final model2.6210.9650.9330.9650.9580.9450.064500.000583.914
Table 8. Path coefficient estimation results.
HypothesisPathNormalized Path CoefficientS.EC.Rp
H1Perceived usefulness ← Perceived ease of use0.5830.0609.720***
H2Attitude toward using ← Perceived ease of use0.1560.0602.617**
H3Attitude toward using ← Perceived usefulness0.3930.03910.163***
H4Behavioral intention ← Perceived usefulness−0.0710.038−1.8670.062
H5Attitude toward using ← Subjective norm0.4870.0598.259***
H6Behavioral intention ← Subjective norm0.0150.0550.2690.788
H7Behavioral intention ← Attitude toward using0.7590.06311.003***
H8Usage intention ← Behavioral intention1.0530.07314.479***
H9Attitude toward using ← Perceived risk−0.2340.060−3.87***
H10Behavioral intention ← Perceived risk−0.3230.050−6.442***
Note: *** means significant at the 0.001 level, ** means significant at the 0.01 level.
Publisher’s Note: MDPI stays neutral with regard to jurisdictional claims in published maps and institutional affiliations.

