Article

Agent-Based Modelling in Visitor Management of Protected Areas

Faculty of Informatics and Management, University of Hradec Králové, 50003 Hradec Kralove, Czech Republic
*
Author to whom correspondence should be addressed.
Sustainability 2022, 14(19), 12490; https://doi.org/10.3390/su141912490
Submission received: 30 August 2022 / Revised: 21 September 2022 / Accepted: 28 September 2022 / Published: 30 September 2022

Abstract

:
The research was motivated by the growing importance of visitor management in protected areas, which can be based on knowledge management, system modelling of processes and phenomena, and a deeper knowledge of the experience of visitors in connection with the concept of psychological carrying capacity. The work builds on previous publications and research by the authors, focused on the optimization of tourism impacts, visitor management and the development of the theory and applicability of the concept of carrying capacity. It emphasizes the overview analysis of the possibilities of using agent-based modelling and visualization of visitor flows in protected areas. The analysis of suitable sources was based on the PRISMA method, which showed the main research directions for the use of the agent-based approach in visitor management. For the practical application of modelling, the NetLogo environment was chosen, in which the visitor flows of the model area were simulated. The visitor attendance was evaluated in relation to the psychological carrying capacity. Subsequently, visitor management measures were implemented in the model, and repeated simulations of visitor attendance, based on monitored flows, were run for a specific location around Oheb Castle (the Železné hory/Iron Mountains, Bohemia). The main result is the innovative use of agent-based modelling in visitor management in the context of visitor experience, visitor satisfaction and psychological carrying capacity. The contribution of the presented research is also the proposal of future research directions for more accurate use of psychological carrying capacity in visitor management.

1. Introduction

A significant trend in recent years has been the quantitative and qualitive (new forms of activities) tourism development in protected areas and the increase in the rarity of protected areas with the growth of their popularity as tourism destinations. Tourism research has undergone rapid development in recent years in describing, monitoring, causal analysis, understanding patterns, and predicting tourism impacts [1,2]. The optimization of tourism impacts, which is particularly important in protected areas, is increasingly associated with the social responsibility of different tourism actors [3,4,5,6] and, in addition to “classic”, established approaches (e.g., [7]), with new approaches and methodologies and new techniques [2]. The mutual conceptual relationship between different aspects of tourism impacts is illustrated in the mind map in Figure 1, emphasizing the importance of the modelling, prediction and optimization of tourism impacts. The trends in research and the application of its findings in the tourism industry are highlighted in the mind map. In the future, emphasis will be placed especially on the approach of optimizing tourism impacts [1,7], dynamism of the concept of the carrying capacity of the destination for visitors [8], the social responsibility of tourism actors [3,4,5,6] and procedures based on dynamic knowledge of processes and their impacts [8,9].
The optimization of tourism impacts in protected areas is closely related to the appropriate quality of visitor management, which is an important part of destination management [2,8,9,12]. Visitor management in protected areas uses various approaches [13], in particular:
  • proactive tourism planning [12,14]
  • spatio-temporal zoning of the territory in relation to tourism (e.g., [8,12,14]),
  • monitoring, modelling and forecasting visitor flows, motivation, behaviour and impacts of visitors [2,12,14,15,16,17,18,19,20,21,22,23,24]
  • concept of visiting limitations to the area [14] in the frame of tourism-carrying capacity [1,8,25,26,27] and/or limits of acceptable changes (LAC; [1,8,12,28,29]), including various visitor management models [30] and considering different distributions of visitor pressure on the tourism carrying capacity of the territory [31]
  • preserving the visitor experience with an emphasis on its multi-component character [32]; this approach is the basis of some visitor management models [14] and a measure of the success of visitor management [33]
  • the establishment of visiting rules in connection with the appropriate development of the visitor infrastructure (type and conduct of trails, viewpoints, visitor centres, etc.; [12,14]), and informing visitors and interpreting local heritage [34]
  • modelling and predicting tourism-activated processes and changes in ecosystems, cultural and “tourism visiting space” in protected areas [17,30,35,36,37,38,39]
Tourism visiting space refers to all processes and changes associated with visiting protected areas, including visitor flows and the mental space (perceptual and cognitive maps, the environmental bubble [3] etc.) of all visitors to the area. Computational social science approaches are applicable to the modelling and subsequent prediction and optimization of qualitative and quantitative aspects of various phenomena in tourism, such as tourism infrastructure in protected areas [40,41], tourism flows [30,42], the spatial distribution of visitors, spatio-temporal curves of visitor behaviour [30] or the impacts of tourism, including their relation to tourism-carrying capacity or the application of the LAC (Limits of Acceptable Change) concept.
Our paper deals with these approaches, namely the agent-based simulation (see the systemic overview of applications in tourism in Amelung et al. [43]) of the spatio-temporal distribution and behaviour of tourism actors in relation to the multidimensional concept of carrying capacity [1,9,22,27,44,45,46,47] and the dynamic concept of carrying capacity [27,48] with an emphasis on psychological/social carrying capacity. Predictive approaches and those of the interactive influencing spatio-temporal distribution of visitors and their psychological and behavioural changes using the system approach, information and communication technologies (ICT) and artificial intelligence are of increasing significance for visitor management, as discussed in the paper.
Although various studies have been published on the psychological carrying capacity of destination visitors (e.g., [8,49,50,51,52,53,54,55]), a deeper understanding of the nature of the process of exceeding psychological carrying capacity in relation to the number of additional visitors and their spatial and temporal distribution is lacking. The research presented in this article focuses on this research gap. By simulating the movement of individual visitors with the use of agents, the present paper provides a deeper understanding of the variability in the impact of visitor flows on the perception of a particular visitor, describes this disturbance and, in conjunction with further research, as proposed in the conclusion, provides a theoretical and practical basis for understanding psychological carrying capacity. The intention of the present paper is to provide an analytical description of the variability in the impact of visitor flows on the perception of a particular visitor by simulating the movement of individual visitors using agent-based social simulation. In relation to the proposed further research, this paper aims to provide a theoretical and practical basis for a deeper understanding of psychological carrying capacity. The research conducted would be guided by the following research questions:
Q1: How can psychological carrying capacity in protected areas be explored by means of agent-based social simulation?
Q2: What can be the benefit of agent-based social simulations in the visitor management of protected areas in relation to psychological carrying capacity?

2. Literature Review

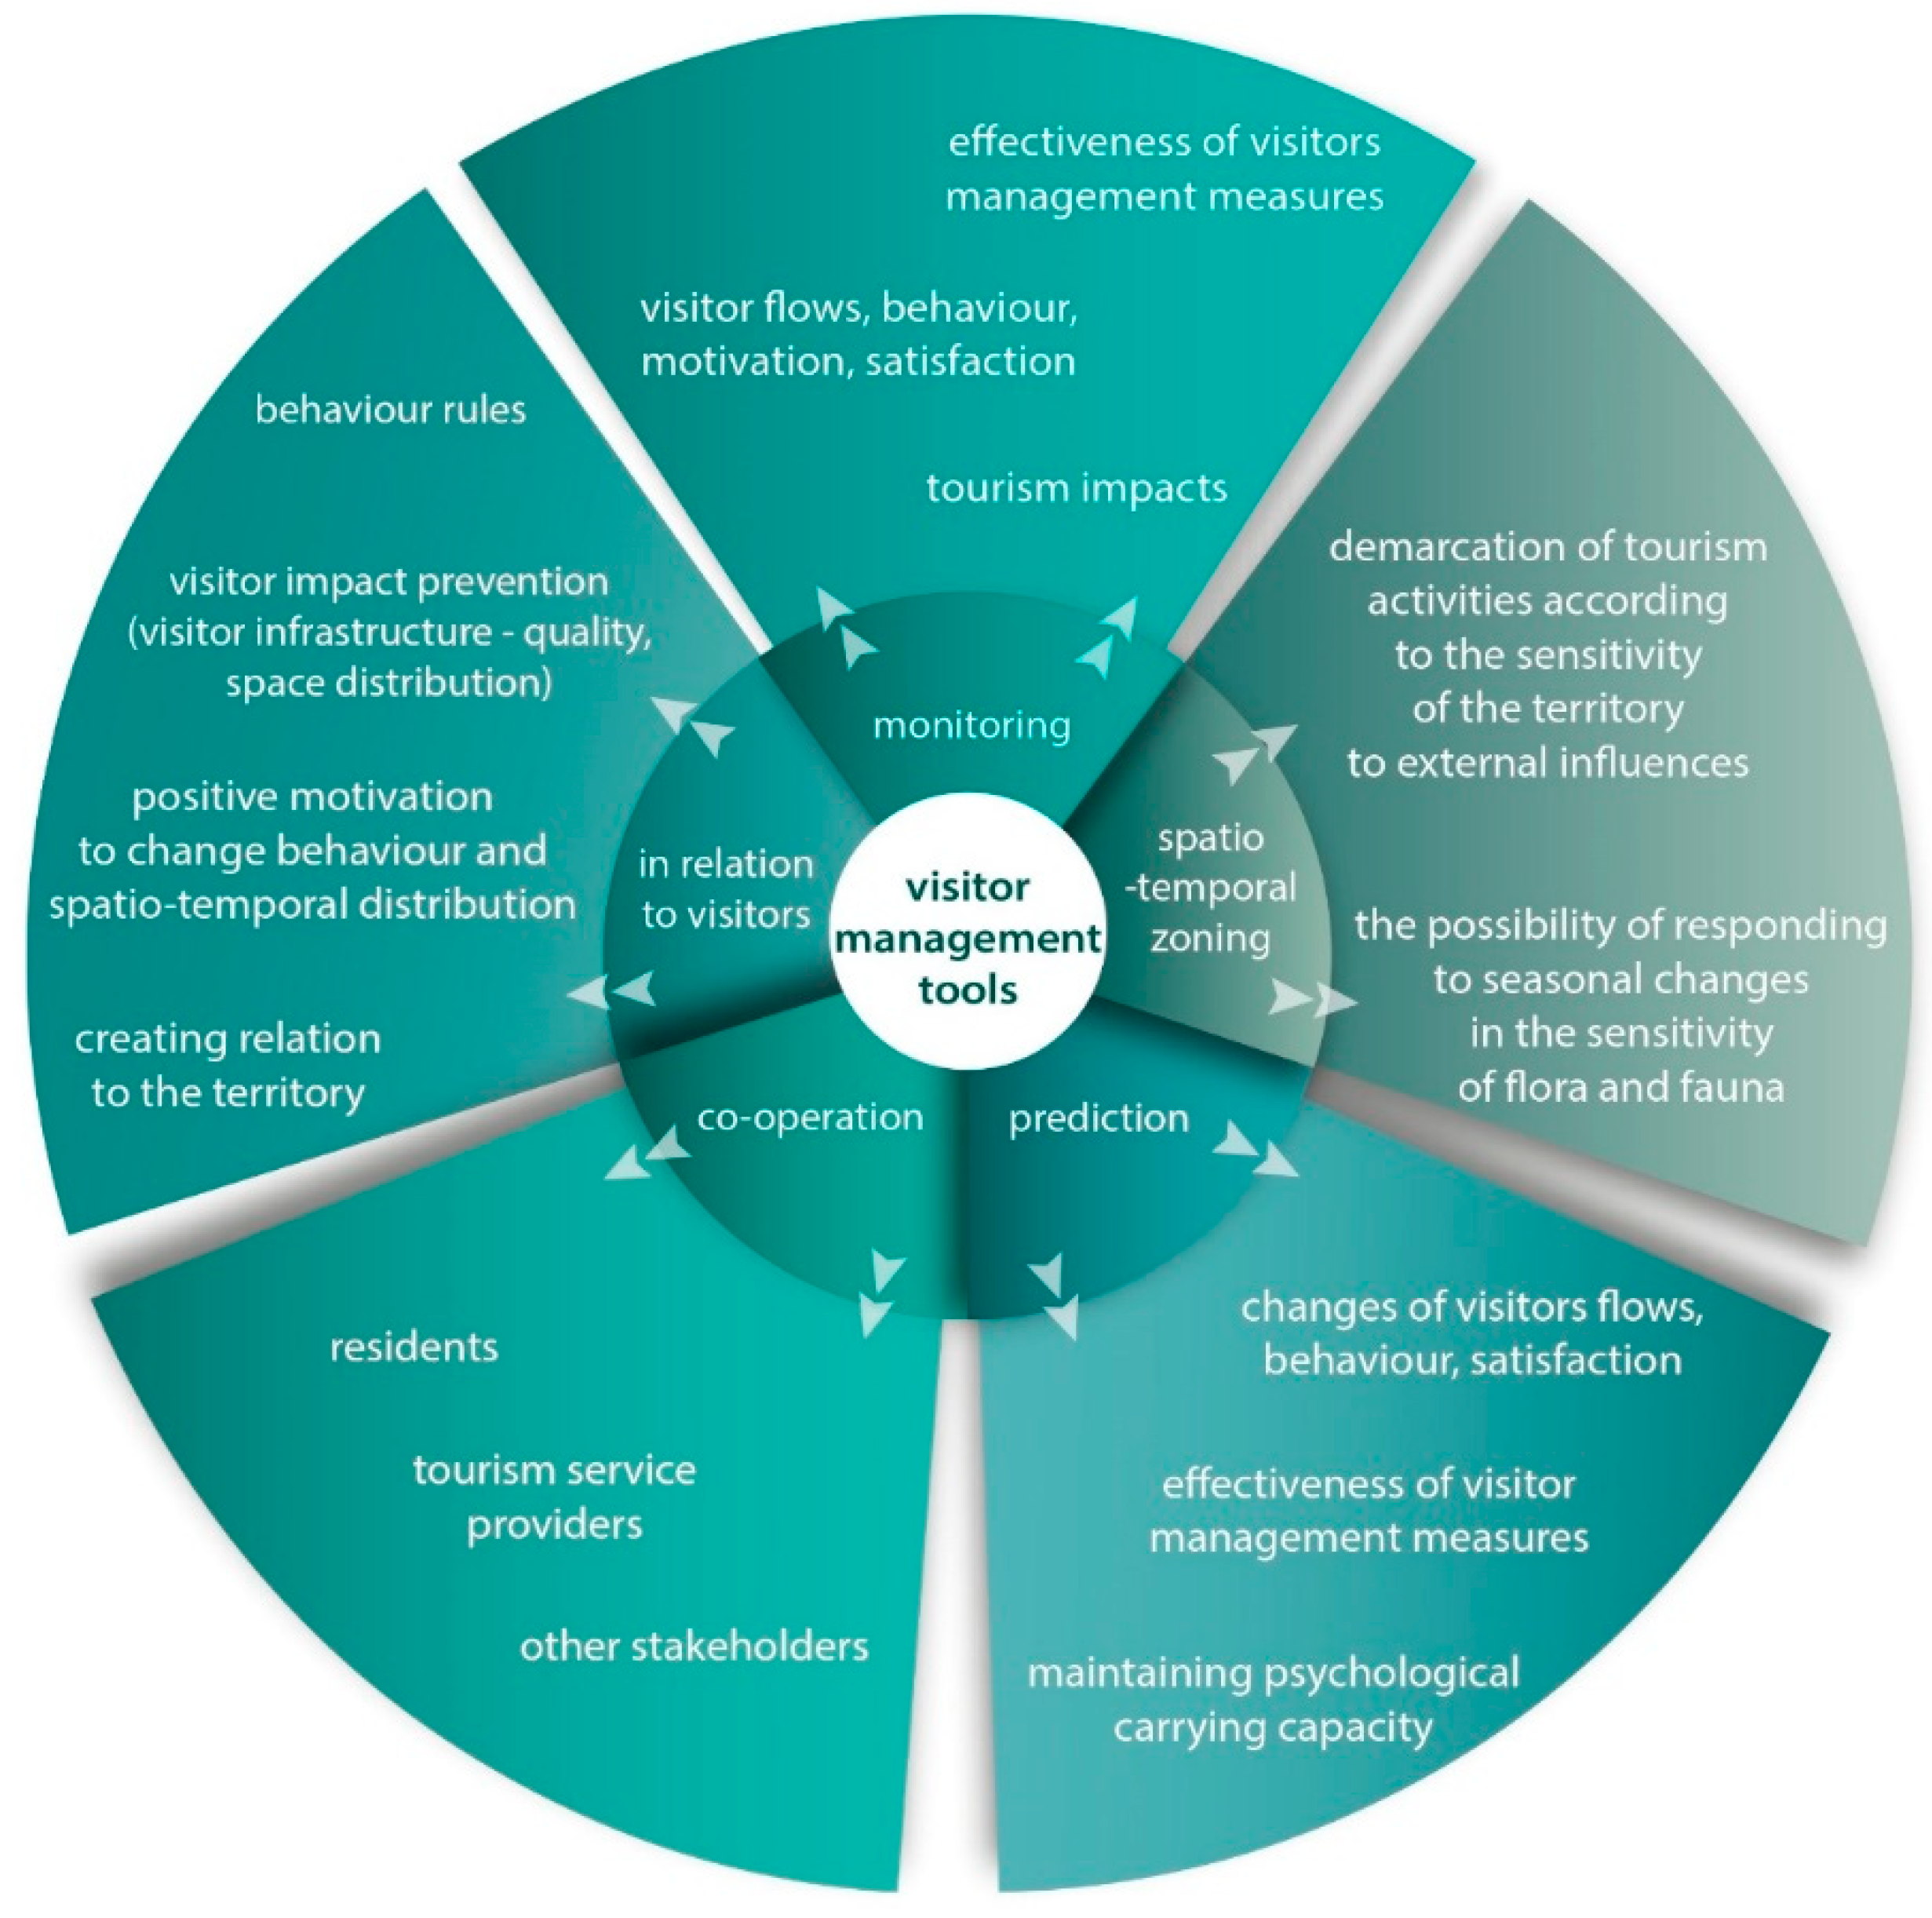
2.1. Visitor Management Concept

The optimization of tourism in a protected area, including its impacts on nature and the landscape of the area, is based on several starting points. The basic starting point is the choice of an appropriate philosophy of the relationship between the protected area and its visitors. Weaver and Lawton [56] describe their progressive approach as the “third generation” approach to visitation in higher-order protected areas. Their concept assumes the optimal number of visitors to the protected area due to the close link between visitors and the protected area (see the dynamic concept of carrying capacity, [27]), resulting in influencing not only their behaviour, but also their motivation to visit and their relationship to the protected area. According to them, visitors should be directly involved in the protection of the values of the area within the symbiosis of visitors and the protected area. Another starting point that Weaver and Lawton [56] incorporate in the previous “second generation” concept of visitation is the use of an appropriate combination of monitoring, carrying capacity, spatial-temporal zoning, etc., according to local conditions in the protected area. Both of these starting points are summarized in the mind map in Figure 2. In this mind map, there is also another starting point in relation to visitors, which is the possibility to qualitatively and quantitatively predict the course of processes in a protected area. The empirical-conceptual part of the article focuses on this possibility of prediction using computational models, namely agent-based models.
The system concept in its synergistic form is another important basis for considering how to design the visitor management of protected areas. Some sub-notes on synergy related to protected area visitor management follow:
  • As documented by D’Antonio and Monz [57], the spatial behaviour of visitors changes with the intensity of visitor flow (thus the process affects itself).
  • Removing the soil cover when expanding trails or moving visitors off the trails significantly increases the rate of soil erosion. These effects are more pronounced in mountain areas (e.g., [58]) and must be subject to accurate measurement and modelling [59] and more rigorous visitor management (see Figure 3).
  • The poor condition of the trail infrastructures and their low capacity in relation to the number of visitors leads not only to their accelerated erosion [60] but also to parallel paths, the movement of visitors completely off-trail and the trampling of trail surroundings [61,62].

2.2. Psychological and Social Carrying Capacity

In visitor management, attention is paid not only to the impacts of visiting the site and their prevention, but also to the increasing focus on visitor satisfaction, which can be described in a variety of ways. One is the comprehensive finding of a multidimensional cognitive map as an image of a visit to a destination; another is the spectrum of satisfaction with services and experiences at a destination (a typical component of marketing research). One-dimensional simplified metrics are often used. A frequently used one-dimensional metric of visitor satisfaction is the feeling of not exceeding the degree of negative influence of a certain irritating factor, most often the number of other visitors in the destination. This limit state of well-being of the visitor is alternatively referred to as
  • psychological carrying capacity [1]
  • perceptual carrying capacity [52]
  • socio-psychological capacity [49,53]
  • social carrying capacity (e.g., [50,51,54,55]) as refinements of the tourism-carrying capacity [25]
The tourism-carrying capacity is already used as a standard, e.g., in Chinese destinations; see [63].
Some authors refer to the social carrying capacity of tourism by local residents and visitors who perceive tourism (e.g., [64,65]). There are also authors who assess the perception of tourism by local residents in terms of psychological carrying capacity [66]. For the description in this article, the term psychological carrying capacity was chosen to describe the relationship of visitors to tourism (and in particular to other visitors), and the description of the relationship of local residents to tourism is called social carrying capacity.
Visitor management seeks to find a link between the degree of irritating factors (or the quality of the visited environment) and visitor satisfaction. Klanjšček et al. [67] found a link between the limit of acceptable disturbance (LAD) and the crowding rate by direct field measurements in PP Telasćica, Croatia. It is also possible to analyze visitor sentiment on social networks and review sites, as shown by Tokarchuk, Barr and Cozzio [68,69] for reviews on Tripadvisor. When analyzing the impact of environmental aspects on visitor satisfaction, some authors (e.g., Wang et al. [70]) introduce the concept of tourism environmental psychological carrying capacity (TEPCC).
Suitable predictive visitor management tools include visitor flow simulations, which not only allowmanagers to avoid congestion, as described by Murata and Totsuka [71], but also to increase visitor satisfaction. The first approximation to estimate of the degree of this satisfaction can be a simulation whose output is the proportion of visitors for whom the psychological carrying capacity has been exceeded.

2.3. Agent-Based Simulation

Agent-based modelling represents the process of creating a computational model, usually replicating the real world, and performing experiments to understand its behaviour. Agent-based modelling allows defining situations in which autonomously functioning entities (agents representing individuals or groups) interact with each other and with the virtual environment that surrounds them. The environment is most often a geographical space, but it can also be an abstract space of permissible behaviour as well as manifestations of agents. A simplified formal representation of space is a two- or three-dimensional grid, or a network in the sense of a mathematical graph theory. A common principle applied in agent-based models is to combine an environment based on real GIS data with artificially defined agents. The properties of agents are based on real-world modelling derived from research on observed properties of real-world individuals (typically they may correspond to segments of visitors or local residents). In the model, it is possible to connect the map of the protected area with agents representing its visitors and residents. Using agent-based models with appropriate spatial and temporal scales and computational power, it is possible to study pedestrian movement, traffic, migration, urban growth, changes in land use, the spread of diseases or adaptation to climate change. Examples of simulations are given, for example, in JASSS [72], conference papers from the Winter Simulation Conference [73], and archives of models such as the CoMSES Network [74]. Simulations of pedestrian movement using synthetic populations are created using real data (census data, surveys, sensor information [75]).
By conducting experiments on the agent-based computational model, it is possible to test theories and to refine hypotheses about the studied phenomena (e.g., psychological carrying capacity), create new hypotheses (e.g., in relation to socio-cultural carrying capacity), analyze different scenarios of tourism development [76], and study the influence of various factors on phenomena in tourism (e.g., how the type of transport affects the behaviour of visitors to protected areas–Orsi, Geneletti [77]). In general, these factors are studied in Lew and McKercher [78]). Others study system dynamics [79] and test what-if scenarios. In protected areas, these scenarios may include, for example, how trail accessibility affects visitor behaviour, how visitor flows change when a new trail is created, or how the tourist market might be described (Galapagos–Pizzituttia, Menab, Walshc [80]). It is also possible to model nonlinear collective manifestations in tourism [76] that cannot be estimated or predicted based on the knowledge of individual behaviour (e.g., the effect of congestion on trails or attraction sites on the behaviour of visitors), and the effect of visitor activities on the natural environment (Grand Canyon–Roberts, Stallman, Bieri [35]). An overview of crowd movement during mass gatherings was provided by Owaidah et al. [81]). Batty [82,83] explores the idea of urban modelling by combining agents with other computational approaches.
Methods from the field of computational intelligence (e.g., genetic algorithms, fuzzy sets, neural networks) can be incorporated into the computer implementation of agent-based models, enabling conceptual work in modelling with randomness and uncertainty, both of which are a natural part of the real world. The advantage of this approach is that the models are relatively easy to build and allow many different scenarios to be created by simply changing, modifying, or combining input data. Methods for analyzing the outputs of agent-based simulation have been summarized by Lee et al. [84].

3. Materials and Methods

The aim of this research was to find out, within a proper concept of visitor management, typical ways of using agent-based social simulations in visitor management in the context of psychological carrying capacity.
The aim of the first part of the research procedure, whose individual stages are shown in the following graph in Figure 4, was to obtain a comprehensive idea of which external and internal factors influence visitor behaviour and perception. This was done through a conceptual analysis of tourism impacts (Figure 1) and visitor management tools (Figure 2) as a basis for a general model of destination visitation. For the purposes of the present study, this model was simplified to a model for creating spatio-temporal curves of visitors’ movement via agent-based modelling.
The method selected to obtain structured knowledge for the formulation of a simulation model of visitors was mind mapping, based on the analysis of the concepts of various authors [2,9,14,21,22,27]. The resulting mind map (Figure 5) was used to visualize various types of factors influencing the behaviour of visitors to protected areas. The model in our study includes spatio-temporal curves of visitor movement in the protected area, and visitors’ effects on nature and landscape. Other visitors can be included in a future follow-up study.
The selected model of the spatial behaviour of visitors was implemented in two steps. The first was to simulate visitor behaviour at the model destination in order to gain knowledge about the basic features of the proposed model, including the selection of a suitable environment for the simulation. This knowledge was subsequently used to simulate the spatial behaviour of visitors in a specific destination, in which long-term monitoring of visitor flows took place in several places.
The actual agent-based social simulation was based on the assumption that the model for the social simulation must reflect the studied system with sufficient fidelity, i.e., it must cover all its main features. At the same time, the model is required to be simpler than the real system and to be comprehensible (a compromise between realism and minimalism). The general procedure for developing a discrete event simulation model consists of six main steps, which are:
1
formulation of research questions and hypotheses,
2
conceptual design,
3
implementation,
4
validation,
5
experiments and their evaluation,
6
publication of results.
The formulation of hypotheses was based on research questions 1 and 2. The ODD protocol was used for the conceptual design [85,86,87,88].
The freely available program NetLogo was chosen for implementation [89]. NetLogo offers a wide range of tools, functions and extension packages and a library of ready-made models that can be modified. A number of NetLogo packages (extensions) have been developed and shared by the user community. The extensions include libraries for working with more complex data structures (arrays, tables), GIS data, audio and video files, function sets for statistical network analysis, cluster analysis, fuzzy logic and more. NetLogo supports an agent-based modelling paradigm as well as system dynamics modelling. System dynamics modelling involves the construction of flowcharts and positive and negative feedback loop diagrams. NetLogo also provides constructs for specifying agent networks.
NetLogo offers a square grid to represent the environment. The grid is suitable for creating a cellular automaton with a number of parameters. The state of the cell typically depends on the state of the neighbouring cells, and the size of the monitored neighbourhood can be selected. Changes in cell state are determined by transition rules that are applied to all cells in parallel, either synchronously or asynchronously. Thus, cellular automata are used to represent the landscape as it evolves over time.
In addition to regular spatial structures (grids), a graphical representation of environment can be defined. A graph consists of nodes and edges (links) representing, for example, a system of routes in a tourist area. The nodes indicate junctions or places of interest, while weighted edges correspond to connections of places with additional parameters such as travelling distance or carrying capacity. The interpretation of the graph depends on the aim of the simulation model. The environment can be simplified as the basic variables of the model include the number of people moving in an area, their approximate travel time and the total number of visitors to a certain location. The objective of the simulation is to determine the distribution of people in the area and how the distribution changes under different circumstances.
Experiments with models are performed using a NetLogo BehaviorSpace tool. BehaviorSpace provides a form in which the user selects the model parameters to be varied, the output variables to be monitored, and the number of repetitions of the simulation for each combination of inputs. When the experiment is run, the values are reinitialized, or new pseudorandom numbers are generated. The outputs of the experiments can then be compared with each other and converted to statistical outputs. Alternatively, optimization tools such as BehaviorSearch [90] can be used in the experiments. In this case, we would choose an evaluation function (metric), and an optimization method (such as genetic algorithm or simulated annealing), which is then used to automatically search for the combination of the most optimal values of the model parameters.

4. Results

In order to demonstrate our agent-based exploration of physical and psychological carrying capacity, two models were developed in NetLogo. First, a random network was created. The network represents an unspecified tourist area consisting of a few entry points (e.g., bus stops or car parks), a number of points of interest, junctions, and connecting routes. The second model was developed for a specific location in the surrounding area of Oheb Castle, located in the Železné hory (Iron Mountains) Protected Landscape Area in Bohemia. The objective of our models is to simulate tourist movement patterns and to provide basic statistics on visitor experience.

4.1. Model 1: Random Network

The nodes of our random network are generated to reach degrees one to four. It is common for a hiking path to branch in one place to a maximum of four other directions, and it is also clear in terms of model visualization. A node of degree one may indicate, for example, a viewpoint where a tourist goes and must subsequently return from. From all the nodes, some are then selected to indicate points of interest and some to serve as entry points for visitor-agents. Distances between nodes are set to correspond to the length of tourist routes (in kilometers or hours). The environment can be parameterized; however, for statistical comparisons it is advisable to keep as many elements as possible with a certain probability and then compare the result with a real example.
The second part of the model initialization is the creation of visitor-agents moving through the network. Agents are assumed to enter the area through one of the entry points, take the shortest path to their points of interest, spend some time there, continue to other points and finally return to their entry points and exit the model. This is a simulation of the behaviour of visitors who travel to the site by car or train, so they have to return to the same place at the end of their trip. The basic pattern of visitor-agent behaviour may by refined with additional parameters in future versions of the model.
During the simulation, it is possible to monitor the distribution of visitors over the area and their number in each node Figure 6.

4.2. Model 2: Region of Oheb Castle

The path network represents the real path system in the locality of Oheb, the Železné hory (Iron Mountains), the Czech Republic Figure 7 The simulation model was adapted to the real environment of the tourist area around Oheb Castle for verification. The priorities and locations of the nodes were fixed, and the result was consistent with the statistical results from previous experiments. To achieve a more realistic simulation, the model was extended with the following two features.
  • Hikers rarely move alone. Typically, families or couples move together at the speed of the slowest member and stay at the place of interest for the same length of time. It is advisable to aggregate these individuals in one visitor-agent. A parameter specifying the number of people in the group was defined and a normal distribution was used to denote initial numbers. This aggregation also improves the performance of the simulation.
  • In order to refine the model, points of interest were assigned a priority according to which tourists choose a particular point as their destinations. In addition, these places were assigned a physical capacity, which indicates the reasonable limit of visitors to these places (e.g., a tour, castle, or cave) at a time, and/or a psychological capacity, which indicates the maximum number of visitors that a person is willing to tolerate alongside him or her.

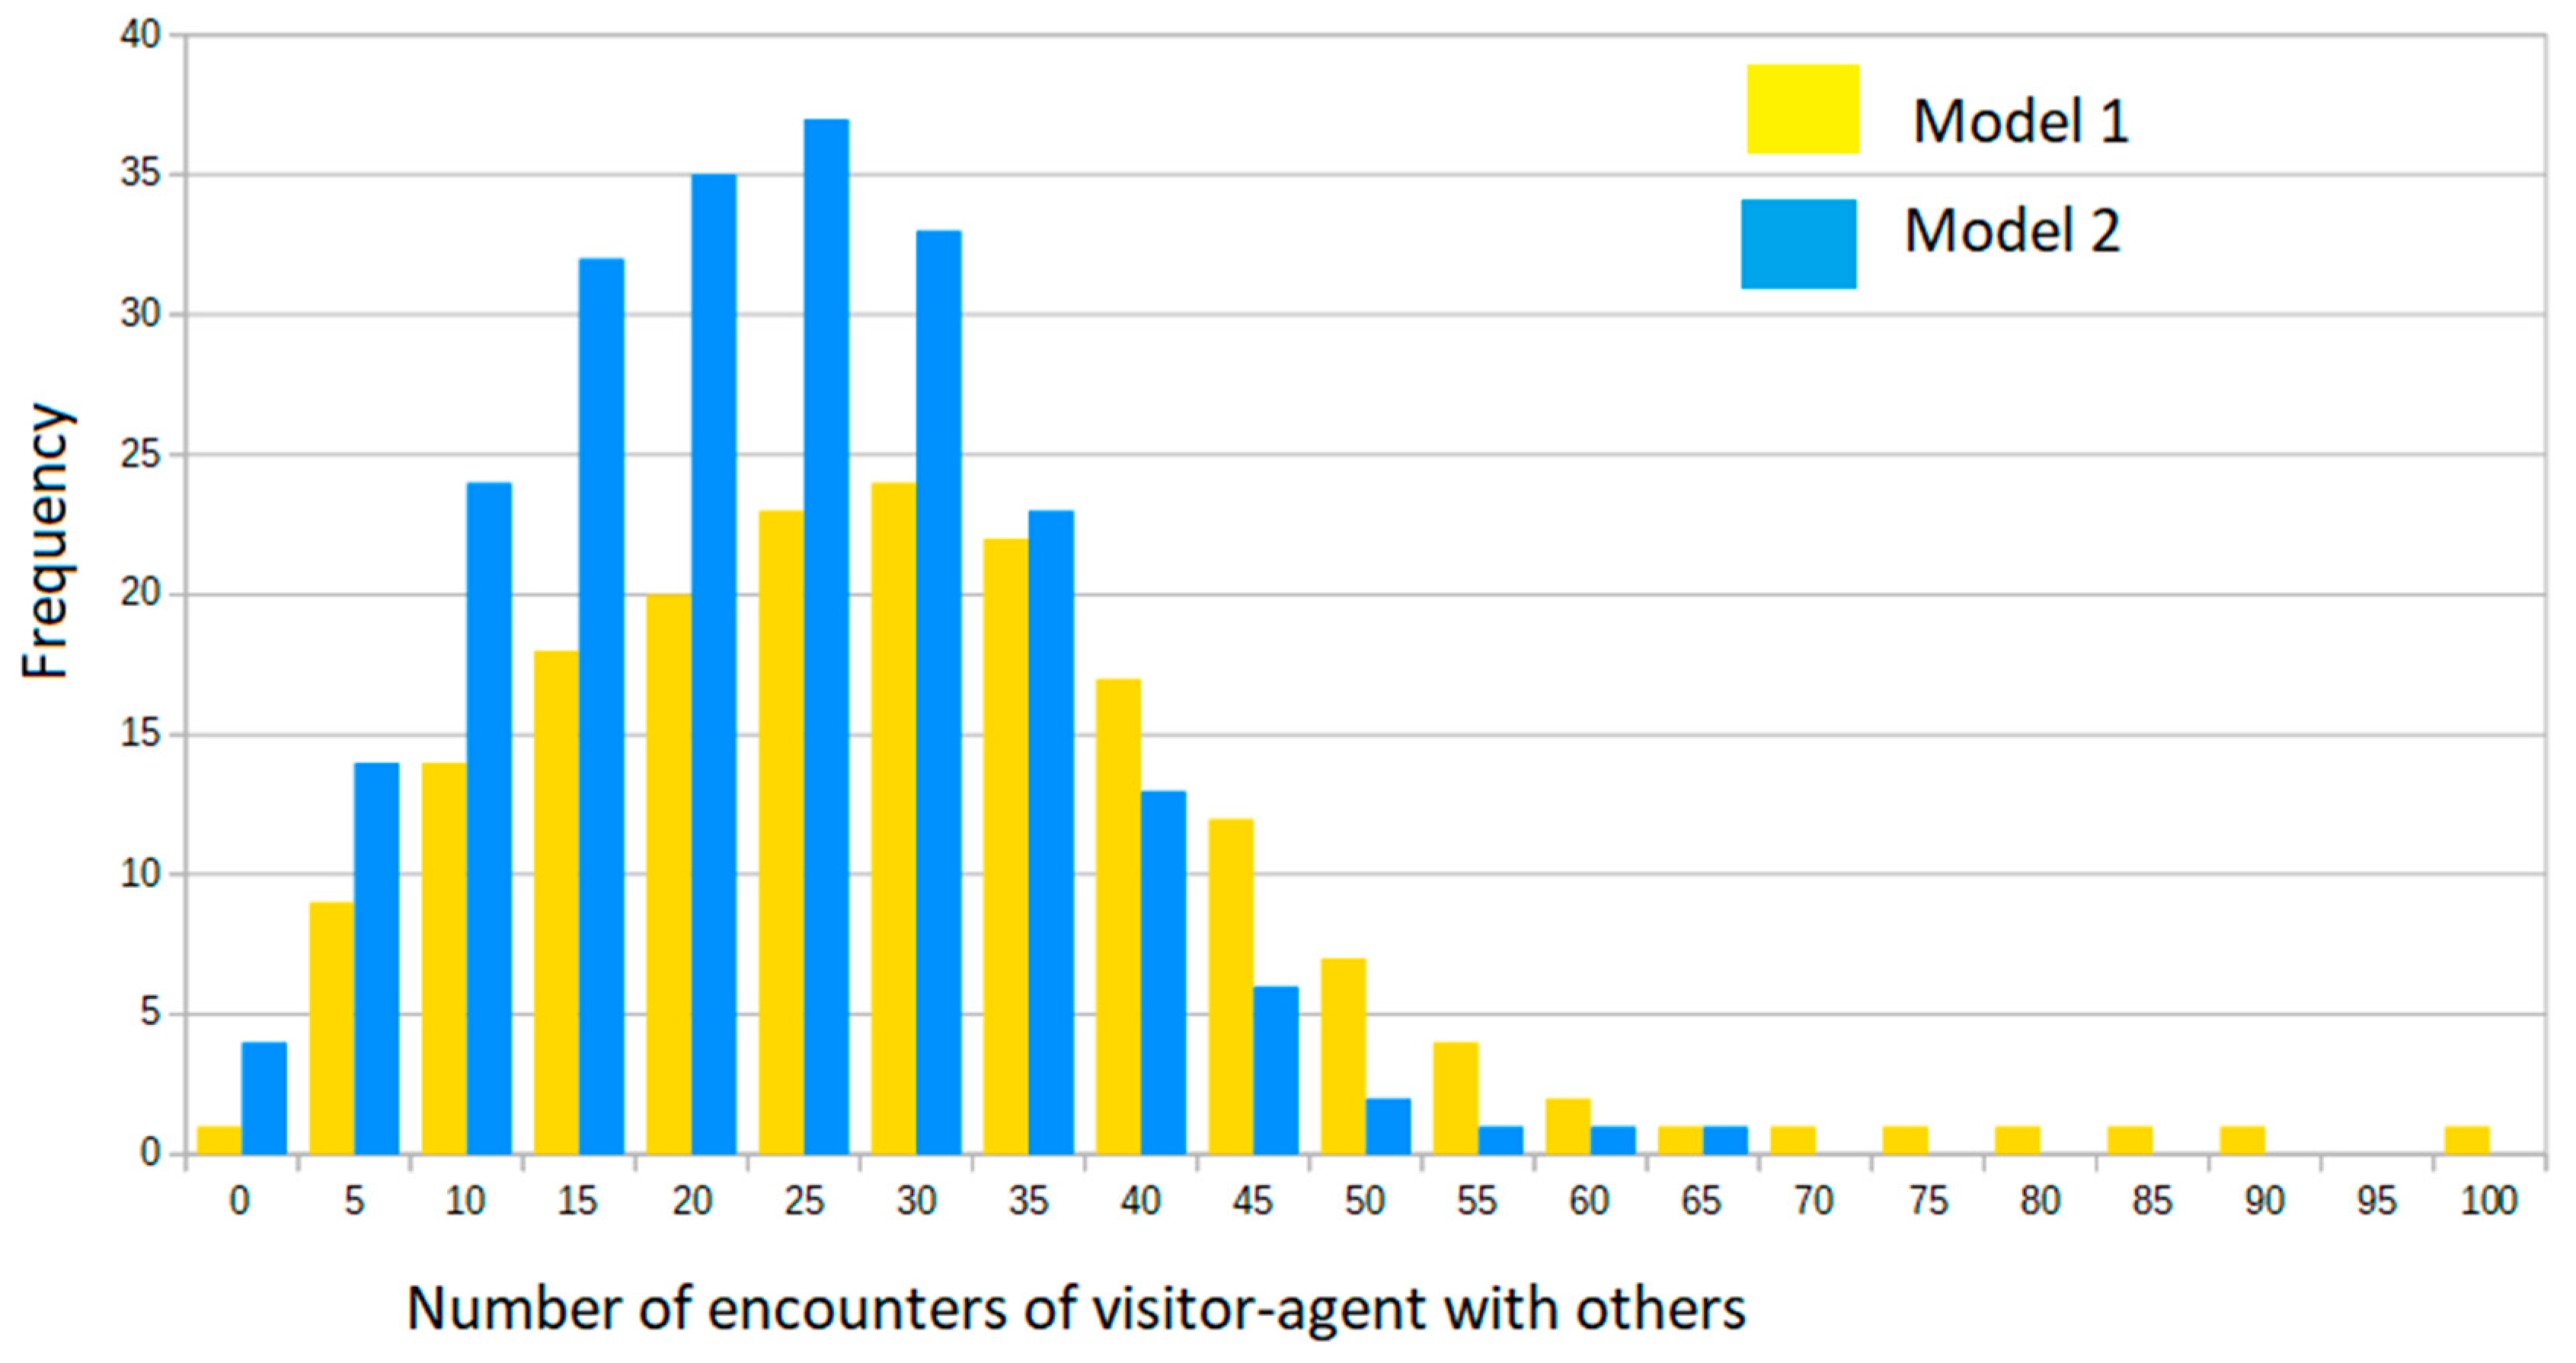
4.3. Simulation Outputs–Region of Oheb Castle

The key output variable is the frequency of encounters with other tourists during the trip. The frequency of encounters over the course of an hour was plotted in a histogram Figure 8. The outputs of Model 1 and Model 2 are similar.
In addition to comparing the two models, the simulation for a specific territory allows us to compare the impact of different boarding points in the territory as well as different boarding times. This is shown by the detailed analysis on the following graphs Figure 9, Figure 10 and Figure 11. This analysis can be an important basis for visitor management and its recommendations for visitors to the territory (choice of time, boarding points). It can also be presented to visitors in a simplified form (e.g., verbal description).
The first histogram (Figure 9) shows that even if a visitor arrives in the area in the morning, he or she still encounters a relatively large number of people. This may seem strange at first glance as this is the least used entry point due to the greatest distance from points of interest. This is because by the time this distance is covered, the main area will be crowded with visitors who have chosen a closer entry point. This phenomenon can also be evident in the green part of the histogram. When a visitor enters the area in the afternoon, before he or she travels the distance to the given number of points of interest, the area is depopulated, and the number of encounters is the lowest of all.
It can also be seen here that the histogram shows the highest number of meetings at midday, when the attendance is highest. This is because the number of encounters is counted from the main area (visitors from all entry points meet here), but also after a long way there and back (part of the journey is even shared with the path from entrance B, Figure 10).
The third histogram (Figure 11, Entrance C), on the other hand, shows that the number of encounters is higher immediately after entering the area and remains high throughout the day. This is because this is the most frequently used entry point (due to the small distance to points of interest).
It should be noted here that the determination of appropriate outcome variables needs to be the subject of further research. It is important for a deeper exploration of psychological carrying capacity. For example, to simplify our demonstration, we did not consider repeated encounters with the same visitor-agents, a factor that can undoubtedly positively or negatively affect the visitor experience.

5. Discussion and Conclusions

Psychological carrying capacity can be studied using variables such as the frequency of encounters, as indicated in our models. Naturally, the more input parameters a visitor-agent has, the more variables can be observed as simulation outputs. Well-designed variables and graphs (histograms, scatterplots, time series, spatio-temporal trajectories) are key to interpreting simulation outputs by future model stakeholders (policymakers, destination managers) [91].
The main benefits of agent-based simulations in the area of visitor management are in providing insight into the spatio-temporal behaviour of heterogeneous individuals, including the ability to explore specific issues of carrying capacity. NetLogo is a well-applicable tool for developing both sample models and realistic simulations. It is strongly recommended to adopt existing agent-based pedestrian models or evacuation models. For example, Wozniak and Dziecielski [92] provide a NetLogo model of pedestrian behaviour in urban environments during the daytime. Their ambition is to design a general agent-based model for the replication of pedestrian flows. The output variables are trajectories and densities. In domain-specific models, such as models of visitor flows in protected areas, the concept of psychological carrying capacity is the relevant measure.
In line with the analysis in the Literature Review, the research carried out showed, among other things, the concepts of Weaver and Lawton [56] and their emphasis on, among other things, visitor monitoring, the predictive power of simulating the movement of individual visitors in connection with the monitoring of visitor flows. The used simulation procedures can be further refined, e.g., by incorporating the fact that the spatial behaviour of visitors changes with the intensity of visitor flow [57]. The performed simulations also have a direct connection with visitor management models associated with the preservation of visitor experience (VERP—Visitor Experience and Resource Protection; [30]).
The selected procedure for simulating the movement of individual visitors develops the dynamic concept of psychological carrying capacity [27,48], fully respecting individual influences on individual visitors, including changes in these influences in time and space of the destination in a protected area. The individuality of setting the limits of psychological carrying capacity should be the subject of further research, as discussed in the following chapter.

Future Research

The presented study showed that there is a lack of a deeper understanding of the dynamic character of psychological carrying capacity in the context of its temporal development during the visit to the destination and the degree of its individuality. Further efforts need to be focused on designing clear ways of visualizing the main aspect of research interest, i.e., the psychological carrying capacity of tourism. The visitor-agents in the model can be heterogeneous in terms of different perceptions and tolerance of the presence of other visitors, different expectations, or varying degrees of flexibility in changing their itinerary. Therefore, our next research will focus on exploring how the distribution of visitor-agents would change if they made decisions based not only on their own priorities, but also on the actual or expected number of people around. A realistic scenario is that a visitor who arrives at an overcrowded location (e.g., historic city centres, attractive museum rooms) either waits there or moves elsewhere with the expectation of returning later. The estimated number of people in a place can be communicated by various means to visitors already on their journey to the place (e.g., information signs or mobile applications). Agent-based simulations promise to provide a deeper understanding of the implications of contact tracing mobile applications or the influence of social networks on visitor decision-making.
Reflections on determining psychological carrying capacity in relation to the number of encounters with other visitors, their spatio-temporal distribution and the emotional setting of the visitor led to the following questions for follow-up research:
  • How long does the emotional state resulting from encountering an excessive number of other visitors, which is perceived as exceeding the psychological carrying capacity, manifest itself? What influences this state positively or negatively?
  • How significantly is this emotional state related to the type of visitor, the group of other visitors (size, type of group, e.g., own family) with whom he or she visits the protected area, and the type of activities that the visitor seeks in the protected area?
  • How best to use the knowledge gained from monitoring, simulations of visitor flows and the detection of (not) exceeding the psychological carrying capacity of visitors in visitor management?
Answering questions 1 and 2 will require detailed individual research into the emotional state of visitors to the area, the number of encounters the visitor has with other visitors, and the monitoring of other conditions during the entire visit to the protected area. This will then enable the effective use of detailed data on the visitation to the area, obtained by combining automatic monitoring and simulation of visitor flows using agent-based modelling. The success of modelling depends on communication between model developers and stakeholders, who must rely on the simulation outputs. The guideline is provided by, e.g., [93].

Author Contributions

Conceptualization, K.Š. and J.Z.; methodology J.Z. and K.Š.; software, M.K.; validation, K.Š. and J.Z.; formal analysis, K.Š. and J.Z.; investigation, M.K. and K.Š.; writing, K.Š. and J.Z.; supervision, J.Z.; project administration, J.Z.; funding acquisition, J.Z. All authors have read and agreed to the published version of the manuscript.

Funding

This work was supported by the FIM UHK under the internal Grant of the Specific Research Project “Information and knowledge management and cognitive science in tourism”. The authors wish to express thanks to Zuzana Kroulíková, a FIM UHK student, who assisted with the graphical elements of this study.

Institutional Review Board Statement

Not applicable.

Informed Consent Statement

Not applicable.

Acknowledgments

The authors wish to express thanks to Zuzana Kroulíková, a FIM UHK student, who assisted with the graphical elements of this study.

Conflicts of Interest

The authors declare no conflict of interest. The funders had no role in the design of the study; in the collection, analyses, or interpretation of data; in the writing of the manuscript, or in the decision to publish the results.

References

  1. Pásková, M. Tourism Environmentalism (Czech). Czech J. Tour. 2012, 1, 77–113. [Google Scholar]
  2. Pickering, C.; Rossi, S.D.; Hernando, A.; Barros, A. Current knowledge and future research directions for the monitoring and management of visitors in recreational and protected areas. J. Outdoor Recreat. Tour. 2018, 21, 10–18. [Google Scholar] [CrossRef]
  3. Pásková, M.; Zelenka, J. Social Responsibility Role in Tourism Sustainability. In Proceedings of the Hradec Economic Days, Hradec Králové, Czech Republic, 2–3 February 2016; pp. 777–785. [Google Scholar]
  4. Zelenka, J.; Pásková, M. Social Responsibility in Ecotourism. In Proceedings of the Hradec Economic Days, Hradec Králové, Czech Republic, 2–3 February 2016; pp. 1210–1216. [Google Scholar]
  5. Chilufya, A.; Hughes, E.; Scheyvens, R. Tourists and community development: Corporate social responsibility or tourist social responsibility? J. Sustain. Tour. 2019, 27, 1513–1529. [Google Scholar] [CrossRef]
  6. Ibarnia, E.; Garay, L.; Guevara, A. Corporate Social Responsibility (CSR) in the Travel Supply Chain: A Literature Review. Sustainability 2020, 12, 10125. [Google Scholar] [CrossRef]
  7. Widawski, K.; Jary, Z. Mass tourism in protected areas—Underestimated threat? Polish National Parks case study. Open Geosci. 2019, 11, 1046–1060. [Google Scholar] [CrossRef]
  8. Zelenka, J.; Kacetl, J. The Concept of Carrying Capacity in Tourism. Amfiteatru Econ. 2014, 16, 641–654. [Google Scholar]
  9. Zelenka, J.; Kacetl, J. Visitor management in protected areas. Czech J. Tour. 2013, 2, 5–18. [Google Scholar] [CrossRef]
  10. Papageorgiou, K.; Brotherton, I. A management planning framework based on ecological, perceptual and economic carrying capacity: The case study of Vikos-Aoos National Park, Greece. J. Environ. Manag. 1999, 56, 271–284. [Google Scholar] [CrossRef]
  11. Ahn, B.; Lee, B.; Shafer, C. Operationalizing sustainability in regional tourism planning: An application of the limits of acceptable change framework. Tour. Manag. 2002, 23, 1–15. [Google Scholar] [CrossRef]
  12. Leung, Y.-F.; Spenceley, A.; Hvenegaard, G.; Buckley, R. Tourism and visitor management in protected areas: Guidelines for sustainability. In Best Practice Protected Area Guidelines Series No. 27; IUCN: Gland, Switzerland, 2018. [Google Scholar] [CrossRef]
  13. Slabbert, L.; du Preez, E.A. Where did all the visitor research go? A systematic review of application areas in national parks. J. Hosp. Tour. Manag. 2021, 49, 12–24. [Google Scholar] [CrossRef]
  14. Zelenka, J.; Těšitel, J.; Pásková, M.; Kušová, D. Udržitelný Cestovní Ruch. Management Cestovního Ruchu v Chráněných Oblastech (Sustainable Tourism. Tourism Management in Protected Areas); Gaudeamus: Hradec Králové, Czech Republic, 2013; p. 327. [Google Scholar]
  15. Cessford, G.; Cockburn, S.; Douglas, M. Developing New Visitor Counters and their Applications for Management. In Proceedings of the International Conference on Monitoring and Management of Visitor Flows in Recreational and Protected Areas, Vienna, Austria, 30 January–2 February 2002; pp. 14–20. [Google Scholar]
  16. Cavens, D.; Gloor, C.; Nagel, K.; Lange, E. A Framework for Integrating Visual Quality Modelling within an Agent-Based Hiking Simulation for the Swiss Alps. In Proceedings of the Second International Conference on Monitoring and Management of Visitor Flows in Recreational and Protected Areas, Rovaniemi, Finland, 16–20 June 2004; p. 417. [Google Scholar]
  17. Gimblett, R.; Sko-Petersen, H. Monitoring, Simulation and Management of Visitor Landscapes; University of Arizona Press: Tusson, AZ, USA, 2008. [Google Scholar]
  18. Johnson, P.A.; Sieber, R.E. An Individual-Based Approach to Modeling Tourism Dynamics. Tour. Anal. 2010, 15, 517–530. [Google Scholar] [CrossRef]
  19. Wolf, I.D.; Hagenloh, G.; Croft, D.B. Visitor monitoring along roads and hiking trails: How to determine usage levels in tourist sites. Tour. Manag. 2012, 33, 16–28. [Google Scholar] [CrossRef]
  20. Goossen, M. New ideas for monitoring visitors. In Proceedings of the 7th International Conference on Monitoring and Management of Visitors in Recreational and Protected Areas (MMV), Tallinn, Estonia, 20–23 August 2014; pp. 121–122. [Google Scholar]
  21. McKercher, B.; Zoltan, J. Tourist Flows and Spatial Behavior. In The Wiley Blackwell Companion to Tourism; Lew, A.A., Hall, C.M., Williams, A.M., Eds.; John Wiley & Sons, Ltd.: Hoboken, NJ, USA, 2014. [Google Scholar] [CrossRef]
  22. Zejda, D.; Zelenka, J. The Concept of Comprehensive Tracking Software to Support Sustainable Tourism in Protected Areas. Sustainability 2019, 11, 4104. [Google Scholar] [CrossRef]
  23. Zhang, Y.; Yang, H.; Wang, G. Monitoring and management of high-end tourism in protected areas based on 3D sensor image collection. Displays 2021, 70, 102089. [Google Scholar] [CrossRef]
  24. Sisneros-Kidd, A.M.; D’Antonio, A.; Monz, C.; Mitrovich, M. Improving understanding and management of the complex relationship between visitor motivations and spatial behaviors in parks and protected areas. J. Environ. Manag. 2021, 280, 111841. [Google Scholar] [CrossRef]
  25. O’Reilly, A.M. Tourism carrying capacity: Concept and issues. Tour. Manag. 1986, 7, 254–258. [Google Scholar] [CrossRef]
  26. UNWTO. Tourism Congestion Management at Natural and Cultural Sites; World Tourism Organization: Madrid, Spain, 2005; p. 125. ISBN 92-844-0763-X. [Google Scholar]
  27. Pásková, M.; Wall, G.; Zejda, D.; Zelenka, J. Tourism carrying capacity reconceptualization: Modelling and management of destinations. J. Destin. Mark. Manag. 2021, 21, 100638. [Google Scholar] [CrossRef]
  28. UNWTO. Guide for Local Authorities on Developing Sustainable Tourism; World Tourism Organization: Madrid, Spain, 1998; p. 104. ISBN 9284402808. [Google Scholar]
  29. Frauman, E.; Banks, S. Gateway community resident perceptions of tourism development: Incorporating Importance-Performance Analysis into a Limits of Acceptable Change framework. Tour. Manag. 2011, 32, 128–140. [Google Scholar] [CrossRef]
  30. Zelenka, J.; Olševičová, K.; Cimler, R.; Pásková, M.; Procházka, J. Aplikace Umělé Inteligence a Kognitivní Vědy v Udržitelnosti Cestovního Ruchu (Application of the Artificial Intelligence and Cognitive Science in Sustainable Tourism); Gaudeamus: Hradec Králové, Czech Republic, 2014; p. 220. [Google Scholar]
  31. Kostopoulou, S.; Kyritsis, I. A Tourism Carrying Capacity Indicator for Protected Areas. Anatolia 2006, 17, 5–24. [Google Scholar] [CrossRef]
  32. McCool, S.F. Managing for visitor experiences in protected areas: Promising opportunities and fundamental challenges. Parks 2006, 16, 3–9. [Google Scholar]
  33. Velmurugan, S.; Thazhathethil, B.V.; George, B. A study of visitor impact management practices and visitor satisfaction at Eravikulam National Park, India. Int. J. Geoherit. Park. 2021, 9, 463–479. [Google Scholar] [CrossRef]
  34. Huang, Z.; Weng, L.; Bao, J. How do visitors respond to sustainable tourism interpretations? A further investigation into content and media format. Tour. Manag. 2022, 92, 104535. [Google Scholar] [CrossRef]
  35. Roberts, C.A.; Stallman, D.; Bieri, J.A. Modeling complex human–environment interactions: The Grand Canyon river trip simulator. Ecol. Model. 2002, 153, 181–196. [Google Scholar] [CrossRef]
  36. Lawson, S.; Kiely, A.M.; Manning, R.E. Computer Simulation as a Tool for Developing Alternatives for Managing Crowding at Wilderness Campsites on Isle Royale. In Proceedings of the Second International Conference on Monitoring and Management of Visitor Flows in Recreational and Protected Areas, Rovaniemi, Finland, 16–20 June 2004; pp. 114–119. [Google Scholar]
  37. Clius, M.; Teleucă, A.; David, O.; Moroşanu, A. Trail Accessibility as a Tool for Sustainable Management of Protected Areas: Case Study Ceahlău National Park, Romania. Procedia Environ. Sci. 2012, 14, 267–278. [Google Scholar] [CrossRef]
  38. Zelenka, J.; Pásková, M.; Husáková, M. Aplikace Umělé Inteligence, Kognitivní Vědy a Informačních a Komunikačních Technologií v Udržitelném Cestovním Ruchu (Application of the Artificial Intelligence, Cognitive Science, and Information and Communication Technologies in Sustainable Tourism); Gaudeamus: Hradec Králové, Czech Republic, 2015; p. 339. [Google Scholar]
  39. Husáková, M. Use of the Multi-Agent Paradigm in Sustainable Tourism. Czech J. Tour. 2018, 7, 5–24. [Google Scholar] [CrossRef]
  40. Boers, B.; Cottrell, S. Sustainable Tourism Infrastructure Planning: A GIS-Supported Approach. Tour. Geogr. 2007, 9, 1–21. [Google Scholar] [CrossRef]
  41. Parolo, G.; Ferrarini, A.; Rossi, G. Optimization of tourism impacts within protected areas by means of genetic algorithms. Ecol. Model. 2009, 220, 1138–1147. [Google Scholar] [CrossRef]
  42. Li, S.; Colson, V.; Lejeune, P.; Speybroeck, N.; Vanwambeke, S.O. Agent-based modelling of the spatial pattern of leisure visitation in forests: A case study in Wallonia, south Belgium. Environ. Model. Softw. 2015, 71, 111–125. [Google Scholar] [CrossRef]
  43. Amelung, B.; Student, J.; Nicholls, S.; Lamers, M.; Baggio, R.; Boavida-Portugal, I.; Johnson, P.; de Jong, E.; Hofstede, G.J.; Pons, M.; et al. The value of agent-based modelling for assessing tourism–environment interactions in the Anthropocene. Curr. Opin. Environ. Sustain. 2016, 23, 46–53. [Google Scholar] [CrossRef]
  44. Getz, D. Capacity to absorb tourism: Concepts and implications for strategic planning. Ann. Tour. Res. 1983, 10, 239–263. [Google Scholar] [CrossRef]
  45. Zelenka. Personal photo archive, Iceland. September 2011. [Google Scholar]
  46. Salerno, F.; Viviano, G.; Manfredi, E.C.; Caroli, P.; Thakuri, S.; Tartari, G. Multiple Carrying Capacities from a man-agement-oriented perspective to operationalize sustainable tourism in protected areas. J. Environ. Manag. 2013, 128, 116–125. [Google Scholar] [CrossRef]
  47. Putri, I.A.; Ansari, F. Managing Nature-Based Tourism in Protected Karst Area Based on Tourism Carrying Capacity Analysis. J. Landsc. Ecol. 2021, 14, 46–64. [Google Scholar] [CrossRef]
  48. Chen, Y.; Chen, A.; Mu, D. Impact of walking speed on tourist carrying capacity: The case of Maiji Mountain Grottoes, China. Tour. Manag. 2021, 84, 104273. [Google Scholar] [CrossRef]
  49. Wang, H.-L. A systematic approach to natural recreational resource management. Socio-Econ. Plan. Sci. 1996, 30, 39–49. [Google Scholar] [CrossRef]
  50. Lovén, L. Customer Satisfaction as an Indicator of Social Carrying Capacity—Case Heritage Centre Ukko in Koli National Park, Finland. In Proceedings of the International Conference on Monitoring and Management of Visitor Flows in Recreational and Protected Areas, Vienna, Austria, 30 January–2 February 2002; pp. 340–345. [Google Scholar]
  51. Sterl, P.; Wagner, S.; Arnberger, A. Social Carrying Capacity of Canoeists in Austria´s Danube Floodplains National Park. In Proceedings of the Second International Conference on Monitoring and Management of Visitor Flows in Recreational and Protected Areas, Rovaniemi, Finland, 16–20 June 2004; pp. 460–466. [Google Scholar]
  52. Mokrý, S. Concept of perceptual carrying capacity and its use in the creation of promotional materials of tourist destination. Acta Univ. Agric. Silvic. Mendel. Brun. 2013, 61, 2547–2553. [Google Scholar] [CrossRef]
  53. Mihalic, T. Conceptualising overtourism: A sustainability approach. Ann. Tour. Res. 2020, 84, 103025. [Google Scholar] [CrossRef]
  54. Arnberger, A.; Haider, W.; Muhar, A. Social Carrying Capacity of an Urban Park in Vienna. In Proceedings of the Second International Conference on Monitoring and Management of Visitor Flows in Recreational and Protected Areas, Rovaniemi, Finland, 16–20 June 2004; pp. 361–368. [Google Scholar]
  55. Xiao, X.; Gao, J.; Lu, J.; Li, P.; Zhang, Y. Social carrying capacity and emotion dynamics in urban national parks during the COVID-19 pandemic. J. Outdoor Recreat. Tour. 2021, in press. [CrossRef]
  56. Weaver, D.B.; Lawton, L.J. A new visitation paradigm for protected areas. Tour. Manag. 2017, 60, 140–146. [Google Scholar] [CrossRef]
  57. D’Antonio, A.; Monz, C. The influence of visitor use levels on visitor spatial behavior in off-trail areas of dispersed recreation use. J. Environ. Manag. 2016, 170, 79–87. [Google Scholar] [CrossRef]
  58. Salesa, D.; Cerdà, A. Soil erosion on mountain trails as a consequence of recreational activities. A comprehensive review of the scientific literature. J. Environ. Manag. 2020, 271, 110990. [Google Scholar] [CrossRef]
  59. Eagleston, H.; Marion, J.L. Application of airborne LiDAR and GIS in modeling trail erosion along the Appalachian Trail in New Hampshire, USA. Landsc. Urban Plan. 2020, 198, 103765. [Google Scholar] [CrossRef]
  60. Dragovich, D.; Bajpai, S. Managing Tourism and Environment—Trail Erosion, Thresholds of Potential Concern and Limits of Acceptable Change. Sustainability 2022, 14, 4291. [Google Scholar] [CrossRef]
  61. Barros, A.; Aschero, V.; Mazzolari, A.; Cavieres, L.A.; Pickering, C.M. Going off trails: How dispersed visitor use affects alpine vegetation. J. Environ. Manag. 2020, 267, 110546. [Google Scholar] [CrossRef]
  62. Fidelus-Orzechowska, J.; Gorczyca, E.; Bukowski, M.; Krzemień, K. Degradation of a protected mountain area by tourist traffic: Case study of the Tatra National Park, Poland. J. Mt. Sci. 2021, 18, 2503–2519. [Google Scholar] [CrossRef]
  63. Bai, N.; Nourian, P.; Xie, A.; Roders, P.A. Towards a Finer Heritage Management Evaluating the Tourism Carrying Capacity using an Agent-Based Model. In Proceedings of the 25th International Conference of the Association for Computer-Aided Architectural Design Research in Asia (CAADRIA) 2020, Bangkok, Thailand, 5 August 2020; pp. 305–314. [Google Scholar]
  64. Saveriades, A. Establishing the social tourism carrying capacity for the tourist resorts of the east coast of the Republic of Cyprus. Tour. Manag. 2000, 21, 147–156. [Google Scholar] [CrossRef]
  65. Cumberbatch, J.; Moses, J. Social Carrying Capacity in Beach Management in Barbados. J. Coast. Res. 2011, 61, 14–23. [Google Scholar] [CrossRef]
  66. Kwon, Y.; Kim, J.; Kim, J.; Park, C. Mitigating the Impact of Touristification on the Psychological Carrying Capacity of Residents. Sustainability 2021, 13, 2737. [Google Scholar] [CrossRef]
  67. Klanjšček, J.; Geček, S.; Marn, N.; Legović, T.; Klanjscek, T. Predicting perceived level of disturbance of visitors due to crowding in protected areas. PLoS ONE 2018, 13, e0197932. [Google Scholar] [CrossRef]
  68. Tokarchuk, O.; Barr, J.C.; Cozzio, C. Estimating Destination Carrying Capacity: The Big Data Approach. Travel and Tourism Research Association: Advancing Tourism Research, Globally. 51. Available online: https://scholarworks.umass.edu/ttra/2021/research_papers/51 (accessed on 15 August 2022).
  69. Tokarchuk, O.; Barr, J.C.; Cozzio, C. How much is too much? Estimating tourism carrying capacity in urban context using sentiment analysis. Tour. Manag. 2022, 91, 104522. [Google Scholar] [CrossRef]
  70. Wang, Y.; Zhang, J.; Wang, C.; Yu, Y.; Hu, Q.; Duan, X. Assessing tourism environmental psychological carrying capacity under different environmental situations. Asia Pac. J. Tour. Res. 2020, 26, 132–146. [Google Scholar] [CrossRef]
  71. Murata, T.; Totsuka, K. Agent-Based Simulation for Avoiding the Congestions of Tourists. In Proceedings of the 2021 5th IEEE International Conference on Cybernetics (CYBCONF), Sendai, Japan, 8 June 2021; pp. 56–60. [Google Scholar] [CrossRef]
  72. JASS. Interdisciplinary Journal for the Exploration and Understanding of Social Processes by Means of Computer Simulation. Available online: https://www.jasss.org/JASSS.html (accessed on 15 September 2022).
  73. Winter Simulation Conference Archive. Available online: https://informs-sim.org/ (accessed on 15 September 2022).
  74. COMSES. Collection of Resources for Computational Model-Based Science. Available online: https://www.comses.net (accessed on 15 September 2022).
  75. Crols, T.; Malleson, N. Quantifying the ambient population using hourly population footfall data and an agent-based model of daily mobility. GeoInformatica 2019, 23, 201–220. [Google Scholar] [CrossRef] [PubMed]
  76. Nicholls, S.; Amelung, B.; Student, J. Agent-Based Modeling: A Powerful Tool for Tourism Researchers. J. Travel Res. 2017, 56, 3–15. [Google Scholar] [CrossRef]
  77. Orsi, F.; Geneletti, D. Transportation as a protected area management tool: An agent-based model to assess the effect of travel mode choices on hiker movements. Comput. Environ. Urban Syst. 2016, 60, 12–22. [Google Scholar] [CrossRef]
  78. Lew, A.; McKercher, B. Modeling Tourist Movements. Ann. Tour. Res. 2006, 33, 403–423. [Google Scholar] [CrossRef]
  79. Qiu, R.; Xu, W.; Li, S. Agent-based Modeling of the Spatial Diffusion of Tourist Flow—A Case Study of Sichuan, China. J. China Tour. Res. 2016, 12, 85–107. [Google Scholar] [CrossRef]
  80. Pizzitutti, F.; Mena, C.F.; Walsh, S.J. Modelling Tourism in the Galapagos Islands: An Agent-Based Model Approach. J. Artif. Soc. Soc. Simul. 2014, 17, 14. [Google Scholar] [CrossRef]
  81. Owaidah, A.; Olaru, D.; Bennamoun, M.; Sohel, F.; Khan, N. Review of Modelling and Simulating Crowds at Mass Gathering Events: Hajj as a Case Study. J. Artif. Soc. Soc. Simul. 2019, 22, 9. [Google Scholar] [CrossRef]
  82. Batty, M. Cities and Complexity: Understanding Cities with Cellular Automata, Agent-Based Models, and Fractals; The MIT Press: Cambridge, MA, USA, 2007. [Google Scholar]
  83. Batty, M. The New Science of Cities; The MIT Press: Cambridge, MA, USA, 2013. [Google Scholar]
  84. Lee, J.-S.; Filatova, T.; Ligmann-Zielinska, A.; Hassani-Mahmooei, B.; Stonedahl, F.; Lorscheid, I.; Voinov, A.; Polhill, G.; Sun, Z.; Parker, D.C. The Complexities of Agent-Based Modeling Output Analysis. J. Artif. Soc. Soc. Simul. 2015, 18. [Google Scholar] [CrossRef]
  85. Grimm, V.; Berger, U.; Bastiansen, F.; Eliassen, S.; Ginot, V.; Giske, J.; Goss-Custard, J.; Grand, T.; Heinz, S.K.; Huse, G.; et al. A standard protocol for describing individual-based and agent-based models. Ecol. Model. 2006, 198, 115–126. [Google Scholar] [CrossRef]
  86. Polhill, J.G.; Parker, D.; Brown, D.; Grimm, V. Using the ODD Protocol for Describing Three Agent-Based Social Sim-ulation Models of Land-Use Change. J. Artif. Soc. Soc. Simul. 2008, 11, 3. [Google Scholar]
  87. Polhill, G.; Sutherland, L.-A.; Gotts, N.M. Using Qualitative Evidence to Enhance an Agent-Based Modelling System for Studying Land Use Change. J. Artif. Soc. Soc. Simul. 2010, 13, 10. [Google Scholar] [CrossRef]
  88. Müller, B.; Balbi, S.; Buchmann, C.M.; de Sousa, L.; Dressler, G.; Groeneveld, J.; Klassert, C.J.; Le, Q.B.; Millington, J.D.; Nolzen, H.; et al. Standardised and transparent model descriptions for agent-based models: Current status and prospects. Environ. Model. Softw. 2014, 55, 156–163. [Google Scholar] [CrossRef]
  89. Wilensky, U. NetLogo; Center for Connected Learning and Computer-Based Modeling, Northwestern University: Evanston, IL, USA, 1999; Available online: https://ccl.northwestern.edu/netlogo/docs/copyright.html (accessed on 15 September 2022).
  90. Stonedahl, F.; Wilensky, U. BehaviorSearch; Center for Connected Learning and Computer Based Modeling; Northwestern University: Evanston, IL, USA, 2010; Available online: https://www.behaviorsearch.org/about.html (accessed on 15 September 2022).
  91. Heppenstall, A.; Malleson, N.; Crooks, A. Space, the Final Frontier: How Good are Agent-Based Models at Simulating Individuals and Space in Cities? Systems 2016, 4, 9. [Google Scholar] [CrossRef]
  92. Wozniak, M.; Dziecielski, M. Should I Turn or Should I Go? Simulation of Pedestrian Behaviour in an Urban Environment. J. Simul. 2022. [Google Scholar] [CrossRef]
  93. Edmonds, B.; Adoha, L. Using agent-based simulation to inform policy—What could possibly go wrong. In Multi-Agent-Based Simulation XIX, Proceedings of the 19th International Workshop, MABS 2018, Stockholm, Sweden, 14 July 2018; Davidson, P., Verhargen, H., Eds.; Springer: Cham, Germany, 2019; pp. 1–16. [Google Scholar] [CrossRef] [Green Version]
Figure 1. A mind map of basic aspects of optimizing tourism impacts. Source: inspired by [2,3,8,9,10,11].
Sustainability 14 12490 g001
Figure 2. A mind map of selected visitor management tools. Source: inspired by [9,14,22,27,56].
Sustainability 14 12490 g002
Figure 3. Closed mountain trail in Iceland with signs of erosion. Source: [45].
Sustainability 14 12490 g003
Figure 4. Process chart of the main research stages.
Sustainability 14 12490 g004
Figure 5. Mind map of visitor impacts on the protected area and the consequences of their behaviour in the protected area as a basis for inputs and outputs of the agent-based model. Source: own elaboration, based on [2,9,14,21,22,27].
Sustainability 14 12490 g005
Figure 6. Model 1–Example of the distribution of visitor-agents (a) at four selected locations of random network (b) during the day (7:00–22:00). Notice the significant morning and afternoon peaks. Source: own elaboration.
Sustainability 14 12490 g006
Figure 7. Model 2–Example of the distribution of visitor-agents (a) in four selected locations in the Region of Oheb Castle (b) during the day (7:00–22:00). Source: own elaboration.
Sustainability 14 12490 g007
Figure 8. Frequency of encounters with other tourists during the trip: the horizontal axis shows the number of other people the visitor-agent met during the last hour; the vertical axis shows the frequency of these encounters. Source: own elaboration.
Sustainability 14 12490 g008
Figure 9. The number of visitors (visitor-agents) that a particular visitor-agent encounters during the day when entering the territory of Oheb Castle from entry point A (see map in Figure 6) at different entrance times. Source: own elaboration.
Sustainability 14 12490 g009
Figure 10. The number of visitors (visitor-agents) that a particular visitor-agent encounters during the day when entering the territory of Oheb Castle from entry point B (see map in Figure 6) at different entrance times. Source: own elaboration.
Sustainability 14 12490 g010
Figure 11. The number of visitors (visitor-agents) that a particular visitor-agent encounters during the day when entering the territory of Oheb Castle from entry point C (see map in Figure 6) at different entrance times. Source: own elaboration.
Sustainability 14 12490 g011
Publisher’s Note: MDPI stays neutral with regard to jurisdictional claims in published maps and institutional affiliations.

