Article

Effects of Forest Vegetation Restoration on Soil Organic Carbon and Its Labile Fractions in the Danxia Landform of China

1
College of Resources and Environment, Zunyi Normal University, Zunyi 563006, China
2
College of Biology and Agricultural Science and Technology, Zunyi Normal University, Zunyi 563006, China
3
Guizhou Xishui National Nature Reserve Administration, Xishui 564600, China
*
Author to whom correspondence should be addressed.
Sustainability 2022, 14(19), 12283; https://doi.org/10.3390/su141912283
Submission received: 6 August 2022 / Revised: 9 September 2022 / Accepted: 20 September 2022 / Published: 27 September 2022

Abstract

:
The Danxia landform is a unique red bed landform in China. The effects of vegetation restoration on soil organic carbon (SOC) components are still poorly understood in the Danxia landform region of southwest China. In this study, soil samples were collected from selected five different vegetation restoration types (shrub (SH), mixed conifer–broadleaf forest (MCBF), evergreen broad-leaved forest (EBF), Chinese fir forest (CFF), and bamboo forest (BF)) at 0–30 cm depth to discuss the concentrations and stocks of SOC and its labile organic carbon (LOC) fractions ((dissolved organic C (DOC), microbial biomass C (MBC), and easily oxidized organic C (EOC)) and their relationship with soil physicochemical properties and enzyme activities. The results indicated that the contents of SOC and LOC fractions as well as SOC stocks declined with increasing soil depth in five vegetation restoration types. At 0–30 cm depth, BF and CFF showed higher the average concentrations and total stocks of SOC and EOC compared with SH, EBF, and MCBF. The highest average DOC content was in BF, but no significant differences was observed in the total DOC stocks among five vegetation restoration types. BF and EBF showed significantly greater average MBC concentrations and total MBC stocks than other vegetation restoration types. SOC and its LOC fractions were positively correlated with soil moisture and three enzyme activities in different degrees under the five vegetation restoration types and closely related with total nitrogen (TN) and total phosphorus (TP) except for TP of CFF and BF and negatively affected by pH (except for CFF and the DOC and MBC of MCBF) and BD. Generally, soil TN, TP, and invertase were found to be the main driver factors for soil carbon accumulation. However, the overall levels of SOC and its labile fractions indicate that BF had the strongest carbon storage capacity, followed by CFF and EBF. This study can provide a good reference for ecosystem management and the selection of appropriate restoration strategies in Danxia landform regions.

1. Introduction

The red beds area covers 9.16 × 10⁵ km2, accounting for 9.5% of the total land area of China [1], which exceeds the loess area (6.3 × 10⁴ km2) [2] and is close to the total area of bare carbonate rock (9.1 × 10⁴ km2) [3]. Furthermore, there are 144 million people depending on agriculture or tourism in red bed regions for their livelihoods [4]. Under the influence of temperature difference, moisture, and heavy metals, the red bed soft rock disintegrates easily [5,6] because it is a rock series of coarse and hard red continental clastic accumulation mainly composed of conglomerate, sandstone, mudstone, etc. Many studies have reported that purple soil formed on red bed parent material shows the most serious erosion of all soil types in the Yangtze River Basin [7], especially visible in humid regions [8]. Thus, the erosion in red beds has seriously threatened ecological security. The Danxia landform, covering approximately 8.6% of the total land mass of China, is a unique landscape developed in red beds in China, which is characterized by steep slopes, mostly developed on conglomerate and sandy-conglomerate rocks, and low mechanical strength [9]. Therefore, the ecological environment of Danxia landform regions is very fragile, and soil erosion occurs easily, resulting from specific lithological properties, hilly topographies, wet climates, and human activities in southwest China. This not only threatens the regional ecological environment but also affects the local economic development. Based on it, ecological restoration has become the primary task in the Danxia landform region, and vegetation restoration measures such as returning farmland to forest, afforestation, and closing mountains for natural succession have been vigorously promoted. Vegetation restoration is widely considered to be an important method of reducing soil erosion, improving soil structure, and increasing SOC sequestration [10]. The effect of closed forest on soil erosion and other negative effects caused by land degradation in ecologically fragile areas are very significant. It can effectively avoid the disturbance of human and livestock, lead to the positive succession of vegetation, increase species diversity, and change the community structure. In addition, soil physical and chemical properties improved with the increase of vegetation coverage by natural succession after closed forest, which promoted the accumulation of soil organic carbon (SOC). Recent studies on the effects of natural succession on soil carbon pool after forest restoration are focused on southern and boreal forest areas [11,12]. In the Danxia landform area, people have been paying more attention to the geological setting, structure, and environment of this sediment formation [13]. However, to date, the ecological and associated problems in Danxia landform areas have not been given sufficient attention. Therefore, the effect of forest restoration on soil carbon pool in the Danxia region of southwest China is still unclear.
Ecological restoration is accompanied with increases soil carbon (C) and nitrogen (N) and higher populations of organisms and increased diversity [14]. SOC not only regulates climate by sequestration but also can reflect soil health; therefore, it plays an critical role in increasing soil carbon storage, improving soil fertility, soil biological quality, and promoting plant growth [15]. However, SOC pool is composed of sub-pools with different turnover rates and has different sensitivities to environmental changes such as climate, vegetation, topography, and hydrological conditions, etc. [16]. Soil LOC fractions (such as microbial biomass carbon (MBC), dissolved organic carbon (DOC), and easily oxidized organic carbon (EOC), etc.) play a crucial role in promoting microbial activity and nutrient cycling, a series of small but fast turnovers that are easily be oxidized and decomposed [17]. Compared with total soil carbon, soil LOC fractions can quickly reflect the fluctuation of soil carbon pool caused by soil management practices and environmental changes [18]. Furthermore, these components directly facilitate soil biogeochemical processes and respond to climate change over short periods of time [19]. Hence, LOC is more helpful to understanding soil carbon dynamics in the early stage and becomes an important indicator for predicting and evaluating SOC stock changes during forest sustainable management.
The Chishui Danxia landform region is a Jurassic red rock distribution area in southwest China, covering an area of 3412 km2 [20]. As the largest and most spectacular Danxia landform area in China, the Chishui Danxia was officially admitted to the World Heritage list together with Langshan in Hunan province, Danxia mountain in Guangdong province, Taining in Fujian province, Longhu Mountain in Jiangxi province, and Jianglang Mountain in Zhejiang province as “China Danxia” in 2010 [21]. Before the 1980s, the ecological environment in the Chishui Danxia landform region gradually deteriorated due to the special geologic and climatic conditions and human disturbances such as deforestation, steep slope reclamation, road construction, etc. These resulted in low forest coverage rate, serious soil erosion, rocky desertification, and the loss of biodiversity [22], which seriously affect the region’s carbon sink function. Since the “Grain-for-Green” program was carried out in China in 1999, the vegetation in this region has gradually recovered via forest enclosure under the support of the government’s policies. In order to explore the effects of forest vegetation restoration, we investigated five typical vegetation types (i.e., shrub (SH), mixed conifer–broadleaf forest (MCBF), evergreen broad-leaved forest (EBF), Chinese fir forest (CFF), and bamboo forest (BF)) in the Chishui Danxia landform region. The main aims of this study were to (i) evaluate the concentrations and stocks of total SOC and its LOC fractions in different vegetation restoration types and (ii) whether the response of these soil LOC fractions in different vegetation restoration types vary with soil depth, identifying the main environmental factors that control the accumulation of soil LOC fractions. The results could provide a scientific basis for the selection of appropriate ecological restoration practices and carbon management in the Danxia landform region. We hypothesized that: (a) there are differences among the contents and stocks of soil organic carbon fractions in various of different vegetation restoration types, and (b) soil physicochemical properties and enzymes related to the carbon cycle have significant effects on soil organic carbon fractions.

2. Materials and Methods

2.1. Study Site

The study was conducted in August 2020 at Sancha River Experimental Station of Xishui subtropical evergreen broad-leaved Forest National Nature Reserve (28°07′–28°34′ N, 105°50′–106°29′ E) in the Chishui Danxia landform area, which is located on the northwest Xishui County, Guizhou province, southwest China. The region belongs to a subtropic to warm temperate humid monsoon climate zone, with mean annual temperature of 14.7 °C and mean annual precipitation of 770.3–1661.0 mm, mainly occurring from May to October. The terrain is mainly characterized by the “V”-shaped river valley with approximate elevation range of 875 to 1066 m. The soil is acidic, mostly purple soil (inceptisol or regosols), followed by yellow soil (HaplicLuvisols), and yellow-brown soil (TypicPaleudalfs) is the least. These soil types are characterized by barren, weak cohesion and poor erosion resistance.
The reserve straddles the Chishui River and its tributary Xishui River, covering an area of 5.19 × 10⁴ ha, as a typical Danxia landscape [23]. From the 1950s to 1980s, this region was seriously disturbed by deforestation, understory grazing, and cultivation on the slopes. However, under the support of the construction of national ecological public forest and the project of returning farmland to forest, the local government has strengthened the management and protection of this area by closing the forest. Since 1992, the degraded mountain forest has gradually recovered, and the vegetation coverage has increased significantly through natural succession.

2.2. Experimental Design and Soil Sampling

Soil samples were collected from five typical vegetation restoration types along an altitude gradient (i.e., shrub (SH), mixed conifer–broadleaf forest (MCBF), evergreen broad-leaved forest (EBF), Chinese fir forest (CFF), and bamboo forest (BF)) in study area. The basic information of each vegetation type is shown in Table 1. Three replicate sampling quadrants (10 m × 10 m) were randomly established in each vegetation type. To reduce potential edge effects, quadrants of the same vegetation type are more than 10 m apart from the forest edge. Before soil samples were collected, litterfall were gathered using a steel rake from three areas of 2.0 m × 2.0 m in each quadrant. After removing the litter layer, 15 sampling points were randomly selected for soil collection at 0–30 cm depth with a sampling interval of 10 cm using a soil-drill sampler (4 cm inner diameter) from each of the independent replicate quadrants. The soils from the same depth were thoroughly mixed to make a composite sample. A total of 45 composite soil samples were obtain from five vegetation types (5 vegetation types × 3 soil depths × 3 quadrants). Five soil cores were collected to determine bulk density of each soil layer. All samples were placed in aseptic sealed plastic bags and immediately stored in portable cryogenic refrigerator until they were transported to the laboratory. The soil samples were sieved (2 mm) to remove visible impurities, such as stone and plant roots, and then divided into three parts. One part of the samples was as used soon as possible to determine the soil moisture. The second part of the samples were stored at 4 °C for determination of MBC and DOC within one week of sampling, whereas the other soil subsamples were air-dried to analyze SOC, EOC, enzymatic activities (invertase, cellulase, and catalase), and other physicochemical properties. Basic soil properties are presented in Table 2.

2.3. Laboratory Analysis

2.3.1. Soil Physiochemical Properties and Dry Weight of Litterfall

Soil physicochemical properties were analyzed by the methods of Lu [24]. Soil pH was measured in a 1:2.5 (soil: deionized water). Soil moisture was measured by the oven-dry method at 105 ± 2 °C. The soil bulk density (BD) of each depth was determined using the cutting ring method. Total nitrogen (TN) was determined via the Kjeldahl method using the Kjeltec Auto Analyzer (Behr Labor Technik, Germany). Total phosphorus (TP) in the samples was measured using molybdenum-antimony resistance colorimetric method after digestion of soil with a mixed acid solution of H2SO4-HClO4. The dry weight of litterfall was oven-dried at 80 °C to a constant weight.

2.3.2. SOC and Soil LOC Fractions Analyses

The SOC content was analyzed by a KCr2O7-H2SO4 wet oxidation procedure and titration with FeSO4 [25]. SOC stocks (Mg C ha−1) in the corresponding soil layer were calculated as [26].:
Carbon stock (t ha−1) = Carbon concentration (%) × bulk density (g cm−3) × soil depth (cm)
Soil LOC fractions were performed as follows: soil MBC was determined by the CHCl3 fumigation–extraction method [27]. For this analysis, the fumigated for 24 h with ethanol-free chloroform, and nonfumigated fresh soils were extracted with 0.5 M K2SO4 (soil: extraction ratio of 1:4) by shaking for 30 min before being centrifuged and filtered. DOC was determined using the method described by Jones and Willett [28]. Fresh soil samples were extracted with deionized water (soil: distilled water ratio of 1:2.5) for 30 min on a shaker at approximately 230 rpm and centrifuged for 20 min at 8000 rpm. The supernatant was filtered through a 0.45 μm membrane filter. The filtrate of MBC and DOC was measured by TOC analyzer (Shimazu, SOC-VCPH, Japan). EOC was measured via oxidation with 0.333 M KMnO4 [29]. Finely ground air-dried soil samples were reacted with 0.333 mmol L−1 KmnO4 by shaking at 60 rpm for 1 h. The suspension was then centrifuged at 2000 rpm for 5 min. The supernatant was diluted and measured spectrophotometrically at 565 nm.

2.3.3. Soil Enzyme Activities Analysis

Soil invertase and cellulase activities were analyzed by the methods of Guan [30], and sucrose and carboxymethylated cellulose were used as substrates, respectively. The invertase activity was expressed as the mass (mg) of glucose in 1 g of soil after 24 h, and the cellulose activity was expressed as the mass (mg) of glucose in 1 g of soil after 72 h. Catalase activity was determined using the potassium permanganate titration [31]. Then, 40 mL of distilled water and 5 mL of hydrogen peroxide solution (3%) were added to 2 g of soil, which was shaken for 30 min and then filtered. We then took 25 mL of the filtrate and titrated it to pink with 0.1 M potassium permanganate.

2.4. Statistical Methods

All data and graphics for the experiment were carried out in Microsoft Excel 2007, and statistical analyses were with IBM-SPSS 18.0 [32]. One-way ANOVA was used to explore the differences of the different vegetation restoration types within one soil layer and to analyze the differences of different soil layers in the same vegetation type. Comparisons among means were made using the least significant difference (LSD) test calculated at p < 0.05. The relationships between soil LOC fractions and soil physicochemical properties and enzyme activities were tested with the 18.0 procedure of the IBM-SPSS with an accepted significance level of p < 0.05.

3. Results

3.1. Variation of Soil Physicochemical Properties

The soil physico-chemical characteristics in this study varied among different vegetation restoration types and soil depths (Table 2). There was no consistent change trend in pH value of five vegetation restoration types with the increase of soil depth. The mean pH in SH was alkaline (8.15), while that of the other vegetation soils was slightly acidic, ranging from 5.26 to 6.39 at 0–30 cm depth. Soil moisture, TN, and TP concentrations decreased with soil depth for all vegetation types, but BD showed an opposite trend. The average moisture in SH and MCBF soils at 0–30 cm depth was significantly lower than that in EBF, CFF, and BF. For five vegetation restoration types, BF had the lowest average BD, but its mean contents of TN and TP were significantly higher than those of other four vegetation types at 0–30 cm depth. Generally, the content of TP in these vegetations was 0.13–0.64 g·kg−1, lower than that of TN.

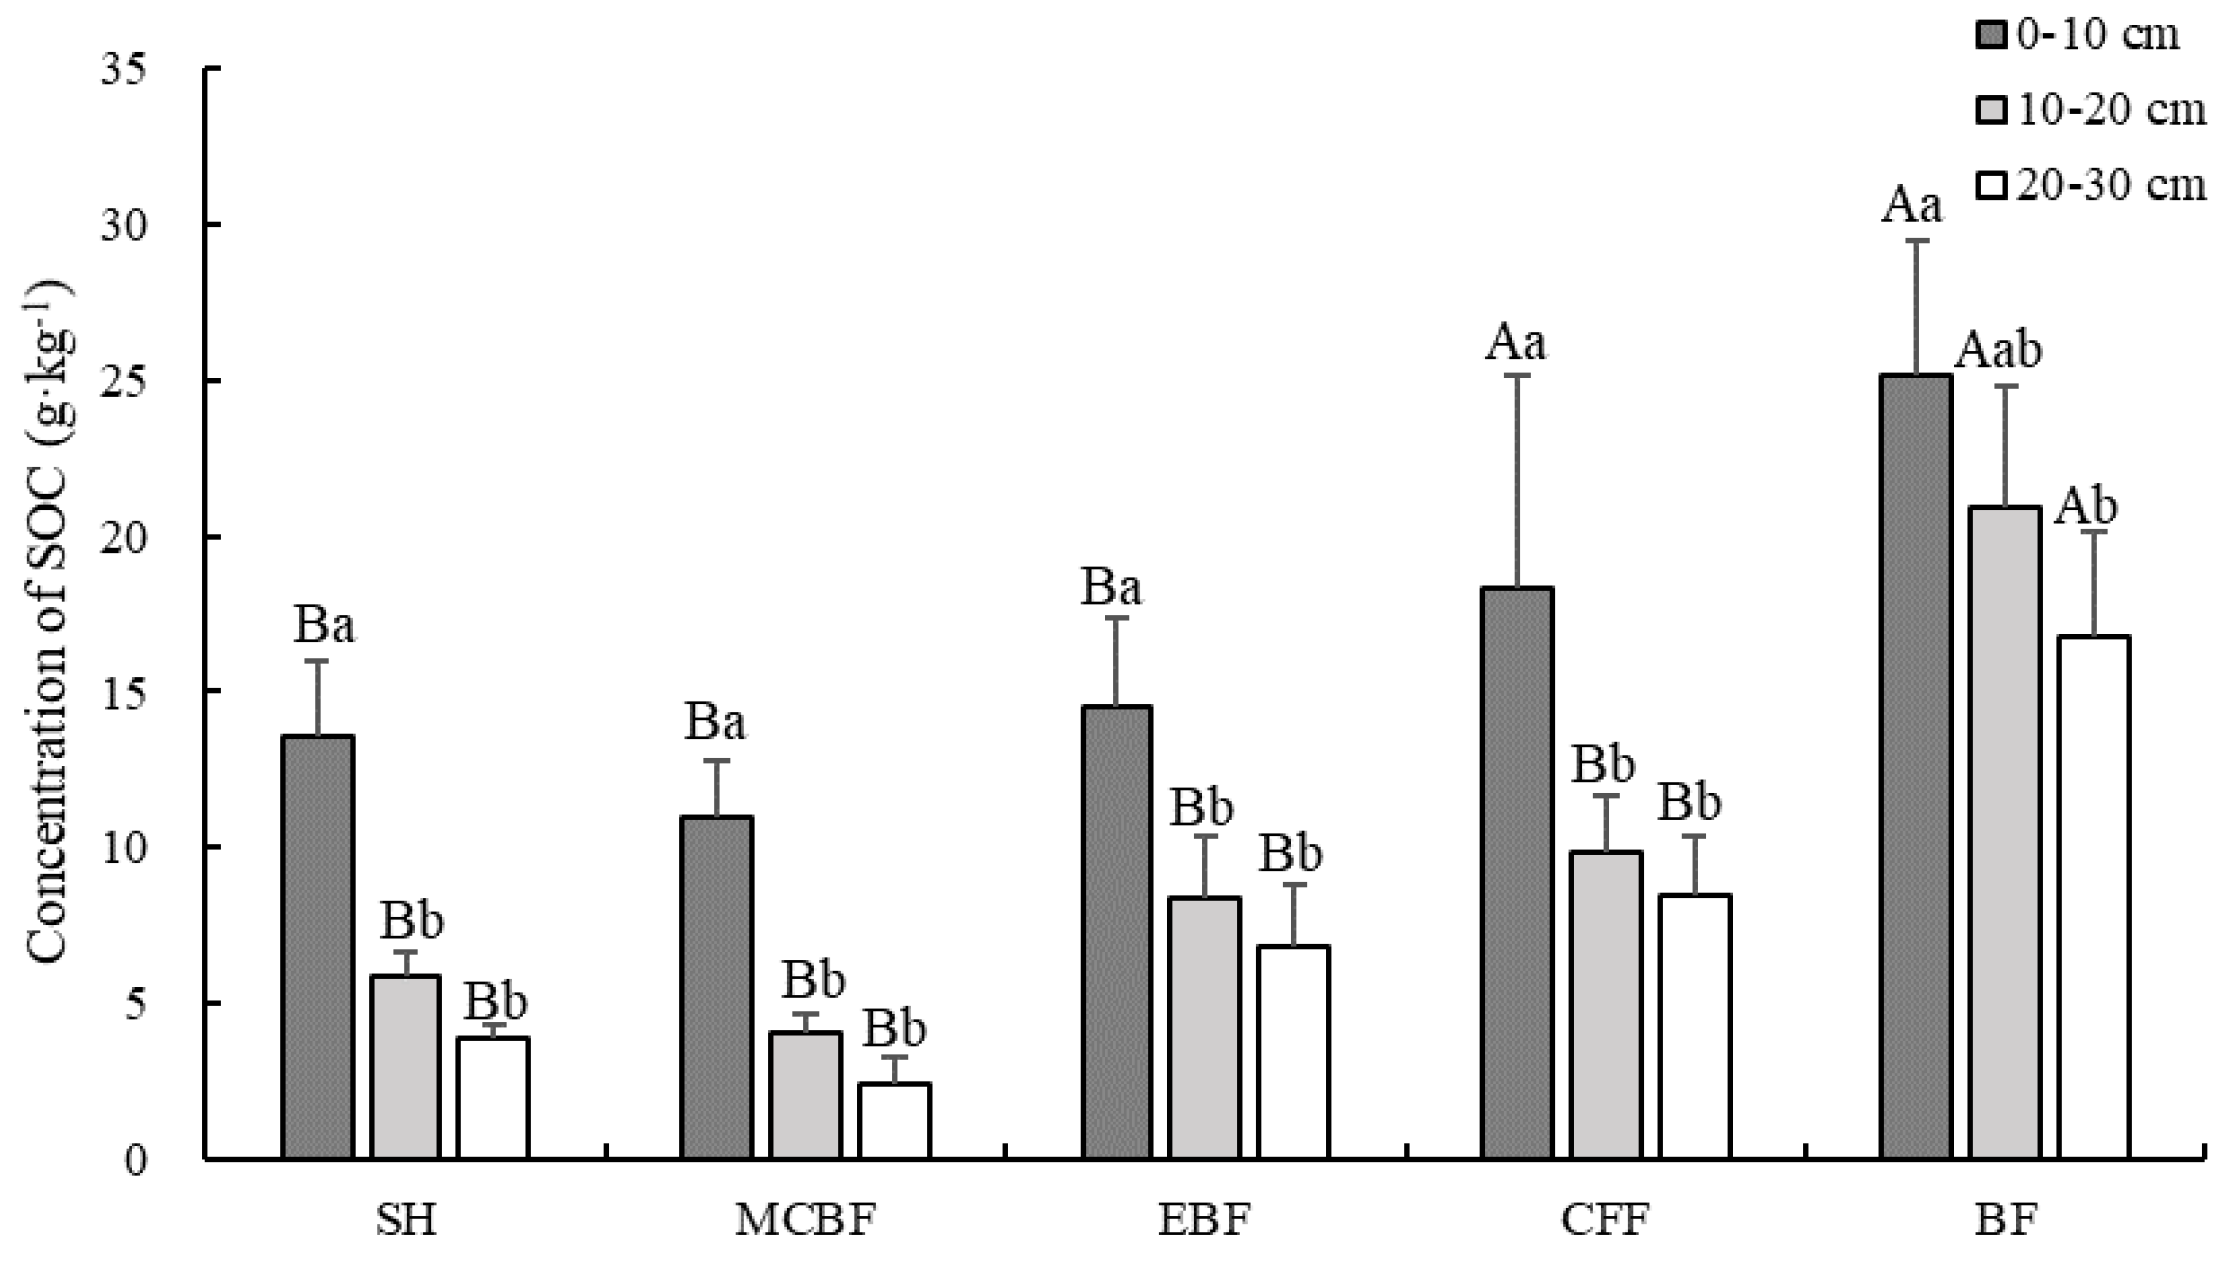
3.2. Changes in SOC Concentrations and SOC Stock

The different vegetation restoration types and soil depths had significant effects on SOC concentrations (Figure 1). The SOC concentrations in five vegetation restoration types generally decreased with depth, ranging from 2.41 g·kg−1 to 25.14 g·kg−1. Within the three soil layers, the highest SOC levels were found in BF, but no significant differences were observed between BF and CFF in 0–10 cm soil layer. At 0–30 depth, the average SOC content of five vegetation restoration types was BF > CFF > EBF > SH > MCBF; moreover, in BF, this was 2.03–3.62 times significantly greater than that in the other vegetation types. Similar to SOC concentration, SOC stock also decreased with soil depth (Table 3). The SOC stocks of all vegetation types, with no significant difference among different soil layers in BF, were significantly higher in the 0–10 cm soil layer than in the two deeper soil layers. In general, the total SOC stock in BF, CFF, EBF, SH, and MCBF was 71.02, 58.76, 44.56, 36.09, and 25.25 t·ha−1, respectively, which is consistent with the order of SOC concentration. These results suggest that BF had significantly higher SOC concentrations and stock when compared with the other four vegetation types.

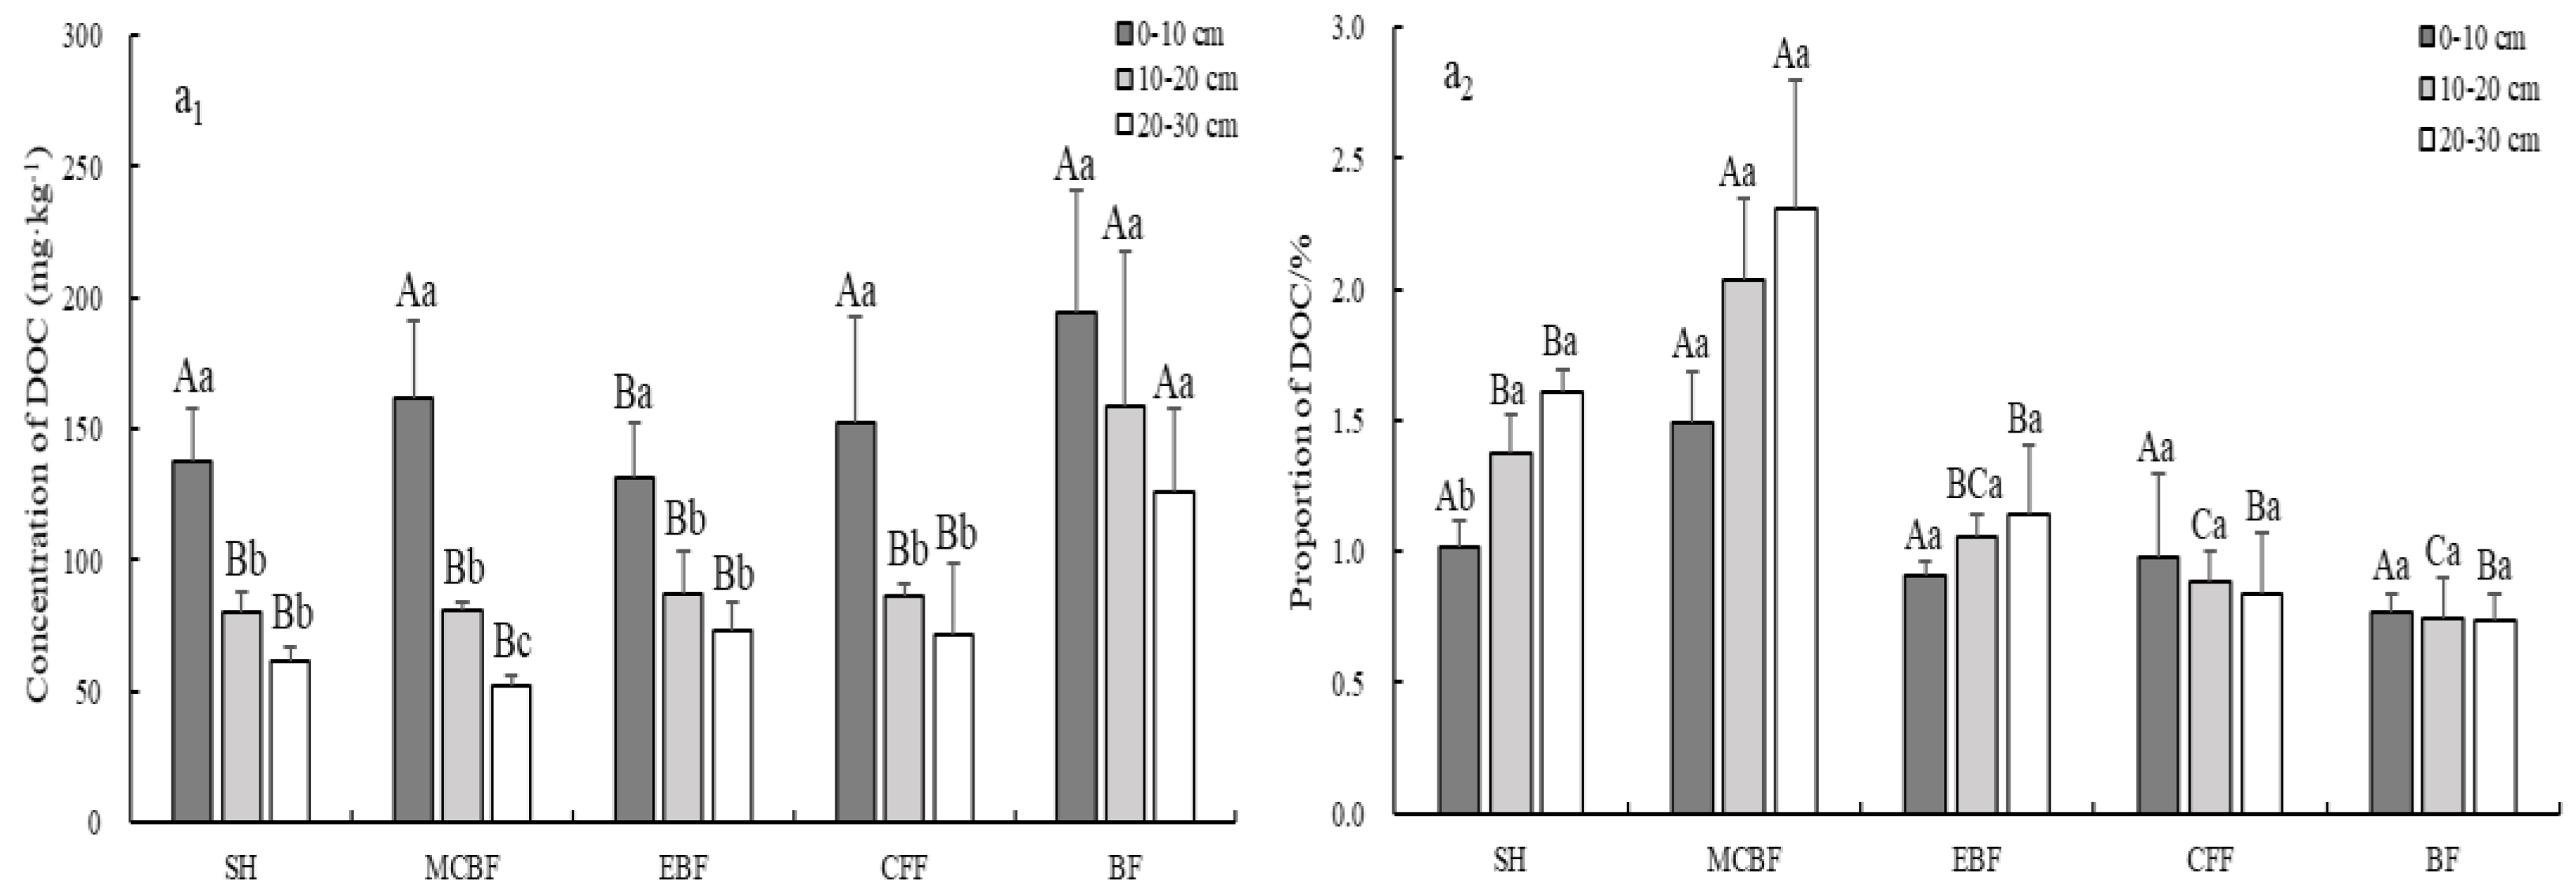
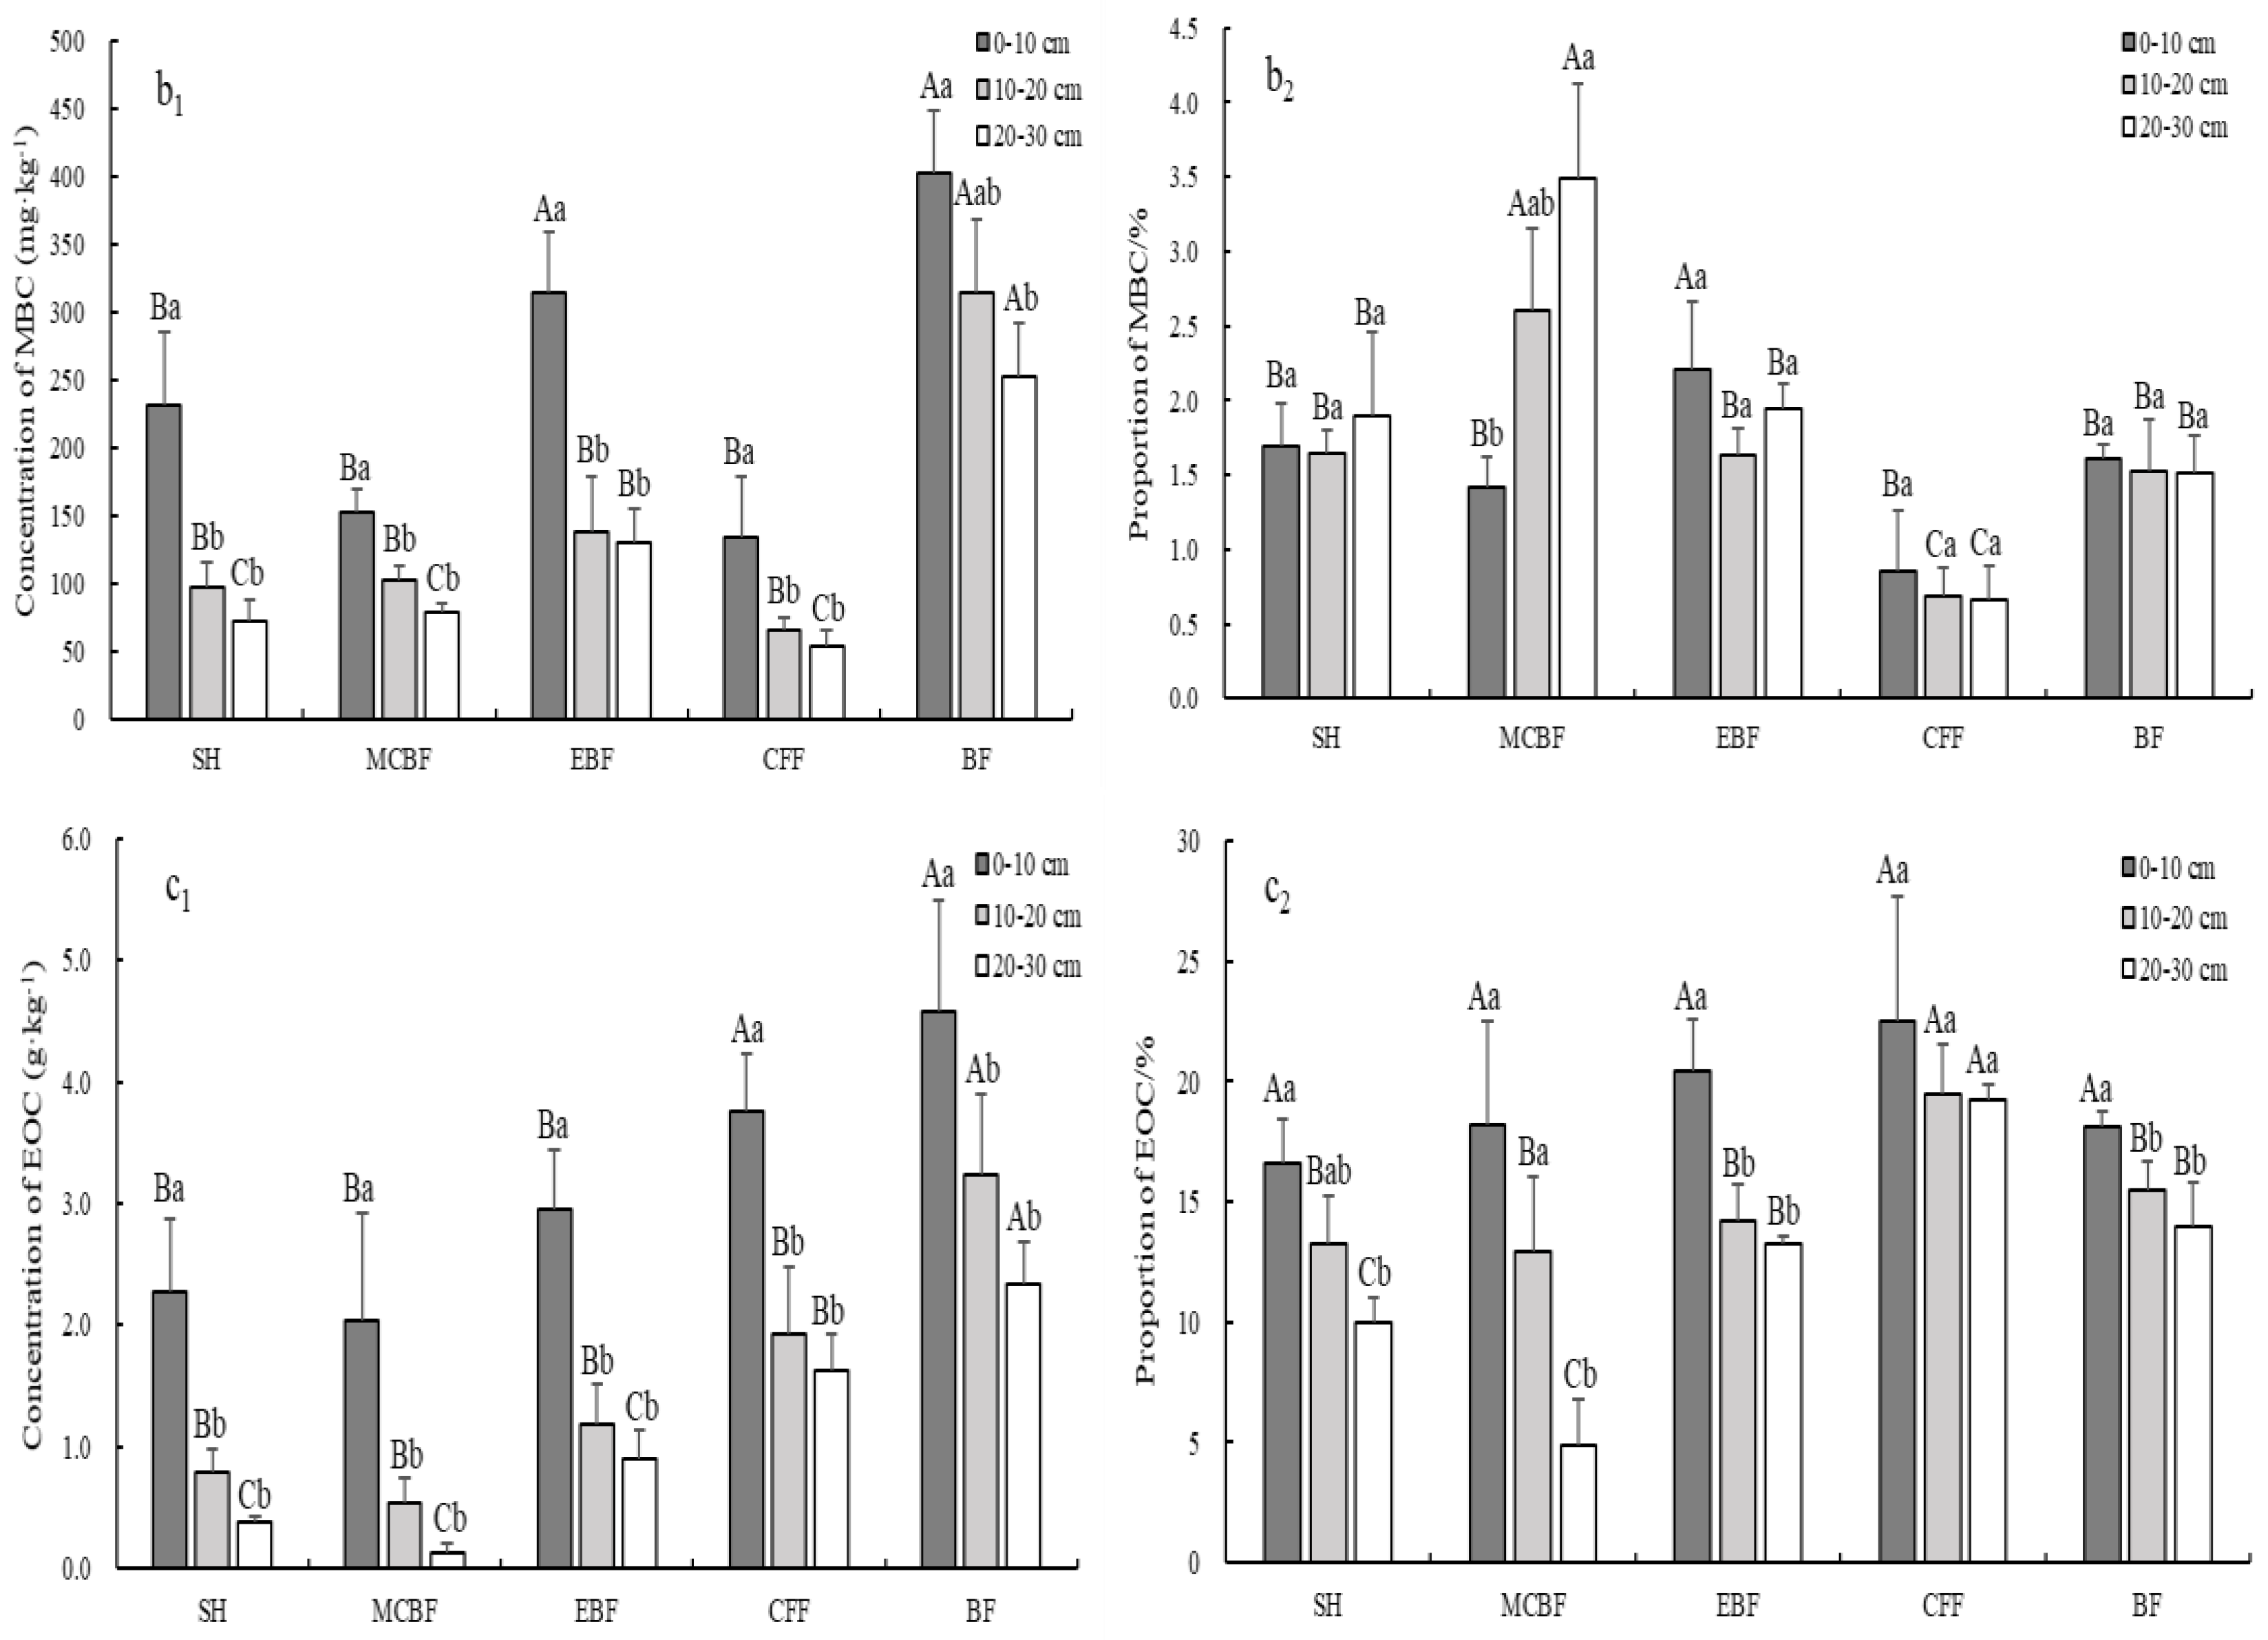
3.3. Variation of Soil LOC Fractions Concentration and Their Stocks

The soil LOC fractions concentration and stocks differed significantly among five vegetation restoration types. The concentration of each soil LOC fraction and its proportion relative to SOC across different vegetation restoration types are shown in Figure 2. Overall, the changes of soil DOC, MBC, and EOC concentrations showed a downward trend with soil depth for all the vegetation types (Figure 2(a1,b1,c1)).
The soil DOC concentration of five vegetation types ranged from 51.79 to 194.30 mg·kg−1 at 0–30 cm depth (Figure 2(a1)). DOC contents in SH, MCBF, CFF, and BF were not significantly different from each other, but they did significant surpass that of EBF at 0–10 cm soil layer, whereas BF had a significantly higher DOC level compared to the other vegetations types in the two deeper soil layers. At 0–30 cm depth, the average DOC content in BF was 1.54–1.71 times significantly greater than that in other vegetation types. The proportions of DOC to SOC in SH, MCBF, and EBF tended to increase with soil depth, whereas that in CFF and BF was opposite (Figure 2(a2)). Nevertheless, DOC comprised very small proportions (0.75–2.31%) of the total SOC at 0–30 cm depth, and the average ratios in SH and MCBF were 1.33% and 1.95%, respectively, which is significantly higher than those in other three vegetation types (0.76–1.03%). DOC stocks decreased with increasing soil depth for all vegetation types and were significantly greater topsoil layer (0–10 cm) than in the two deeper soil layers (20–30 cm) except for BF (Table 3). In the 0–10 cm and 20–30 cm soil layers, DOC stocks showed no significant difference among different vegetation types. Meanwhile, in the 10–20 cm layer, DOC stocks in BF were significantly higher than that in the other vegetation types. However, the DOC stocks ranged between 0.44 and 0.53 t·ha−1 in all vegetation types at 0–30 cm depth, and there was no significant difference among them (Table 3).
As shown in Figure 2(b1), EBF and BF exhibited significantly higher MBC concentration compared to other four vegetation types in the 0–10 cm soil layer, while the MBC value of BF peaked in the two deeper soil layers, being significantly higher than in other vegetation types. At 0–30 cm depth, the mean MBC contents of BF and EBF were 322.58 and 194.20 mg·kg−1, respectively, significantly greater than those of SH, MCBF, and CFF (84.76–133.38 mg·kg−1). The ratios of MBC to SOC ranged from 0.67 to 3.49% in all vegetation types, but there was no consistent trend in soil vertical profile (Figure 2(b2)). In 0–30 cm soil depth, the average ratio of MBC/SOC in MCBF and EBF was 2.50% and 1.93%, respectively, which as significantly higher than that in the other vegetation types (0.74–1.75%). The MBC stocks in all vegetation types generally decreased with increasing soil depth except for EBF and BF (Table 3). Generally, the highest MBC stocks was observed in BF (1.10 t·ha−1), followed by EBF (0.88 t·ha−1), which were significantly greater than those of the other three vegetation types (0.41–0.62 t·ha−1) at 0–30 cm soil depth (Table 3).
Within the three soil layers, the EOC concentration was greater by 27.8–73.3% in BF relative to other vegetation types; however, there was no significant difference between BF and CFF at the 0–10 cm soil layer (Figure 2(c1)). At 0–30 cm soil depth, the average EOC concentrations in BF and CFF were 3.38 and 2.44 mg·kg−1, respectively, significantly higher than that in the other three vegetation types (0.90–1.68 mg·kg−1). The ratio of EOC/SOC in all vegetation types varied from 4.85 to 22.50%, and its changes followed the same trend as EOC contents (Figure 2(c2)). The average EOC/SOC value in CFF (20.36%) was significantly higher than that in other vegetation types. Nevertheless, EOC accounted for the highest proportion of SOC compared with DOC and MBC. At 0–30 cm soil depth, the average proportion of EOC was significantly higher in CFF (20.36%) compared with that in the other vegetation types (11.98–15.97%). The EOC stocks of the different vegetation types are shown in Table 3. CFF and BF showed significantly higher total EOC stocks (11.74 and 11.32 t·ha−1, respectively) than the other three vegetation types (3.77–7.52 t·ha−1) in 0–30 cm soil depth.

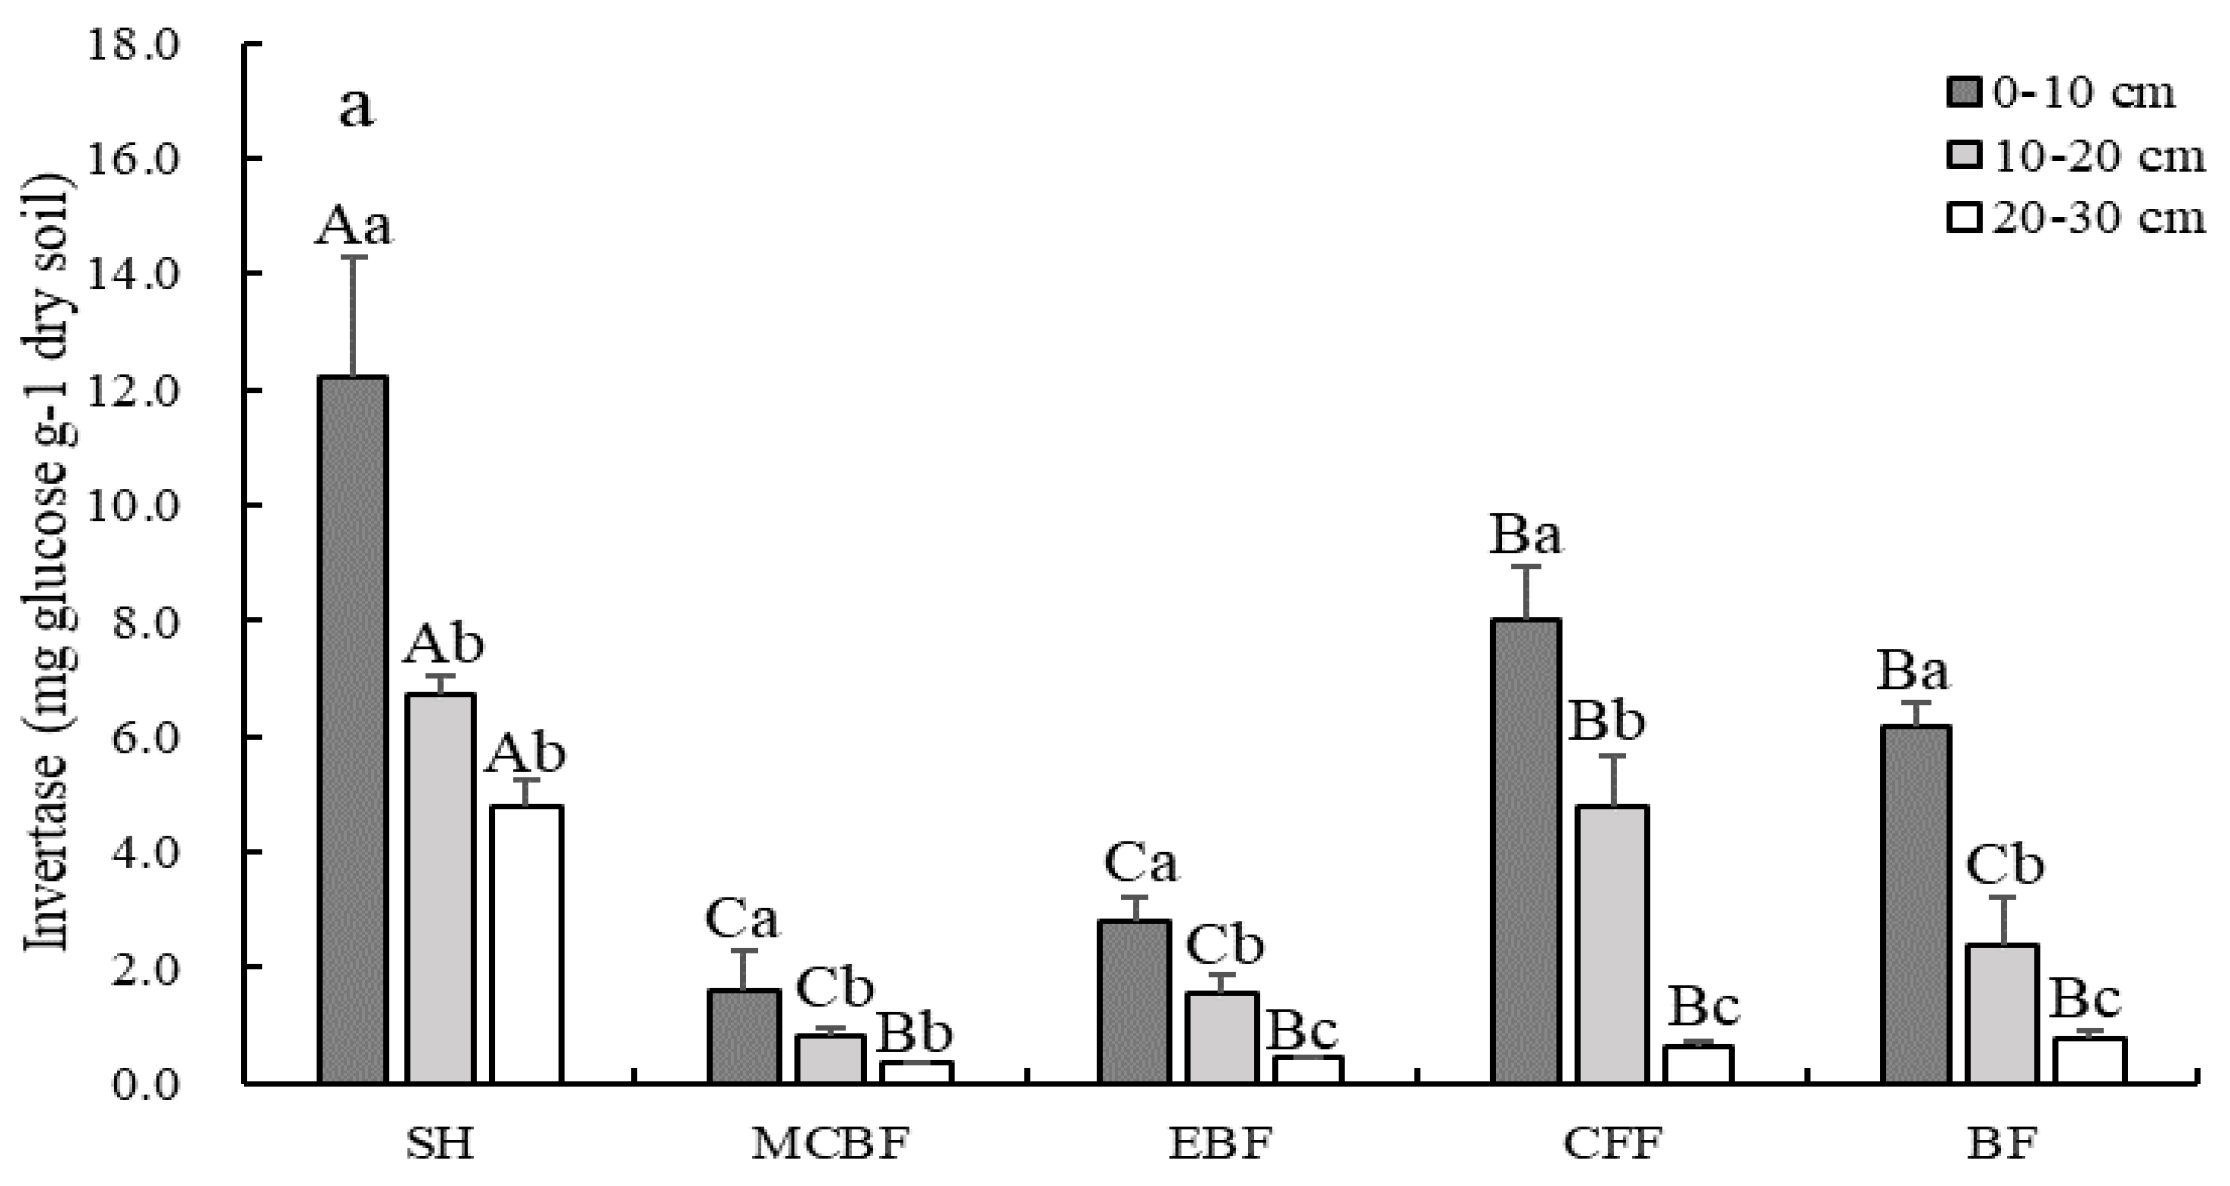
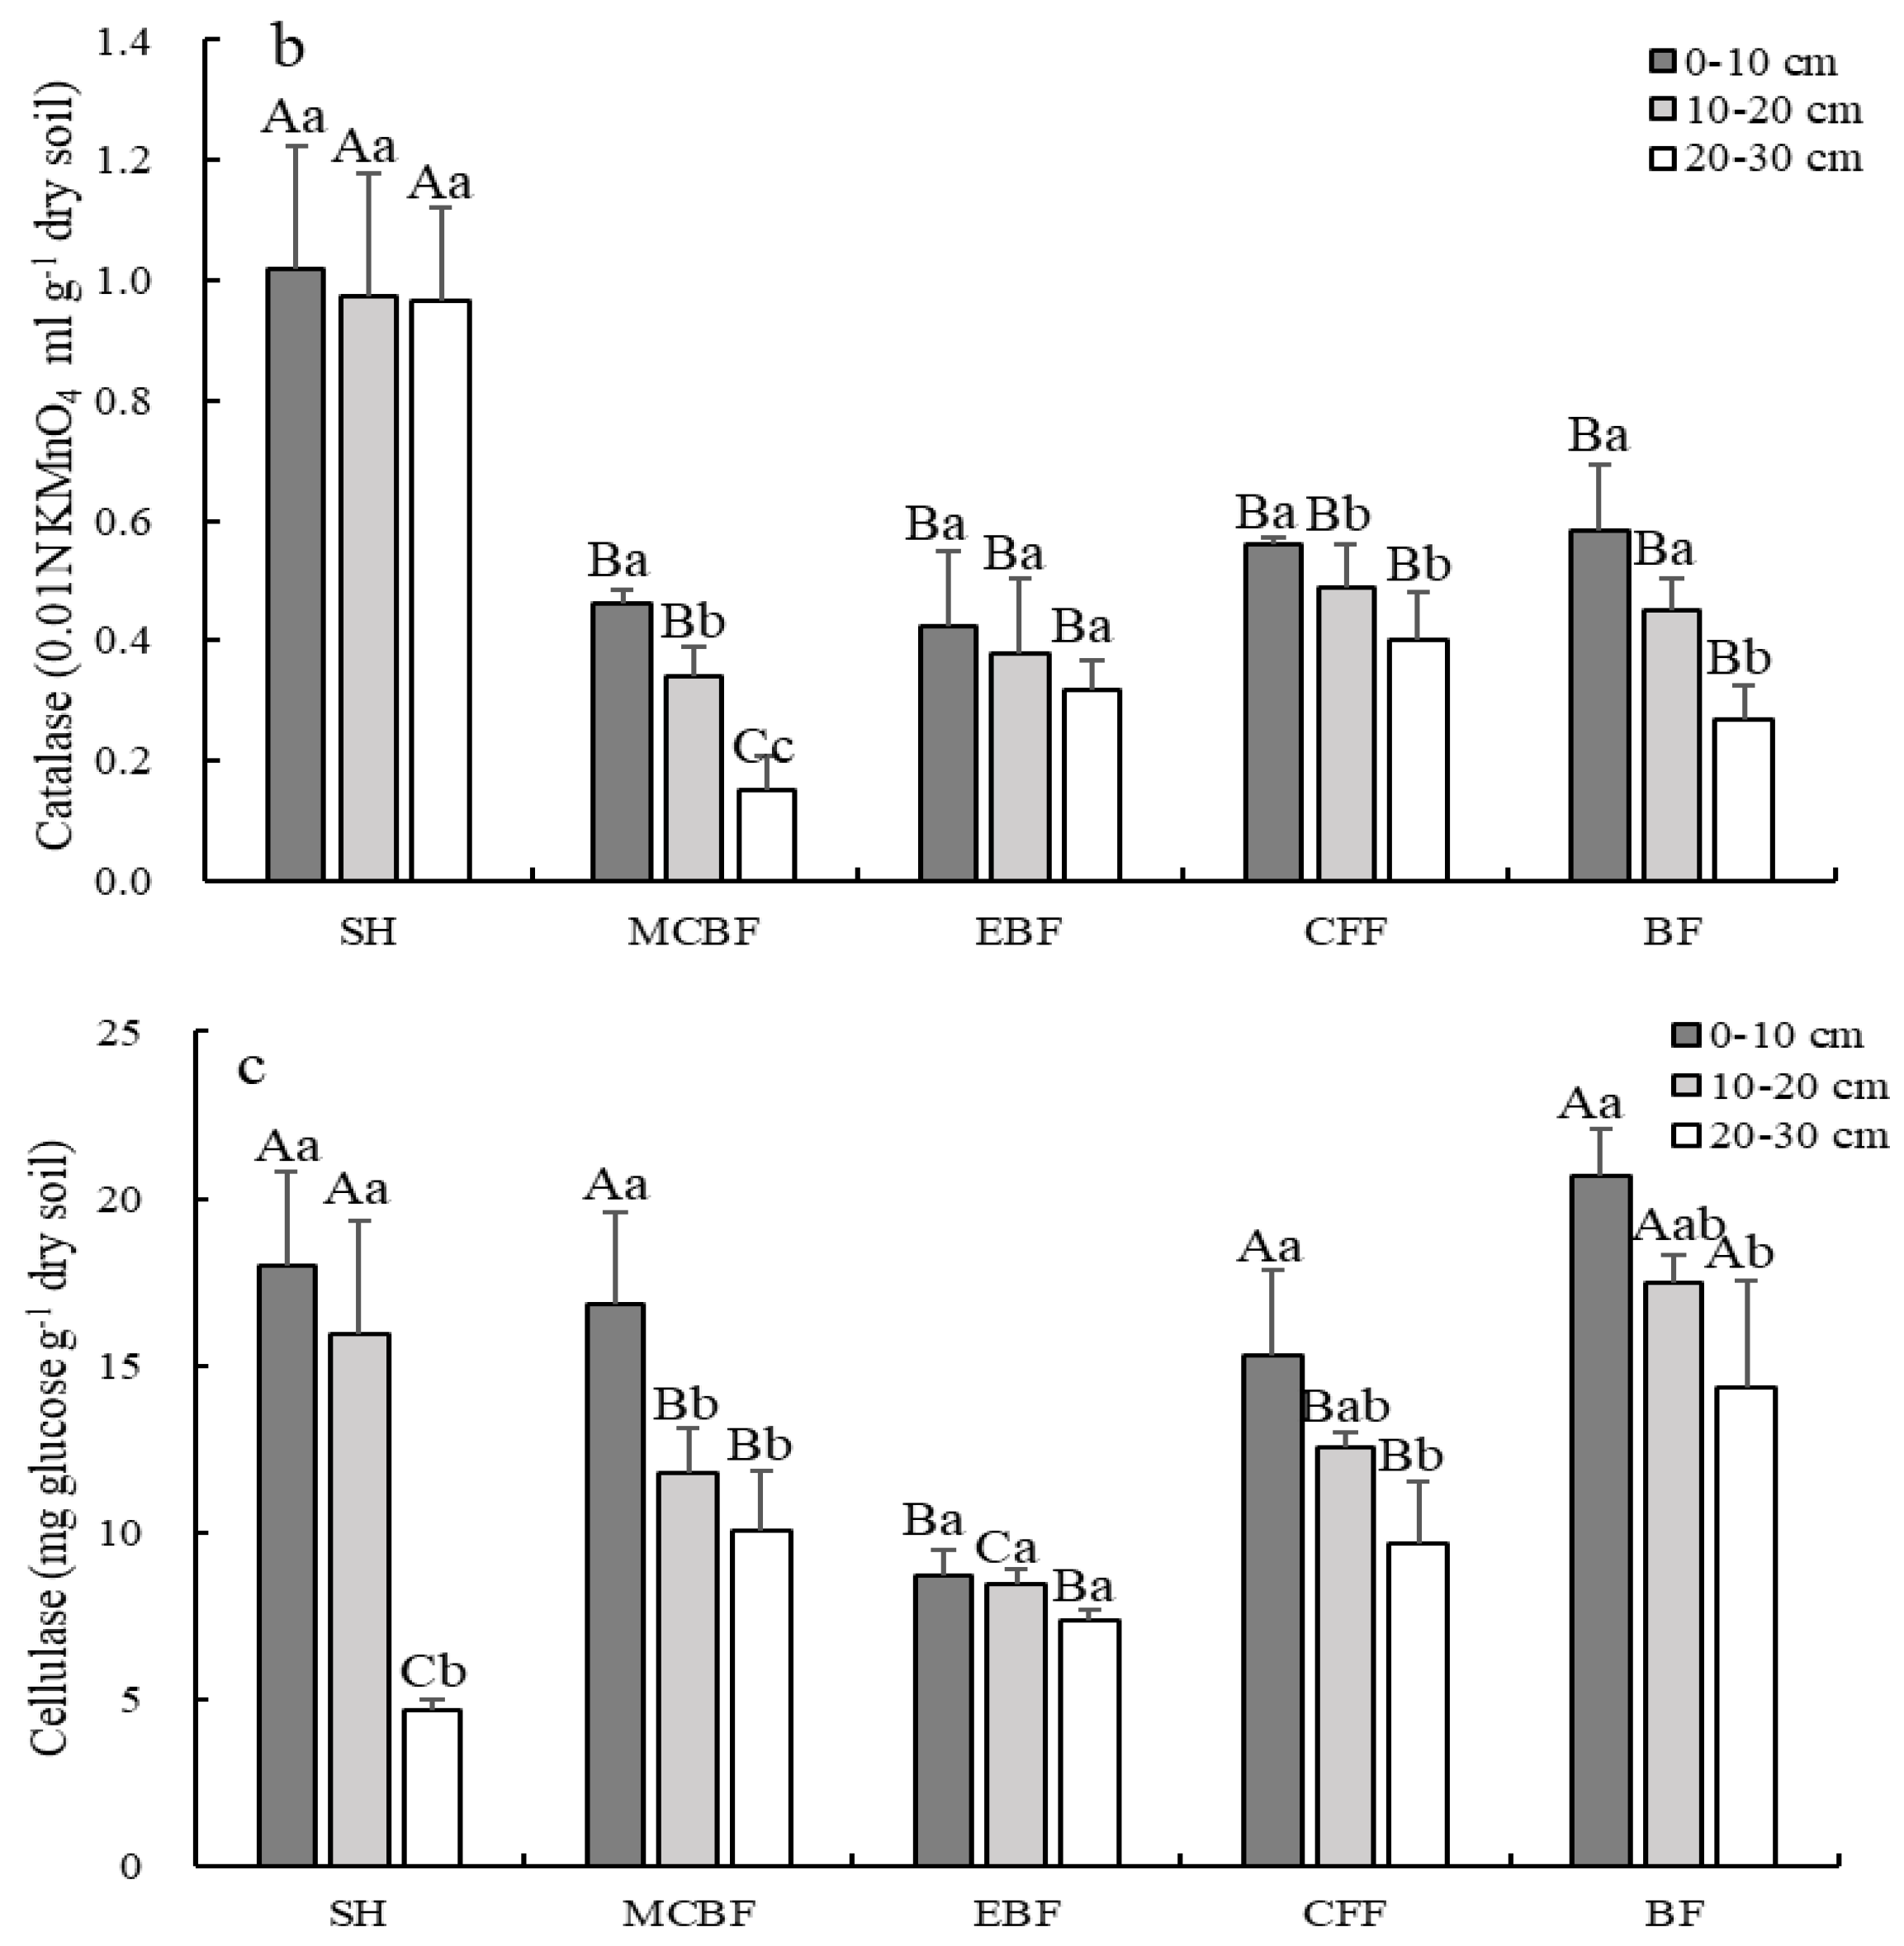
3.4. The Changes of Soil Enzymatic Activities

The changes of enzyme activities are presented in Figure 3. For all vegetation types, the activities of soil invertase and catalase decreased with the increase of soil depth, but there was no consistent change of cellulase activity (Figure 3). It showed 60.8–91.8% of the invertase activity loss from the 0–10 cm to 20–30 cm soil layer, whereas the variation of catalase activity was less distinctive across depths under different vegetation types. However, SH showed significant higher invertase and catalase activities than other vegetation types at three soil layers (Figure 3a,b). Compared to the invertase and catalase activities, cellulase activity fluctuated more with increasing of soil depth (Figure 3c). In the topsoil layer (0–10 cm), cellulase activity in EBF was significantly lower than the other four vegetation types, while in the middle soil layer (10–20 cm), the difference between the cellulase activities of SH and BF did not reach a significant level, but they were significantly greater than MCBF, EBF, and CFF. For the 20–30 cm soil layer, the cellulase activities in BF were significantly higher than that of the other four vegetation types. Generally, the higher cellulase activity in BF was observed at three soil layers compared to the other vegetation types.

3.5. Relationship between Soil C Fractions and Soil Physicochemical Properties, Enzymatic Activities

The correlations among SOC and its LOC fractions (DOC, MBC, and EOC) with soil physicochemical properties and enzyme activities in the five vegetation types were analyzed by Pearson’s test, and the results are given in Table 4. There were significantly positive correlations between the concentrations of soil LOC fractions and SOC in all vegetation types. In soil physicochemical properties, SOC and all its LOC fractions were positive in relation to soil moisture in varying degree and highly correlated with TN and TP except for TP of CFF and BF, while they were negatively related to BD in different degrees. Except for CFF and the DOC and MBC of MCBF, pH also had a negative effect on SOC and its LOC fractions. As far as soil enzyme activities were concerned, SOC and LOC fractions had a positive relationship with three enzyme activities in all vegetation types; they were especially significant or extremely significant correlated with invertase and highly related with catalase in MCBF and BF.

4. Discussion

4.1. Effect of Different Vegetation Restoration Types on SOC Concentrations and Stocks

Vegetation restoration improved litter, root coefficient, root exudates, microbial activity, and soil structure, which accelerated the accumulation of SOC [33]. The quantity and chemical composition of litters under different forest vegetation varies greatly, which leads their decomposition rates to also differ, thus affecting SOC stock [34]. In our study, it showed a decreasing trend with soil depth for the concentrations and stocks of SOC under the different vegetation restoration types, which is consistent with the results of most previous studies [35,36]. This can be attributed to two factors. First, litter cover as well as the warm and wet conditions at the surface soil are more conducive to decomposition of dead plant material than the soil environment in deep soil layers, which could reduce soil nutrient loss, improve soil health, and increase the accumulation of organic carbon [37]. Second, root carbon inputs and microbial activity decrease with soil depth [38]. The differences of SOC contents and stocks among various vegetation restoration types could be rationally ascribed to litter and root exudates, which are imported into soil and vary with vegetation types, so it resulted in significant difference in SOC accumulation [39]. BF represents a bamboo forest, with the lowest vegetation coverage (141.65 g·m−2), but its litter fall can be decomposed faster than other stands. Furthermore, studies have shown that bamboo species have more developed fine roots than other forest plants [40]. Besides that, the smallest mean soil bulk density in BF (1.13 ± 0.21 g·cm−3) at 0–30 depth (Table 1) is beneficial to the growth of plant roots, which gives the soil higher aeration and increases the activity of soil aerobic microorganisms. Numerous studies have reported that soil carbon storage is linked to root inputs and root exudation, which is known to change the activity and composition of the microbial community [41,42]. Additionally, it might also have something to do with the highest altitude of BF (1028 m) in our research. Soil temperature, humidity, soil texture, and other environmental factors affect soil microbial activities with the change of altitude, and temperature especially can effect soil microstructure, adsorption performance, and soil organic matter, thus affecting the decomposition and transformation of SOC [43]. In fact, some researchers have demonstrated that SOC retention generally increases with higher altitude in the tropics [44] and temperate regions [45]. Thus, the highest SOC concentration and stock were observed in BF. CFF represented a Chinese fir forest with the largest amount of litter (497.12 g·m−2), so it showed higher SOC concentration than MCBF, EBF, and SH. Furthermore, the pH of MCBF and EBF (5.26 and 5.37, respectively) was too low (<5.5), and that of SH (8.15) too high (>8.0); both were not conducive to the growth and reproduction of microorganisms in comparison to CFF (6.39). Compared to SH (shrubs), MCBF represented mixed conifer–broadleaf forest with higher biomass and litter, while it exhibited the lowest SOC content and stock. This is related to the slow decomposition of coniferous litters in MCBF for containing more lignin [46]. In addition, the litter layer of shrub was thinner and easier to decompose than that of forest land [47], and its roots are shallow, numerous, and dense [48], which is conducive to the accumulation of SOC. Therefore, the management practices should focus more on shrub restoration to minimize CO2 emission rates.

4.2. Effect of Different Vegetation Restoration Types on Concentrations and Stocks of Soil LOC Fractions

Vegetation restoration types cause environmental heterogeneity in soil physicochemical properties, which significantly affects the spatial distribution soil LOC fractions. The correlation analysis showed the significant relationships between LOC fractions and SOC (Table 4), and all fractions vary with the amount of SOC. Generally, a great deal of research has confirmed that LOC content is largely dependent on the amount of SOC in the soil [49], which is consistent with the finding of Wang et al. [50] in his studied forest soils as well as that reported for wetland and agricultural land soils by Xiao et al. and Luo et al. [51,52], respectively. Surface soil is supposed to be organic-rich and contains large amounts of new carbon derived from leaching vegetation and decomposition of plant and animal residues. Furthermore, soil bulk density increases, and soil organic matter content and underground biomass gradually decrease with the increasing of soil depth; thereby, soil LOC fractions significantly decline at deeper soil layers.
Soil DOC mainly comes from the decomposition of litter, rhizosphere exudates, and microbial metabolism, which has some characteristics such as certain solubility, easy flow and decomposition, and high biological activity [53]. Therefore, soil DOC is easy to lose with surface runoff, and this is one of the important methods of SOC loss. The highest mean DOC content was observed in BF. This may have something to do with BF having a large root system. Studies have shown that litter and fine roots are the main sources of soil DOC [54]. Moreover, the slopes of other vegetation types (20–41°) are steeper than that of BF (11°) (Table 2), which makes the soil DOC easily lost with rain, resulting in the lower DOC content. The average proportion of DOC to SOC was higher in SH and MCBF compared to other vegetation types, possibly reflecting the higher levels of decomposed organic C in these two vegetation types. These studies suggest that DOC content may be different for different vegetation restoration strategies this area.
Soil MBC is the most active and variable part of soil organic matter, and its size reflects the size of soil microbial community, which is often used to monitor changes of soil quality [55]. The quantity and quality of litter across different vegetation types have significant influence on the soil microbial biomass and microbial activity, which further influence the decomposition speed and stability of SOC [56]. The higher mean MBC concentrations appeared for BF and EBF compared to the other three vegetation types at 0–30 cm depth, suggesting that the environmental conditions of these two vegetation types were more favorable to the growth and reproduction of soil microorganisms. The ratio of soil MBC to SOC reflects the conversion efficiency of soil organic matter to microbial biomass carbon, and thereby, it can reflect the turnover rate of LOC pool [57]. The higher MBC/SOC value indicates a greater the microbial utilization efficiency of organic matter, which leads to continuous accumulation of soil carbon, thus improving soil quality [58]. In our study, MBC held 0.67–3.49% of SOC, and the ratio was higher in MCBF and EBF relative to other vegetation types. This suggested that broad-leaved vegetation had higher soil microbial activity and faster decomposition and transformation rate of organic matter compared to other vegetation types, which can accumulate more soil microbial carbon.
Soil EOC is the fastest turnover component of SOC, a potential source of soil nutrients, and an important energy source for soil microbial activities as well as a sensitivity indicator of dynamic changes of soil organic matter [59]. Compared to MBC and DOC, EOC is more sensitive to environment change or soil management practices [60]. BF and CFF showed significantly higher mean EOC contents, which means they have the faster SOC turnover rate. The higher the ratio of soil EOC to SOC, the faster the nutrient cycling rate, which is not conducive to the accumulation of soil organic matter, so the stability of SOC is worse and decomposes more easily [61]. The EOC/SOC ratio in all vegetation types ranged from 4.85% to 22.50% in our research, in accordance with ratios (5–30%) reported by Blair et al. [29]. The average ratio of EOC to SOC in CFF was the highest (20.36%) at 0–30 cm soil depth, indicating that SOC in CFF easily decomposed and transformed.

4.3. Contributions of Soil Environmental Factors to Variations in SOC and LOC Fractions

Vegetation community structure and soil physiochemical properties jointly determined the content and stock of SOC, but soil physiochemical properties have a greater impact on SOC [62]. BD was a negative impact factor for soil C fractions in the study area; this has been supported by some research [43,63]. Soils with lower BD can store more SOC because it can be mobilized along the pores within the soil constitution [64]. Furthermore, soils with low bulk density generally have more porosity, macro-aggregates, and oxygen content, which is conducive to promoting soil microbial activity and root growth. Forest vegetation restoration can reduce solar radiation and increase soil moisture, so soil moisture had a positive effect on SOC and its LOC fractions. Meanwhile, soil moisture affects the soil LOC content by influencing SOC inputs and plant growth [65]. Soil TN and TP are the major limiting nutrients of ecosystem productivity and play key roles in ecosystem restoration or succession [66]. In our study, SOC and its fractions in different vegetation restoration types were highly correlated with TN and TP except for TP of CFF and BF, which indicated that soil organic carbon accumulation was limited by nitrogen and phosphorus availability. Many studies suggested that soil nitrogen enrichment may suppress soil C loss and may therefore serve to enhance soil C sinks [67,68]. Feng and Zhu [69] reported that increasing phosphorus decomposition induced by anthropogenic activities also plays an important role in forest soil carbon cycling. pH had a negative effect on SOC and its LOC fractions in this study. Soil pH can directly affect the solubility, migration, and transformation of mineral elements, soil microbial activity, and turnover of soil labile carbon [70]. Either too high (>8.5) or too low (<5.5) a pH value is not conducive to the growth of microorganisms, resulting in the accumulation capacity of SOC decrease [71].
Soil enzymes affect the synthesis, decomposition, and transformation of soil organic matter and play a critical role in regulating nutrient cycling and energy flow in forest ecosystems [72]. Soil invertase and cellulose enzymes are responsible for the rate and course of decomposition of plant material and the degradation of plant debris [73]. Catalase is the main lignin decomposition enzyme, which can affect the soil carbon cycle through the effect on lignin [74]. In our study, we found that three enzymes (invertase, cellulase, and catalase) were closely associated with SOC and soil LOC fractions to varying degrees under different vegetation types (Table 4). Xiao et al. [51] found that soil LOC fractions in the three wetlands were positively associated with invertase but negatively correlated with cellulase and catalase. Ma et al. [75] also reported that soil LOC fractions had different associations with the study of enzyme activity. Due to the extent of utilization of the C and N sources for soil enzymes differs, with varying effects on soil enzyme activity under different vegetation restoration types, different soil enzymes contributed differently to the conversion cycle of soil labile organic carbon. Previous studies of soils from various regions also have shown that hydrolases and oxidase may have different effects on the formation of soil LOC components [76,77]. Generally speaking, soil enzyme activity had a significant effect on the soil labile organic carbon pool, and invertase had the most significant effect on the labile organic carbon pool. Therefore, the enzyme activities of invertase, cellulase, and catalase can serve as active biological indicators of forest soil LOC turnover.

5. Conclusions

This study revealed differences in the concentrations and stocks of SOC and its LOC fractions among different vegetation restoration types. The contents of SOC and LOC fractions as well as SOC stocks declined with increasing soil depth in five vegetation restoration types. At 0–30 cm depth, BF had a significantly higher SOC, DOC concentrations, and SOC stock, while no significant difference was observed in the DOC stocks among five vegetation types. The greater the MBC stocks in BF and EBF, and higher the soil EOC stocks found in CFF and BF.
However, soil physicochemical properties and enzyme activities could contribute SOC, and its LOC fractions were positive correlated with soil moisture, TN, TP, and C-cycle enzyme activities. TN, TP, and invertase significantly impacted soil organic carbon fractions, while pH and BD were negative impacts factors for SOC and LOC fractions.
Generally, vegetation has profound effects on soil LOC fractions contents and their stocks. Both soil physicochemical property and enzyme activities together promote the transformation of subtracts and are important in the spatial variation of soil LOC fractions and their stability. These results are consistent with our hypothesis.

Author Contributions

Conceptualization, methodology, software, formal analysis, data curation, writing—original draft, writing—review and editing, visualization, Y.X.; methodology, resources, writing—review and editing, supervision, funding acquisition, Z.H.; formal analysis, software, Y.L., S.C. and B.Z.; investigation S.L. and X.W. All authors have read and agreed to the published version of the manuscript.

Funding

This research was supported by Guizhou Provincial Science and Technology Projects (Qiankehejichu [2020]1Y194), the Youth Science and Technology talent Growth Project of Universities in Guizhou Province (Qianjiaohe KY-[2019]105), Zunyi Science Technology Bureau and Zunyi Normal University United Science & Technology Research Foundation (Zunshikehe HZ-268), Scientific Research Project of Zunyi Normal University (Zunshi BS [2019]30 and BS [2019]33), Serving Local Industrial Revolution Projects from Zunyi Normal University (ZSCXY [2021]04), and Talent base for environmental protection and mountain agricultural in the Chishui River Basin.

Institutional Review Board Statement

Not applicable.

Informed Consent Statement

Not applicable.

Data Availability Statement

Not applicable.

Conflicts of Interest

The authors declare no conflict of interest.

References

  1. Yan, P.; Peng, H.; Yan, L.; Lin, K. Spatial variability of soil physical properties based on GIS and geo-statistical methods in the red beds of the Nanxiong Basin, China. Pol. J. Environ. Stud. 2019, 28, 2961–2972. [Google Scholar] [CrossRef]
  2. Yang, Q. On the boundary of the loess plateau. J. Natur. Resour. 1988, 3, 9–15. (In Chinese) [Google Scholar]
  3. Baton, L.; Yang, L. Measurement of carbonate rocks distribution area in China. Carsologica Sin. 1983, 2, 147–150. (In Chinese) [Google Scholar]
  4. Yan, L.B.; Kasanin-Grubin, M. Land degradation and management of red beds in China: Two case studies. J. Mt. Sci. 2019, 16, 2591–2604. [Google Scholar] [CrossRef]
  5. Liu, H.; Liu, G.; Zhou, Y.; He, C. Spatial distribution and influence analysis of soil heavy metals in a hilly region of sichuan basin. Pol. J. Environ. Stud. 2017, 26, 725. [Google Scholar] [CrossRef]
  6. Bai, B.; Nie, Q.; Zhang, Y.; Wang, X.; Hu, W. Cotransport of heavy metals and SiO2 particles at different temperatures by seepage. J. Hydrol. 2021, 597, 125771. [Google Scholar] [CrossRef]
  7. Li, Y.; Liu, C.; Yuan, X. Spatiotemporal features of soil and water loss in Three Gorges Reservoir Area of Chongqing. J. Geogr. Sci. 2009, 19, 81–94. [Google Scholar] [CrossRef]
  8. Wang, H.J.; Shi, X.Z.; Yu, D.S.; Weindorf, D.C.; Huang, B.; Sun, W.X.; Ritsema, C.J.; Milne, E. Factors determining soil nutrient distribution in a small-scaled watershed in the purple soil region of Sichuan Province, China. Soil Tillage Res. 2009, 105, 300–306. [Google Scholar] [CrossRef]
  9. Peng, H.; Ren, F.; Pan, Z. A review of Danxia landforms in China. Z. Für Geomorphol. Suppl. Issues 2015, 59, 19–33. [Google Scholar]
  10. Li, C.; Li, C.; Zhao, L.; Ma, Y.; Tong, X.; Deng, J.; Ren, C.; Han, X.; Yang, G. Dynamics of storage and relative availability of soil inorganic nitrogen along revegetation chronosequence in the loess hilly region of China. Soil Tillage Res. 2019, 187, 11–20. [Google Scholar] [CrossRef]
  11. Xu, C.; Xiang, W.; Gou, M.; Chen, L.; Lei, P.; Fang, X.; Deng, X.; Ouyang, S. Effects of forest restoration on soil carbon, nitrogen, phosphorus, and their stoichiometry in Hunan, southern China. Sustainability 2018, 10, 1874. [Google Scholar] [CrossRef]
  12. Han, C.L.; Sun, Z.X.; Shao, S.; Wang, Q.B.; Libohova, Z.; Owens, P.R. Changes of Soil Organic Carbon after Wildfire in a Boreal Forest, Northeast CHINA. Agronomy 2021, 11, 1925. [Google Scholar] [CrossRef]
  13. Yan, L.; Peng, H.; Hu, Z.; Kašanin-Grubin, M.; Greif, V.; Chen, Z.; Simonson, S. Stone pillar rockfall in Danxia landform area, Mt. Langshan, Hunan Province, China. Physi. Geogr. 2016, 37, 327–343. [Google Scholar] [CrossRef]
  14. Moreno-Mateos, D.; Barbier, E.B.; Jones, P.C.; Jones, H.P.; Aronson, J.; Lopez-Lopez, J.A.; McCrackin, M.L.; Meli, P.; Montoya, D.; Rey Benayas, J.M. Anthropogenic ecosystem disturbance and the recovery debt. Nat. Commun. 2017, 8, 14163. [Google Scholar] [CrossRef] [PubMed]
  15. Li, J.; Wu, X.; Gebremikael, M.T.; Wu, H.; Cai, D.; Wang, B.; Li, B.; Zhang, J.; Li, Y.; Xi, J. Response of soil organic carbon fractions, microbial community composition and carbon mineralization to high-input fertilizer practices under an intensive agricultural system. PLoS ONE 2018, 13, e0195144. [Google Scholar] [CrossRef]
  16. Soucémarianadin, L.N.; Cécillon, L.; Guenet, B.; Chenu, C.; Baudin, F.; Nicolas, M.; Girardin, C.; Barré, P. Environmental factors controlling soil organic carbon stability in French forest soils. Plant Soil 2018, 426, 267–286. [Google Scholar] [CrossRef]
  17. Xu, G.; Chen, J.; Berninger, F.; Pumpanen, J.; Bai, J.; Yu, L.; Duan, B. Labile, recalcitrant, microbial carbon and nitrogen and the microbial community composition at two Abies faxoniana forest elevations under elevated temperatures. Soil Biol. Biochem. 2015, 91, 1–13. [Google Scholar] [CrossRef]
  18. Blanco-Moure, N.; Gracia, R.; Bielsa, A.C.; López, M.V. Soil organic matter fractions as affected by tillage and soil texture under semiarid Mediterranean conditions. Soil Tillage Res. 2016, 155, 381–389. [Google Scholar] [CrossRef]
  19. Ruirui, C.; Mehmet, S.; Sergey, B.; Olga, M.; Klaus, D.; Xiangui, L.; Evgenia, B.; Yakov, K. Soil C and N availability determine the priming effect: Microbial N mining and stoichiometric decomposition theories. Glob. Chang. Biol. 2014, 20, 2356–2367. [Google Scholar]
  20. Huang, W.L.; Tu, Y.L.; Yang, L. Vegetation of Guizhou; Guizhou People’s Publishing House: Guiyang, China, 1988. [Google Scholar]
  21. Peng, H. China Danxia; Springer Nature: Berlin, Germany, 2020. [Google Scholar]
  22. Zhao, J.; Tang, J.B.; Huang, S.S. Study on the categories of soil erosion of Chishui River Basin and corresponding measures for soil and water conservation. Hubei Agric. Sci. 2015, 54, 3369–3371. (In Chinese) [Google Scholar]
  23. Luo, Y.; Liu, L.; Yang, R.Y. Scientific Investigation and Study on National Nature Protection Area of Subtropical Evergreen Broadleaved Forest in Xishui, Guizhou Province; Science and Technology Press: Guizhou, China, 2011. (In Chinese) [Google Scholar]
  24. Lu, R.K. Soil Agrochemistry and Analytical Methods; Chinese Agricultural Science and Technology Press: Beijing, China, 2000. (In Chinese) [Google Scholar]
  25. Xie, Y.J.; Xie, Y.H.; Xiao, H.Y.; Chen, X.S.; Li, F. Controls on Litter Decomposition of Emergent Macrophyte in Dongting Lake Wetlands. Ecosystems 2017, 20, 1383–1389. [Google Scholar]
  26. Rahman, F.; Rahman, M.M.; Rahman, G.K.M.M.; Saleque, M.A.; Hossain, A.T.M.S.; Miah, M.G. Effect of organic and inorganic fertilizers and rice straw on carbon sequestration and soil fertility under rice-rice cropping pattern. Carbon Manag. 2016, 7, 41–53. [Google Scholar] [CrossRef]
  27. Wu, J.; Joergensen, R.G.; Pommerening, B.; Chaussod, R.; Brookes, P.C. Measurement of soil microbial biomass C by fumigation extraction—an automated procedure. Soil Biol. Biochem. 1990, 22, 1167–1169. [Google Scholar] [CrossRef]
  28. Jones, D.L.; Willett, V.B. Experimental evaluation of methods to quantify dissolved organic nitrogen (DON) and dissolved organic carbon (DOC) in soil. Soil Biol. Biochem. 2006, 38, 991–999. [Google Scholar] [CrossRef]
  29. Blair, G.J.; Lefory, R.D.B.; Lise, L. Soil carbon fractions based on their degree of oxidation and the development of a carbon management index for agricultural system. Aust. J. Agric. Res. 1995, 46, 1459–1466. [Google Scholar] [CrossRef]
  30. Guan, S.Y. Soil Enzymes and Their Research Methods; Agriculture Press: Beijing, China, 1986. (In Chinese) [Google Scholar]
  31. Li, Q.; Liang, J.H.; He, Y.Y.; Hu, Q.J.; Yu, S. Effect of land use on soil enzyme activities at karst area in Nanchuan, Chongqing, Southwest China. Plant Soil Environ. 2014, 60, 15–20. [Google Scholar] [CrossRef] [Green Version]
  32. Carver, R.; Nash, J. Doing Data Analysis with IBM-SPSS: Version 18.0; Cengage Learning: Boston, MA, USA, 2011. [Google Scholar]
  33. Dabral, P.P.; Baithuri, N.; Pandey, A. Soil Erosion assessment in a hilly catchment of North Eastern India using USLE, GIS and remote sensing. Water Resour. Manag. 2008, 22, 1783–1798. [Google Scholar] [CrossRef]
  34. Cao, J.; He, X.; Chen, Y.; Chen, Y.; Zhang, Y.; Yu, S.; Zhou, L.; Liu, Z.; Zhang, C.; Fu, S. Leaf litter contributes more to soil organic carbon than fine roots in two 10-year-old subtropical plantations. Sci. Total Environ. 2020, 704, 135341. [Google Scholar] [CrossRef]
  35. Jia, X.X.; Yang, Y.; Zhang, C.C.; Shao, M.A.; Huang, L.M. A state-space analysis of soil organic carbon in China’s loess plateau. Land Degrad. Dev. 2017, 28, 983–993. [Google Scholar] [CrossRef]
  36. Yu, H.; Zha, T.; Zhang, X.; Ma, L. Vertical distribution and influencing factors of soil organic carbon in the Loess Plateau, China. Sci. Total Environ. 2019, 693, 133632. [Google Scholar] [CrossRef]
  37. King, A.E.; Hofmockel, K.S. Diversified cropping systems support greater microbial cycling and retention of carbon and nitrogen. Agric. Ecosyst. Environ. 2017, 240, 66–76. [Google Scholar] [CrossRef]
  38. Ravenek, J.M.; Bessler, H.; Engels, C.; Scherer-Lorenzen, M.; Gessler, A.; Gockele, A.; Luca, E.D.; Temperton, V.M.; Ebeling, A.; Roscher, C.; et al. Long-term study of root biomass in a biodiversity experiment reveals shifts in diversity effects over time. Oikos 2014, 123, 1528–1536. [Google Scholar] [CrossRef]
  39. Wiesmeier, M.; Urbanski, L.; Hobley, E.; Lang, B.; Lützow, M.; Marin-Spiotta, E.; Wesemael, B.; Rabot, E.; Ließ, M.; Garcia-Franco, N.; et al. Soil organic carbon storage as a key function of soils-A review of drivers and indicators at various scales. Geoderma 2019, 333, 149–162. [Google Scholar] [CrossRef]
  40. Fukuzawa, K.; Shibata, H.; Takagi, K.; Satoh, F.; Koike, T.; Sasa, K. Roles of dominant understory Sasa bamboo in carbon and nitrogen dynamics following canopy tree removal in a cool-temperate forest in northern Japan. Plant Species Biol. 2015, 30, 104–115. [Google Scholar] [CrossRef]
  41. Kramer, C.; Trumbore, S.; Fröberg, M.; Dozal, L.M.C.; Zhang, D.; Xu, X.; Santos, G.M.; Hanson, P.J. Recent (<4 year old) leaf litter is not a major source of microbial carbon in a temperate forest mineral soil. Soil Biol. Biochem. 2010, 42, 1028–1037. [Google Scholar] [CrossRef]
  42. Lange, M.; Eisenhauer, N.; Sierra, C.A.; Bessler, H.; Engels, C.; Griffiths, R.I.; Mellado-Vázquez, P.G.; Malik, A.A.; Roy, J.; Scheu, S.; et al. Plant diversity increases soil microbial activity and soil carbon storage. Nat. Commun. 2015, 6, 6707. [Google Scholar] [CrossRef]
  43. Zinn, Y.L.; Andrade, A.B.; Araujo, M.A.; Lal, R. Soil organic carbon retention more affected by altitude than texture in a forested mountain range in Brazil. Soil Res. 2018, 56, 284–295. [Google Scholar] [CrossRef]
  44. Zech, M.; Hörold, C.; Leiber-Sauheitl, K.; Kühnel, A.; Hemp, A.; Zech, W. Buried black soils on the slopes of Mt. Kilimanjaro as a regional carbon storage hotspot. Catena 2014, 112, 125–130. [Google Scholar] [CrossRef]
  45. Badía, D.; Ruiz, A.; Girona, A.; Martí, C.; Casanova, J.; Ibarra, P.; Zufiaurre, R. The influence of elevation on soil properties and forest litter in the siliceous Moncayo Massif, SW Europe. J. Mount. Sci. 2016, 13, 2155–2169. [Google Scholar] [CrossRef]
  46. Lukac, M.; Godbold, D.L. Soil Ecology in Northern Forests: A below Ground View of a Changing World; Cambridge University Press: Cambridge, UK, 2011. [Google Scholar]
  47. Guo, S.L.; Ma, Y.H.; Che, S.G.; Sun, W.Y. Effects of artificial and natural vegetations on litter production and soil organic carbon change in loess hilly areas. Sci. Silvae Sin. 2009, 45, 14–18. [Google Scholar]
  48. Zhou, Y.; Watts, S.E.; Boutton, T.W.; Archer, S.R. Root density distribution and biomass allocation of co-occurring woody plants on contrasting soils in a subtropical savanna parkland. Plant Soil 2019, 438, 263–279. [Google Scholar] [CrossRef]
  49. Wang, M.; Wang, S.; Cao, Y.; Jiang, M.; Wang, G.; Dong, Y. The effects of hummock-hollow microtopography on soil organic carbon stocks and soil labile organic carbon fractions in a sedge peatland in Changbai Mountain, China. Catena 2021, 201, 105204. [Google Scholar] [CrossRef]
  50. Wang, H.; Wu, J.; Li, G.; Yan, L. Changes in soil carbon fractions and enzyme activities under different vegetation types of the northern Loess Plateau. Ecol. Evol. 2020, 10, 12211–12223. [Google Scholar] [CrossRef] [PubMed]
  51. Xiao, Y.; Huang, Z.; Lu, X. Changes of soil labile organic carbon fractions and their relation to soil microbial characteristics in four typical wetlands of Sanjiang Plain, Northeast China. Ecol. Eng. 2015, 82, 381–389. [Google Scholar] [CrossRef]
  52. Luo, Y.; Li, Q.; Shen, J.; Wang, C.; Li, B.; Yuan, S.; Zhao, B.; Li, H.; Zhao, J.W.; Guo, L.K.; et al. Effects of agricultural land use change on organic carbon and its labile fractions in the soil profile in an urban agricultural area. Land Degrad. Dev. 2019, 30, 1875–1885. [Google Scholar] [CrossRef]
  53. Li, M.; Zhang, A.; Wu, H.; Liu, H.; Lv, J. Predicting potential release of dissolved organic matter from biochars derived from agricultural residues using fluorescence and ultraviolet absorbance. J. Hazard Mater. 2017, 334, 86–92. [Google Scholar] [CrossRef]
  54. Kalbitz, K.; Solinger, S.; Park, J.H.; Michalzik, B.; Matzner, E. Controls on the dynamics of dissolved organic matter in soil: A review. Soil Sci. 2000, 165, 277–304. [Google Scholar] [CrossRef]
  55. Wick, B.; Kuhne, R.F.; Vlek, P.L.G. Soil microbiological parameters as indicators of soil quality under improved fallow management systems in south-western Nigeria. Plant Soil 1998, 202, 97–107. [Google Scholar] [CrossRef]
  56. Wang, Q.; Xiao, F.; He, T.; Wang, S. Responses of labile soil organic carbon and enzyme activity in mineral soils to forest conversion in the subtropics. Ann. For. Sci. 2013, 70, 579–587. [Google Scholar] [CrossRef]
  57. Zhang, X.Y.; Meng, X.J.; Gao, L.P.; Sun, X.M.; Fan, J.J.; Xu., L.J. Potential impacts of climate warming on active soil organic carbon contents along natural altitudinal forest transect of Changbai Mountain. Acta Ecol. Sin. 2010, 30, 113–117. [Google Scholar] [CrossRef]
  58. Huang, Y.; Wang, S.L.; Feng, Z.W.; Gao, L.; Wang, Q.K.; Hu, Y.L.; Yan, S.K. Soil quality assessment of forest stand in different plantation esosystems. Chin. J. Appl. Ecol. 2004, 15, 2199–2205. (In Chinese) [Google Scholar]
  59. Yang, X.; Lan, Y.; Meng, J.; Chen, W.F.; Huang, Y.W.; Cheng, X.Y.; He, T.Y.; Cao, T.; Liu, Z.Q.; Jiang, L.L.; et al. Effects of maize stover and its derived biochar on greenhouse gases emissions and C-budget of brown earth in Northeast China. Environ. Sci. Pollut. Res. 2017, 24, 8200–8209. [Google Scholar] [CrossRef] [PubMed]
  60. Duval, M.E.; Galantini, J.A.; Martinez, J.M.; Lopez, F.M.; Wall, L.G. Sensitivity of different soil quality indicators to assess sustainable land management: Influence of site features and seasonality. Soil Tillage Res. 2016, 159, 9–22. [Google Scholar] [CrossRef]
  61. Zhu, Z.J.; Jiang, P.K.; Xu, Q.F. Study on the active organic carbon in soil under different types of vegetation. Forest Res. 2006, 19, 523–526. (In Chinese) [Google Scholar]
  62. Xu, H.; Qu, Q.; Lu, B.; Zhang, Y.; Liu, G.; Xue, S. Variation in soil organic carbon stability and driving factors after vegetation restoration in different vegetation zones on the Loess Plateau, China. Soil Tillage Res. 2020, 204, 104727. [Google Scholar] [CrossRef]
  63. Hu, P.L.; Liu, S.J.; Ye, Y.Y.; Zhang, W.; Wang, K.L.; Su, Y.R. Effects of environmental factors on soil organic carbon under natural or managed vegetation restoration. Land Degrad. Dev. 2018, 29, 387–397. [Google Scholar] [CrossRef]
  64. Anh, P.T.Q.; Gomi, T.; Macdonald, L.H.; Mizugaki, S.; Khoa, P.V.; Furuichi, T. Linkages among land use, macronutrient levels, and soil erosion in northern Vietnam: A plot-scale study. Geoderma 2014, 232, 352–362. [Google Scholar] [CrossRef]
  65. Mcdowell, W.H.; Currie, W.S.; Aber, J.D.; Yano, Y. Effects of chronic nitrogen amendments on production of dissolved organic carbon and nitrogen in forest soils. Water Air Soil Pollut. 1998, 105, 175–182. [Google Scholar] [CrossRef]
  66. Wen, L.; Li, D.; Yang, L.; Luo, P.; Chen, H.; Xiao, K.; Song, T.; Zhang, W.; He, X.; Chen, H.; et al. Rapid recuperation of soil nitrogen following agricultural abandonment in a karst area, southwest China. Biogeochemistry 2016, 129, 341–354. [Google Scholar] [CrossRef]
  67. Reay, D.S.; Dentener, F.; Smith, P.; Grace, J.; Feely, R.A. Global nitrogen deposition and carbon sinks. Nat. Geosci. 2008, 1, 430–437. [Google Scholar] [CrossRef]
  68. Li, S.; Zhang, S.R.; Pu, Y.L.; Li, T.; Xu, X.X.; Jia, Y.X.; Deng, O.P.; Gong, G.S. Dynamics of soil labile organic carbon fractions and C-cycle enzyme activities under straw mulch in Chengdu Plain. Soil Tillage Res. 2016, 155, 289–297. [Google Scholar] [CrossRef]
  69. Feng, J.; Zhu, B. A global meta-analysis of soil respiration and its components in response to phosphorus addition. Soil Biol. Biochem. 2019, 135, 3–47. [Google Scholar] [CrossRef]
  70. Shen, C.C.; Xiong, J.B.; Zhang, H.Y.; Feng, Y.Z.; Li, X.G.; Li, X.Y.; Liang, W.J.; Chu, H.Y. Soil pH drives the spatial distribution of bacterial communities along elevation on Chang Bai Mountain. Soil Biol. Biochem. 2013, 57, 204–211. [Google Scholar] [CrossRef]
  71. Yu, X.L. Interactions between soil microbial biomass carbon and soil enzyme activities in Momoge National Nature Reserve. J. Northeast Forest Univer. 2020, 48, 59–63. (In Chinese) [Google Scholar]
  72. Mayor, Á.G.; Goirán, S.B.; Vallejo, V.R.; Bautista, S. Variation in soil enzyme activity as a function of vegetation amount, type, and spatial structure in fire-prone mediterranean shrublands. Sci. Total Environ. 2016, 573, 1209–1216. [Google Scholar] [CrossRef] [PubMed]
  73. Rao, M.A.; Scelza, R.; Gianfreda, L. Soil Enzymes. Enzymes in Agricultural Sciences; OMICS Group eBooks: Foster City, CA, USA, 2014; pp. 10–43. [Google Scholar]
  74. Chen, Q.M.; Wang, Z.X.; Liu, Y.; Zheng, H.F.; Li, H.J.; Wang, L.F.; Chen, Y.M.; Shen, X.; Tang, S.Y. Response of soil enzyme activities and stoichiometric ratio to simulated nitrogen deposition in subalpine coniferous forests of western Sichuan. Chin. J. Appl. Environ. Biol. 2019, 25, 791–800. [Google Scholar]
  75. Ma, W.W.; Li, G.; Wu, J.H.; Xu, G.R.; Wu, J.Q. Response of soil labile organic carbon fractions and carbon-cycle enzyme activities to vegetation degradation in a wet meadow on the Qinghai-Tibet Plateau. Geoderma 2020, 377, 114565. [Google Scholar] [CrossRef]
  76. Sinsabaugh, R.L. Phenol oxidase, peroxidase and organic matter dynamics of soil. Soil Biol. Biochem. 2010, 42, 391–404. [Google Scholar] [CrossRef]
  77. Raju, M.N.; Golla, N.; Vengatampalli, R. Soil cellulase. In Soil Enzymes; Springer: Berlin, Germany, 2017; pp. 25–30. [Google Scholar]
Figure 1. Vertical profile distribution of SOC concentration in different vegetation restoration types. Different capital letters indicate significant differences among five different vegetation types within the same soil layer, and different lowercase letters indicate significant differences among three soil layers in the same vegetation type.
Sustainability 14 12283 g001
Figure 2. Changes of soil LOC fractions concentration and their proportions to SOC in different vegetation types. Different capital letters indicate significant differences among five different vegetation types within the same soil layer, and different lowercase letters indicate significant differences among three soil layers in the same vegetation type. The (a1,a2,b1,b2,c1,c2) in the subfigures represent the concentration and proportion of DOC, MBC and EOC, respectively.
Sustainability 14 12283 g002aSustainability 14 12283 g002b
Figure 3. Soil enzymatic activities at different soil depths in the five wetlands. Different capital letters indicate significant differences among five different vegetation types within the same soil layer, and different lowercase letters indicate significant differences among three soil layers in the same vegetation type. (ac) indicate invertase, catalase and cellulase activities, respectively.
Sustainability 14 12283 g003aSustainability 14 12283 g003b
Table 1. The basic characteristics of the different vegetation restoration types.
Vegetation TypesElevation
(m)
Slope (°)AspectSoil TypeTree Height (m)Dominant Species
SH92824West by north 26°Yellow soil1.4–2.0Coriariasinica + Vitex negundo + Zanthoxylum planispinum + Lonicera ligustrina
MCBF95520East by south 63°Yellow soil9–18Fokieniahodginsis + Pinus massoniana + Castanopsischunii + Elaeocarpus japonicus
EBF99132West by north 73°Yellow soil12–16Lithocarpus glabra + Phoebe zhennan + Clethra pinfaensis
CFF102541West by north 77°Yellow soil17–20Cunninghamia lanceolata
BF102811West by north 9°Yellow soil10–12Phyllostachys pubescens
SH, shrub; MCBF:, mixed conifer–broadleaf forest; EBF, evergreen broad-leaved forest; CFF, Chinese fir forest; BF, bamboo forest.
Table 2. Soil physico-chemical properties of five typical vegetation types in the Chishui River Basin.
Vegetation TypeSoil Depth
(cm)
pHMoisture
(g·100 g−1)
BD
(g·cm−3)
TN
(g·kg−1)
TP
(g·kg−1)
Dry Weight of Litterfall
(g·m−2)
SH0–108.03 ± 0.05 Aa16.38 ± 1.36 Ba1.50 ± 0.14 Aa1.33 ± 0.16 Ba0.43 ± 0.01 Ba299.04 ± 51.03 B
10–208.23 ± 0.13 Aa14.18 ± 1.74 Ba1.58 ± 0.11 ABa0.72 ± 0.13 Bb0.38 ± 0.00 Bb
20–308.20 ± 0.30 Aa13.17 ± 2.23 Ba1.74 ± 0.12 Aa0.59 ± 0.02 Bb0.37 ± 0.01 Bb
Average8.15 ± 0.16 A14.57 ± 1.78 B1.61 ± 0.12 A0.88 ± 0.10 B0.40 ± 0.09 B
MCBF0–105.31 ± 0.37 Ca15.37 ± 0.41 Ba1.42 ± 0.20 ABa1.02 ± 0.24 Ba0.22 ± 0.02 Ca363.80 ± 44.16 B
10–205.22 ± 0.10 Ca13.33 ± 1.22 Ba1.53 ± 0.17 ABa0.43 ± 0.13 Cb0.16 ± 0.03 Cb
20–305.24 ± 0.04 Ba11.90 ± 1.31 Ba1.58 ± 0.10 ABa0.34 ± 0.11 Cb0.13 ± 0.01 Cb
Average5.26 ± 0.17 C13.54 ± 2.28 B1.51 ± 0.16 ABa0.60 ± 0.16 C0.17 ± 0.02 C
EBF0–105.19 ± 0.38 Ca25.21 ± 1.45 Aa1.50 ± 0.17 Aa1.40 ± 0.16 Ba0.23 ± 0.02 Ca311.32 ± 60.96 B
10–205.30 ± 0.30 Ca23.81 ± 1.44 Aa1.56 ± 0.25 ABa0.78 ± 0.19 Bb0.20 ± 0.03 Ca
20–305.61 ± 0.08 Ba21.06 ± 1.09 Ab1.65 ± 0.17 Aa0.64 ± 0.08 Bb0.19 ± 0.03 Ca
Average5.37 ± 0.25 C23.36 ± 1.33 A1.57 ± 0.20 AB0.94 ± 0.15 B0.21 ± 0.03 C
CFF0–106.47 ± 0.29 Ba23.96 ± 3.24 Aa1.37 ± 0.13 ABb1.57 ± 0.67 Ba0.27 ± 0.03 Ca497.12 ± 32.08 A
10–206.44 ± 0.60 Ba21.98 ± 3.48 Aa1.83 ± 0.10 Aa1.11 ± 0.21 Ba0.24 ± 0.03 Ca
20–306.25 ± 0.95 Ba21.68 ± 2.96 Aa1.95 ± 0.23 Aa1.00 ± 0.47 ABa0.21 ± 0.06 Ca
Average6.39 ± 0.61 B22.54 ± 3.23 A1.71 ± 0.16 A1.22 ± 0.45 B0.25 ± 0.04 C
BF0–105.66 ± 0.43 Ca28.43 ± 2.95 Aa0.96 ± 0.28 Ba2.62 ± 0.58 Aa0.64 ± 0.06 Aa141.65 ± 31.78 C
10–205.88 ± 0.09 BCa23.14 ± 4.34 Aa1.17 ± 0.28 Ba1.83 ± 0.20 Aab0.62 ± 0.06 Aa
20–306.17 ± 0.22 Ba21.10 ± 1.94 Aa1.25 ± 0.08 Ba1.57 ± 0.13 Ab0.59 ± 0.07 Aa
Average5.90 ± 0.25 BC24.22 ± 3.08 A1.13 ± 0.21 B2.01 ± 0.30 A0.63 ± 0.06 A
Note: the results are shown as the mean ± standard errors (SE). Capital letters indicate significant differences between the same soil layer of different vegetation types (p < 0.05); lowercase letters indicate significant differences among the same vegetation types of different soil layers (p < 0.05). Abbreviations: SH, shrubs; MCBF, mixed conifer–broadleaf forest; EBF, evergreen broad-leaved forest; CFF, Chinese fir forest; BF, bamboo forest; BD, bulk density; TN, total nitrogen; TP, total phosphorus.
Table 3. The stocks of SOC and soil LOC fractions in different vegetation types.
Soil LayerSHMCBFEBFCFFBF
SOC (t ha−1)
0–10 cm20.14 ± 1.91 Aa15.30 ± 1.55 Aa21.56 ± 2.72 Aa24.49 ± 6.95 Aa26.46 ± 3.88 Aa
10–20 cm9.27 ± 1.31 Cb6.13 ± 0.62 Db11.91 ± 2.16 Cb17.91 ± 2.47 Bb23.97 ± 0.99 Aa
20–30 cm6.68 ± 0.32 Cb3.82 ± 1.51 Cb11.09 ± 1.96 Bb16.40 ± 3.18 Ab20.77 ± 3.15 Aa
0–30 cm36.09 ± 2.48 C25.25 ± 0.30 D44.56 ± 4.46 C58.79 ± 4.65 B71.02 ± 3.82 A
DOC (t·ha−1)
0–10 cm0.21 ± 0.03 Aa0.23 ± 0.01 Aa0.19 ± 0.01 Aa0.21 ± 0.07 Aa0.18 ± 0.05 Aa
10–20 cm0.13 ± 0.02 Bb0.12 ± 0.01 Bb0.13 ± 0.02 Bb0.16 ± 0.01 Ba0.19 ± 0.02 Aa
20–30 cm0.11 ± 0.01 Ab0.08 ± 0.01 Ac0.12 ± 0.03 Ab0.14 ± 0.04 Aa0.16 ± 0.04 Aa
0–30 cm0.44 ± 0.04 A0.43 ± 0.00 A0.44 ± 0.03 A0.50 ± 0.11 A0.53 ± 0.03 A
MBC (t·ha−1)
0–10 cm0.34 ± 0.08 ABa0.21 ± 0.01 BCa0.47 ± 0.04 Aa0.18 ± 0.07 Ca0.39 ± 0.12 ABa
10–20 cm0.15 ± 0.03 Bb0.16 ± 0.03 Bab0.19 ± 0.04 Bb0.12 ± 0.02 Ba0.40 ± 0.07 Aa
20–30 cm0.13 ± 0.03 Cb0.12 ± 0.02 Cb0.21 ± 0.02 Bb0.10 ± 0.01 Ca0.31 ± 005 Aa
0–30 cm0.62 ± 0.12 BC0.50 ± 0.02 C0.88 ± 0.06 A0.41 ± 0.04 C1.10 ± 0.21 A
EOC (t·ha−1)
0–10 cm3.37 ± 0.66 Aa2.77 ± 0.94 Aa4.38 ± 0.27 Aa5.10 ± 0.48 Aa4.40 ± 1.47 Aa
10–20 cm1.24 ± 0.35 Bb0.80 ± 0.15 Bb1.68 ± 0.26 Bb3.48 ± 0.84 Ab4.02 ± 0.13 Aa
20–30 cm0.67 ± 0.08 Bb0.20 ± 0.04 BCb1.46 ± 0.23 Bb3.16 ± 0.55 Ab2.90 ± 0.44 Aa
0–30 cm5.28 ± 0.97 BC3.77 ± 0.95 C7.52 ± 0.64 B11.74 ± 1.69 A11.32 ± 1.49 A
Note: Capital letters indicate that there are significant differences (p < 0.05) between vegetation types under the same soil layer. Different lowercase letters indicate significant differences between different soil layers of the same vegetation type. The error is the standard error.
Table 4. Correlation coefficients of soil labile organic carbon fractions and soil physicochemical properties and C-cycle enzymes.
Vegetation TypesIndexesDOCMBCEOCBDMoisturepHTNTPInvertaseCatalaseCellulase
SHSOC0.981 **0.962 **0.993 **−0.729 *0.735 *−0.4470.990 **0.845 **0.989 **0.0900.017
DOC10.971 **0.989 **−0.670 *0.706 *−0.3980.984 **0.849 **0.982 **0.1680.067
MBC 10.970 **−0.6540.752 *−0.5090.972 **0.907 **0.947 **0.2810.048
EOC 1−0.697 *0.755 *−0.4550.989 **0.831 **0.988 **0.1190.015
MCBFSOC0.971 **0.930 **0.953 **−0.5670.485−0.0260.951 **0.894 **0.765 *0.842 **0.063
DOC10.977 **0.950 **−0.5650.4760.0800.955 **0.925 **0.873 **0.881 **0.116
MBC 10.926 **−0.4730.5480.1000.930 **0.941 **0.879 **0.864 **0.142
EOC 1−0.716 *0.467−0.1550.968 **0.893 **0.833 **0.796 *0.069
EBFSOC0.935 **0.901 **0.961 **−0.5290.577−0.672 *0.944 **0.826 **0.725 *0.3360.382
DOC10.883 **0.942 **−0.4170.642−0.765 *0.937 **0.729 *0.722 *0.3830.357
MBC 10.973 **−0.4100.703 *−0.5540.983 **0.832 **0.783 *0.2720.446
EOC 1−0.4400.644−0.6240.990 **0.814 **0.810 **0.2640.454
CFFSOC0.4470.4900.837 **−0.849 **0.5530.1370.850 **0.4790.746 *0.5090.666
DOC10.857 **0.795 *−0.758 *0.3590.5090.345 **0.4860.732 *0.6330.500
MBC 10.829 **−0.763 *0.3750.3020.424 **0.4300.760 *0.6610.737 *
EOC 1−0.904 **0.6060.3360.711 **0.5810.870 **0.5570.730 *
BFSOC0.929 **0.853 **0.949 **−0.5980.961 **−0.695 *0.918 **0.3950.759 *0.866 **0.298
DOC10.835 **0.890 **−0.711 *0.939 **−0.4580.807 **0.1160.667 *0.783 *0.220
MBC 10.948 **−0.5430.874 **−0.701 *0.884 **0.0660.907 **0.892 **0.387
EOC 1−0.5990.956 **−0.705 *0.968 **0.2680.899 **0.954 **0.449
* Correlation is significant at the 0.05 level. ** Correlation is significant at the 0.01 level.
Publisher’s Note: MDPI stays neutral with regard to jurisdictional claims in published maps and institutional affiliations.

