Article

Nutritional Composition and Antioxidant Properties of the Wild Edible Fruits of Tripura, Northeast India

1
Department of Chemistry, National Institute of Technology Agartala, Agartala 799046, India
2
Subject Matter Specialist—Home Science, Krishi Vigyan Kendra, Khowai 799207, India
3
Department of Chemistry, National Institute of Technology Patna, Patna 800005, India
4
Department of Environmental Science, Central University of South Bihar, Gaya 824236, India
5
Subject Matter Specialist—Soil Science, Krishi Vigyan Kendra, Khowai 799207, India
*
Author to whom correspondence should be addressed.
Sustainability 2022, 14(19), 12194; https://doi.org/10.3390/su141912194
Submission received: 30 July 2022 / Revised: 16 September 2022 / Accepted: 21 September 2022 / Published: 26 September 2022

Abstract

:
Fruits that are rich in nutrients and have antioxidant properties are essentially required for human health. These fruits are quite demanding to use pharmaceutically to produce natural drugs. Tripura, a Northeast state of India, is abundant in wild edible fruits, the nutritional values of which have not yet been fully explored. The nutrient composition and antioxidant properties of 06 (six) wild edible fruits viz. Wild orange (Citrus macroptera), Chinese lard (Hodgsonia macrocarpa Cogn.), Madhabilata (Stixis suaveolens Roxb. Pierre), Wild small black Jamun (Syzygium assamicum), Indian coffee plum (Flacourtia jangomas Lour. Raeusch), and Gamboge (Garcinia gummi-gutta (L.) Robs) were explored and are reported in this paper. All the observations were statistically analyzed and properly presented here. The study reveals that wild orange (220.75 mg/100 g) and Indian coffee plum (223.25 mg/100 g) are vitamin C-rich fruits. Madhabilata has high protein content (0.744%), whereas Gamboge yields an energetic fruit (124.92 Kcal/100 g). The energy parameter has a good correlation with ash (correlation coefficient (r) = 0.68), TSS (r = 0.62), and protein (r = 0.83). Nutrient minerals (mg/100 g), in general, are found quite high in wild orange (Na, 170.4; K, 55.40; Mg, 61.53; Zn, 6.85; Cu, 6.25). There is a good correlation between Na and K (r = 0.58). Antioxidant activity (81.15 μmol/g) and metal chelating capacity (MCC) (39.45 mg/mL) are high in wild orange, and they have an excellent correlation (r = 0.97). It has quite a high value of total phenolic content (TPC) (303.89 mg GAE/g) and total flavonoid content (TFC) (36.78 mg QE/g) as well. TPC and TFC have good correlations with antioxidant parameters (r = 0.81 with TPC and 0.86 with TFC). Chloride (4.35 mg/100 g), nitrate (0.639 μg/100 g), and As(III) (0.27 mg/100 g) contents are found high in Indian coffee plum, Madhabilata, and Wild black Jamun, respectively. Principal component analysis (PCA) revealed that total sugar, zinc (Zn), manganese (Mn), and copper (Cu) are the important indicators to be given emphasis while studying the nutritional value of these minor fruits. Moreover, the results would provide a baseline database for the nutrient profile of these fruits as well as enhance awareness among the masses regarding the value of the fruit, which enhances and conserves the biodiversity of the forest area of Tripura.

1. Introduction

Nutrients are essential for good health. People in urban and rural areas get their required nutrients from a variety of foods, particularly fruits. Lack of nutrients gives birth to many diseases; two well-known examples are scurvy (lack of vitamin C) and anemia (deficiency of iron). Antioxidants are another key component that reduce the risk of chronic diseases by destroying free radicals deposited on various tissues, thereby protecting them from oxidative damage. Lacking antioxidants means it opens the door for many diseases. Therefore, to accomplish nutrients/antioxidants urban people sometimes take supplements that are available in markets. However, the scenario is quite different for tribal people who live in forests or nearby areas and are generally called forest dwellers. They largely depend on forest products and, to some extent, on cultivated products for their livelihood [1,2,3,4,5]. Plants that obtain their nutrients through natural and biological processes are more resilient to environmental stress than crops that obtain their primary nutrition artificially through highly soluble chemical fertilizers [6]. This is mainly achieved through optimal soil and water management, the building of soil structure and fertility, and the choice of locally adapted robust crop varieties. Comparative studies have shown a higher content of beneficial, health-promoting secondary plant compounds in wild edible fruits [7,8]. However, malnutrition is high among the tribal population [9,10] and they suffer from a variety of ailments [11,12]. According to the National Family Health Survey (NFHS-3) in India, tribal people had a higher incidence of childhood stunting (52.3%) than non-tribal ones (42.8%) in India (Figure S1) [13].
There are 427 tribal communities in India (see ESI, Figure S1), with 30.44% (~130) belonging to the Northeast (NE) region [14]. Tripura, one of the eight NE states, has 19 (nineteen) tribal communities, the majority of which are forest dwellers. The forests of Tripura are diversified with non-timber products, and tribal people get their nutrients from such products. Numerous wild edible fruits are termed minor/underutilized fruits due to a lack of awareness of their nutritional value among the common people of Tripura. Indigenous people have a rich knowledge of the folk medicinal values of such fruits [15]. Thus, it is quite clear that fruit ingredients have medicinal properties. Interestingly, without knowing the ingredients or working components of fruit, they continue their practices year after year. Research in such areas is thus extremely appealing [16,17,18] and delivers many aspects. Some reports were published about wild edible fruits in Tripura and their utilization among tribal communities [15,19,20,21,22]. Investigations were done on Hodgsonia heteroclite [23], Flacourtia jangomas [24,25], Artocarpus chama (Buch.-Ham) [26], and Stixis suaveolens (Roxb) [27,28,29] by some research groups. Moreover, wild edible fruit species are diverse and familiar to tribal people, yet civilians are unfamiliar with their nutritional values. In our recent paper [30], we value and other associated properties of the two fruits: wild jackfruit (Artocarpus cham a Buch.-Ham.) and Indian red peer (Protium serratum Engl.). There is very limited study on the nutritional composition of the wild edible fruits found in NE Indian states. The objective of the study was to evaluate the nutritional, elemental, and antioxidant properties of the six (06) wild edible fruits such as wild orange (Citrus macroptera), Chinese lard (Hodgsonia macrocarpa Cogn.), Madhabilata (Stixis suaveolens Roxb. Pierre), wild small black jamun (Syzygium assamicum), Indian coffee plum (Flacourtia jangomas Lour. Raeusch), and Gamboge (Garcinia gummi-gutta (L.) Robs) and their relationships among them. Phytochemicals produced by such plants are associated with the prevention of diseases in humans under changing climatic conditions as well as increasing awareness regarding the value of these wild fruit plants among forest dwellers.

2. Materials and Methods

2.1. Sample Collection

The six (06) fresh fruits include wild orange (Citrus macroptera), Chinese lard (Hodgsonia macrocarpa Cogn.), Madhabilata (Stixis suaveolens Roxb. Pierre), wild small black Jamun (Syzygium assamicum), Indian coffee plum Flacourtia jangomas Lour. Raeusch), and Gamboge (Garcinia gummi-gutta (L.) Robs), which were collected from different hilly areas of Khowai, West Tripura, Sipahijala, and Dhalai districts of Tripura during February 2018 to August 2019 (Figure S2). The required analytical reagent grade chemicals for analysis were purchased from reputed companies such as Sigma-Aldrich, Alpha, Hi-media, and Merck. Ultrapure distilled water was used and collected from Mili-Q instruments. The UV-vis spectrophotometer (Perkin Elmer, Lamda-25) and atomic absorption spectroscopy (Thermo Scientific AAS ICE3011) instruments were used. Apparatus such as crucibles, hot air oven, electronic balance, desiccators, etc., were integrated as part of the sample analysis.

2.2. Sample Preparation

The collected whole fresh wild edible fruits (six numbers, as stated above) were first thoroughly washed with aqueous ethanol followed by distilled water to make the fruit’s surface clean and dust-free. After washing, the fruits were soaked off the water by blotting paper and allowed to air dry. The air-dried fruits were then cut into small pieces and dried in an oven at (50–60) °C. The small pieces of each fruit were ground in powder form. For the quantitative study, the powdered materials were finally sieved through 20 µm and packed in sealed containers. After that, the samples were subjected to analyzing for nutrient values, sugars, vitamin C, energy, TPC, TFC, MCC, and antioxidant properties. The measurements were done on a dry weight basis.

2.3. Nutrient Contents

The quantifications of macronutrients such as moisture, ash, and protein content present in the fruits were made following reported methodologies [30].

2.4. Mineral Nutrients Contents

A 10 g fruit powders sample were taken for estimation of mineral contents. In this connection, fruit powder was repeatedly digested in concentrated nitric acid until the residue became colorless. Following digestion, the volume was increased to 100 mL by adding distilled water and filtered through Whatman (no.40) paper. During the process, we had taken care to avoid any contamination. Minerals such as Na, K, Mg, Zn, Cu, Ni, Co, Mn, Cr, Cd, and Pb were estimated [31] from the prepared sample solution by atomic absorption spectroscopy (AAS). For estimation of Hg, 0.5 g of fruit samples were digested with 5 M HCl solution, and AAS by cold vapor mode through VP-100 was used in the same way as for other minerals. First, standard Hg solutions were run for calibration, and then samples were opted to measure the Hg. Thus, the concentration of Hg was estimated by correlating absorbance with the calibration graph and using the dilution factor [31].
Hg (mg/Kg) = wt. of sample (gm) × times of dilution (dilution factor)

2.5. Sugar Contents and Energy

Sugars in the form of total sugar, reducing sugar, and non-reducing sugar were determined using a UV-vis spectrophotometer. Total sugar was estimated by using anthrone reagent [32], a color-developing reagent. Typically, 25 mg of a fruit powder sample was dissolved in 10 mL of 80% ethanol and centrifuged at 4000 rpm for 10 min. The supernatant was then collected and made up the volume to 10 mL. The extract (0.1 mL) was added into 4 mL of anthrone solution (conc. H2SO4) and heated for 10 min in a boiling water bath. After cooling at room temperature, the absorbance (A) at 625 nm was measured in a UV-vis spectrophotometer against a reagent blank. The total sugar content was quantified using the standard curve of glucose (A625 = 0.0043[glucose] + 0.0331, R2 = 0.9714) made from the known concentrations of glucose (10–200 µg/mL) in anthrone reagent solution.
Reducing sugar in the fruit samples was determined by following Somogyi-Nelson’s method [33]. The extract (1.0 mL) was mixed with 1.0 mL of Somogy’s alkaline copper sulfate reagent. Then, the mixture was incubated in a water bath at 100 °C for 10 min. When the mixture had cooled to room temperature, 4.0 mL of Nelson’s arsenomolybdate reagent was added. The bluish green color developed, and its absorbance was measured at 660 nm in a UV-vis spectrophotometer. The values were calculated using a standard curve (A660 = 0.004[glucose] + 0.0176, R2 = 0.9878) prepared from known concentrations of glucose (10–150 µg/mL). Non-reducing sugar was estimated by the reported method [33]. The difference between the total soluble sugar and reducing sugar without hydrolysis corresponds to the quantity of non-reducing sugar. Thus, the amount of non-reducing sugar was calculated from the above experimental data.
The IKA Bomb calorimeter was used to estimate the energy (J/g) [34]. The fruit samples (2.0 g) in the form of a pellet were placed in the bomb calorimeter consisting pressurized oxygen bomb (30 bar). The bomb along with the sample pellet was then immersed in a weighed amount of water. The temperature of the water was recorded with a differential thermometer. Thereafter, the sample was ignited by means of an electric fuse. Upon complete combustion, the liberated heat was absorbed by the water; the rise of temperature of water was continuously determined, till the readings became stable. By knowing the heat capacity of the bomb calorimeter material, water, and of fuse wire, the exact amount of heat released was calculated.

2.6. Vitamin C: Ascorbic acid Content

Ascorbic acid content present in the fruit samples was quantified following the 2,4-dinitrophenylhydrazine (2,4-DNPH) method and using UV-vis spectroscopy tool [30]. Typically, fresh fruit samples (1.0 g) were ground first and then extracted with meta-phosphoric acid (10 mL, 5% meta-phosphoric acid in 10% acetic acid solution in water) followed by filtration. The filtrate was treated with a few drops of bromine water and thiourea solution. Similarly, standard ascorbic acid solutions (5–50 µg/mL) were also prepared. To all mixtures, either samples or standard ascorbic acid solutions, 0.1 mL 2,4-DNPH was added and kept undisturbed for 2 h. Thereafter, all the solutions were treated with 85% sulphuric acid solutions (0.5 mL) in cold conditions. The absorbance intensities of the resulting mixtures were measured at 520 nm. The data of the standard ascorbic acid solutions were used to construct a calibration curve (A520 = 0.0083[ascorbic acid] + 0.0239, R2 = 0.9923), from which, the ascorbic acid contents of the fruit samples were determined and expressed in mg/100 g.

2.7. Antioxidant Property: Study of DPPH Radical Scavenging Activity

The edible portion of each fruit sample (4 g) was taken and homogenized with 50% aqueous methanol (8 mL) with occasional agitation for 30 min. The extracts were then centrifuged at 2000 rpm for 15 min and collected the supernatant for DPPH free radical scavenging assay. Antioxidant properties of the fruits were measured by monitoring absorbance at 517 nm using a UV-vis spectrophotometer and expressed in terms of radical scavenging activity of the 1,1-diphenyl-2-picrylhydrazyl (DPPH) free radical (μmol/g), as described in our prior report [30,35]. The IC50 (half maximal inhibitory concentration) value, the concentration of the sample that could scavenge 50% of DPPH free radical, was determined.

2.8. Metal Chelating Capacity (MCC)

The MCC values of the fruits extract, as stated above, were determined by performing Fe2+-ferrozine assay. The formation of Fe2+-ferrozine complex would be inhibited by the fruit ingredients and could be monitored at 562 nm with a UV-vis spectrophotometer. The MCC value obtained is expressed in mg/mL. The detailed procedure was described in our recently published paper [30].

2.9. Total Phenolic Contents (TPC)

The methanolic extracts of peel and pulp of the fruits (5.0 g in 20 mL of 70% methanol) were used to evaluate the total phenolics content (mg of gallic acid (GA)/g) using the Folin–Ciocalteu (F–C) colorimetric method [30]. Absorbance at 725 nm vs. gallic acid standard (0–320 µg/mL) data were used to construct a calibration curve (A725 = 0.0007[gallic acid] + 0.0915, R2 = 0.946) for determining TPC value. TPC values were calculated for each sample using the expression, C = c V/m, where, C = TPC in mg GAE/g dry extract, c = [gallic acid] obtained from calibration curve in mg/mL, V = volume of extract in ml, m = mass of extract in gram.

2.10. Total Flavonoid Contents (TFC)

The total flavonoid contents (TFC) of the samples were determined following the reported aluminum chloride method [36]. The method is based on the quercetin standard calibration curve. Different quercetin solutions of concentrations, 10–140 µg/mL in 80% methanol were initially prepared. These standard solutions (each, 0.5 mL) were subsequently mixed with aluminum chloride (10%, 0.1 mL) and potassium acetate (1 M, 0.1 mL) and the volume of the solutions was made up to 5 mL with 80% methanol. The mixtures were thoroughly shaken and left undisturbed for 30 min before being recorded absorbance at 415 nm, using UV-Vis. spectrophotometer. The calibration curve (A415 = 0.0022[quercetin] + 0.0395, R2 = 0.9845) was constructed by plotting absorbance vs. [quercetin]. The sample solutions were prepared in a similar way using methanol extract (0.5 mL) of the fruit samples instead of quercetin. The flavonoid contents of the fruits were determined from the calibration curve and expressed in terms of mg QE/g dry extract weight.

2.11. Data Analysis

Using the general linear model (GLM) procedure of the SPSS window version 16.0 (SPSS Inc., Chicago, IL, USA), data were analyzed for variance (ANOVA). The same statistical package was followed for performing principal component analysis (PCA). Values were expressed as mean and standard deviation. Treatment means were separated by the Duncan Multiple Range Test at 5% level of significance (p < 0.05).

3. Results and Discussion

3.1. Macronutrients Composition, Sugars, Energy, and Correlations

The fruit quality parameters: moisture, ash, total soluble solids (TSS), protein, total sugar in the form of reducing and non-reducing sugar, vitamin C, and energy were estimated by following reported procedures [30]. The data, that were obtained have been statistically analyzed and enumerated in Table 1. Macronutrients are the nutrients that the human body needs in large amounts, which include fat, carbohydrate, and protein. The macronutrients provide energy, and it contains the components of food that the body needs to maintain its systems and structures. Humans need energy-delivering macronutrients (fat, carbohydrate, protein), and energy-delivering micronutrients. In this connection energy supply, one macronutrient can substitute the other for a restricted period. To ensure the metabolic pathways and at least the function of macronutrients, they cannot substitute for each other and they cannot be synthesized within the body [37,38].
The results are portrayed in Table 1 and Figure S3 (ESI) as a bar diagram. Moisture content is an important fruit quality parameter that indicates the ultimate quality of fruit. The high content of moisture in fruit means low dry mass in it. The moisture content is expressed as a percentage [30]. It was observed that the moisture content in Wild orange, Wild black Jamun, Gamboge, and Indian coffee plum was significantly higher as compared to Chinese lard and Madhabilata, which are statistically at par. The values are comparable with the commercial fruits such as apple, guava, grapes, mango, etc. [39]
Ash content indicates the whole inorganic residue of a fruit sample after complete ignition. From a consumer point of view, it also depicts the mineral nutrient values of a fruit. The proximate analysis provides the ash content of the fruits [30]. It was also found that the highest ash content was observed in Gamboge, followed by Indian coffee plum and Wild orange. However, Chinese lard and Madhabilata recorded less ash content than Gamboge, Indian coffee plum, and Wild orange. The lowest ash content is observed in Wild black jamun.
Total soluble solids (TSS) include sugars, organic acids, and a small number of vitamins, proteins, and minerals present in the fruit. TSS is one of the consumer choices when selecting fruit items as it expresses the sweetness of the fruit. The total soluble solids content of a solution is measured by the index of refraction (Refractometer). It was observed that the highest TSS content was found in Madhabilata and Gamboge, followed by Chinese lard plant and lowest in the Wild orange, Wild black jamun, and Indian coffee plum.
Total sugars are made up of both reducing and non-reducing sugars that can be found in fruits. In terms of sugar content, the highest value was recorded in wild orange followed by Wild black Jamun and it was observed the lowest total sugar in the Chinese Lard plant, Madhabilata, Indian coffee plum, and Gamboge. Reducing sugar acts as an electron donor to other molecules, changing the color and taste of the food. Its consumption provides fiber, protein, low glycemic, and carbohydrates that nourish our bodies. They perform a number of biological functions, including providing daily nutritional calories and energy storage in a living organism. It was documented that the wild orange and wild black Jamun have the highest reducing sugar content followed by Gamboge and the least quantity in the Chinese Lard plant, Madhabilata, and Indian Coffee plum had the lowest. Non-reducing sugars are disaccharide-sucrose and tetrasaccharide. In non-reducing sugar, no free functional groups are available to act in the human body. Sucrose is digested in the small intestine by an enzyme. The results showed that the highest non-reducing sugar content was found in wild orange followed by Wild black Jamun; whereas Chinese lard plan, Madhabilata, and Indian coffee plum have the least quantity of non-reducing sugar content and it was found lowest in the Gamboge.
Proteins are essential nutrients and a building block of all biological tissues. Its deficiency leads to many health problems, particularly in children, including swelling, fatty liver, skin deterioration, increased infections, and stunted growth. Fruits containing high proteins are attractive food to vegetarians. It was observed that Madhabilata contains the highest protein followed by Gamboge and wild black Jamun. The least quantity was found in the Chinese lard plant, wild Orange, Madhabilata, and Indian coffee plum (Table 1). The protein results are comparable to most commercial fruits, but the values are somewhat lower than a banana (1.33%) and Jack fruit (1.90%) [39].
Vitamin C is essential for the production of collagen, L-carnitine, and a few synapses, among other things. It helps to metabolize proteins and has antioxidant properties that may reduce the risk of some malignancies. It assists in producing the main component of connective tissue and is the most abundant protein in mammals. The Indian coffee plum and Wild orange were found to have the highest content of vitamin C followed by Wild black Jamun. The least quantity of Vitamin C found in the Chinese lard plant, Madhabilata and Gamboge. It is reported that the vitamin C content was 329 mg/100 g and 315 mg/100 g, in Desi Amla and Banarasi Amla, respectively, which is comparatively higher than wild edible fruits [40].
Energy is delivered to the body through food. Any energy consumed is in the form of carbohydrates, protein, and fat. All parts of our body (muscles, brain, heart, and liver) require energy to function. It is well-known that the body metabolizes fruit sugars in different ways and quite easier than the added sugars. The highest content of energy was reported in Gamboge, followed by Madhabilata, while the least quantity observed was in the Wild black Jamun. The lowest was found in the Chinese lard plant, Wild orange, and Indian coffee plum (Table 1).
In order to find a correlation among the macronutrients that existed in the fruits under study, a linear regression analysis was performed. It is a good correlation method to establish the relationship among various variables that measure fruit quality parameters. The correlation coefficients among the macronutrients (Figure S3) obtained from the analysis is listed in Table 2. The moisture content has a good correlation with vitamin C (correlation coefficient (r) = 0.69) and energy with ash (r = 0.68), TSS (r = 0.62), and protein (r = 0.83). The correlation among the different forms of sugar contents is excellent, as expected. From the table, it can be seen that vitamin C has a quite good correlation with sugar content. Moreover, on such observations, Gamboge is found to have a high energy level, followed by Madhabilata and wild black Jamun.

3.2. Nutrient Mineral Composition and Correlations

Minerals, which are important in our bodies for optimal biological activities, are one of the advantages of eating fruits. Atomic absorption spectrometer (AAS) is the most reliable tool for determining the mineral contents of fruit. In total, 12 (twelve) elements—Na, K, Mg, Zn, Cu, Ni, Co, Mn, Cr, Cd, Hg, and Pb—were statistically analyzed and listed in Table 3. These are categorized into macro (K, Na, and Mg), micro (Ni, Mn, Cu, Zn, Co, and Cr) essential elements, and heavy metals (Cd, Hg, and Pb). All the six fruits are Na-rich fruits; in this study, we found the highest amount of Na in the Madhabilata, Chinese lard plant, and Indian coffee plum, whereas it was lower in Wild orange followed by in Gamboge. The lowest amount of Na was observed in the Wild black Jamun (Table 3). It is reported in local mango (Mangiferaindica L.) and Banana (Mussa spp.) Na content is 0.1 mg/100 g [41,42], which is much less than the wild edible fruits sample. The K content was found to be highest in Chinese lard (80.44 mg/100 g) among the studied samples, whereas the lowest content was observed in the Madhabilata, Indian Coffee plum, and Gamboge followed by Wild orange. The lowest content of K was found in the wild black Jamun (Table 3). It is revealed that K content is lesser than the local mango and banana which value 168 mg/100 g and 385 mg/100 g, respectively [41,42,43]. The results showed that the highest content of Mg was found in the Indian coffee plum and Wild orange, followed by Chinese lard. The lowest Mg content was observed in the Wild black Jamun, Gamboge, and Madhabilata. It is revealed that in the local mango and Banana the values are 10 mg/100 g and 30 mg/100 g [41,42,43]. It was found that the Cu contents are highest in the Wild orange as well as Madhabilata among the six fruits (Table 3). The Cu content in the fruits investigated was found higher than the local mango which ranges from only 0.04–0.32 mg/100 g [41,42]. It is estimated that from the analyzed results, the Mn and Zn content was found to be highest in Gamboge among the six fruits. The Zn content in the study sample was found to be more than in the local mango (0.09 mg/100 g) whose value is much less compared to the wild edible fruits [41,42]. Chromium (Cr), which enhances the action of the hormone insulin, is most present in Indian coffee plum among the studied fruits. Cobalt (Co), a component of vitamin B12, is found to be relatively low in these fruits. Heavy metals—cadmium (Cd), mercury (Hg), and lead (Pb)—are the prescribed toxic metals for both plants and animals. It is observed that the existence of Hg in these fruits has a negligibly less quantity but more or less equal quantity, whereas Cd is found considerably higher in the wild orange and Indian coffee plum. It was observed that the Pb concentration was higher in the Wild orange, Chinese lard, Madhabilata, and Wild black Jamun, and was found lower in the Indian coffee plum and Gamboges.
Correlations among elements found in the analysis were established by studying linear regression correlations and the value of correlation coefficients is given in Table 4. The study shows that Na has a good correlation with K (r = 0.58) and Cr (r = 0.57). Mn has a good correlation with Cr (r = 0.62) but an excellent correlation with Cd (r = 0.98). Similarly, the excellent correlations are also found between Zn and Mn (r = 0.92), Cu and Hg (r = 0.86), Co and Pb (r = 0.93), Cr and Cd (r = 0.58), and Cd and Hg (r = 0.58), respectively.

3.3. Antioxidant Activities, TPC, MCC, TFC

Phytochemicals are bio-active non-nutrient compounds naturally found in fruits, vegetables, whole grains, and other plant foods that have health-promoting properties associated with a reduced risk of cancer, and heart disease. There are some specific phytochemicals such as lycopene found in red-orange fruits, and vegetable, it thought to protect against prostate cancer. Flavonoids are another important phytochemical responsible for the colour of fruits and vegetables. Flavonoids can reduce inflammation and are thought to protect against heart disease, cancer, and other chronic diseases [44].
Antioxidant activities of the fruits were determined by DPPH free radical scavenging assay at 517 nm using the spectrophotometric tool. The antioxidant activity of fruit lies in its polyphenol content. Polyphones act as reducing agents and they exhibit antioxidant activity by using the hydrogen-donating property of their hydroxyl groups [39]. The antioxidant value of any fruit helps processors for the processing and storage of fruit. In tris-buffer-DPPH solution (100 ppm), the antioxidant activity along with IC50 values are given in Table 5 (bar diagram in Figure S4, ESI).
The antioxidant activity DPPH value highest was observed in Wild orange followed by Indian coffee plum and Madhabilata, which are comparable or slightly higher than the reported value of pomegranate peel extract (methanol) [7]. The least value of DPPH was found in the wild black jamun, and the lowest was found in the Chinese lard plant and Gamboge. The highest IC50value was found in the Chinese lard followed by Wild orange and Gamboge. The least IC50 value was observed from the analyzed results in the Madhabilata and the lowest value was found in the wild black jamun and Indian coffee plum. The study total phenolic content (TPC) of fruit is important as it shows many activities including antioxidants. The TPC value among the six fruits was found highest to lowest in the order (mg GAE/g): Indian coffee plum (382.47) > wild orange (303.89) > wild black Jamun (267.34) > Madhabilata (229.63) >> Chinese lard plant (45.92) > Gamboge (18.79). It is documented that the TPC value of Zanthoxylum armatum DC fruit cultivated and wild were found to be 226.3 mg ± 1.14 GAE/g and 185.02 ± 2.15 [45], which compared to less than the Indian coffee plum, wild orange, Wild black jamun, and Madhabilata. The phenolic content of any plant is directly related to its antioxidant properties. Phenolic compounds act as reducing agents, and hydrogen donors, and are capable of Scavenging free radicals [46]. The presence of a considerably good amount of phenolics content in the wild edible fruits may contribute significantly to the antioxidant properties. On the other hand, it was found that the wild black jamun has a higher value of total flavonoid content (TFC), followed by Madhabilata and Indian coffee plum; whereas, the Chinese lard plant, Wild orange, and Gamboge have comparatively less content of TFC. It is observed that the TFC value of cultivated and wild Z. armatum is higher than the investigated wild edible fruits [45]. A higher MCC value means a higher capacity to prevent induction of metal-catalyzed decomposition reactions for oxidative damage of cellular proteins. It was found from the analyzed data, that the highest MCC value was found in wild orange followed by Madhabilata and Indian coffee plum. Gamboge has the lowest value among the six wild edible fruits under study.
Correlation study (Table 6) shows that the DPPH, i.e., antioxidant property, has excellent correlation with TPC (r = 0.81), TFC (r = 0.86) and MCC (r =0.97). Finally, a correlation analysis between the macronutrients and antioxidant activity that existed in the fruits under study and a linear regression analysis were performed (Table 7). The study shows that excellent to good correlations are found between Zn and Mn (r = 0.92), Cd and Mn (r = 0.98), Vitamin C with Mn (r = 0.87), energy with Zn (r = 0.89), reducing sugar and non-reducing sugar with total sugar (r = 0.91 and r = 0.97), and reducing sugar with non-reducing sugar (r = 0.78), respectively.

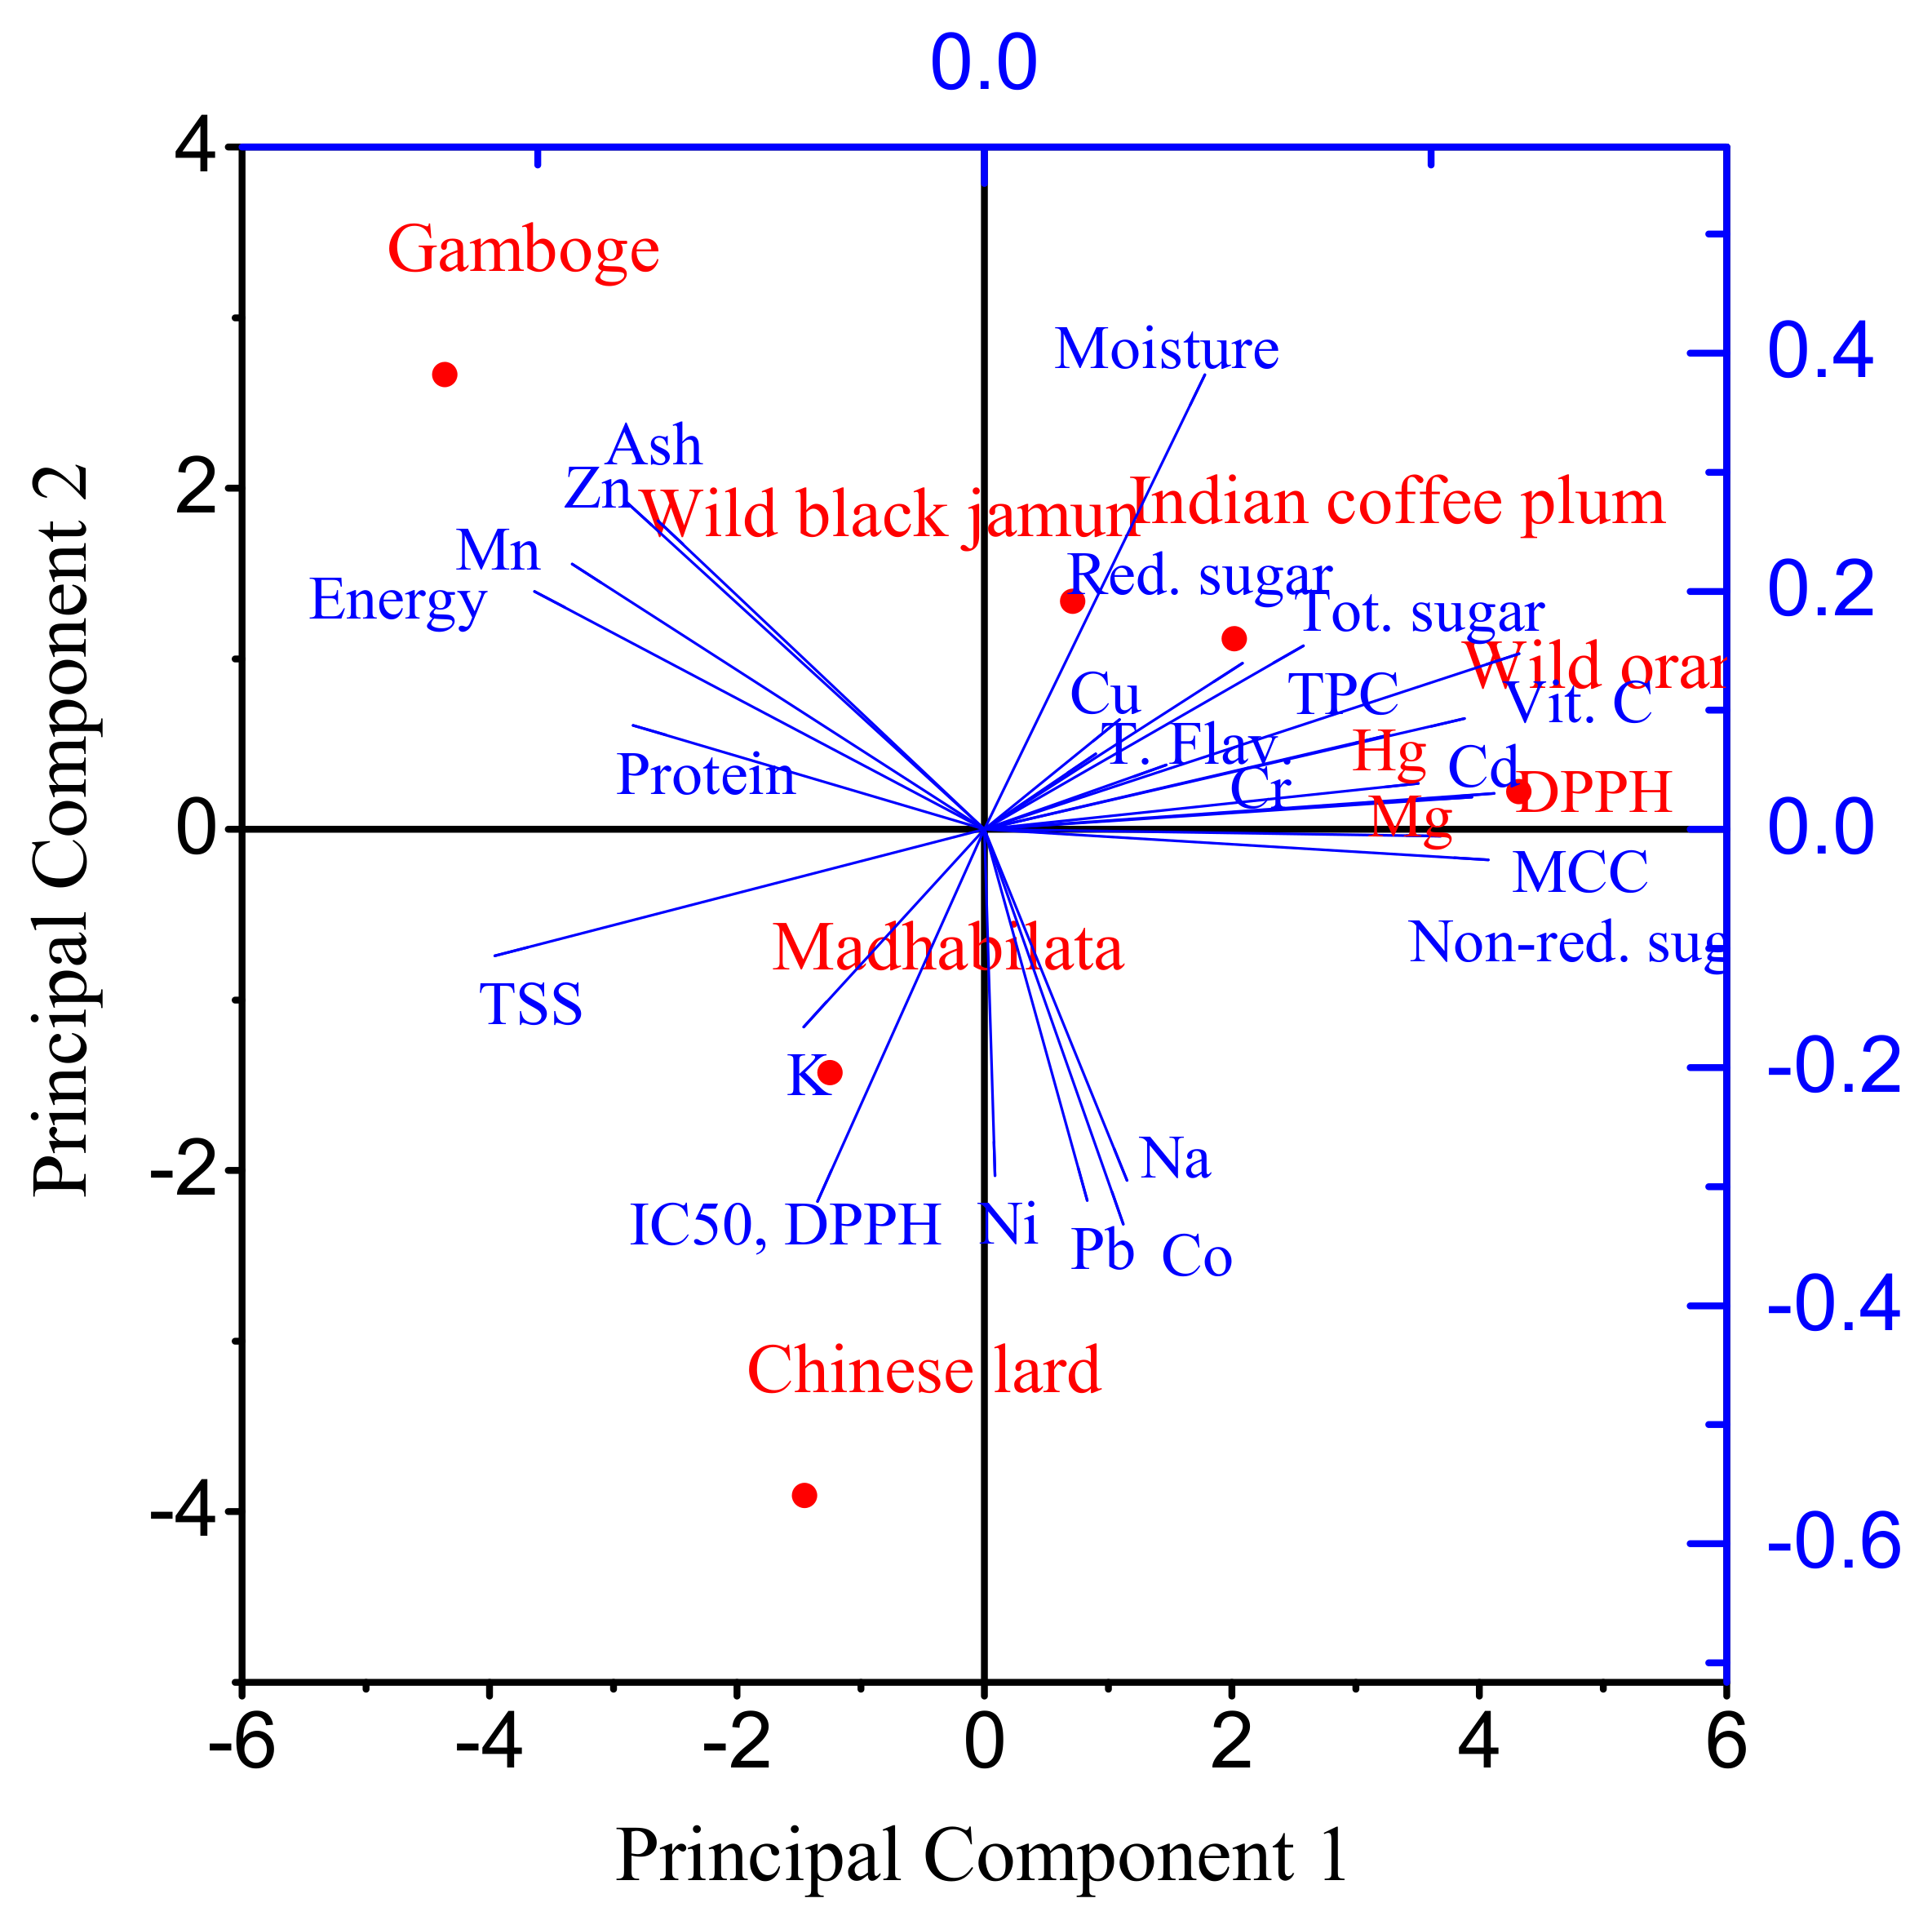
3.4. Principal Component Analysis (PCA)

In the PCA of 26 variables, five principal components (PCs) were extracted with an eigen value of >0.9 and this explained 100% of the variance in the data (Table S2). Total sugar, reducing sugar, and Cd were the highly weighted variables in PC1. In PC2, ash, Zn, and Mn were the highly weighted variables. In PC3, Co was the highly weighted variable, whereas Cu, Hg, and metal chelating capacity were the highly weighted variables in PC4. In PC5, Ni was the highly weighted variable. To avoid redundancy, total sugar was selected from PC1 as the key indicator. Cd and reducing sugar were dropped. Among the other PCs, based on importance, Zn, Mn, and Cu were selected. Therefore, total sugar, Zn, Mn, and Cu were the key indicators identified and should be given importance while studying the nutritional value of these wild fruits. Figure 1 shows the bi-plot of PC1 vs. PC2 for all the variables analyzed in six fruit samples. The loading plot describes the impact of variables and correlation, i.e., closeness of angles. The observation data refers that Cr, Cu, Hg, K, Cd, and Mg are correlated with each other in Indian coffee and Wild orange. These nutrients showed a positive direction of PC1 and PC2, suggesting that Cr, Cu, Hg, K, Cd, and Mg nutrients are rich in Indian coffee and Wild orange. The Ni, Co, and Pb lie in the positive direction of PC1, referring to Madhabilata and Chinese lard which are a rich source of these elements. Total and reducing sugar, Vitamin C, and moisture are trending in the positive direction of PC1 and PC2, illustrating that enrichment to wild orange and wild black Jamun are highly correlated. The Gamboge is a protein-rich and energetic fruit.

4. Conclusions

The nutrient contents and antioxidant capacities of the six wild edible fruits available in four districts of Tripura were evaluated. Indian coffee plum and wild orange could be treated as vitamin C-rich fruits whose values are 223.25 ± 23.62 mg/100 mL and 220.75 ± 12.23 mg/100 mL, respectively. The Madhabilata and the Gamboge contain considerable protein value (0.744% and 0.525%) and thus paramount energy. According to the regression analysis, energy has a good correlation with ash, TSS, and protein. The fruits are high in nutrients and minerals and can be found quite high in wild orange. As expected, Na has a good correlation with K. The wild orange has a high value of antioxidant activity; it has a good correlation with TPC, TFC, and MCC. Total sugar, Zn, Mn, and Cu were the key nutritional parameters to be given more emphasis while studying these minor fruits. Creating mass awareness for the use of these minor wild edible fruits would help to prevent sufferers from many nutrition deficiency diseases. The study also emphasized popularizing edible fruits among common people, which enhances their market value directly or indirectly and improves the livelihood of remote area tribal communities. This encourages all the community of people to conserve as well as cultivate wild edible fruits. Moreover, it would provide a baseline database for the nutrient profile of these fruits as well as enhance awareness regarding the value of the fruit, which helps conserve biodiversity in the forest area of Tripura.

Supplementary Materials

The following supporting information can be downloaded at: https://www.mdpi.com/article/10.3390/su141912194/s1, Figure S1: Indian Communities Map; Figure S2: Photographs of the wild edible fruits: (a) wild orange (Citrus macroptera), (b) Chinese lard (HodgsoniamacrocarpaCogn.), (c) madhabilata (StixissuaveolensRoxb. Pierre), (d) wild small black jamun (Syzygiumassamicum), (e) gamboge (Garcinia gummi-gutta (L.) Robs), and (f) Indian coffee plum (FlacourtiajangomasLour. Raeusch).; Figure S3: Macronutrient compositions of the six wild edible fruits of Tripura. Units of the nutrients as in Table 1.; Figure S4. Antioxidant activity of methanol extract of the fruits.; Table S1: List of the six wild edible fruits of Tripura state with identification and authentication [Biswas et al., 2018] [15]. Table S2. Principal components (PC) and component loadings extracted from different parameters analysed from six fruits were used to interpret the PC.

Author Contributions

Concept and designed the experiment: S.C.B., T.K.M., S.D., P.K., R.K. and D.D.; performed the experiments: S.C.B., R.K. and P.K.; analyzed the data: T.K.M., S.D. and P.K.; contributed reagents/materials/analysis tools: S.D., S.C.B. and R.K.; contributed to the writing of the manuscript: S.C.B., T.K.M., S.D., P.K. and D.D. All authors have read and agreed to the published version of the manuscript.

Funding

This research received no external funding; research was carried out by Ph.D. research scholar. All the expenditures were borne by the student.

Institutional Review Board Statement

Not applicable.

Informed Consent Statement

Not applicable.

Data Availability Statement

The data supporting the finding of this study are available from the corresponding author, S.B and P.K. upon reasonable request.

Acknowledgments

The authors are thankful to local vegetable vendors, villagers Mani Sankar Reang, Purnajoy Reang, Manindra Debbarma, Pabindra Debbarma, Amrit Debbarma, Joydeb Debbarma ex. Forest officer and office bearer Swapan Debbarma, Mohan Reang, Department of Forest of Govt. of Tripura, for their kind assistance. The authors offer special thanks to Umarani Debnath (Paul) for assisted cleaning, washing, shade drying, and grinding prepared powder. Further, the authors are thankful to KVK Senior Scientist and Head Manoj Singh Sachan, Scientist Ardhendhu Chakraborty, Farm Manager Prasanta Reang other officials, Krishi Vigyan Kendra (KVK, Khowai Tripura), and others who are directly or indirectly involved in carrying out the present research also offered sincere gratefulness. Last but not least authors are indeed thankful to the National Institute of Technology Agartala and National Institute of Technology Patna for providing useful information, guidance as well as research facilities.

Conflicts of Interest

The authors declare no conflict of interest.

References

  1. Jena, P.R.; Grote, U. Fairtrade certification and livelihood impacts on small scale coffee producers in a tribal community of India. Appl. Econ. Perspect. Policy 2016, 39, 87–110. [Google Scholar] [CrossRef]
  2. Ghosh-Jerath, S.; Singh, A.; Kamboj, P.; Goldberg, G.; Magsumbol, M.S. Traditional knowledge and nutritive value of indigenous foods in the Oraon tribal community of Jharkhand: An Exploratory cross sectional Study. Ecol. Food Nutr. 2015, 54, 493–519. [Google Scholar] [CrossRef] [PubMed]
  3. Hazarika, T.K.; Pongener, M. Potential wild edible fruits of Nagaland, North-east India and its significance in the livelihood and nutritional security of rural, indigenous people. Genet. Resour. Crop Evol. 2017, 65, 199–215. [Google Scholar] [CrossRef]
  4. Hudson, S.; Krogman, N.; Beckie, M. Social practices of knowledge mobilization for sustainable food production: Nutrition gardening and fish farming in the kolli hills of India. Food. Secur. 2016, 8, 523–533. [Google Scholar] [CrossRef]
  5. Roy, H. Agricultural in tribal society: Past and present (A case study of Lohit district of Arunachal Pradesh). Indian Anthropol. 1994, 24, 53–64. [Google Scholar]
  6. Mathukia, R.K.; Ponkia, H.P.; Mathukia, P.R.; Savalia, N.V. Organic Farming: Climate Resilient Agriculture. Eco-Friendly Agric. J. 2016, 11, 95–105. [Google Scholar]
  7. Tinttunen, S.; Lehtonen, P. Distinguishing organic wines from normal wines on the basis of phenolic compounds and spectral data. Eur. Food Res. Technol. 2001, 212, 390–394. [Google Scholar] [CrossRef]
  8. Caris, V.C.; Aiot, M.J.; Tysandier, V.; Grasselly, D.; Buret, M.; Mikolajczak, M.; Guillan, J.C.; Bouteloup, D.C.; Borel, P. Influence of organic versus conventional agricultural practice on the antioxidant micro-constituent content of tomatoes and relived purees; consequences on antioxidant plasma status in humans. J. Agric. Food Chem. 2004, 52, 6503–6509. [Google Scholar] [CrossRef]
  9. Debnath, A.; Bhattacharjee, N. Understanding malnutrition of tribal children in India: The role of women’s empowerment. Ecol. Food Nutr. 2016, 55, 508–527. [Google Scholar] [CrossRef]
  10. Ghosh, S.; Varerkar, S.A. Undernutrition among tribal children in Palghar district, Maharashtra, India. PLoS ONE 2019, 14, e0212560. [Google Scholar] [CrossRef]
  11. Reddy, P.H.; Petrou, M.; Reddy, P.A.; Tiwary, R.S.; Modell, B. Hereditary anemias and iron deficiency in a tribal population (the Baiga) of central India. Eur. J. Haematol. 1995, 55, 103–109. [Google Scholar] [CrossRef]
  12. Vyas, S.; Choudhry, M. Prevalence of anemia in tribal school children. J. Hum. Ecol. 2005, 17, 289–291. [Google Scholar] [CrossRef]
  13. Nie, P.; Rammohan, A.; Gwozdz, W.; Sousa-Poza, A. Changes in child nutrition in India: A Decomposition Approach. Int. J. Environ. Res. Public. Health 2019, 16, 1815. [Google Scholar] [CrossRef]
  14. Deka, S. Health and nutritional status of the Indian tribes of Tripura and effects on education. Inq. J. 2011, 3, 1–18. [Google Scholar]
  15. Biswas, S.C.; Majumdar, M.; Das, S.; Misra, T.K. Diversity of wild edible minor fruits used by the ethnic communities. Indian J. Tradit. Knowl. 2018, 17, 282–289. [Google Scholar]
  16. Kolap, R.M.; Kakade, P.S.; Mankar, G.D.; Barmukh, R.B.; Gacche, R.N.; Zimare, S.B. Bioprospection of underutilized wild Cissuswoodrowii fruits for nutritional value and characterization of green-extracted antioxidant phenolic compounds. J. Appl. Res. Med. Aromat. Plants 2022, 29, 100371. [Google Scholar]
  17. Bayang, J.P.; Laya, A.; Kolla, M.C.; Koubala, B.B. Variation of physical properties, nutritional value and bioactive nutrients in dry and fresh wild edible fruits of twenty-three species from Far North region of Cameroon. J. Agric. Food Res. 2021, 4, 100146. [Google Scholar] [CrossRef]
  18. Tardugno, R.; Gervasi, T.; Nava, V.; Cammilleri, G.; Ferrantelli, V.; Cicero, N. Nutritional and mineral composition of persimmon fruits (Diospyros kaki L.) from Central and Southern Italy. Nat. Product. Res. 2021, 7, 1–6. [Google Scholar] [CrossRef]
  19. Acharya, S. Citrus macroptera Montrouz var. annamensis Tanaka: A potential nutraceutical for ethno-fishery. Curr. Sci. 2018, 114, 272–274. [Google Scholar] [CrossRef]
  20. Das, K.K. Underutilized and under exploited fruits of Tripura—A review. Int. J. Pure Appl. Biosci. 2018, 6, 1641–1644. [Google Scholar] [CrossRef]
  21. Deb, D.; Sarkar, A.; Barma, B.D.; Datta, B.K.; Majumdar, K. Wild edible plants and their use in traditional recipes of Tripura, northeast India. Advan. Biol. Res. 2013, 7, 203–211. [Google Scholar]
  22. Sankaran, M. Wild edible fruits of Tripura. Nat. Prod. Res. 2006, 5, 302–305. [Google Scholar]
  23. Sharma, B.D.; Hore, D.K.; Gupta, S.G. Genetic resources of Citrus of north-eastern India and their potential use. Genet. Resour. Crop Evol. 2004, 51, 411–418. [Google Scholar] [CrossRef]
  24. Sasi, S.; Anjum, N.; Tripathi, Y.C. Ethnomedicinal, phytochemical and pharmacological aspects of flacourtiajangomas: A review. Int. J. Pharm. Pharm. Sci. 2018, 10, 9–15. [Google Scholar] [CrossRef]
  25. Kumar, R.S.; Kumar, S.V.; Lathiff, M.A.; Pachiappan, S. Antioxidant and anti-inflammatory activity of leaf extract of Flacourtia jangomas (lour.) Raeusch: An in vitro study. Adv. Pharm. J. 2018, 3, 169–176. [Google Scholar]
  26. Singh, A.K.; Gohain, I.; Shyamalamma, S. Morphological variability in jackfruit grown under an agro-forestry system of Tripura. Indian J. Hortic. 2018, 75, 376. [Google Scholar] [CrossRef]
  27. Anh, N.Q.; Yen, T.T.; Hang, N.T.; Anh, D.H.; Viet, P.H.; Hoang, N.H.; Van-Doan, V.; Van-Kiem, P. Phenolic and lignan compounds from Stixis suaveolens. Vietnam J. Chem. 2019, 57, 311–317. [Google Scholar] [CrossRef]
  28. Ngo, Q.A.; Tran, T.Y.; Nguyen, T.H.; Nguyen, V.T.; Duong, H.A.; Pham, H.V. Stixilamides, A and B, two new phenolic amides from the leaves of Stixis suaveolens. Nat. Prod. Res. 2019, 35, 1384–1387. [Google Scholar] [CrossRef]
  29. Khruomo, N.; Deb, C.R. Indigenous wild edible fruits: Sustainable resources for food, medicine, and income generation—A study from Nagaland, India journal of experimental biology and agricultural sciences. J. Exp. Biol. Agric. Sci. 2018, 6, 405–413. [Google Scholar] [CrossRef]
  30. Biswas, S.C.; Bora, A.; Mudoi, P.; Misra, T.K.; Das, S. Evaluation of nutritional value, antioxidant activity and phenolic content of Protium serratum Engl and Artocarpus chama Buch.-Ham, wild edible fruits available in Tripura, a North- Eastern state of India. Curr. Nutr. Food. Sci. 2022, 18, 589–596. [Google Scholar]
  31. AOAC International. Official Method of Analysis, 15th ed.; Helrich, K., Ed.; Association of Official Analytical Chemists: Arlington, VA, USA; Washington, DC, USA, 1990; Volume 2. [Google Scholar]
  32. Nelson, N.A. Photometric adaptation of the Somogyi method for determination glucose. J. Biol. Chem. 1944, 153, 375–380. [Google Scholar] [CrossRef]
  33. McKee, J.M.T. A simple method for the extraction of reducing and non-reducing sugars from carrot and other storage root vegetables. J. Sci. Food. Agric. 1985, 36, 55–58. [Google Scholar] [CrossRef]
  34. Cohen, B.L.; Schilken, C.A. Calorie content of foods: A Laboratory experiment introducing measuring by calorimeter. J. Chem. Educ. 1994, 71, 342. [Google Scholar] [CrossRef]
  35. Singh, R.P.; Murthy, K.N.C.; Jayaprakasha, G.K. Studies on the antioxidant activity of pomegranate (Punicagranatum). J. Agric. Food. Chem. 2002, 50, 81–86. [Google Scholar] [CrossRef]
  36. Chang, C.C.; Yang, M.H.; Wen, H.M.; Chern, J.C. Estimation of total Flavonoid content in propolis by two complementary colorimetric methods. J. Food Drug Anal. 2002, 3, 178–182. [Google Scholar]
  37. Biesalski, H.K.; Jana, T. Micronutrients in the life cycle: Requirements and Sufficient supply. NFS J. 2011, 11, 1–11. [Google Scholar] [CrossRef]
  38. Bernard, J.V. Macronutrients and Human Health for the 21st Century. Nutrients 2020, 12, 2363. [Google Scholar]
  39. Jeeva, S. Horticultural potential of wild edible fruits used by the Khasi tribes of Meghalaya. J. Hortic. For. 2009, 1, 182–189. [Google Scholar]
  40. Kumari, P.; Khatkar, B.S. Assessment of total polyphenol, antioxidants and antimicrobial properties of Aonla varieties. J. Food. Sci. Technol. 2016, 53, 3093–3103. [Google Scholar] [CrossRef]
  41. Tharanathan, R.; Yashoda, H.; Prabha, T. Mango (Mangiferaindica L.) “The king of fruits”—An overview. Food Rev. Int. 2006, 22, 95–123. [Google Scholar] [CrossRef]
  42. Dar, M.S.; Oak, P.; Chidley, H.; Deshpande, A.; Giri, A.; Gupta, V. Nutritional Composition of Fruit Cultivars. In Nutrient and Flavor Content of Mango (Mangiferaindica L.) Cultivars: An Appurtenance to the List of Staple Foods; Elsevier: Amsterdam, The Netherlands, 2016; pp. 445–467. [Google Scholar]
  43. Aurore, G.; Parfait, B.; Fahrasmane, L. Bananas, raw materials for making processed food products. Trends Food Sci. Technol. 2009, 20, 78–91. [Google Scholar] [CrossRef]
  44. Goñi, I.; Hernández-Galiot, A. Intake of Nutrient and Non-Nutrient Dietary Antioxidants. Contribution of Macromolecular Antioxidant Polyphenols in an Elderly Mediterranean Population. Nutrients 2019, 11, 2165. [Google Scholar] [CrossRef] [Green Version]
  45. Phuyal, N.; Jha, K.P.; Raturi, P.P.; Rajbhandary, S. Total phenolic, Flavonoid Contents, and Antioxidant activities of fruit, seed, and Bark Extract of Zanthoxylum armatum DC. Sci. World J. 2020, 2020, 8780704. [Google Scholar] [CrossRef]
  46. Wojdylo, A.; Oszmianski, J.; Czemerys, R. Antioxidant activity and phenolic compounds in 32 selected herbs. Food Chem. 2007, 105, 940–949. [Google Scholar] [CrossRef]
Figure 1. Principal component analysis (PCA) Bi-plot (score and loading plot) of all the parameters of six fruit samples.
Sustainability 14 12194 g001
Table 1. Nutrient composition of the fruits.
Plant Species
(English Name)
Moisture
(%)
Ash (%)TSS
(° B)
Protein (%)Tot. Sugar (mg/100 g)Red. Sugar (mg/100 g)Non-Reducing Sugar
(mg/100 g)
Vit. C
(mg/100 g)
Energy
(Kcal)
Wild orange83.80 ± 3.26 a4.49 ± 1.26 b86.38 ± 4.23 b0.088 ± 0.03 c10.92 ± 1.45 a4.31 ± 1.03 a6.61 ± 1.45 a220.75 ± 12.23 a29.01 ± 2.45 d
Chinese lard71.28 ± 3.89 b3.38 ± 1.32 bc93.02 ± 4.65 ab0.131 ± 0.03 c4.52 ± 1.32 c1.92 ± 0.23 c2.60 ± 0.52 c14.53 ± 1.49 c26.75 ± 2.69 d
Madhabilata73.26 ± 3.69 b3.9 ± 1.12 bc96.1 ± 5.62 a0.744 ± 0.04 a2.99 ± 1.06 c1.23 ± 0.36 c1.76 ± 0.32 c15.35 ± 2.13 c88.91 ± 5.24 a
Wild black jamun82.34 ± 4.32 a2.9 ± 0.82 c86.16 4.49 b0.438 ± 0.02 b7.84 ± 1.36 b3.67 ± 1.85 a4.17 ± 1.76 b137.45 ± 8.65 b62.85 ± 3.54 c
Indian coffee plum84.76 ± 4.36 a5.16 ± 1.56 b89.16 ± 5.12 b0.175 ± 0.02 c3.54 ± 1.25 c1.30 ± 0.3 c2.24 ± 0.56 c223.25 ± 23.62 a27.34 ± 2.68 d
Gamboge83.47 ± 4.12 a10.27 ± 1.98 a95.42 ± 5.69 a0.525 ± 0.02 b3.19 ± 1.26 c2.56 ± 0.74 b0.63 ± 0.04 d7.24 ± 1.54 c124.92 ± 6.85 b
Range71.28–84.762.9–20.2793.02–96.100.088–0.7442.99–4.311.23–4.311.76–6.617.24–223.2526.75–124.92
Values with different lower-case superscript (a–d) letters in a column are significantly different among the fruits at p < 0.05 (DMRT test performed for separation of mean). Values are expressed as mean ± SD with three replications (n = 3) for each experiment.
Table 2. Correlation among the macronutrient compositions of the six fruit samples.
MoistureAshTSSProteinTot. SugarR. SugarNon-R. SugarVit. CEnergy
Moisture1.00
Ash0.421.00
TSS−0.570.451.00
Protein−0.230.220.601.00
Tot. sugar0.36−0.37−0.82−0.491.00
R. sugar0.47−0.05−0.68−0.320.911.00
Non-R. sugar0.26−0.52−0.83−0.550.970.781.00
Vit. C0.69−0.27−0.86−0.590.610.400.681.00
Energy0.040.680.620.83−0.44−0.11−0.61−0.631.00
Significant values are made bold (p ≥ 0.5).
Table 3. Mineral content of the six wild edible fruits of Tripura (mg 100 g−1).
Plant SpeciesNaKMgZnCuNiCoMnCrCdHgPb
Wild orange170.4 ± 14.29 b55.40 ± 3.54 c61.53 ± 4.23 a6.85 ± 1.34 b6.25 ± 1.54 a3.80 ± 1.23 a0.77 ± 0.03 a6.65 ± 1.85 b2.82 ± 0.64 c7.1 ± 1.95 a0.048 ± 0.001 a3.02 ± 1.01 a
Chinese lard plant193.96 ± 16.52 a80.44 ± 4.96 a20.13 ± 2.23 b1.11 ± 0.02 c-4.12 ± 1.63 a0.75 ± 0.04 a6.77 ± 1.87 b3.53 ± 1.02 c-0.034 ± 0.003 a3.35 ± 1.35 a
Madhabilata201.26 ± 19.45 a69.32 ± 4.23 b7.35 ± 1.65 c7.46 ± 1.46 b5.93 ± 1.25 a3.41 ± 1.04 a0.86 ± 0.01 a2.49 ± 0.95 b13.59 ± 1.89 b-0.042 ± 0.001 a3.69 ± 1.42 a
Wild black jamun148.31 ± 12.36 bc17.61 ± 2.23 d10.44 ± 1.56 c8.55 ± 1.43 b0.46 ± 0.02 c3.35 ± 1.03 a0.28 ± 0.01 b3.78 ± 1.33 b--0.038 ± 0.002 a2.91 ± 1.04 a
Indian coffee plum198.09 ± 18.42 a75.31 ± 4.58 b66.41 ± 4.62 a1.20 ± 0.14 c2.81 ± 0.46 b3.45 ± 1.09 a0.02 ± 0.001 b-58.63 ± 3.98 a6.87 ± 1.54 a0.039 ± 0.002 a1.29 ± 0.03 b
Gamboge140.67 ± 13.65 c70.69 ± 4.18 b3.266 ± 1.42 c23.7 ± 2.49 a3.77 ± 1.46 b3.55 ± 1.12 a-86.35 ± 6.46 a0.47 ± 0.01 c-0.037 ± 0.002 a1.26 ± 0.04 b
Values with different lower-case superscript (a–c) letters in a column are significantly different among the fruits at p < 0.05 (DMRT test performed for separation of mean). Values are expressed as mean ± SD with three replications (n = 3) for each experiment.
Table 4. Correlation among the micronutrient compositions of the six fruit samples.
NaKMgZnCuNiCoMnCrCdHgPb
Na1.00
K0.581.00
Mg0.360.171.00
Zn−0.78−0.11−0.541.00
Cu0.120.200.240.251.00
Ni0.230.460.15−0.30−0.221.00
Co0.480.10−0.04−0.420.290.471.00
Mn−0.660.19−0.440.920.10−0.05−0.511.00
Cr0.570.370.62−0.460.04−0.30−0.39−0.331.00
Cd0.250.130.98−0.380.400.04−0.09−0.330.581.00
Hg0.10−0.180.45−0.040.86−0.290.36−0.280.060.581.00
Pb0.35−0.20−0.25−0.420.050.290.93−0.58−0.48−0.310.221.00
Significant values are made bold (p ≥ 0.5).
Table 5. Estimation of antioxidant activity, MCC, and TPC in fruits.
Plant SpeciesDPPH (µmol/g)IC50, DPPH (µg/mL)MCC
(mg mL−1)
TPC
(mg GAE/g)
Total Flavonoid
(µg/mL)
Wild orange81.15 ± 4.63 a259.19 ± 24.37 b39.45 ± 3.05 a103.89 ± 6.47 c6.78 ± 1.86 c
Chinese lard plant14.96 ± 2.13 d1234.37 ± 32.28 a8.58 ± 2.17 d45.92 ± 3.21 d5.97 ± 1.29 c
Madhabilata51.88 ± 3.47 b57.26 ±3.86 c26.96 ± 2.49 b29.63 ± 2.91 de25.65 ± 2.49 ab
Wild black jamun34.14 ± 3.54 c6.12 ± 1.91 d14.85 ± 2.14 c267.34 ± 26.23 b31.26 ± 3.14 a
Indian coffee plum53.17 ± 3.97 b11.96 ± 2.17 d19.75 ± 2.39 bc382.47 ± 35.62 a21.36 ± 2.97 b
Gamboge11.87 ±2.11 d297.98 ± 35.37 b7.36 ± 1.46 d18.79 ± 2.86 e4.87 ± 1.42 c
Values with different lower-case superscript (a–e) letters in a column are significantly different among the fruits at p < 0.05 (DMRT test performed for separation of mean). Values are expressed as mean ± SD with three replications (n = 3) for each experiment.
Table 6. Correlation among antioxidant activity, MCC, and TPC of the six wild edible fruits.
DPPHMCCTPCTFC
DPPH1.00
MCC0.971.00
TPC0.810.671.00
TFC0.860.830.811.00
Table 7. A correlation analysis between macronutrients and antioxidant activity.
NaKMgZnCuNiCoMnCrCdHgPbProteinTot. SugarR. SugarNon-R. SugarVit. CEnergy
Na1.00
K0.581.00
Mg0.360.171.00
Zn−0.78−0.11−0.541.00
Cu0.120.200.240.251.00
Ni0.230.460.15−0.30−0.221.00
Co0.480.10−0.04−0.420.290.471.00
Mn−0.660.19−0.440.920.10−0.05−0.511.00
Cr0.570.370.62−0.460.04−0.30−0.39−0.331.00
Cd0.250.130.98−0.380.400.04−0.09−0.330.581.00
Hg0.06−0.180.50−0.050.83−0.150.39−0.26−0.010.621.00
Pb0.35−0.20−0.25−0.420.050.290.93−0.58−0.48−0.310.221.00
Protein−0.15−0.14−0.750.520.26−0.64−0.010.30−0.21−0.65−0.080.131.00
Tot. sugar−0.33−0.600.40−0.150.140.190.30−0.31−0.380.430.620.31−0.491.00
R. sugar−0.68−0.680.130.240.070.100.070.07−0.580.200.460.12−0.320.911.00
N-R. sugar−0.09−0.500.53−0.370.170.220.41−0.51−0.220.540.670.40−0.550.970.781.00
Vit. C0.05−0.320.87−0.410.15−0.18−0.19−0.470.490.880.55−0.24−0.590.610.400.681.00
Energy−0.52−0.04−0.750.890.25−0.47−0.300.77−0.37−0.61−0.16−0.230.83−0.44−0.11−0.61−0.631.00
Significant values are made bold (p ≥ 0.5).
Publisher’s Note: MDPI stays neutral with regard to jurisdictional claims in published maps and institutional affiliations.

