
Improving Road Safety during Nocturnal Hours by Characterizing Animal Poses Utilizing CNN-Based Analysis of Thermal Images

Abstract
:1. Introduction
2. Literature Review
3. Data Description
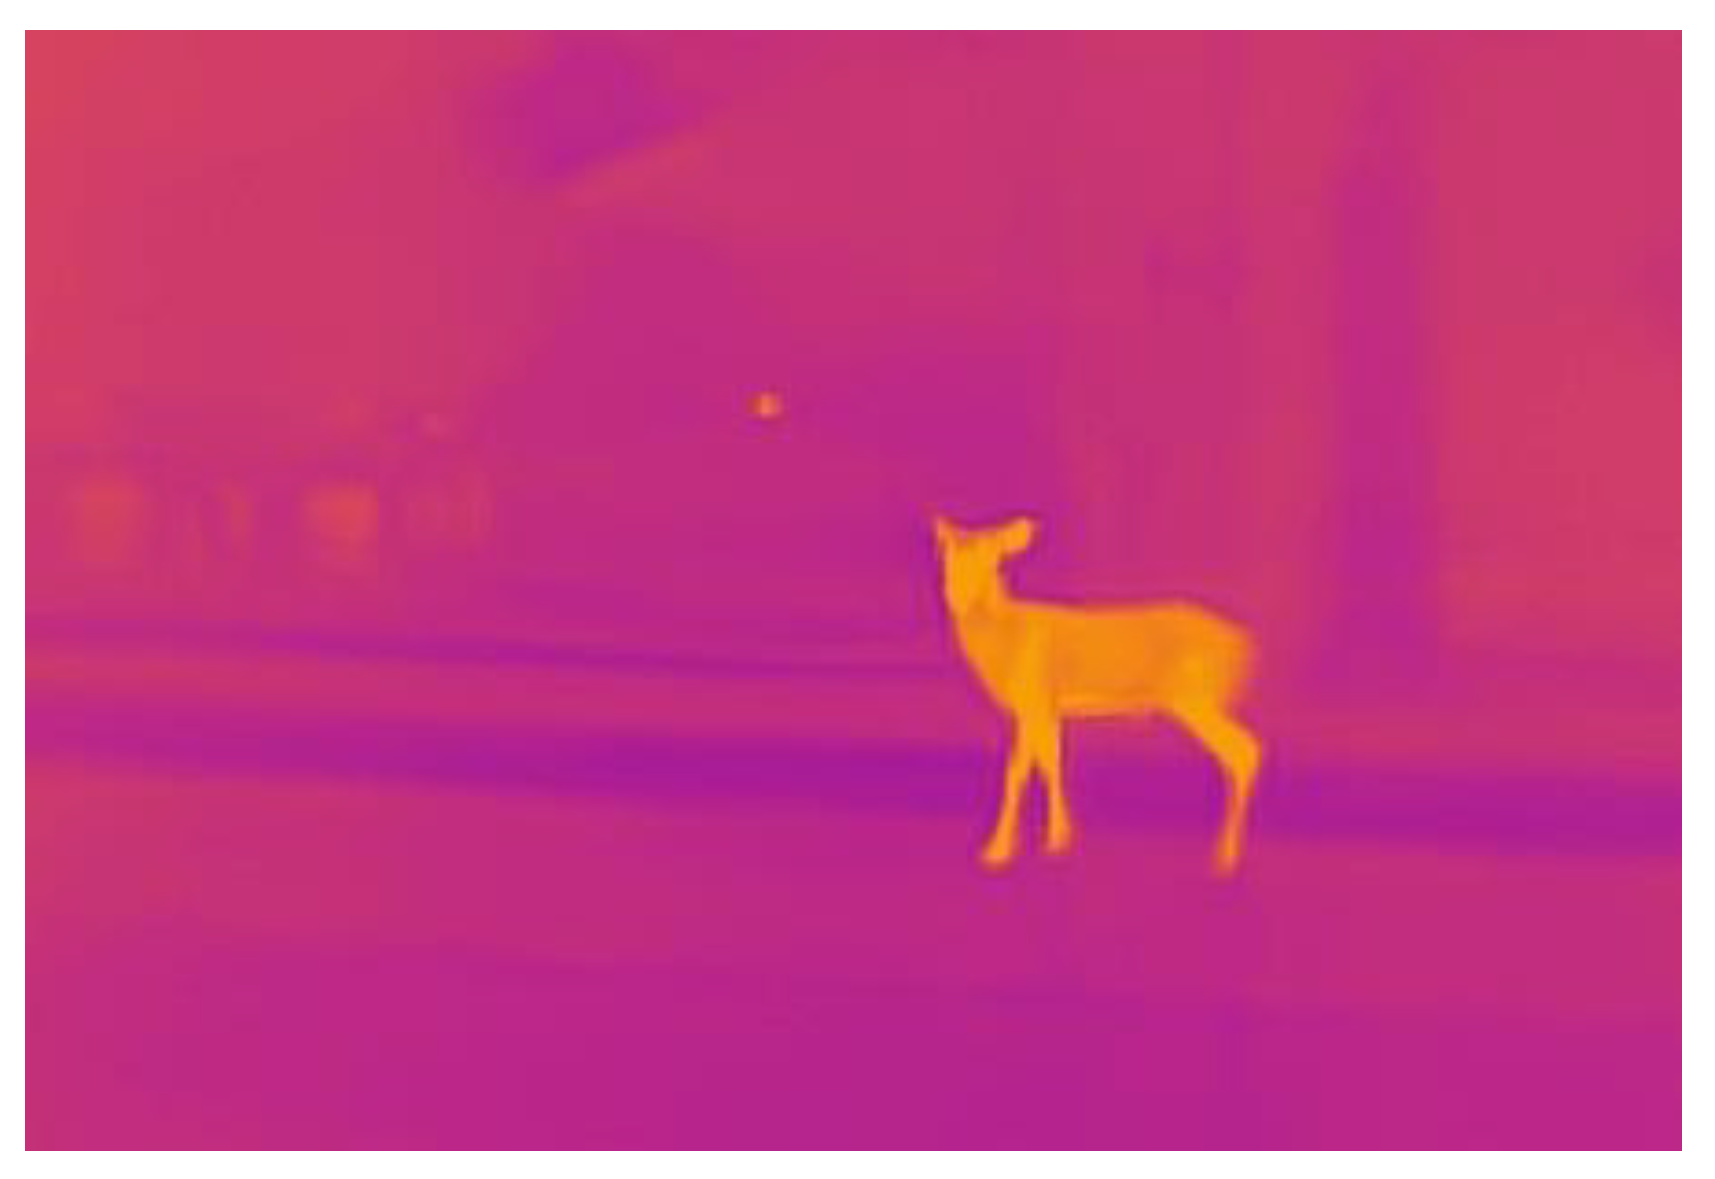
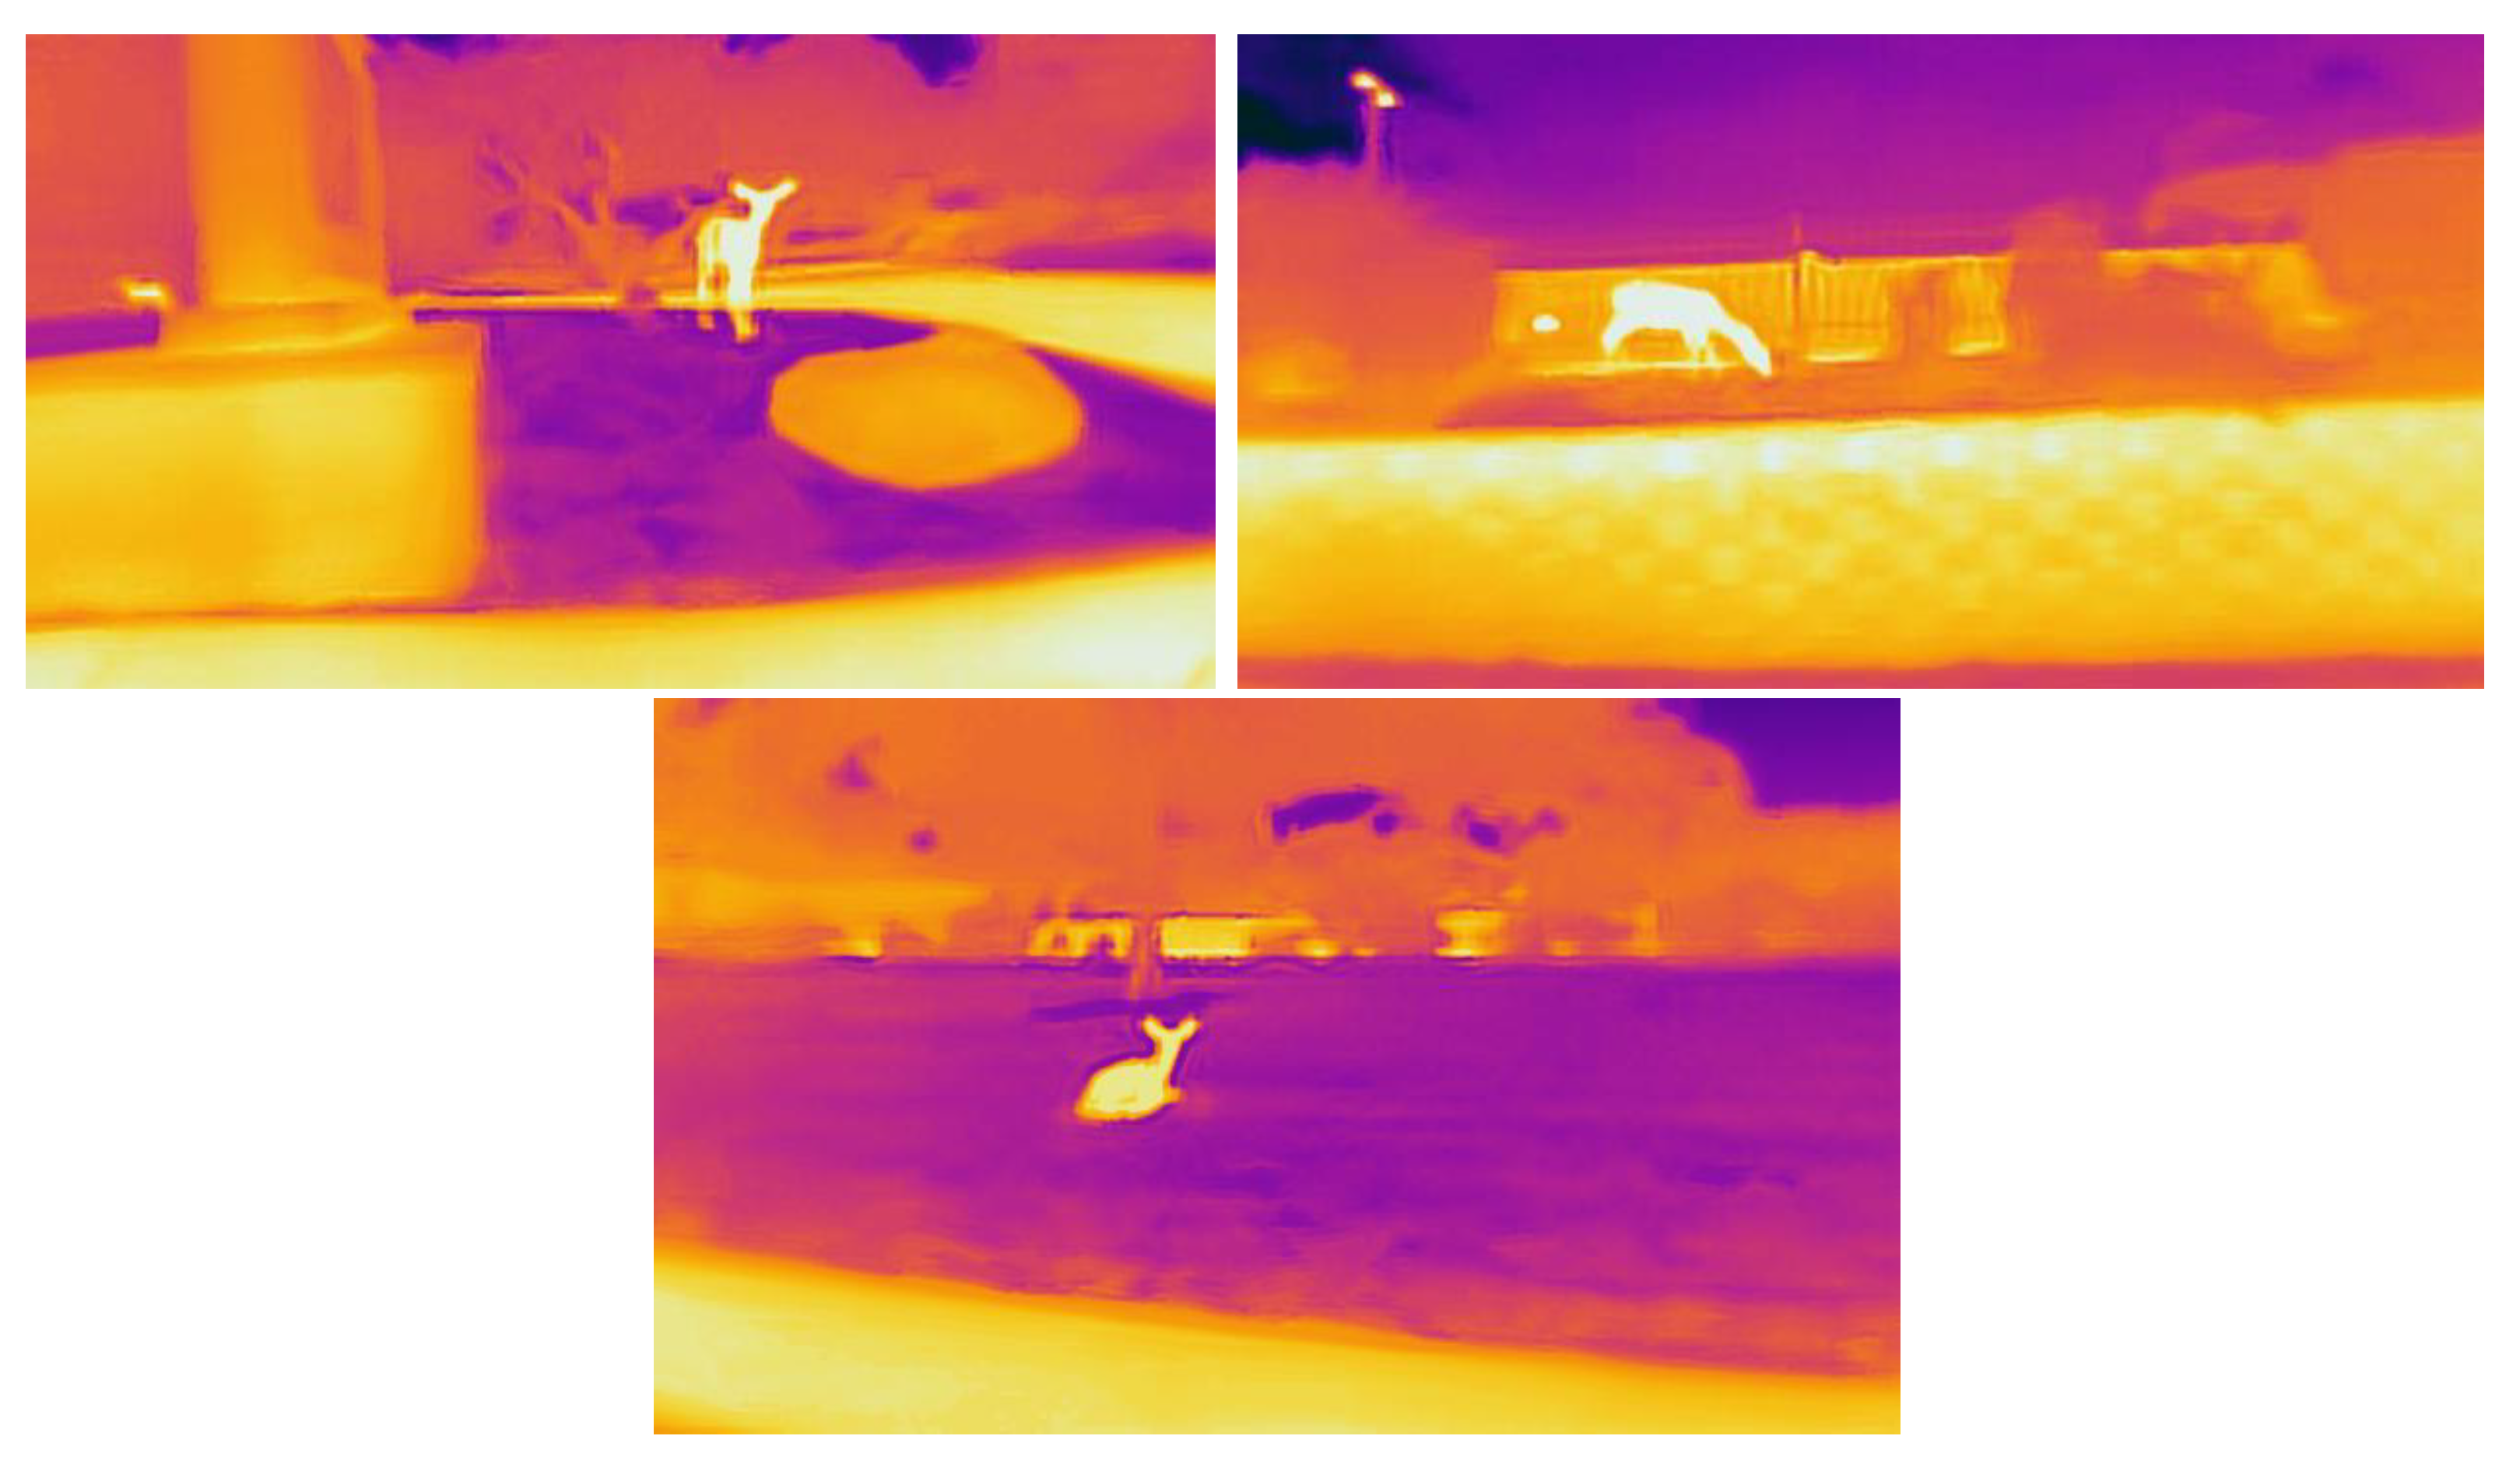
3.1. Thermal Image System Setup
3.2. Data Collection
3.3. Difficulties with Data Collection
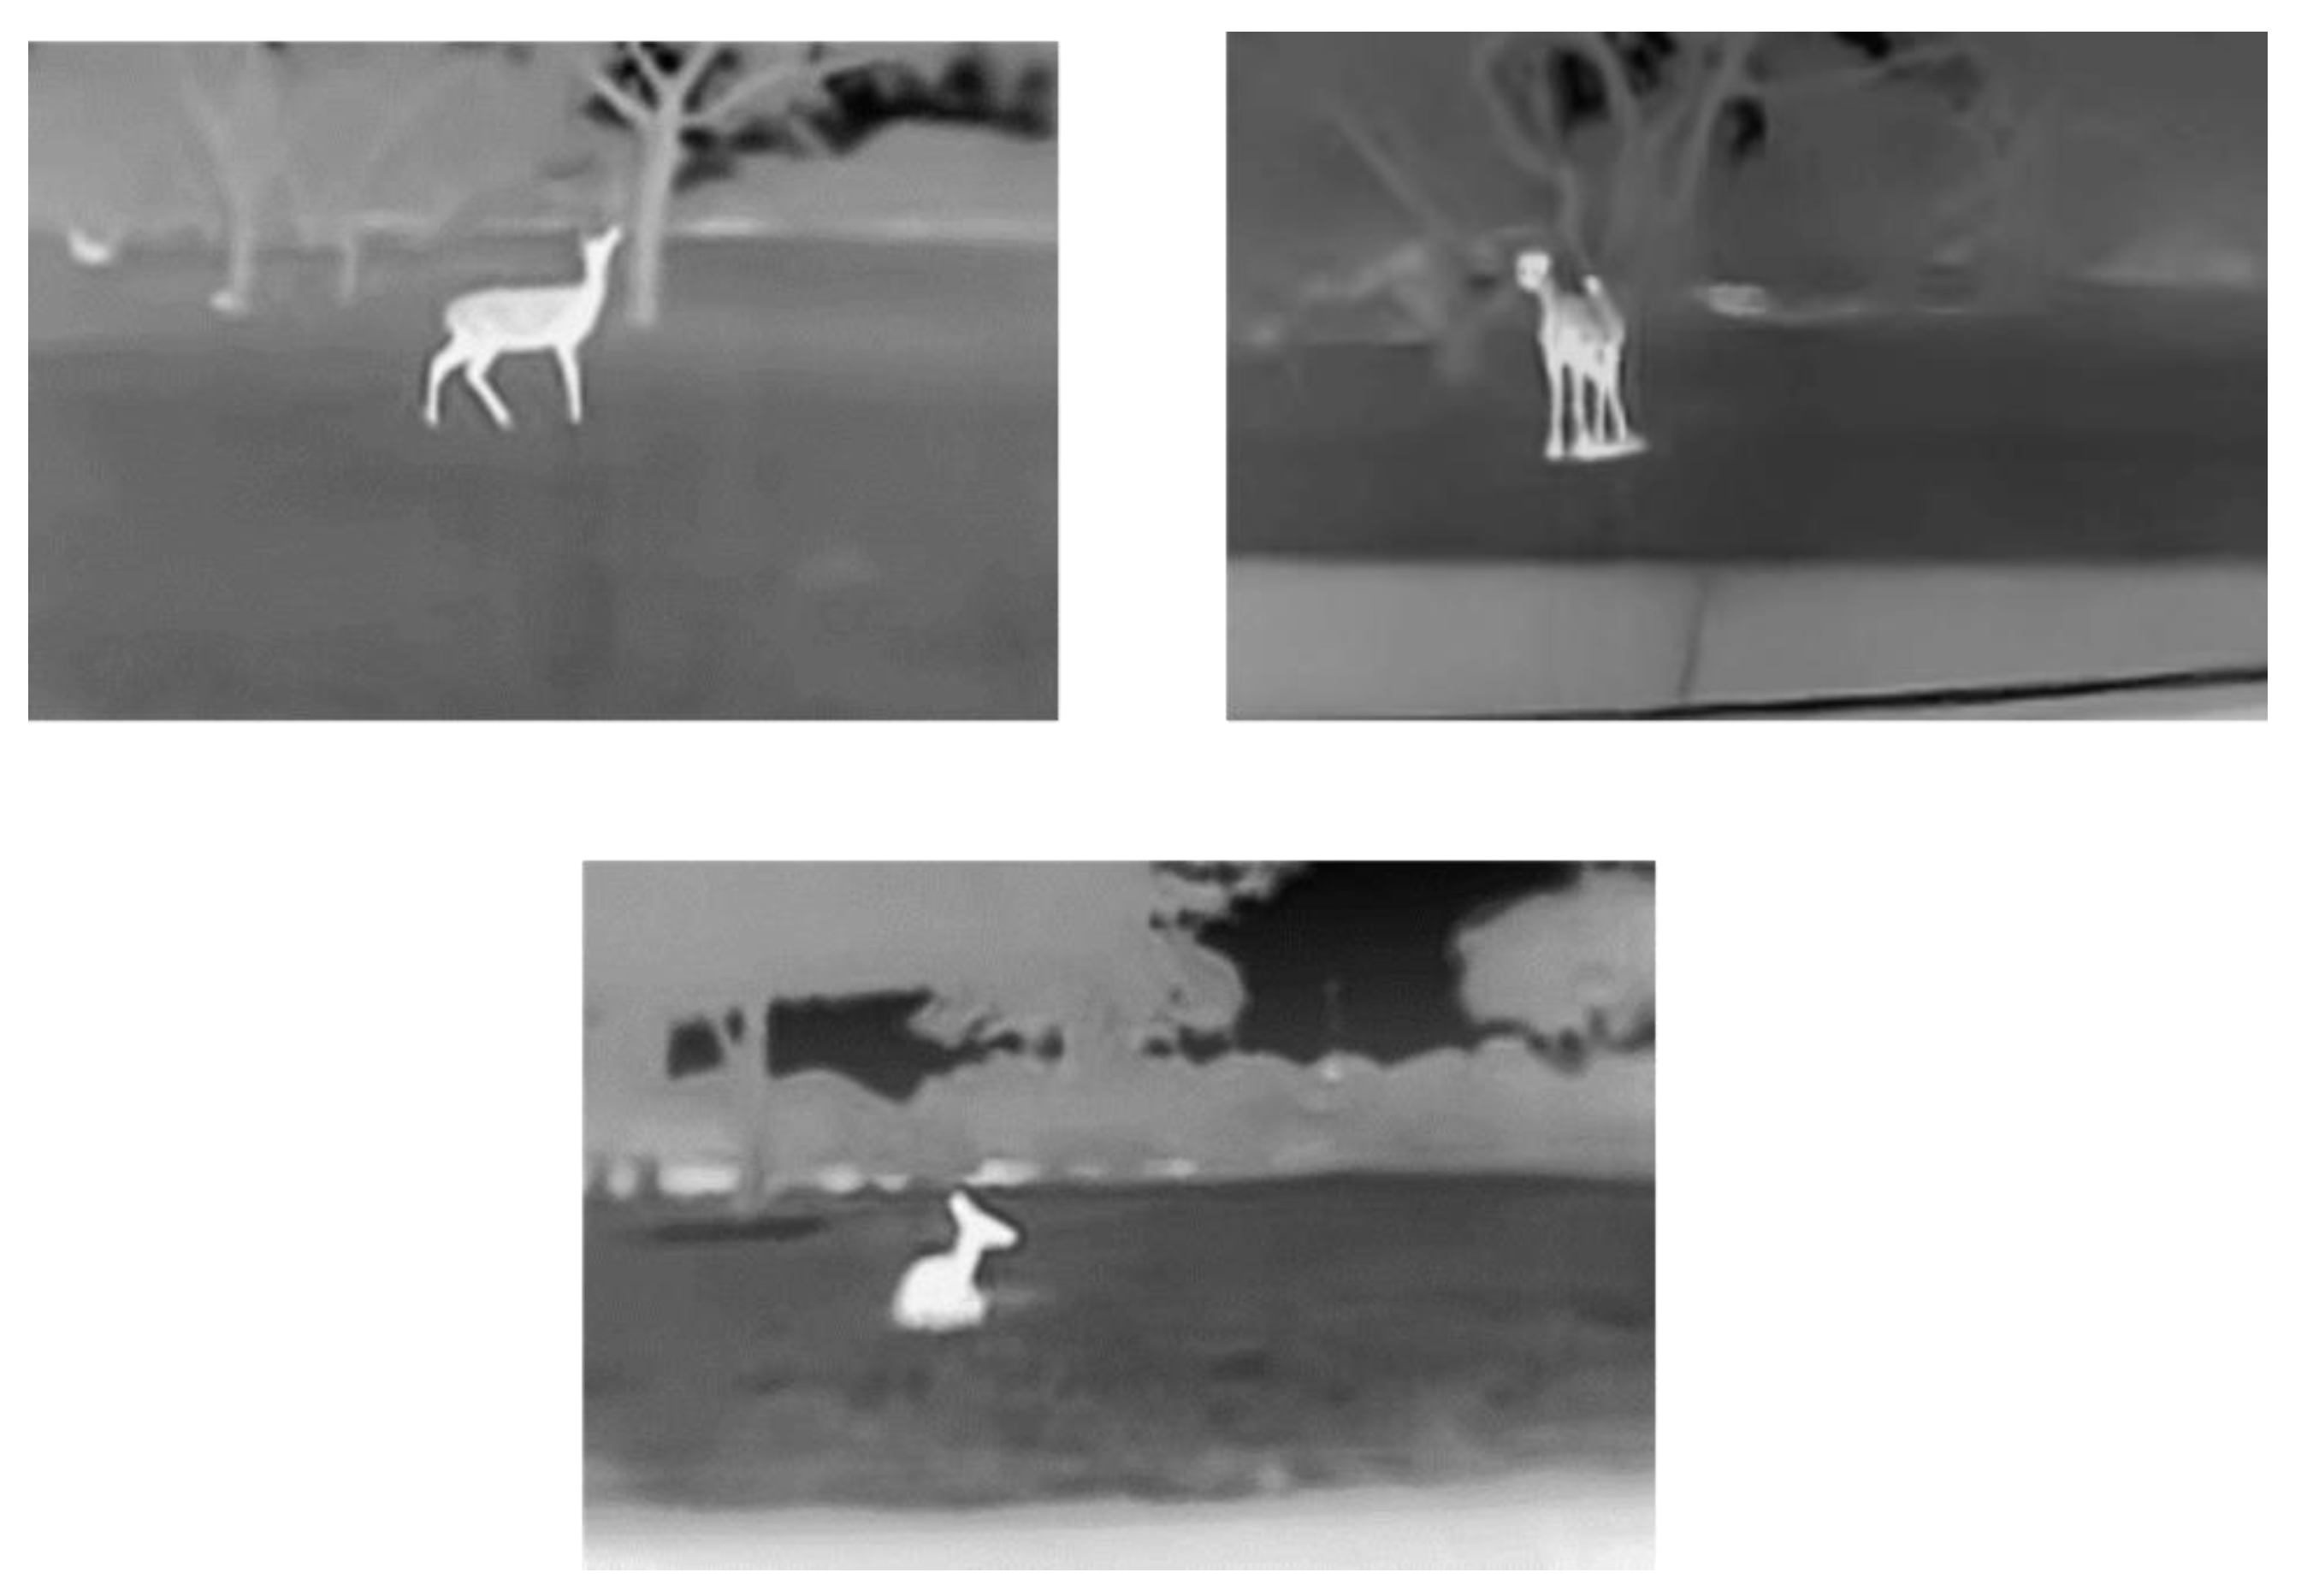
3.4. Data Processing
4. Methodology
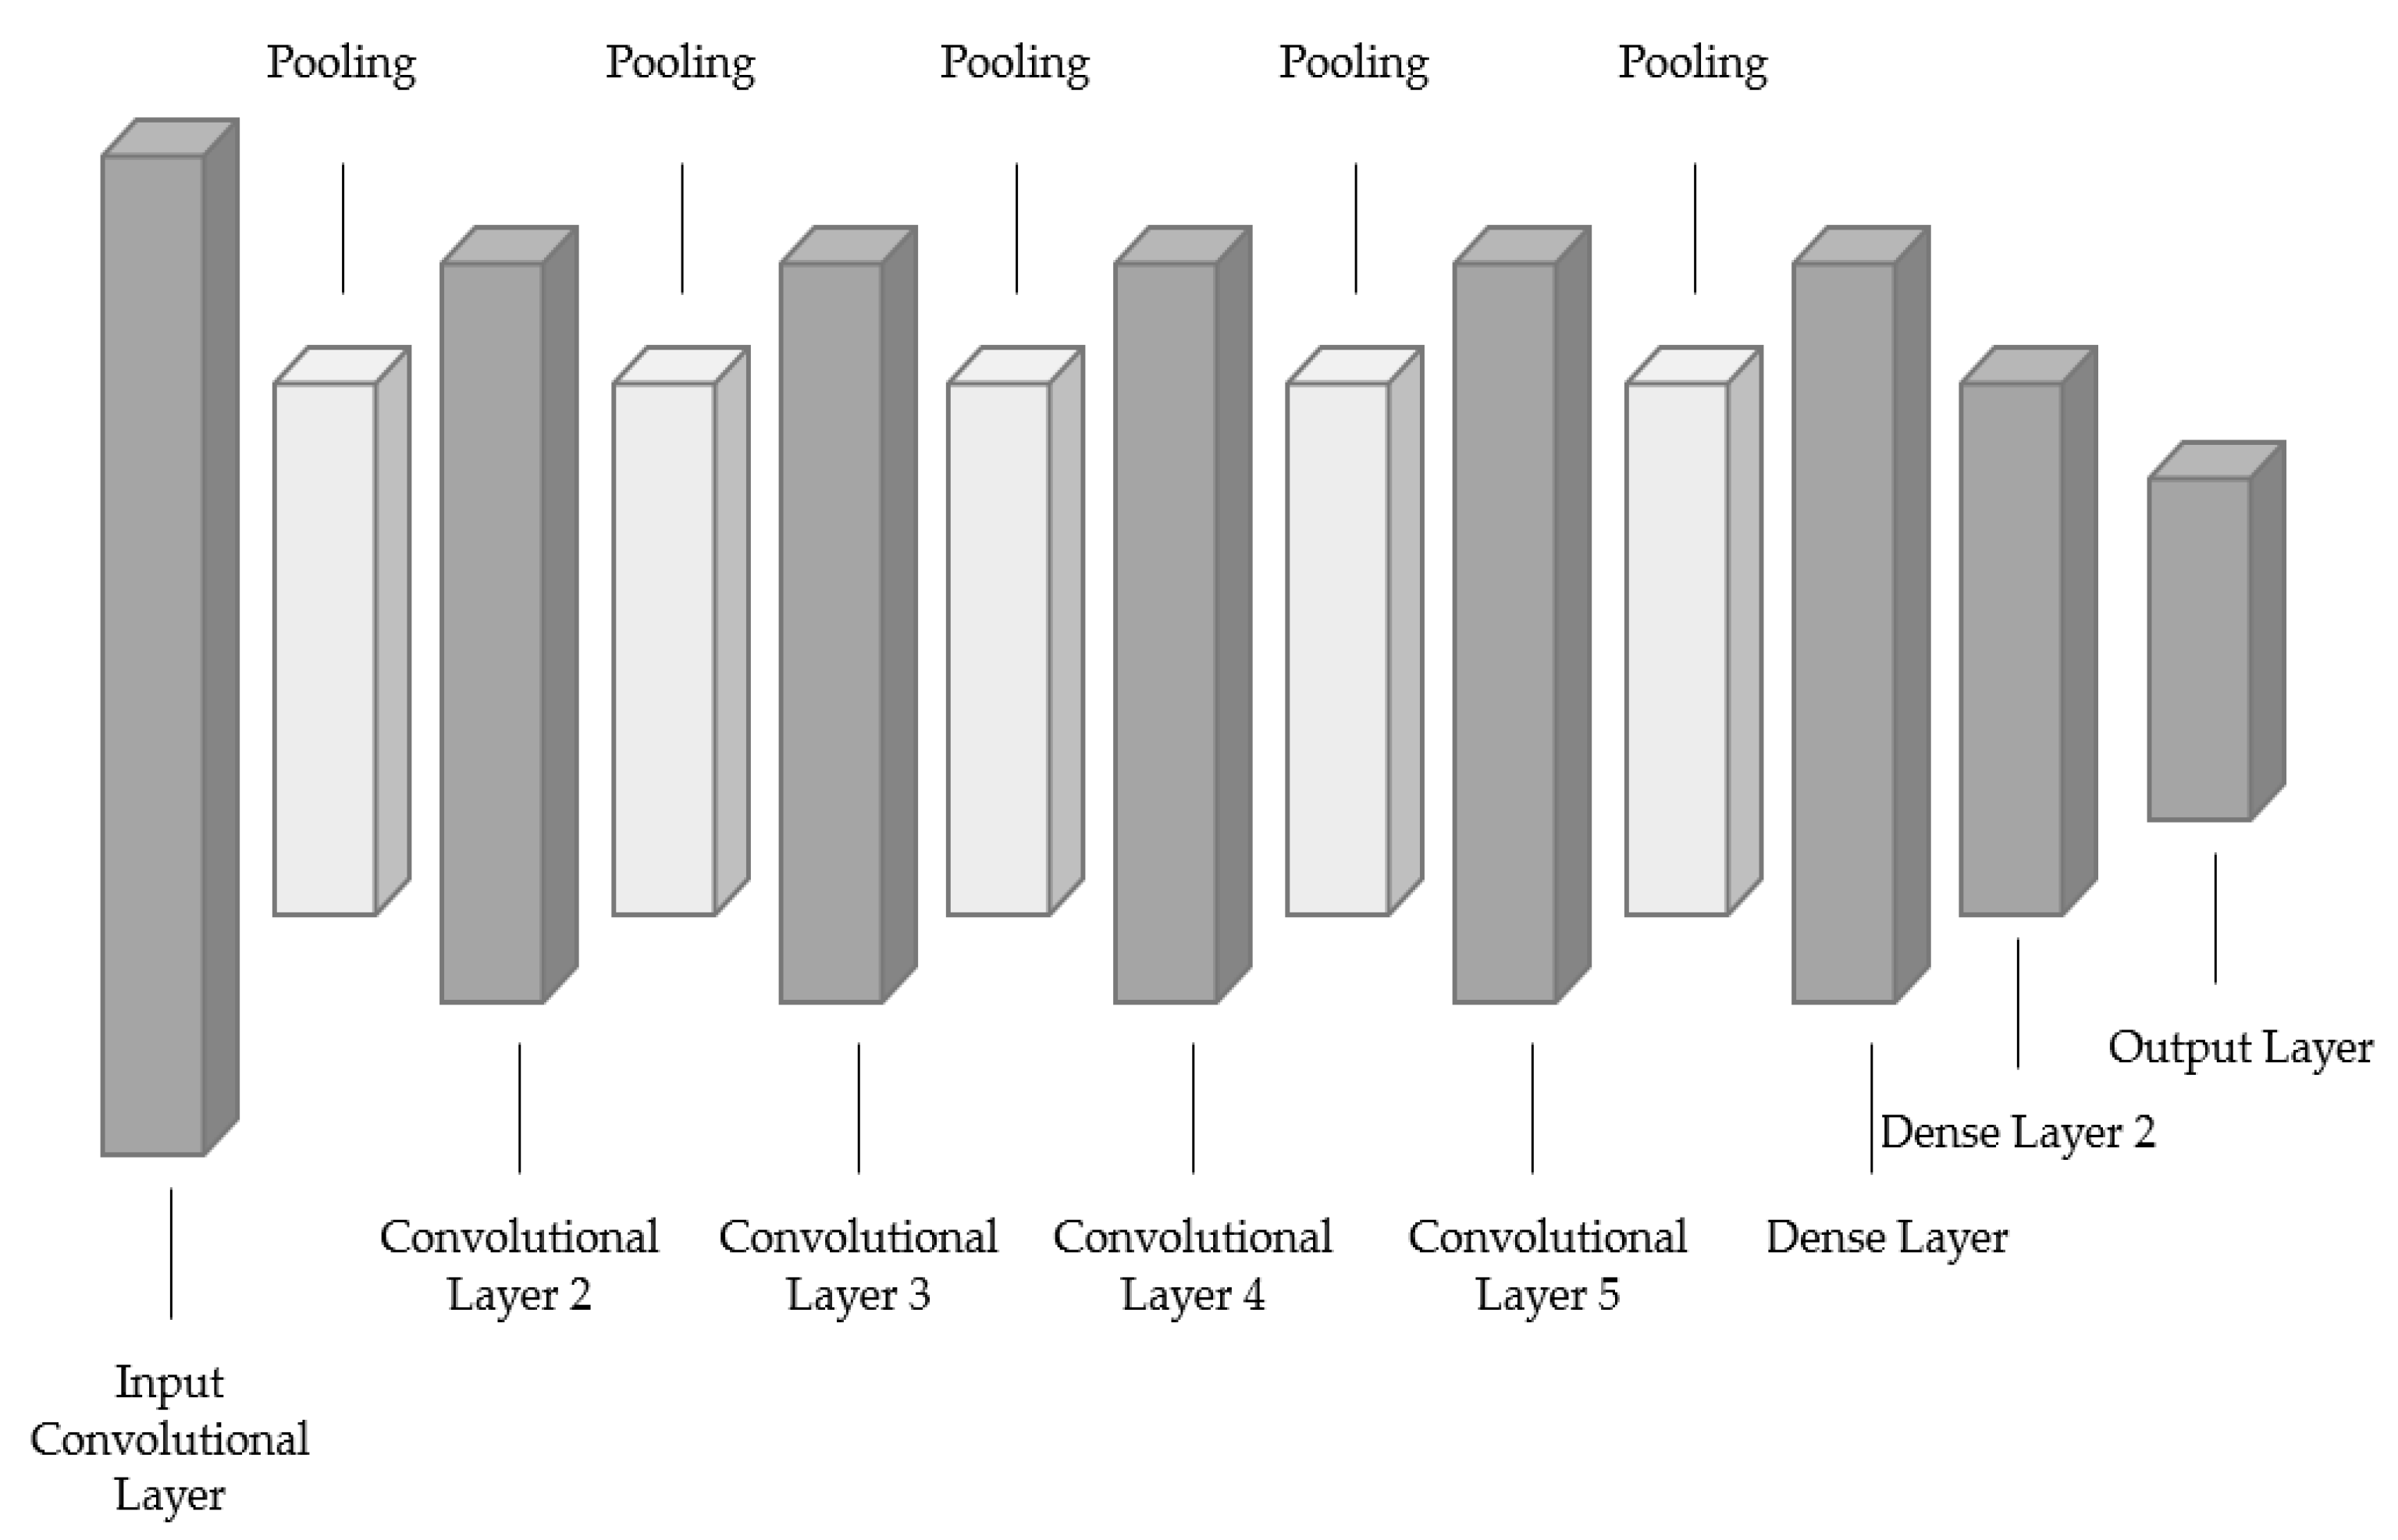
4.1. 2D-CNN
4.2. Accuracy Calculation
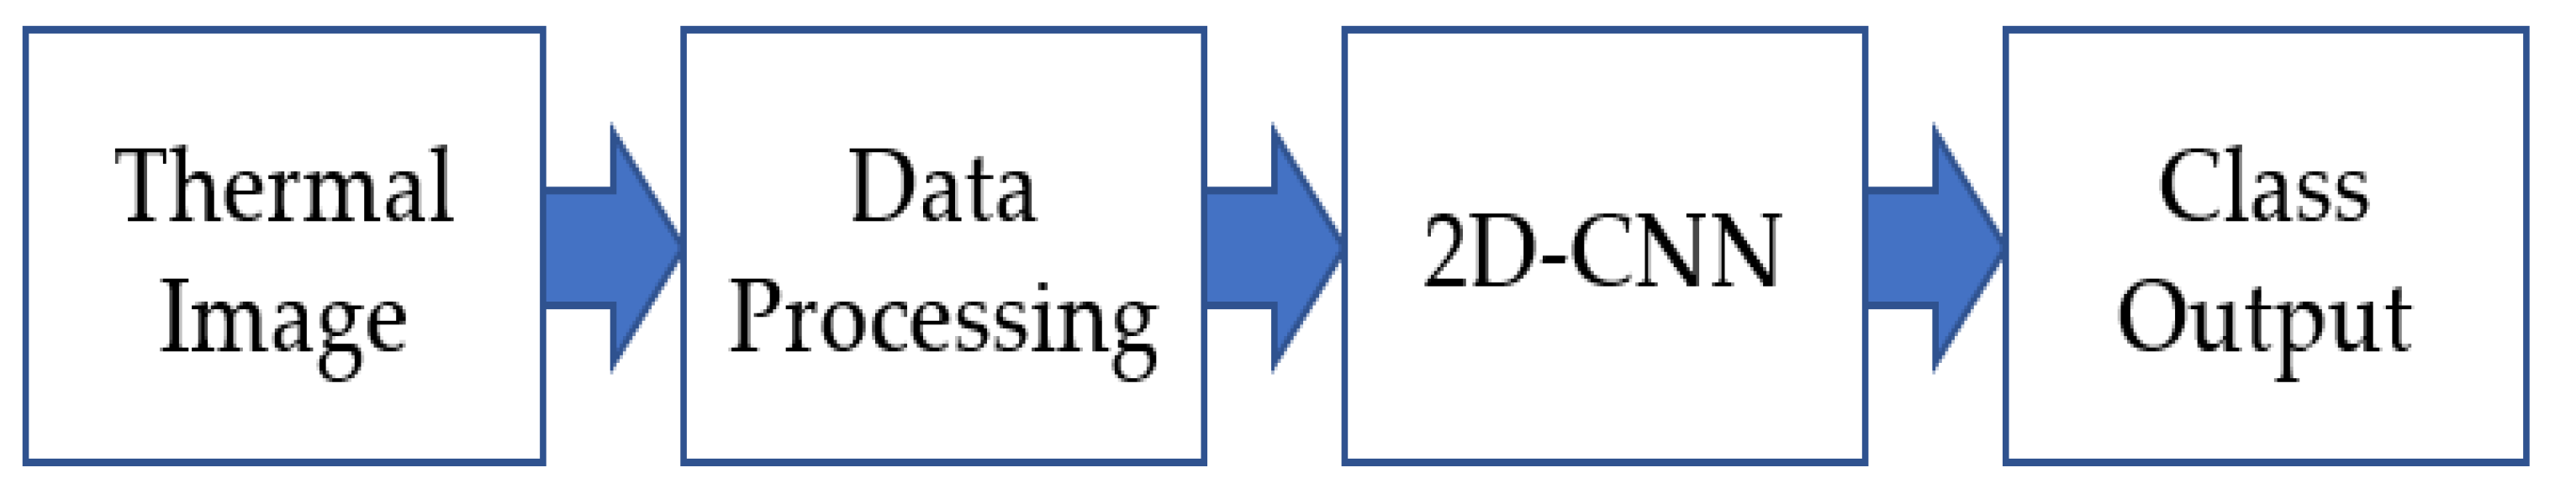
4.3. General Overview
- Acquire data.
- Categorize into folder directories.
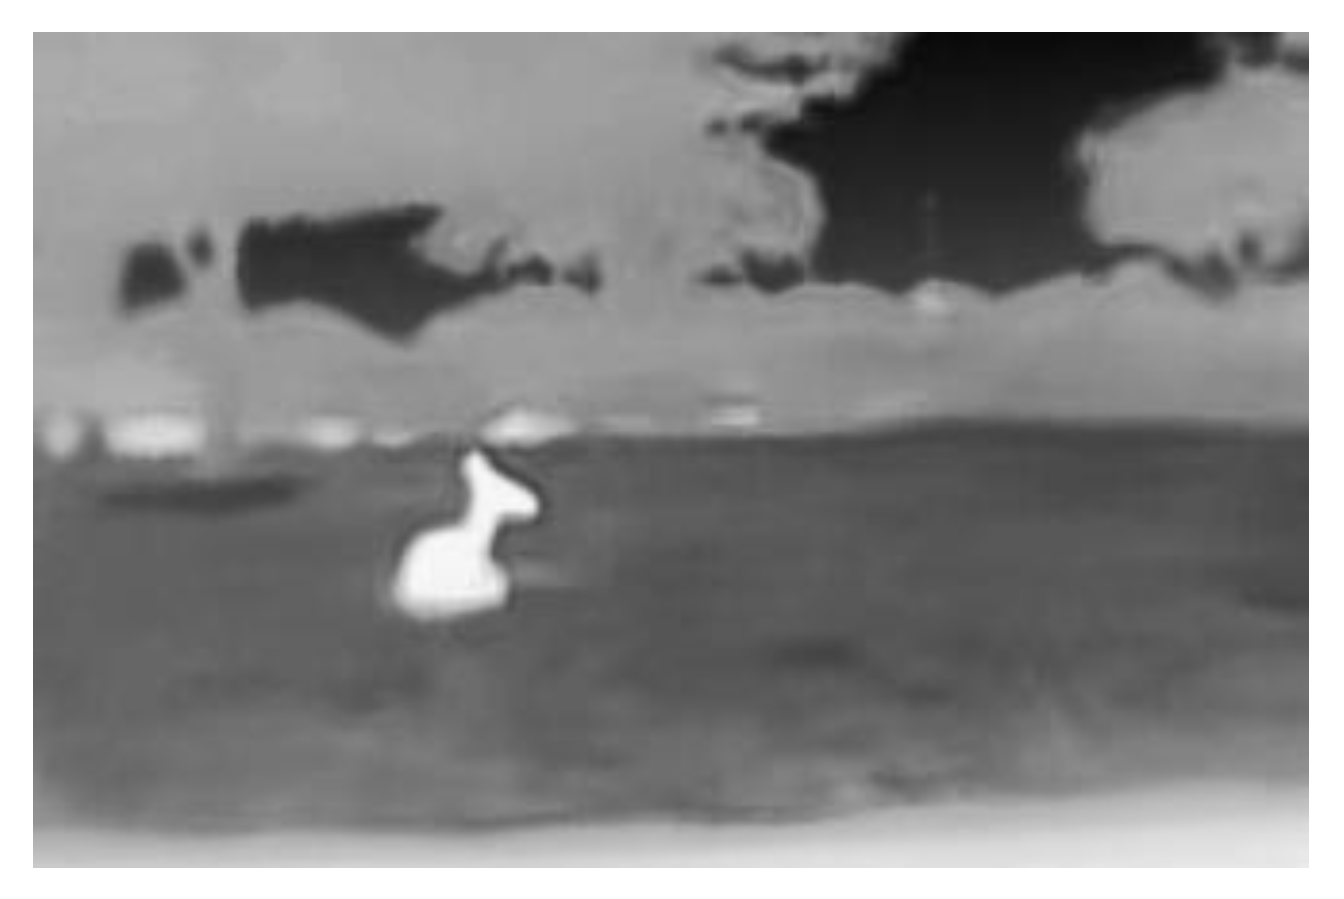
- Process images through resizing, cropping, and conversion to grayscale.
- Acquire vector values of images.
- Mirror vectors and combine mirror dataset with the original dataset.
- Divide the data into training and test datasets with an 80/20 split.
- Use 20% of the training data for validation data.
- Train the model with feature vector input to enhance performance through hyperparameters.
- Run the model with test data and determine the accuracy of the model through the accuracy formula.
5. Results and Discussion
5.1. Overall System Description
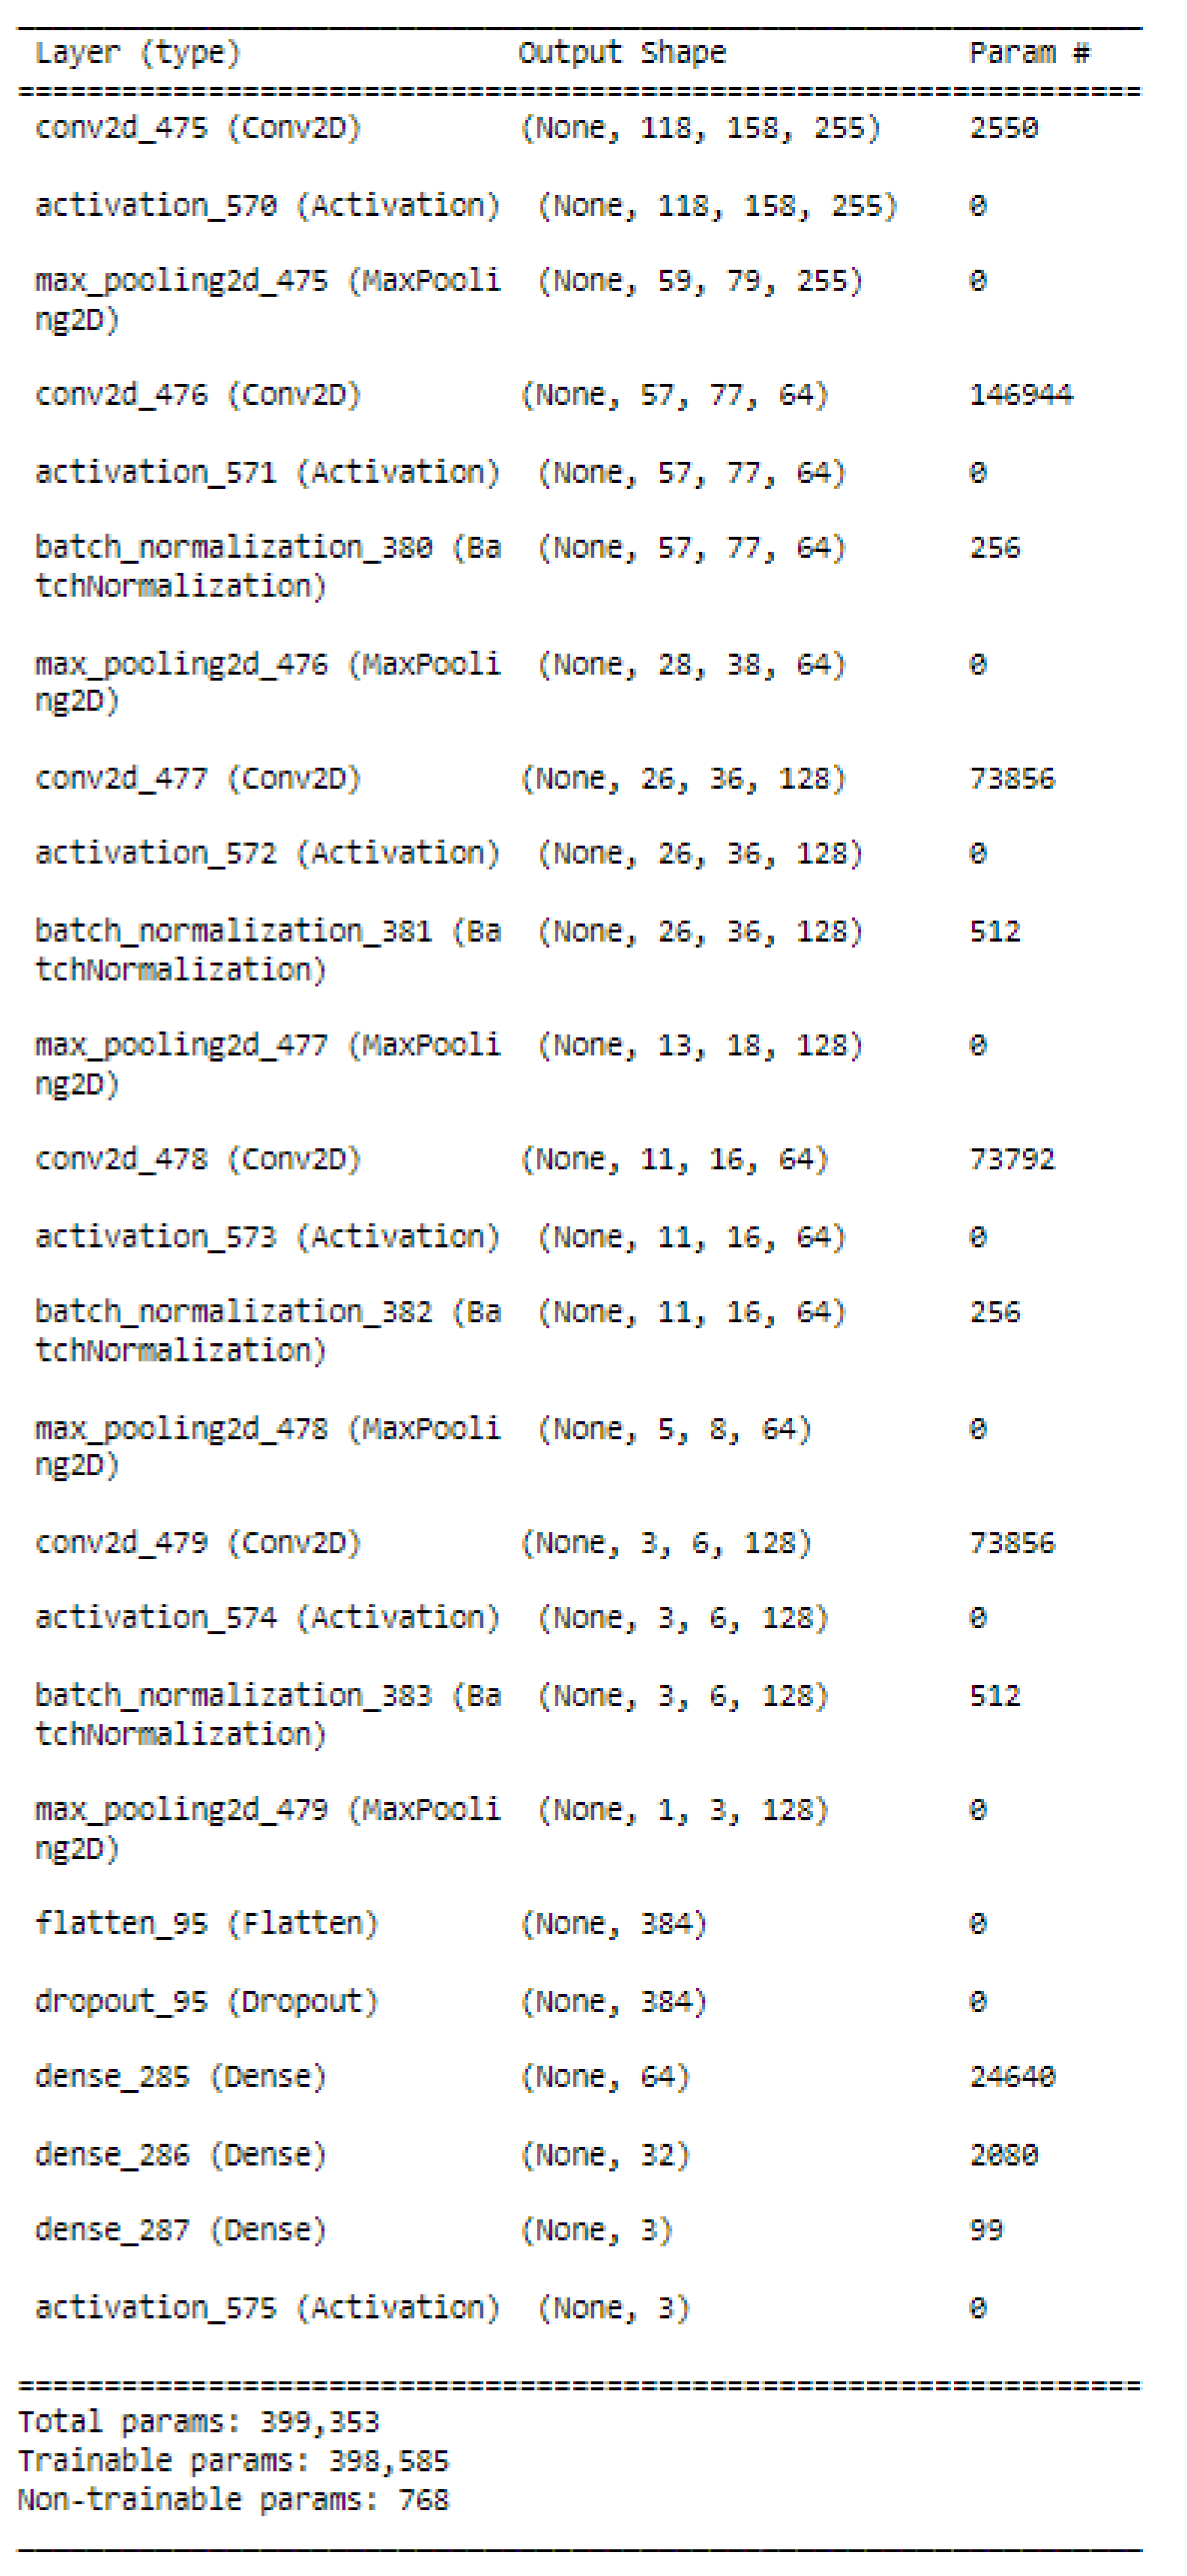
5.2. CNN Model Parameters
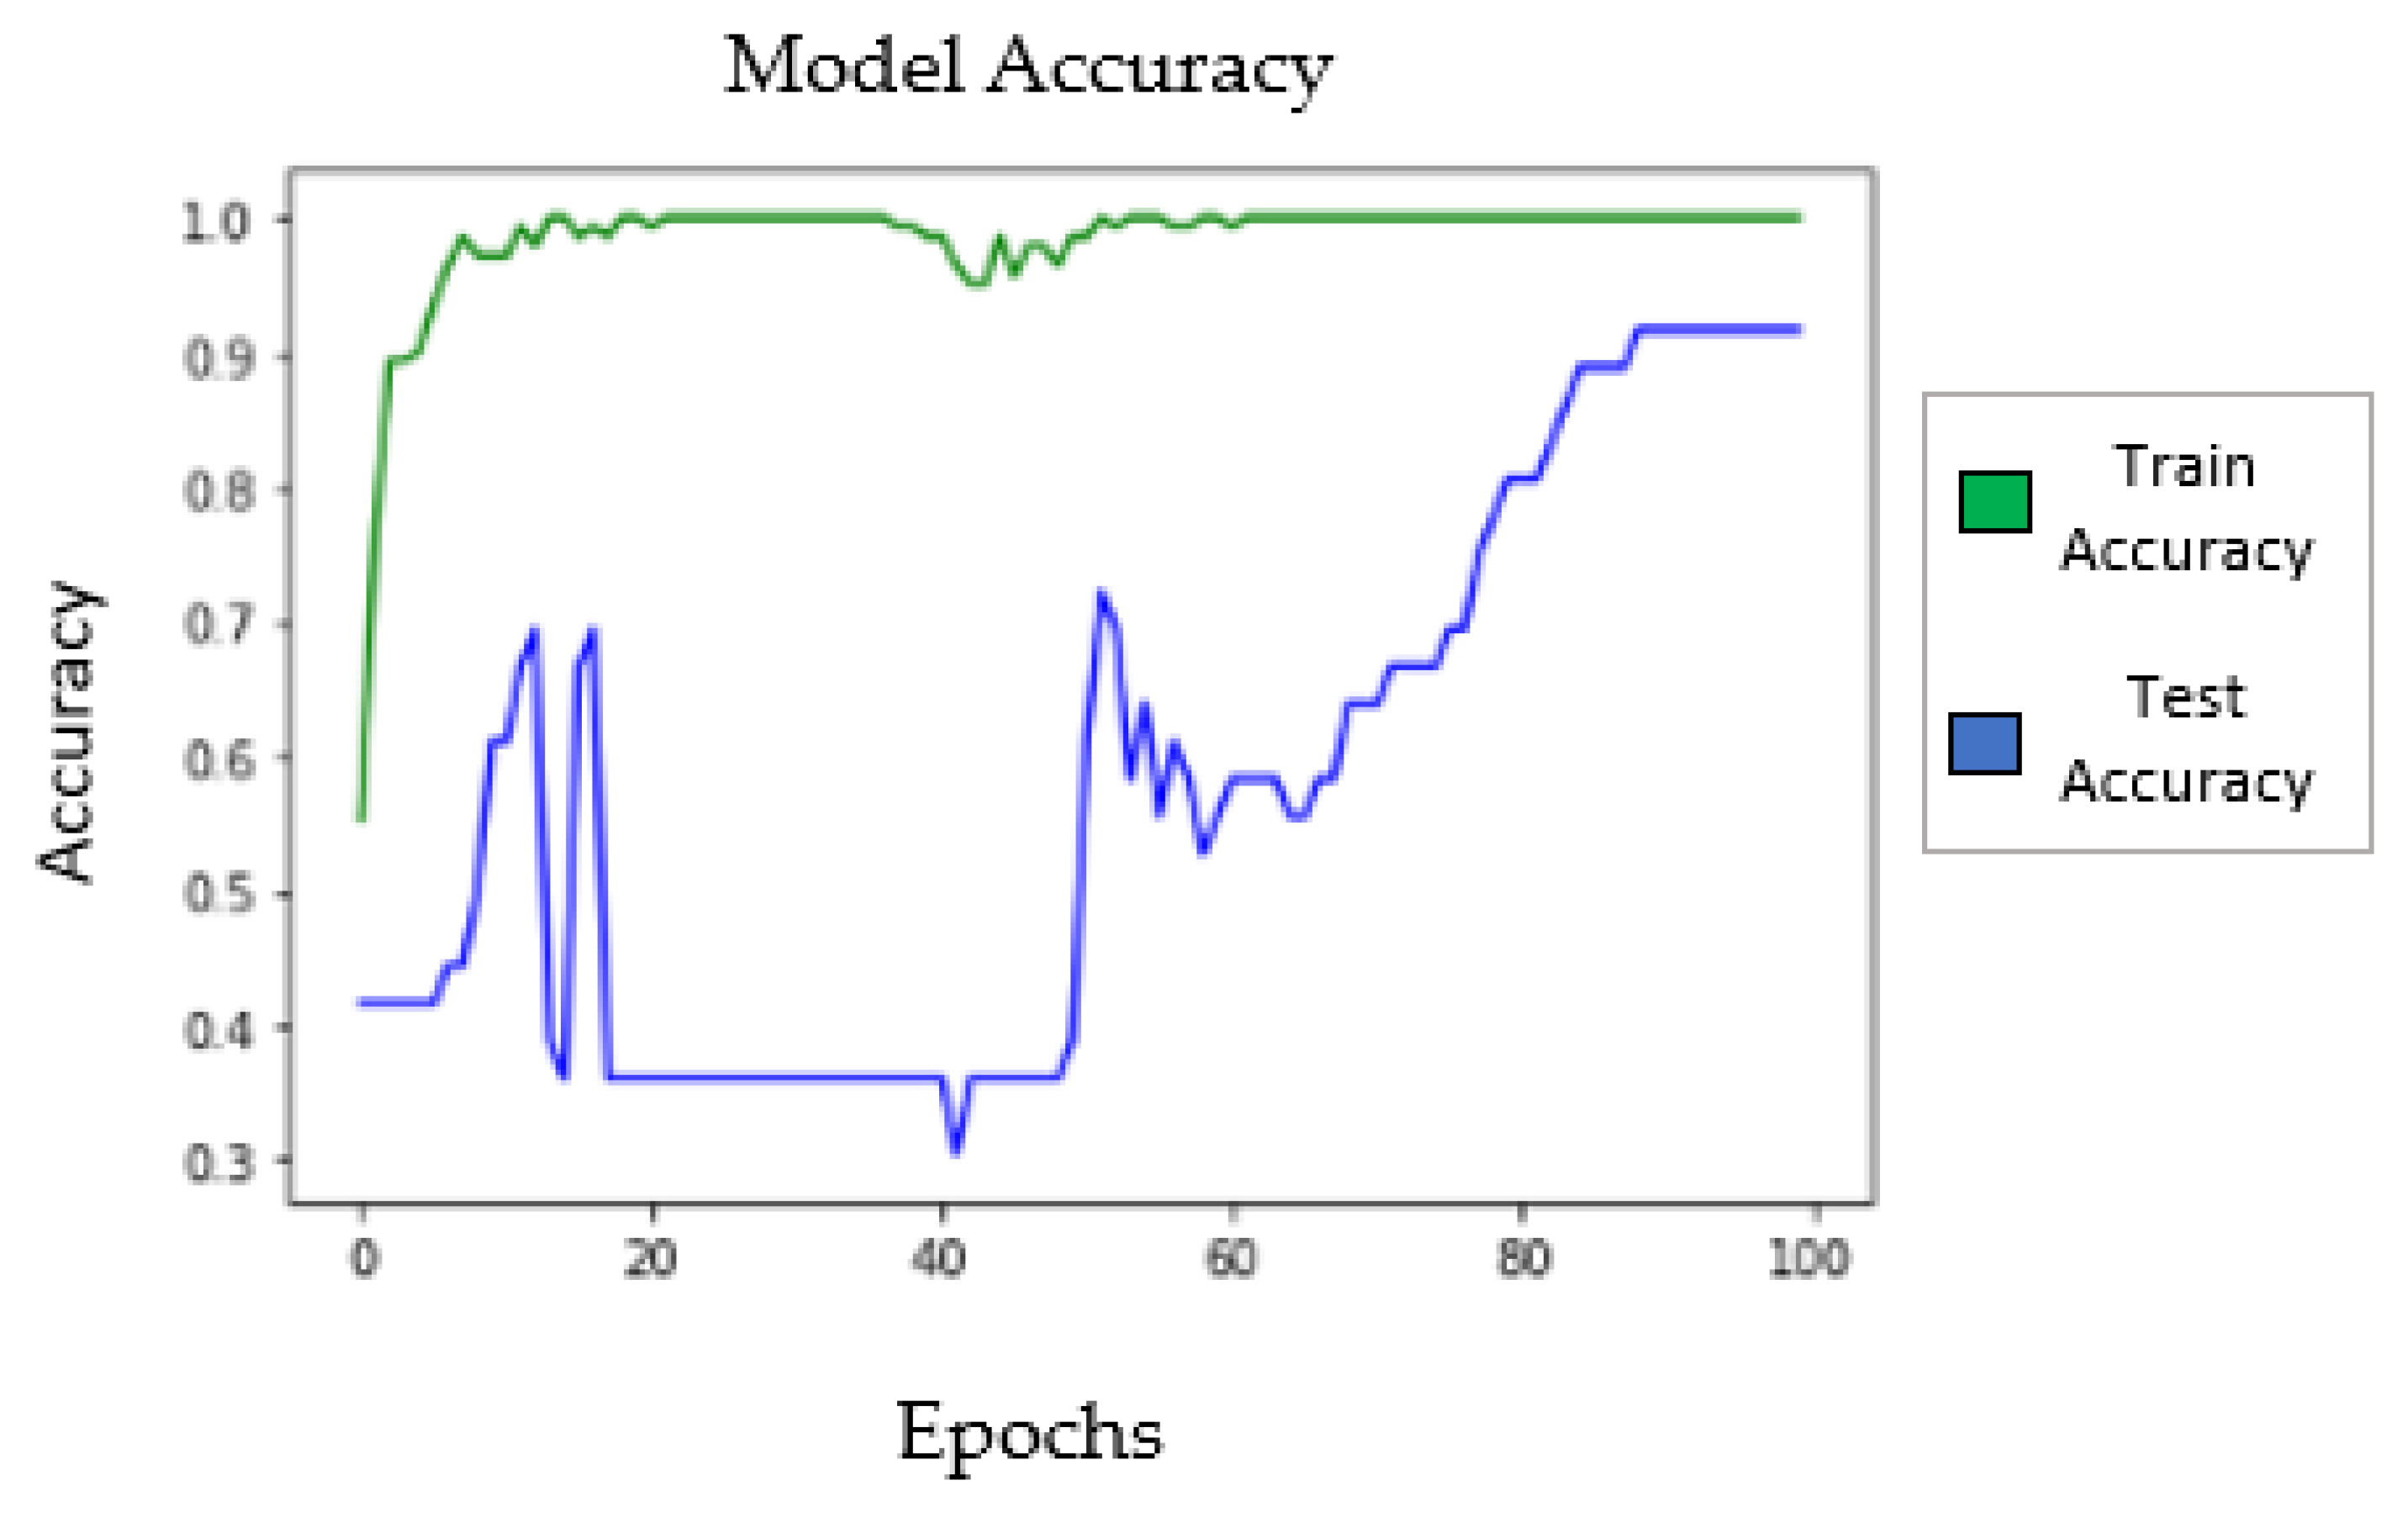
5.3. Results Analysis
5.4. Discussion
6. Conclusions
Author Contributions
Funding
Institutional Review Board Statement
Informed Consent Statement
Data Availability Statement
Conflicts of Interest
References
- Huijser, M.P.; McGowan, P.; Hardy, A.; Kociolek, A.; Clevenger, A.P.; Smith, D.; Ament, R. Wildlife-Vehicle Collision Reduction Study: Report to Congress; Federal Highway Administration: McLEan, VA, USA, 2017. [Google Scholar]
- Seamans, T.W.; David, H.A. Evaluation of an electrified mat as a white-tailed deer (Odocoileus virginianus) barrier. Int. J. Pest Manag. 2008, 54, 89–94. [Google Scholar] [CrossRef]
- Stein, L. Oh, Deer! U.S. News World Rep. 2003, 135, 19. [Google Scholar]
- Pagany, R. Wildlife-vehicle collisions-Influencing factors, data collection, and research methods. Biol. Conserv. 2020, 251, 108758. [Google Scholar] [CrossRef]
- Barnes, R.B. Thermography, thermography & its clinical applications. Ann. N. Y. Acad. Sci. 1964, 121, 34–48. [Google Scholar] [PubMed]
- McCafferty, D.J. The value of infrared thermography for research on mammals: Previous applications and future directions. Mammal. Rev. 2007, 37, 207–223. [Google Scholar] [CrossRef]
- Lloyd, J.M. Thermal Imaging Systems; Springer Science & Business Media: Berlin, Germany, 2013. [Google Scholar]
- Cilulko, J.; Janiszewski, P.; Bogdaszewski, M.; Szczygielska, E. Infrared thermal imaging in studies of wild animals. Eur. J. Wildl. Res. 2013, 59, 17–23. [Google Scholar] [CrossRef]
- Hollnagel, E.; Källhammer, J.E. Effects of a night vision enhancement system (NFS) on driving: Results from a simulator study. In Proceedings of the Driving Assessment Conference, Park City, UT, USA, 21–24 July 2003; Volume 2. [Google Scholar]
- Albani, S.; Mohammed, T.A.; Al-Zawi, S. Understanding of a convolutional neural network. In Proceedings of the 2017 International Conference on Engineering and Technology (ICET), Antalya, Turkey, 21–23 August 2017; pp. 1–6. [Google Scholar] [CrossRef]
- Xin, M.; Wang, Y. Research on image classification model based on deep convolution neural network. J. Image Video Proc. 2019, 2019, 40. [Google Scholar] [CrossRef]
- Sharma, S.U.; Shah, D.J. A practical animal detection and collision avoidance system using computer vision technique. IEEE Access 2016, 5, 347–358. [Google Scholar] [CrossRef]
- Bhatia, Y.; Rai, R.; Gupta, V.; Aggarwal, N.; Akula, A. Convolutional neural networks-based potholes detection using thermal imaging. J. King Saud Univ. Comput. Inf. Sci. 2019, 34, 578–588. [Google Scholar]
- Munian., Y.; Martinez-Molina., A.; Alamaniotis., A. Intelligent system for detecting wild animals using HOG and CNN in automobile applications. In Proceedings of the 2020 11th International Conference on Information, Intelligence, Systems, and Applications (IISA), Piraeus, Greece, 15–17 July 2020. [Google Scholar]
- Wagner, R.; Thom, M.; Gabb, M.; Limmer, M.; Schweiger, R.; Rothermel, A. Convolutional neural networks for nighttime animal orientation estimation. In Proceedings of the 2013 IEEE Intelligent Vehicles Symposium (iv), Gold Coast, QLD, Australia, 23–26 June 2013; pp. 316–321. [Google Scholar]
- DeVault, T.L.; Seamans, T.W.; Blackwell, B.F. Frontal vehicle illumination via rear-facing lighting reduces potential for collisions with white-tailed deer. Ecosphere 2020, 11, e03187. [Google Scholar] [CrossRef]
- Hernández-García, A.; König, P. Further advantages of data augmentation on convolutional neural networks. In International Conference on Artificial Neural Networks; Springer: Berlin/Heidelberg, Germany, 2018; pp. 95–103. [Google Scholar]
- Gomez, A.; Diez, G.; Salazar, A.; Diaz, A. Animal Identification in Low-Quality Camera-Trap Images Using Very Deep Convolutional Neural Networks and Confidence Thresholds. In Proceedings of the Advances in Visual Computing: 12th International Symposium, ISVC 2016, Las Vegas, NV, USA, 12–14 December 2016; Springer International Publishing: New York, NY, USA, 2016; pp. 747–756. [Google Scholar]
- Krizhevsky, A.; Sutskever, I.; Hinton, G.E. ImageNet Classification with Deep Convolutional Neural Networks. Commun. ACM 2017, 60, 84–90. [Google Scholar] [CrossRef]
- Zilkha, M.; Spanier, A. Real-time CNN-based object detection and classification for outdoor surveillance images: Daytime and thermal. In Proceedings of the Artificial Intelligence and Machine Learning in Defense Applications, Strasbourg, France, 19 September 2019; Volume 11169, p. 1116902. [Google Scholar]
- Kim, D.; Kwon, D.S. Pedestrian detection and tracking in thermal images using shape features. In Proceedings of the 12th International Conference on Ubiquitous Robots and Ambient Intelligence (URAI), Goyangi, Korea, 28–30 October 2015; pp. 22–25. [Google Scholar]
- Akhtar, N.; Ragavendran, U. Interpretation of intelligence in CNN-pooling processes: A methodological survey. Neural Comput. Appl. 2020, 32, 879–898. [Google Scholar] [CrossRef]
- Munian, Y.; Martinez-Molina, A.; Alamaniotis, M. Design and implementation of a nocturnal animal detection intelligent system in Automobile Applications. In International Conference on Transportation and Development 2021—Transportation Operations Technologies and Safety; American Society of Civil Engineers (ASCE): Reston, VA, USA, 2021; pp. 438–449. [Google Scholar] [CrossRef]
- Santurkar, S.; Tsipras, D.; Ilyas, A.; Madry, A. How does batch normalization help optimization? In Proceedings of the Advances in Neural Information Processing Systems, Montreal, Canada, 2-8 December 2018.
- Bjorck, N.; Gomes, C.P.; Selman, B.; Weinberger, K.Q. Understanding batch normalization. In Proceedings of the Advances in Neural Information Processing Systems, Montreal, QC, Canada, 2–8 December 2018. [Google Scholar]
- Srivastava, N. Improving Neural Networks with Dropout. Master’s Thesis, The University of Toronto, Toronto, ON, Canada, 2013. [Google Scholar]
- Ramachandran, P.; Zoph, B.; Le, Q.V. Searching for Activation Functions. arXiv 2017, arXiv:1710.05941. Available online: http://arxiv.org/abs/1710.05941 (accessed on 2 July 2022).
- LeCun, Y.; Bengio, Y.; Hinton, G. Deep learning. Nature 2015, 521, 436–444. [Google Scholar] [CrossRef]
- Nwankpa, C.; Ijomah, W.; Gachagan, A.; Marshall, S. Activation functions: Comparison of trends in practice and research for deep learning. arXiv 2018, arXiv:1811.03378. [Google Scholar]
- Koidl, K. Loss Functions in Classification Tasks; School of Computer Science and Statistic Trinity College: Dublin, Ireland, 2013. [Google Scholar]
- Haghighi, S.; Jasemi, M.; Hessabi, S.; Zolanvari, A. PCM: Multiclass confusion matrix library in Python. J. Open-Source Softw. 2018, 3, 729. [Google Scholar] [CrossRef]
- Munian, Y.; Martinez-Molina, A.; Miserlis, D.; Hernandez, H.; Alamaniotis, M. Intelligent System Utilizing HOG and CNN for Thermal Image-Based Detection of Wild Animals in Nocturnal Periods for Vehicle Safety. Appl. Artif. Intell. 2022, 36, 2031825. [Google Scholar] [CrossRef]
- Munian, Y.; Martinez-Molina, A.; Alamaniotis, M. Active Advanced Arousal System to Alert and Avoid the Crepuscular Animal Based Vehicle Collision. Intell. Decis. Technol. 2021, 15, 707–720. [Google Scholar] [CrossRef]
- Python 3.9.7. 2021. Available online: https://www.python.org/downloads/release/python-397/ (accessed on 25 June 2022).


| Description | No. of Images |
|---|---|
| Total Images | 1000 |
| No. of images after error removal | 800 |
| No. of images after filtering | 182 |
| Images with animals lying down | 37 |
| Images with wildlife facing toward automobile | 45 |
| Images with wildlife facing away from automobile | 100 |
| No. of images after balancing | 111 |
| Total numbers of inputs to network after augmentation | 222 |
| Trial No. | Confusion Matrix | TP 1 | TP 2 | TP3 | Accuracy |
|---|---|---|---|---|---|
| 1 | [[15 3 1] [ 0 15 0] [ 1 0 10]] | 15 | 15 | 10 | 89% |
| 2 | [[15 4 0] [ 0 15 0] [ 1 1 9]] | 15 | 15 | 9 | 87% |
| 3 | [[19 0 0] [ 6 9 0] [ 5 1 5]] | 19 | 9 | 5 | 73% |
| 4 | [[18 1 0] [ 0 15 0] [ 0 4 7]] | 18 | 15 | 4 | 89% |
| 5 | [[16 3 0] [ 0 15 0] [ 2 1 8]] | 16 | 15 | 8 | 87% |
| 6 | [[13 6 0] [ 0 15 0] [ 0 4 7]] | 13 | 15 | 6 | 78% |
| 7 | [[14 5 0] [ 0 15 0] [ 1 2 8]] | 14 | 15 | 8 | 82% |
| 8 | [[13 6 0] [ 0 15 0] [ 1 2 8]] | 13 | 15 | 8 | 80% |
| 9 | [[14 5 0] [ 0 15 0] [ 0 4 7]] | 14 | 15 | 7 | 80% |
| 10 | [[14 5 0] [ 0 15 0] [ 1 3 7]] | 14 | 15 | 3 | 80% |
| 11 | [[14 5 0] [ 0 15 0] [ 0 2 9]] | 14 | 15 | 9 | 84% |
| 12 | [[15 4 0] [ 0 15 0] [ 1 1 9]] | 15 | 15 | 9 | 87% |
| 13 | [[15 4 0] [ 0 15 0] [ 0 2 9]] | 15 | 4 | 15 | 87% |
| 14 | [[13 6 0] [ 1 14 0] [ 1 3 7]] | 13 | 14 | 7 | 76% |
| 15 | [[15 4 0] [ 0 15 0] [ 1 3 7]] | 15 | 15 | 7 | 82% |
| 16 | [[15 0 4] [ 0 4 11] [ 1 0 10]] | 15 | 4 | 10 | 64% |
| 17 | [[15 4 0] [ 0 15 0] [ 1 2 8]] | 15 | 15 | 8 | 84% |
| 18 | [[14 5 0] [ 0 15 0] [ 0 1 10]] | 15 | 15 | 10 | 87% |
| 19 | [[15 4 0] [ 0 15 0] [ 0 2 9]] | 15 | 15 | 9 | 87% |
| 20 | [[15 3 1] [ 0 15 0] [ 2 3 6]] | 15 | 15 | 6 | 80% |
| 21 | [[11 8 0] [ 0 15 0] [ 1 6 4]] | 11 | 15 | 8 | 67% |
| 22 | [[14 4 1] [ 0 14 1] [ 0 3 8]] | 14 | 14 | 8 | 80% |
| 23 | [[15 3 1] [ 0 15 0] [ 2 1 8]] | 15 | 15 | 8 | 84% |
| 24 | [[14 5 0] [ 4 11 0] [ 2 1 8]] | 14 | 11 | 8 | 73% |
| 25 | [[14 5 0] [ 0 15 0] [ 0 4 7]] | 14 | 15 | 7 | 80% |
| 26 | [[11 8 0] [ 0 15 0] [ 1 3 7]] | 11 | 15 | 7 | 73% |
| 27 | [[15 4 0] [ 0 15 0] [ 1 3 7]] | 15 | 15 | 7 | 82% |
| 28 | [[15 4 0] [ 0 15 0] [ 0 2 9]] | 15 | 15 | 9 | 87% |
| 29 | [[15 4 0] [ 0 15 0] [ 0 1 10]] | 15 | 15 | 10 | 89% |
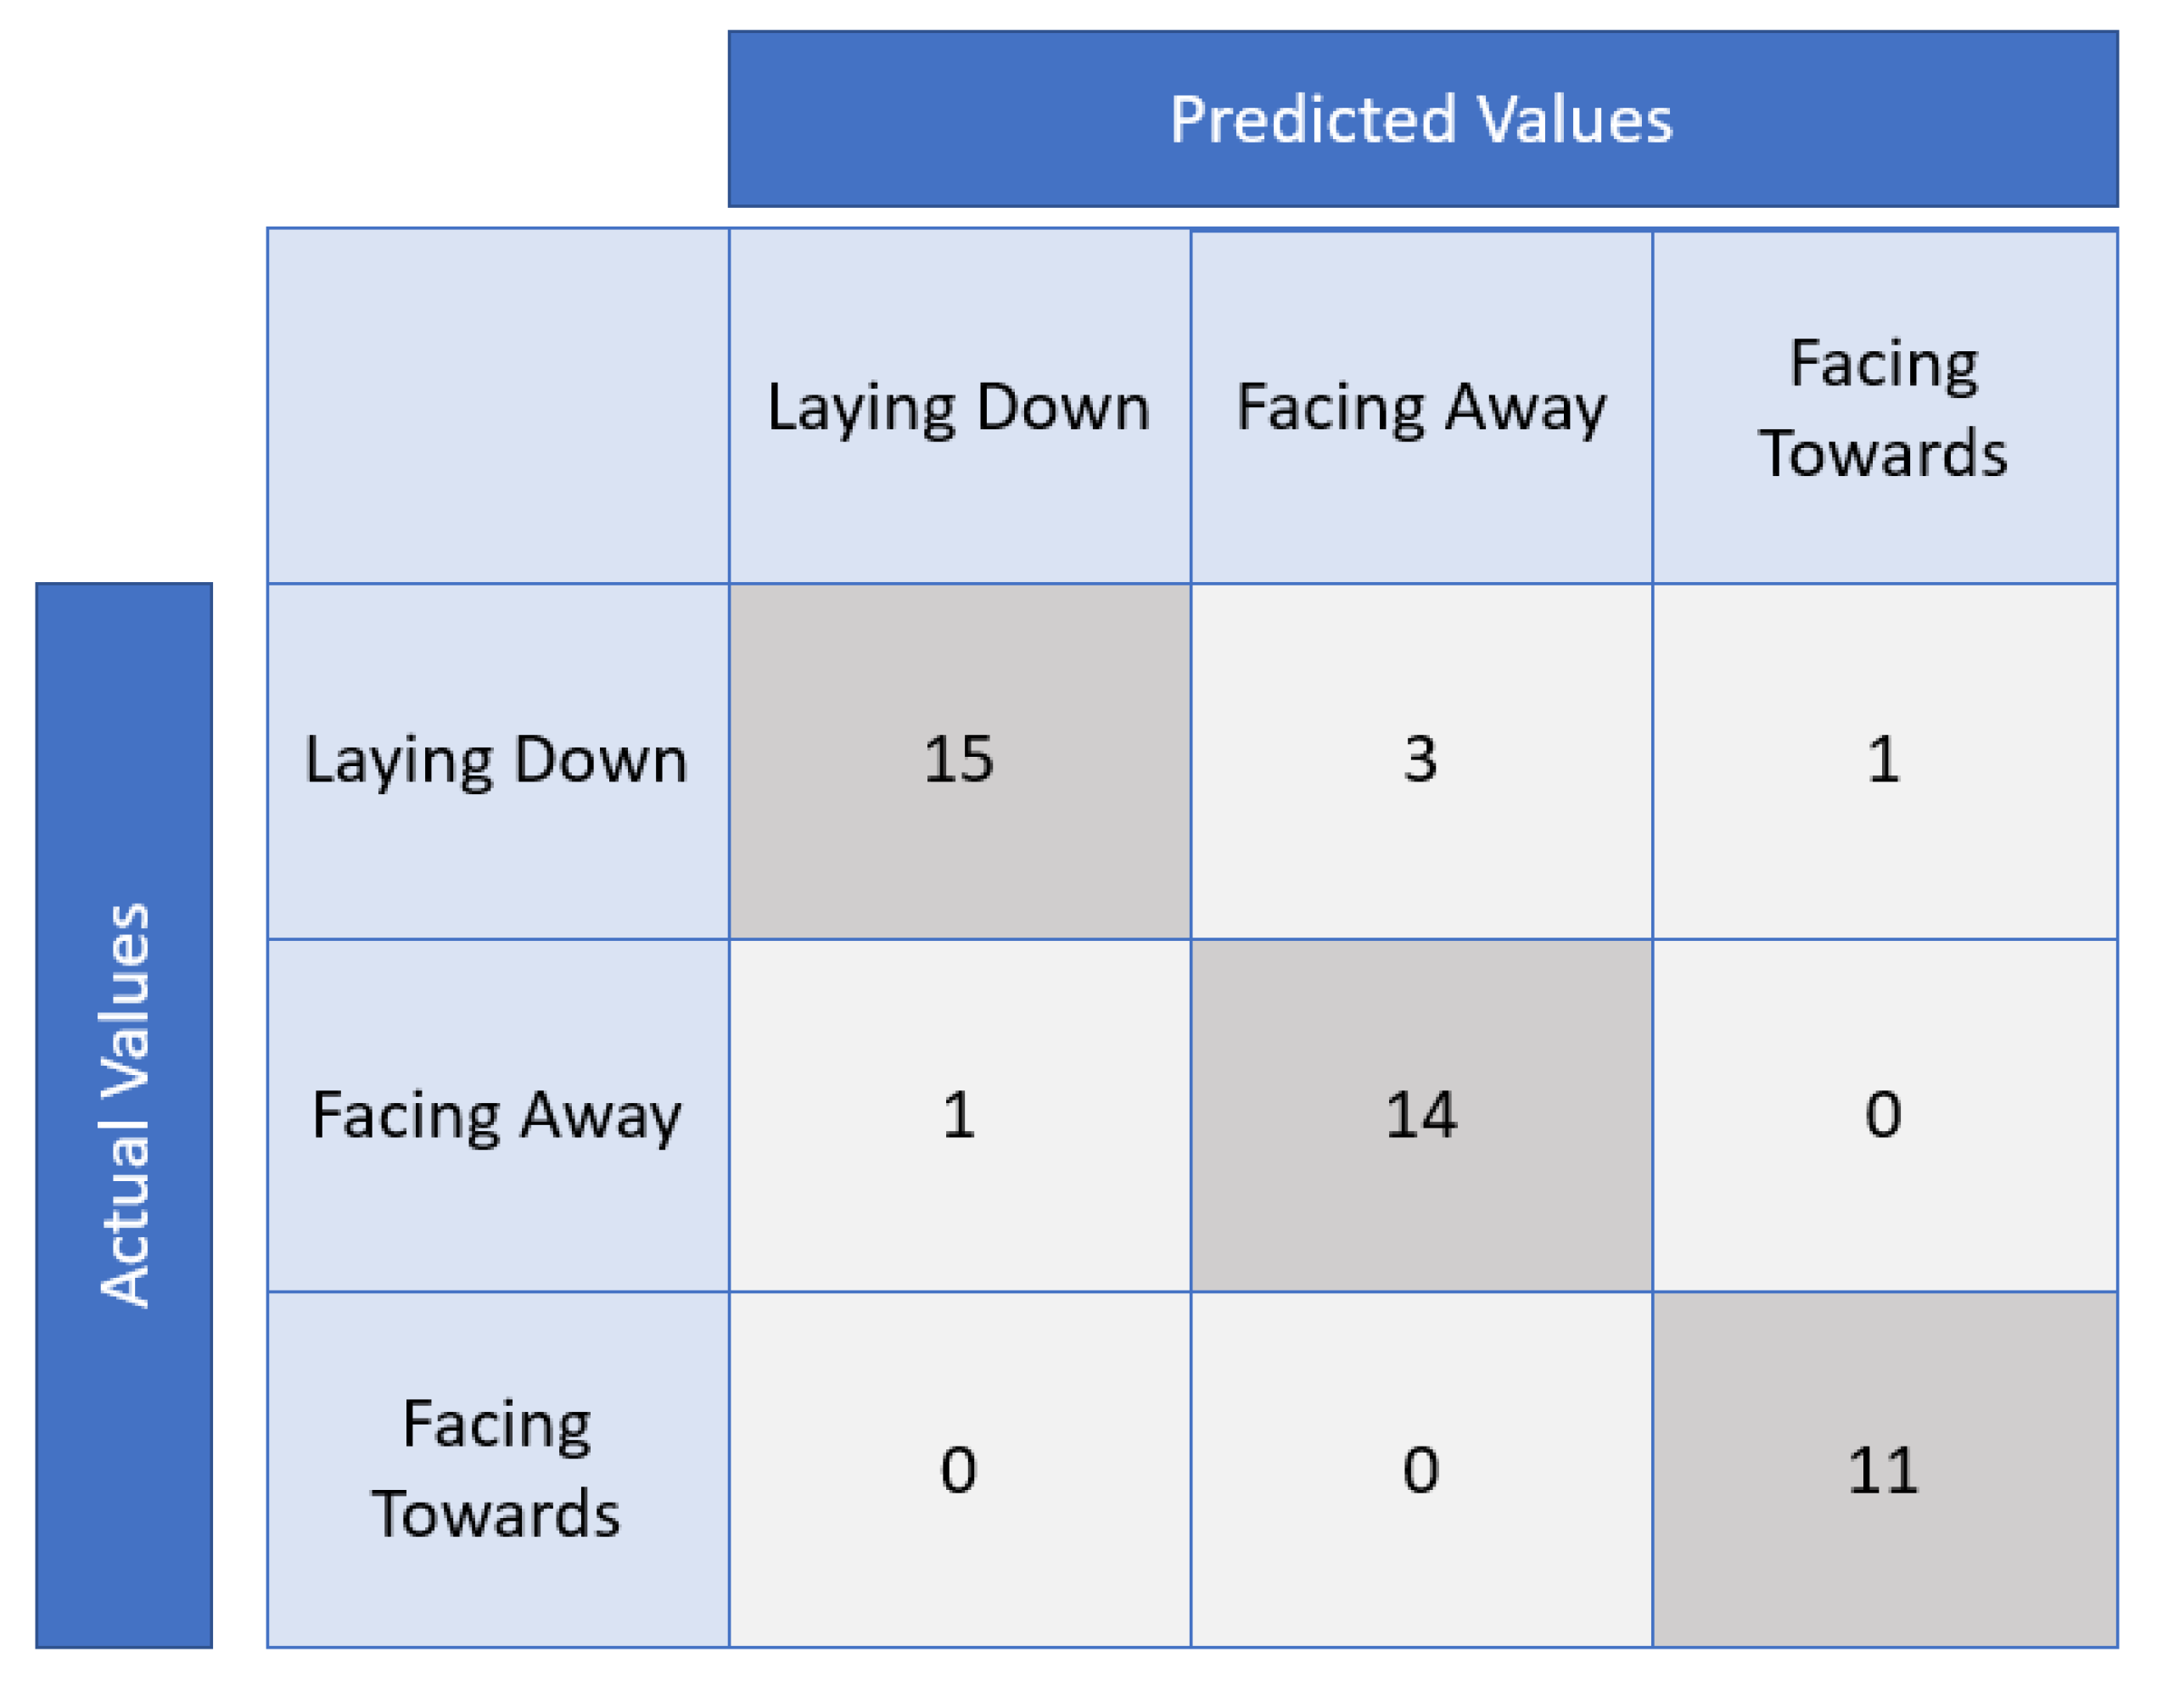
| 30 | [[15 3 1] [ 1 14 0] [ 0 0 11]] | 15 | 14 | 11 | 89% |
| Average | 82% |
| Maximum | 89% |
| Minimum | 64% |
Publisher’s Note: MDPI stays neutral with regard to jurisdictional claims in published maps and institutional affiliations. |
© 2022 by the authors. Licensee MDPI, Basel, Switzerland. This article is an open access article distributed under the terms and conditions of the Creative Commons Attribution (CC BY) license (https://creativecommons.org/licenses/by/4.0/).
Share and Cite
Mowen, D.; Munian, Y.; Alamaniotis, M. Improving Road Safety during Nocturnal Hours by Characterizing Animal Poses Utilizing CNN-Based Analysis of Thermal Images. Sustainability 2022, 14, 12133. https://doi.org/10.3390/su141912133
Mowen D, Munian Y, Alamaniotis M. Improving Road Safety during Nocturnal Hours by Characterizing Animal Poses Utilizing CNN-Based Analysis of Thermal Images. Sustainability. 2022; 14(19):12133. https://doi.org/10.3390/su141912133
Chicago/Turabian StyleMowen, Derian, Yuvaraj Munian, and Miltiadis Alamaniotis. 2022. "Improving Road Safety during Nocturnal Hours by Characterizing Animal Poses Utilizing CNN-Based Analysis of Thermal Images" Sustainability 14, no. 19: 12133. https://doi.org/10.3390/su141912133