

Evaluation of the Incorporation of Tire-Derived Aggregates (TDA) in Rigid Pavement Mix Designs

Abstract
:1. Introduction
2. Objectives
3. Experimental Program
3.1. Materials
3.2. Laboratory Tests
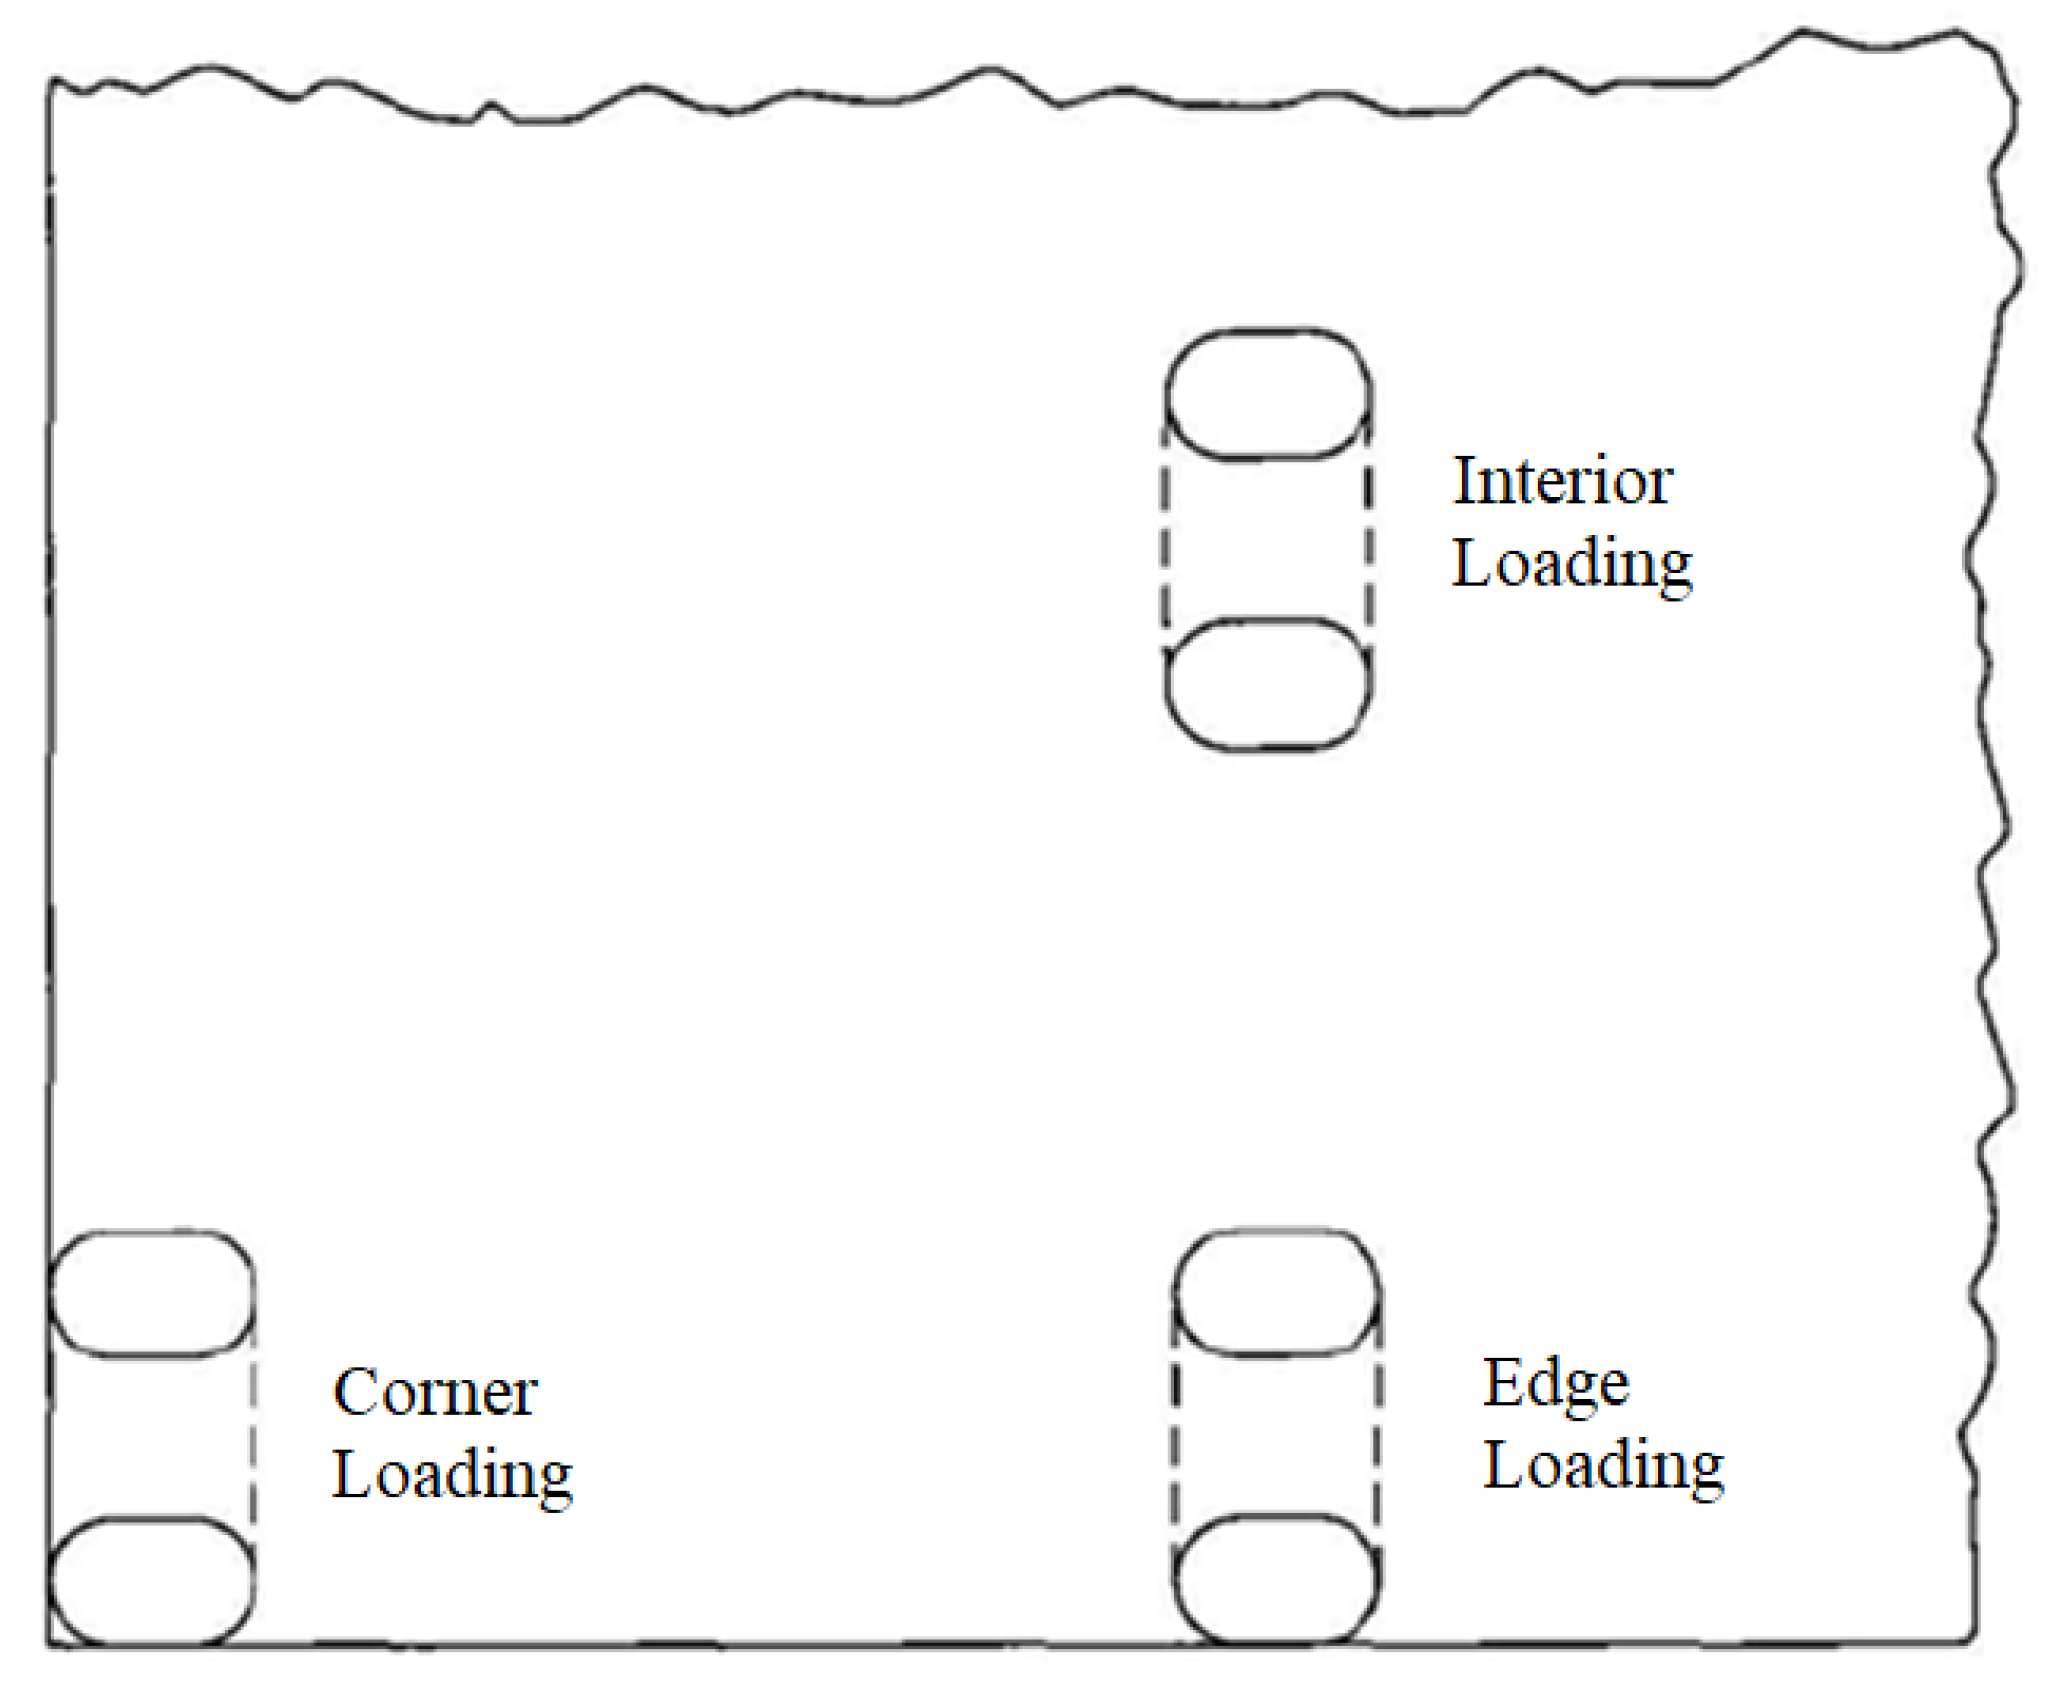
3.3. KENPAVE Software

3.4. Environmental Impacts and Cost Analyses
- Energy consumption;
- Water consumption;
- Carbon dioxide (CO2) and global warming potential (GWP);
- Nitrogen oxides (NOx);
- Particulate matter (PM10);
- Sulfur dioxide (SO2);
- Carbon monoxide (CO);
- Mercury (Hg);
- Lead (Pb);
- Resource Conservation and Recovery Act (RCRA) hazardous waste generated;
- Human toxicity potential (cancer), an index that reflects the potential harm of a unit of chemical released into the environment;
- Human toxicity potential (noncancer), accounting for adverse health effects on human beings caused by the intake of toxic substances.
4. Results and Analysis
4.1. Strength and Stiffness Properties
4.2. KENPAVE Software
4.3. Environmental Impacts and Cost Analyses
5. Conclusions
- The strength and stiffness of the concrete decreased as the TDA content increased.
- Increasing the concrete slab thickness reduced the stresses generated by various loading conditions. Increasing the TDA content similarly resulted in reduced stresses in the concrete slab.
- Concrete slabs containing TDA exhibited greater flexibility and ductility than mixes without TDA. The ductility increased as the TDA content of the concrete increased, resulting in greater deflection in comparison to slabs without TDA.
- PCC mixes with no TDA showed better cracking resistance in flexure than PCC mixes with TDA. For example, a PCC mix with no TDA exhibited a cracking resistance similar to that of a slab 10 mm thicker with 20% TDA.
- An environmental impact analysis showed that incorporating TDA in PCC mixes reduced energy consumption and harmful emissions during material processing, transportation, and construction.
- Cost analyses indicated increased material cost savings in PCC mixes with greater TDA content. For instance, a PCC slab with no TDA had material costs similar to those of a slab 10 mm thicker with 40% TDA.
Author Contributions
Funding
Institutional Review Board Statement
Informed Consent Statement
Data Availability Statement
Acknowledgments
Conflicts of Interest
References
- Saleh, H.M.; Eskander, S.B.; Fahmy, H.M. Mortar Composite Based on Wet Oxidative Degraded Cellulosic Spinney Waste Fibers. Int. J. Environ. Sci. Technol. 2014, 11, 1297–1304. [Google Scholar] [CrossRef]
- Saleh, H.M.; Bondouk, I.I.; Salama, E.; Esawii, H.A. Consistency and Shielding Efficiency of Cement-Bitumen Composite for Use as Gamma-Radiation Shielding Material. Prog. Nucl. Energy 2021, 137, 103764. [Google Scholar] [CrossRef]
- Robert, D.; Baez, E.; Setunge, S. A new technology of transforming recycled glass waste to construction components. Constr. Build. Mater. 2021, 313, 125539. [Google Scholar] [CrossRef]
- Eskander, S.B.; Saleh, H.M.; Tawfik, M.E.; Bayoumi, T.A. Towards Potential Applications of Cement-Polymer Composites Based on Recycled Polystyrene FoamWastes on Construction Fields: Impact of Exposure toWater Ecologies. Case Stud. Constr. Mater. 2021, 15, e00664. [Google Scholar] [CrossRef]
- Nasution, A.; Imran, I.; Abdullah, M. Improvement of Concrete Durability by Nanomaterials. Procedia Eng. 2015, 125, 608–612. [Google Scholar]
- Saleh, H.M.; Bondouk, I.I.; Salama, E.; Mahmoud, H.H.; Omar, K.; Esawii, H.A. Asphaltene or Polyvinylchloride Waste Blended with Cement to Produce a Sustainable Material Used in Nuclear Safety. Sustainability 2022, 14, 3525. [Google Scholar] [CrossRef]
- Abu Abdo, A.M.; Jung, S.J. Evaluation of Enforcing Rigid Pavements with Plastic Waste Fibers. ARPN J. Eng. Appl. Sci. 2019, 14, 2348–2355. Available online: http://www.arpnjournals.org/jeas/research_papers/rp_2019/jeas_0719_7814.pdf (accessed on 1 June 2022).
- Eldin, N.N.; Senouci, A.B. Engineering properties of rubberized concrete. Can. J. Civ. Eng. 1992, 19, 912–923. [Google Scholar] [CrossRef]
- Mills, B.; El Naggar, H.; Valsangkar, A. North American overview and Canadian perspective on the use of tire derived aggregate in highway embankment construction. In Ground Improvement Case Histories; Indraratna, B., Chu, J., Rujikiatkamjorn, C., Eds.; Elsevier Ltd.: Amsterdam, The Netherlands, 2015; Volume 2, pp. 635–655. [Google Scholar] [CrossRef]
- Ashari, M.; El Naggar, H.; Martins, Y. Evaluation of the Physical Properties of TDA-Sand Mixtures. In Proceedings of the 70th Canadian Geotechnical Conference (GeoOttawa 2017), Ottawa, ON, Canada, 1–4 October 2017. [Google Scholar]
- Bandarage, K.; Sadeghian, P. Effects of Long Shredded Rubber Particles Recycled from Waste Tires on Mechanical Properties of Concrete. J. Sustain. Cem.-Based Mater. 2020, 9, 50–59. [Google Scholar] [CrossRef]
- El Naggar, H.; Soleimani, P.; Fakhroo, A. Strength and Stiffness Properties of Green Lightweight Fill Mixtures. Geotech. Geol. Eng. 2016, 34, 867–876. [Google Scholar] [CrossRef]
- Mahgoub, A.; El Naggar, H. Using TDA underneath shallow foundations: Simplified design procedure. Int. J. Geotech. Eng. 2019, 16, 787–801. [Google Scholar] [CrossRef]
- Mahgoub, A.; El Naggar, H. Using TDA as an Engineered Stress-Reduction Fill over Preexisting Buried Pipes. J. Pipeline Syst. Eng. Pract. 2019, 10, 4018034. [Google Scholar] [CrossRef]
- Zahran, K.; Naggar, H. Effect of Sample Size on T.D.A. Shear Strength Parameters in Direct Shear Tests. Transp. Res. Rec. 2020, 2674, 1110–1119. [Google Scholar] [CrossRef]
- Mahgoub, A.; El Naggar, H. Coupled TDA–Geocell Stress-Bridging System for Buried Corrugated Metal Pipes. J. Geotech. Geoenviron. Eng. 2020, 146, 4020052. [Google Scholar] [CrossRef]
- Mahgoub, A.; El Naggar, H. Innovative Application of Tire-Derived Aggregate around Corrugated Steel Plate Culverts. J. Pipeline Syst. Eng. Pract. 2020, 11, 4020025. [Google Scholar] [CrossRef]
- Mahgoub, A.; El Naggar, H. Shallow foundations on lightweight TDA backfill: Field tests and 3D numerical modelling. Comput. Geotech. 2020, 126, 103761. [Google Scholar] [CrossRef]
- El Naggar, H.; Zahran, K.; Moussa, A. Effect of the Particle Size on the T.D.A. Shear Strength and Stiffness Parameters in Large-Scale Direct Shear Tests. Geotechnics 2021, 1, 1–17. [Google Scholar] [CrossRef]
- El Naggar, H.; Zahran, K. Effect of the Particle Size on T.D.A. Shear Strength Parameters in Triaxial Tests. Buildings 2021, 11, 76. [Google Scholar] [CrossRef]
- El Naggar, H.; Ashari, M.; Mahgoub, A. Development of an empirical hyperbolic material model for TDA utilizing large-scale triaxial testing. Int. J. Geotech. Eng. 2022, 16, 133–142. [Google Scholar] [CrossRef]
- Taha, B.; Nounu, G. Utilizing Waste Recycled Glass as Sand/Cement Replacement in Concrete. J. Mater. Civ. Eng. 2009, 21, 709–721. [Google Scholar] [CrossRef]
- Angelone, S.; Cauhapé Casaux, M.; Martinez, F.O. Green Pavements: Reuse of Plastic waste Fibers in Asphalt Mixtures. Mater. Struct. 2016, 49, 1655–1665. [Google Scholar] [CrossRef]
- Hoppe, E.J.; Lane, D.S.; Fitch, G.M.; Shetty, S. Feasibility of Reclaimed Asphalt Pavement (RAP) Use as Road Base and Subbase Material. Virginia Center for Transportation Innovation and Research, Final Report VCTIR 15-R6, USA. 2015. Available online: https://www.virginiadot.org/vtrc/main/online_reports/pdf/15-r6.pdf (accessed on 1 June 2022).
- Al-Tayeb, M.M.; Ismail, H.; Dawoud, O.; Wafi, S.R.; Daoor, I.A. Ultimate Failure Resistance of Concrete with Partial Replacements of Sand by Waste Plastic of Vehicles Under Impact Load. Int. J. Sustain. Built Environ. 2017, 6, 610–616. [Google Scholar] [CrossRef]
- Abu Abdo, A.M.; Jung, S.J. Investigation of Reinforcing Flexible Pavements with Waste Plastic Fibers in Ras Al Khaimah, UAE. Road Mater. Pavement Des. 2020, 21, 1753–1762. [Google Scholar] [CrossRef]
- Molenaar, A. Durability, A Prerequisite for Sustainable Pavements. In Proceedings of the 5th Eurasphalt and Eurobitume Congress, Istanbul, Turkey, 13–15 June 2012. [Google Scholar]
- Li, H.; Xu, Y.; Chen, P.; Ge, J.; Wu, F. Impact Energy Consumption of High-Volume Rubber Concrete with Silica Fume. Adv. Civ. Eng. 2019, 2019, 1728762. [Google Scholar] [CrossRef]
- Ghaly, A.M.; Cahill, J.D., IV. Correlation of Strength, Rubber Content, and Water to Cement Ratio in Rubberized Concrete. Can. J. Civ. Eng. 2004, 32, 1075–1081. [Google Scholar] [CrossRef]
- Pham, T.M.; Elchalakani, M.; Hao, H.; Lai, J.; Ameduri, S.; Tran, T.M. Durability characteristics of lightweight rubberized concrete. Constr. Build. Mater. 2019, 224, 584–599. [Google Scholar] [CrossRef]
- Huang, Y.H. Pavement Analysis and Design; Pearson Prentice Hall: Upper Saddle River, NJ, USA, 2004; pp. 147–236. [Google Scholar]
- Coleman, L.W. Tire Recycling and the Environment: Benefits and Challenges. Hazardous and Solid Waste, Special Topics in Environmental Management. 22 March 2021. Available online: https://ehsdailyadvisor.blr.com/2021/03/tire-recycling-and-the-environment-benefits-and-challenges/ (accessed on 30 December 2021).
- Dos Santos, J.; Thyagarajan, S.; Keijzer, E.; Flores, R.; Flintsch, G. Comparison of Life-Cycle Assessment Tools for Road Pavement Infrastructure. Transp. Res. Rec. 2017, 2646, 28–38. [Google Scholar] [CrossRef]
- Horvath, A. A Life-Cycle Analysis Model and Decision-Support Tool for Selecting Recycled versus Virgin Materials for Highway Applications, Final Report for RMRC Research Project No. 23, University of California at Berkeley, USA. 2004. Available online: https://rmrc.wisc.edu/wp-content/uploads/2012/10/P23Final.pdf (accessed on 1 June 2022).
- Bloom, E. Assessing the Life Cycle Benefits of Recycled Materials in Road Construction. Master’s Thesis, University of Wisconsin, Madison, WI, USA, 2016. Available online: https://rmrc.wisc.edu/wp-content/uploads/2017/05/Bloom-Thesis_Final-Draft-V2.pdf (accessed on 1 June 2022).
- Ganjian, E.; Khorami, M.; Maghsoudi, A.A. Scrap-tyre-rubber replacement for aggregate and filler in concrete. Constr. Build. Mater. 2009, 23, 1828–1836. [Google Scholar] [CrossRef]
- Aslani, F. Mechanical properties of waste tire rubber concrete. J. Mater. Civ. Eng. 2016, 28, 14. [Google Scholar] [CrossRef]
- Sparkes, J.; El Naggar, H.; Valsangkar, A. Compressibility and Shear Strength Properties of Tire-Derived Aggregate Mixed with Lightweight Aggregate. J. Pipeline Syst. Eng. Pract. 2019, 10, 4018031. [Google Scholar] [CrossRef]


| Material | Type | Minimum Aggregate Size (mm) | Maximum Aggregate Size (mm) | Bulk Density (kg/m3) |
|---|---|---|---|---|
| Cement | PC Type 1 | _ | _ | 1506 |
| Fine aggregates | Masonry sand | 0.15 | 4.75 | 1817 |
| Coarse aggregates | 12 mm gravel | 4.75 | 19.05 | 1601 |
| TDA * | Shredded tires | 4.75 | 19.05 | 557 |
| Material | Weight, kg |
|---|---|
| Cement | 569 |
| Water | 235 |
| Fine aggregates | 559 |
| Coarse aggregates | 958 |
| TDA, % | 0 | 10 | 20 | 40 | 60 | 80 | 100 |
|---|---|---|---|---|---|---|---|
| Corner Loading | |||||||
| Max stress, kPa | 1798.8 | 1672.5 | 1603.6 | 1565.5 | 1411.2 | 1275.5 | 1236.4 |
| Max comp. stress (x-direction), kPa | 1484.4 | 1430.9 | 1395.9 | 1374.9 | 1279.4 | 1164.6 | 1129.8 |
| Max tensile stress (x-direction), kPa | −86.9 | −26.4 | 0 | 0 | −2.8 | −5.8 | −10 |
| Max comp. stress (y-direction), kPa | 1288.9 | 1184.4 | 1124.8 | 1091.2 | 1004.7 | 944.9 | 926.6 |
| Max tensile stress (y-direction), kPa | −725.2 | −657.8 | −624.4 | −606.7 | −540.7 | −480.6 | −465.1 |
| Interior Loading | |||||||
| Max stress, kPa | −1361.4 | −1273.4 | −1230.3 | −1207.5 | −1120.6 | −1037.0 | −1014.4 |
| Max comp. stress (x-direction), kPa | 228.2 | 233.4 | 231.4 | 229.1 | 212.9 | 192.2 | 198.2 |
| Max tensile stress (x-direction), kPa | −1361.4 | −1273.4 | −1230.3 | −1207.5 | −1120.6 | −1037.0 | −1014.4 |
| Max comp. stress (y-direction), kPa | 307.5 | 302.8 | 299.3 | 297.0 | 285.9 | 271.6 | 267.1 |
| Max tensile stress (y-direction), kPa | −397.2 | −389.5 | −385.6 | −383.4 | −374.9 | −366.4 | −364.1 |
| Edge Loading | |||||||
| Max stress, kPa | −2503.9 | −2335.8 | −2253.9 | −2210.7 | −2046.9 | −1890.9 | −1848.9 |
| Max comp. stress (x-direction), kPa | 412.9 | 423.4 | 419.6 | 415.3 | 384.7 | 336.7 | 334.3 |
| Max tensile stress (x-direction), kPa | −2503.9 | −2335.8 | −2253.9 | −2210.7 | −2046.9 | −1890.9 | −1848.9 |
| Max comp. stress (y-direction), kPa | 501.5 | 456.9 | 431.4 | 417.0 | 385.7 | 370.9 | 366.2 |
| Max tensile stress (y-direction), kPa | −294.5 | −280.6 | −274.0 | −270.8 | −258.8 | −248.9 | −246.5 |
| TDA, % | 0 | 10 | 20 | 40 | 60 | 80 | 100 |
|---|---|---|---|---|---|---|---|
| Corner Loading | |||||||
| Max stress, kPa | 1551.5 | 1450.7 | 1398.2 | 1368.8 | 1247.9 | 1128.6 | 1097.6 |
| Max comp. stress (x-direction), kPa | 1245.8 | 1212.9 | 1190.1 | 1176 | 1109.5 | 1025.9 | 1000.1 |
| Max tensile stress (x-direction), kPa | −102.6 | −53.9 | −29.1 | −15.8 | 0 | −3.7 | −4.4 |
| Max comp. stress (y-direction), kPa | 1110.3 | 1036.2 | 992.5 | 967.4 | 861.1 | 814.1 | 800.6 |
| Max tensile stress (y-direction), kPa | −633.8 | −579.4 | −551.8 | −537 | −481 | −428.9 | −415.3 |
| Interior Loading | |||||||
| Max stress, kPa | −1172.4 | −1098.6 | −1062.7 | −1043.8 | −971.3 | −901.7 | −882.8 |
| Max comp. stress (x-direction), kPa | 180.4 | 191.3 | 192.9 | 192.7 | 185.5 | 169.3 | 163.6 |
| Max tensile stress (x-direction), kPa | −1172.4 | −1098.6 | −1062.7 | −1043.8 | −971.3 | −901.7 | −882.8 |
| Max comp. stress (y-direction), kPa | 255.2 | 253.0 | 251.0 | 249.6 | 242.4 | 232.5 | 229.2 |
| Max tensile stress (y-direction), kPa | −332.0 | −326.0 | −322.9 | −321.1 | −314.3 | −307.4 | −305.5 |
| Edge Loading | |||||||
| Max stress, kPa | −2160.1 | −2018.5 | −1950.1 | −1914.0 | −1776.8 | −1646.0 | −1610.7 |
| Max comp. stress (x-direction), kPa | 325.0 | 346.7 | 349.9 | 349.6 | 336.0 | 305.5 | 294.6 |
| Max tensile stress (x-direction), kPa | −2160.1 | −2018.5 | −1950.1 | −1914.0 | −1776.8 | −1646.0 | −1610.7 |
| Max comp. stress (y-direction), kPa | 433.4 | 402.0 | 383.4 | 372.6 | 327.2 | 314.9 | 311.5 |
| Max tensile stress (y-direction), kPa | −250.9 | −239.2 | −233.5 | −230.6 | −219.9 | −210.8 | −208.6 |
| TDA, % | 0 | 10 | 20 | 40 | 60 | 80 | 100 |
|---|---|---|---|---|---|---|---|
| Corner Loading | |||||||
| Max stress, kPa | 1350.2 | 1266.8 | 1226.5 | 1203.7 | 1108.4 | 1005.7 | 978.1 |
| Max comp. stress (x-direction), kPa | 1066.7 | 1037.0 | 1022.2 | 1012.8 | 966.5 | 905.5 | 886.1 |
| Max tensile stress (x-direction), kPa | −108.5 | −69.5 | −49.0 | −37.9 | 0.0 | −0.8 | −2.1 |
| Max comp. stress (y-direction), kPa | 961.9 | 909.0 | 876.9 | 858.1 | 776.5 | 706.4 | 696.5 |
| Max tensile stress (y-direction), kPa | −557.4 | −513.8 | −491.0 | −478.7 | −431.1 | −386.0 | −374.0 |
| Interior Loading | |||||||
| Max stress, kPa | −1022.0 | −959.1 | −928.6 | −912.5 | −851.2 | −792.3 | −776.2 |
| Max comp. stress (x-direction), kPa | 142.2 | 156.5 | 160.3 | 161.5 | 160.4 | 151.1 | 147.3 |
| Max tensile stress (x-direction), kPa | −1022.0 | −959.1 | −928.6 | −912.5 | −851.2 | −792.3 | −776.2 |
| Max comp. stress (y-direction), kPa | 214.7 | 213.9 | 212.9 | 212.1 | 207.5 | 200.6 | 198.3 |
| Max tensile stress (y-direction), kPa | −281.6 | −276.9 | −274.4 | −273 | −267.5 | −261.8 | −260.2 |
| Edge Loading | |||||||
| Max stress, kPa | −1886.2 | −1765.0 | −1706.5 | −1675.8 | −1559.2 | −1447.9 | −1417.8 |
| Max comp. stress (x-direction), kPa | 254.8 | 282.8 | 290.4 | 292.7 | 290.9 | 273.4 | 266.2 |
| Max tensile stress (x-direction), kPa | −1886.2 | −1765 | −1706.5 | −1675.8 | −1559.2 | −1447.9 | −1417.8 |
| Max comp. stress (y-direction), kPa | 376.1 | 354.1 | 340.5 | 332.5 | 297.5 | 269.8 | 267.5 |
| Max tensile stress (y-direction), kPa | −216.5 | −206.8 | −201.8 | −199.3 | −189.9 | −181.5 | −179.5 |
| TDA, % | 0 | 10 | 20 | 40 | 60 | 80 | 100 |
|---|---|---|---|---|---|---|---|
| Corner Loading | |||||||
| Max stress, kPa | 1182.2 | 1119.3 | 1082.2 | 1064.4 | 988.8 | 905.4 | 881.3 |
| Max comp. stress (x-direction), kPa | 936.3 | 894.1 | 884.5 | 878.3 | 846.2 | 801.5 | 787.0 |
| Max tensile stress (x-direction), kPa | −108.4 | −77.4 | −60.7 | −51.5 | −15.2 | 0.0 | 0.0 |
| Max comp. stress (y-direction), kPa | 838.2 | 800.3 | 776.7 | 762.7 | 700.1 | 627.2 | 609.6 |
| Max tensile stress (y-direction), kPa | −493.0 | −458.2 | −439.4 | −429.1 | −388.8 | −349.6 | −339.1 |
| Interior Loading | |||||||
| Max stress, kPa | −900.3 | −845.8 | −819.5 | −805.6 | −752.9 | −702.3 | −688.6 |
| Max comp. stress (x-direction), kPa | 118.0 | 127.7 | 132.9 | 135 | 138.1 | 133.9 | 131.6 |
| Max tensile stress (x-direction), kPa | −900.3 | −845.79 | −819.5 | −805.6 | −752.9 | −702.3 | −688.6 |
| Max comp. stress (y-direction), kPa | 186.9 | 182.8 | 182.4 | 182 | 179.1 | 174.4 | 172.7 |
| Max tensile stress (y-direction), kPa | −241.9 | −238.2 | −236.1 | −235 | −230.4 | −225.7 | −224.4 |
| Edge Loading | |||||||
| Max stress, kPa | −1664.2 | −1558.9 | −1508.2 | −1481.5 | −1380.9 | −1285.1 | −1259.3 |
| Max comp. stress (x-direction), kPa | 217.7 | 229.8 | 240.2 | 244.3 | 250.5 | 242.6 | 238.2 |
| Max tensile stress (x-direction), kPa | −1664.2 | −1558.9 | −1508.2 | −1481.5 | −1380.9 | −1285.1 | −1259.3 |
| Max comp. stress (y-direction), kPa | 328.1 | 312.6 | 302.7 | 296.7 | 270.0 | 238.8 | 231.7 |
| Max tensile stress (y-direction), kPa | −188.8 | −180.7 | −176.5 | −174.3 | −166.0 | −158.4 | −156.6 |
| TDA, % | 0 | 10 | 20 | 40 | 60 | 80 | 100 |
|---|---|---|---|---|---|---|---|
| Corner Loading | |||||||
| Max stress, kPa | 1041.5 | 993.7 | 960.0 | 948.8 | 885.8 | 817.8 | 797.9 |
| Max comp. stress (x-direction), kPa | 825.7 | 785.2 | 771.0 | 766.9 | 744.7 | 712.0 | 701.0 |
| Max tensile stress (x-direction), kPa | −105.1 | −80.5 | −66.8 | −59.2 | −28.6 | 0.0 | 0.0 |
| Max comp. stress (y-direction), kPa | 735.1 | 707.7 | 690.1 | 679.7 | 631.7 | 573.6 | 556.0 |
| Max tensile stress (y-direction), kPa | −438.3 | −410.5 | −395.1 | −386.6 | −352.4 | −318.4 | −309.1 |
| Interior Loading | |||||||
| Max stress, kPa | −800.1 | −752.5 | −729.4 | −717.2 | −671.4 | −627.5 | −615.6 |
| Max comp. stress (x-direction), kPa | 102.5 | 104.0 | 110.1 | 112.7 | 118.6 | 118.0 | 116.8 |
| Max tensile stress (x-direction), kPa | −800.1 | −752.5 | −729.4 | −717.2 | −671.4 | −627.5 | −615.6 |
| Max comp. stress (y-direction), kPa | 164.3 | 157.8 | 157.7 | 157.5 | 155.9 | 152.6 | 151.5 |
| Max tensile stress (y-direction), kPa | −210.0 | −207.0 | −205.3 | −204.4 | −200.7 | −196.7 | −195.6 |
| Edge Loading | |||||||
| Max stress, kPa | −1481.4 | −1388.9 | −1344.3 | −1320.9 | −1233.1 | −1149.5 | −1127.0 |
| Max comp. stress (x-direction), kPa | 188.8 | 186.2 | 198.2 | 203.2 | 215.0 | 214.1 | 211.8 |
| Max tensile stress (x-direction), kPa | −1481.4 | −1388.9 | −1344.3 | −1320.9 | −1233.1 | −1149.5 | −1127.0 |
| Max comp. stress (y-direction), kPa | 287.5 | 276.9 | 269.6 | 265.2 | 244.8 | 219.9 | 212.4 |
| Max tensile stress (y-direction), kPa | −166.1 | −159.3 | −155.7 | −153.9 | −146.6 | −139.8 | −138.1 |
| TDA, % | 0 | 10 | 20 | 40 | 60 | 80 | 100 |
|---|---|---|---|---|---|---|---|
| Corner Loading | |||||||
| Max stress, kPa | 922.9 | 886.2 | 856.0 | 845.1 | 796.8 | 741.1 | 724.6 |
| Max comp. stress (x-direction), kPa | 731.9 | 701.8 | 682.7 | 674.0 | 658.7 | 634.8 | 626.6 |
| Max tensile stress (x-direction), kPa | −100.2 | −80.6 | −69.4 | −63.1 | −37.3 | −10.7 | −3.4 |
| Max comp. stress (y-direction), kPa | 648.7 | 628.6 | 615.6 | 607.7 | 570.7 | 524.5 | 510.2 |
| Max tensile stress (y-direction), kPa | −391.5 | −369.3 | −356.7 | −349.7 | −320.8 | −291.3 | −283.2 |
| Interior Loading | |||||||
| Max stress, kPa | −716.9 | −674.6 | −654.1 | −643.5 | −603.0 | −564.5 | −554.1 |
| Max comp. stress (x-direction), kPa | 89.1 | 88.5 | 91.0 | 93.9 | 101.7 | 103.7 | 103.3 |
| Max tensile stress (x-direction), kPa | −716.9 | −674.6 | −654.1 | −643.5 | −603.0 | −564.5 | −554.1 |
| Max comp. stress (y-direction), kPa | 145.2 | 140.1 | 137.4 | 137.4 | 136.6 | 134.5 | 133.7 |
| Max tensile stress (y-direction), kPa | −184.0 | −181.6 | −180.2 | −179.5 | −176.3 | −173.0 | −172.0 |
| Edge Loading | |||||||
| Max stress, kPa | −1329.2 | −1246.8 | −1207.2 | −1186.6 | −1108.8 | −1035.3 | −1015.5 |
| Max comp. stress (x-direction), kPa | 163.9 | 163.4 | 163.0 | 168.7 | 184.0 | 188.2 | 187.5 |
| Max tensile stress (x-direction), kPa | −1329.2 | −1246.8 | −1207.2 | −1186.6 | −1108.8 | −1035.3 | −1015.5 |
| Max comp. stress (y-direction), kPa | 253.6 | 246.1 | 240.7 | 237.5 | 221.9 | 202.2 | 196.1 |
| Max tensile stress (y-direction), kPa | −147.2 | −141.6 | −138.5 | −136.9 | −130.5 | −124.5 | −122.9 |
| TDA, % | 0 | 10 | 20 | 40 | 60 | 80 | 100 |
|---|---|---|---|---|---|---|---|
| PCC Slab Thickness, mm | Cracking Index (CI) | ||||||
| 200 | 1.21 × 10⁻⁵ | 2.60 × 10⁻⁴ | 2.16 × 10⁻⁴ | 4.09 × 10⁻³ | 4.02 × 10⁻¹ | 3.80 × 10⁻¹ | 4.58 × 100 |
| 210 | 3.45 × 10⁻⁶ | 6.68 × 10⁻⁵ | 5.69 × 10⁻⁵ | 8.77 × 10⁻⁴ | 6.42 × 10⁻² | 6.30 × 10⁻² | 6.46 × 10⁻¹ |
| 220 | 6.39 × 10⁻⁷ | 2.00 × 10⁻⁵ | 1.73 × 10⁻⁵ | 2.22 × 10⁻⁴ | 1.24 × 10⁻² | 1.26 × 10⁻² | 1.12 × 10⁻¹ |
| 230 | 3.13 × 10⁻⁸ | 6.77 × 10⁻⁶ | 5.90 × 10⁻⁶ | 6.52 × 10⁻⁵ | 2.86 × 10⁻³ | 2.97 × 10⁻³ | 2.31 × 10⁻² |
| 240 | 0 | 1.99 × 10⁻⁶ | 1.66 × 10⁻⁶ | 2.16 × 10⁻⁵ | 7.59 × 10⁻⁴ | 8.05 × 10⁻⁴ | 5.56 × 10⁻³ |
| 250 | 0 | 3.59 × 10⁻⁷ | 2.69 × 10⁻⁷ | 7.97 × 10⁻⁶ | 2.29 × 10⁻⁴ | 2.47 × 10⁻⁴ | 1.53 × 10⁻³ |
| 260 | 0 | 0 | 0 | 2.77 × 10⁻⁶ | 7.73 × 10⁻⁵ | 8.42 × 10⁻⁵ | 4.73 × 10⁻⁴ |
| 270 | 0 | 0 | 0 | 6.86 × 10⁻⁷ | 2.87 × 10⁻⁵ | 3.16 × 10⁻⁵ | 1.62 × 10⁻⁴ |
| 280 | 0 | 0 | 0 | 7.86 × 10⁻⁸ | 1.17 × 10⁻⁵ | 1.29 × 10⁻⁵ | 6.08 × 10⁻⁵ |
| 290 | 0 | 0 | 0 | 0 | 4.91 × 10⁻⁶ | 5.54 × 10⁻⁶ | 2.47 × 10⁻⁵ |
| 300 | 0 | 0 | 0 | 0 | 1.75 × 10⁻⁶ | 2.08 × 10⁻⁶ | 1.08 × 10⁻⁵ |
| Slab, mm | TDA | Energy (MJ) | Water Consumption (kg) | CO2 (Mg) = GWP | NOx (kg) | PM10 (kg) | SO2 (kg) | CO (kg) | Hg (g) | Pb (g) | RCRA Hazardous Waste Generated (kg) | Human Toxicity Potential (Cancer) (kg) | Human Toxicity Potential (Noncancer) (kg) |
|---|---|---|---|---|---|---|---|---|---|---|---|---|---|
| 200 | 0 | 5,191,814 | 2065 | 369 | 4048 | 1131 | 2910 | 1542 | 5.39 | 380 | 12,038 | 79,530 | 431,524,959 |
| 200 | 10% | 5,172,448 | 2062 | 368 | 4034 | 1111 | 2911 | 1539 | 5.39 | 380 | 11,994 | 77,773 | 410,172,953 |
| 200 | 20% | 5,153,081 | 2059 | 367 | 4020 | 1090 | 2912 | 1536 | 5.39 | 379 | 11,950 | 76,017 | 388,820,947 |
| 200 | 40% | 5,114,348 | 2053 | 365 | 3992 | 1049 | 2915 | 1531 | 5.38 | 379 | 11,862 | 72,504 | 346,116,935 |
| 200 | 60% | 5,075,615 | 2047 | 363 | 3963 | 1008 | 2918 | 1526 | 5.38 | 378 | 11,774 | 68,992 | 303,412,923 |
| 200 | 80% | 5,036,882 | 2041 | 362 | 3935 | 967 | 2920 | 1521 | 5.37 | 377 | 11,686 | 65,479 | 260,708,910 |
| 200 | 100% | 4,998,150 | 2035 | 360 | 3907 | 926 | 2923 | 1516 | 5.37 | 376 | 11,597 | 61,966 | 218,004,898 |
| 220 | 0 | 5,711,108 | 2272 | 406 | 4453 | 1244 | 3201 | 1696 | 5.93 | 418 | 13,242 | 87,486 | 474,683,196 |
| 220 | 10% | 5,689,805 | 2269 | 405 | 4438 | 1222 | 3202 | 1693 | 5.93 | 418 | 13,194 | 85,554 | 451,195,989 |
| 220 | 20% | 5,668,501 | 2265 | 404 | 4422 | 1199 | 3204 | 1690 | 5.93 | 417 | 13,145 | 83,622 | 427,708,783 |
| 220 | 40% | 5,625,895 | 2259 | 402 | 4391 | 1154 | 3207 | 1684 | 5.92 | 416 | 13,048 | 79,758 | 380,734,369 |
| 220 | 60% | 5,583,289 | 2252 | 400 | 4360 | 1109 | 3209 | 1679 | 5.92 | 416 | 12,951 | 75,894 | 333,759,956 |
| 220 | 80% | 5,540,683 | 2246 | 398 | 4329 | 1064 | 3212 | 1673 | 5.91 | 415 | 12,854 | 72,030 | 286,785,542 |
| 220 | 100% | 5,498,077 | 2239 | 396 | 4297 | 1019 | 3215 | 1667 | 5.91 | 414 | 12,757 | 68,166 | 239,811,129 |
| 240 | 0 | 6,230,401 | 2479 | 443 | 4858 | 1358 | 3492 | 1850 | 6.47 | 456 | 14,446 | 95,442 | 517,841,433 |
| 240 | 10% | 6,207,161 | 2475 | 442 | 4841 | 1333 | 3493 | 1847 | 6.47 | 456 | 14,393 | 93,334 | 492,219,025 |
| 240 | 20% | 6,183,922 | 2471 | 441 | 4824 | 1308 | 3495 | 1844 | 6.47 | 455 | 14,341 | 91,227 | 466,596,618 |
| 240 | 40% | 6,137,442 | 2464 | 438 | 4790 | 1259 | 3498 | 1838 | 6.46 | 454 | 14,235 | 87,011 | 415,351,803 |
| 240 | 60% | 6,090,963 | 2457 | 436 | 4756 | 1210 | 3501 | 1831 | 6.45 | 453 | 14,129 | 82,796 | 364,106,989 |
| 240 | 80% | 6,044,483 | 2450 | 434 | 4722 | 1161 | 3505 | 1825 | 6.45 | 452 | 14,023 | 78,581 | 312,862,174 |
| 240 | 100% | 5,998,004 | 2443 | 432 | 4688 | 1112 | 3508 | 1819 | 6.44 | 452 | 13,917 | 74,366 | 261,617,616 |
| 260 | 0 | 6,749,695 | 2685 | 480 | 5263 | 1471 | 3783 | 2004 | 7.01 | 494 | 15,650 | 103,398 | 560,999,669 |
| 260 | 10% | 6,724,518 | 2681 | 478 | 5245 | 1444 | 3784 | 2001 | 7.01 | 494 | 15,593 | 101,115 | 533,242,062 |
| 260 | 20% | 6,699,342 | 2677 | 477 | 5226 | 1418 | 3786 | 1998 | 7.00 | 493 | 15,536 | 98,831 | 505,484,454 |
| 260 | 40% | 6,648,989 | 2670 | 475 | 5190 | 1364 | 3790 | 1991 | 7.00 | 492 | 15,421 | 94,265 | 449,969,238 |
| 260 | 60% | 6,598,636 | 2662 | 473 | 5153 | 1311 | 3793 | 1984 | 6.99 | 491 | 15,307 | 89,698 | 394,454,022 |
| 260 | 80% | 6,548,284 | 2654 | 470 | 5116 | 1258 | 3797 | 1977 | 6.99 | 490 | 15,192 | 85,132 | 338,938,806 |
| 260 | 100% | 6,497,931 | 2646 | 468 | 5079 | 1204 | 3800 | 1971 | 6.98 | 489 | 15,077 | 80,565 | 283,423,590 |
| 280 | 0 | 7,268,988 | 2892 | 517 | 5668 | 1584 | 4074 | 2159 | 7.55 | 532 | 16,854 | 111,354 | 604,157,906 |
| 280 | 10% | 7,241,875 | 2888 | 515 | 5648 | 1555 | 4076 | 2155 | 7.55 | 532 | 16,793 | 108,895 | 574,265,098 |
| 280 | 20% | 7,214,762 | 2883 | 514 | 5629 | 1527 | 4077 | 2151 | 7.54 | 531 | 16,731 | 106,436 | 544,372,289 |
| 280 | 40% | 7,160,536 | 2875 | 511 | 5589 | 1469 | 4081 | 2144 | 7.54 | 530 | 16,608 | 101,518 | 484,586,672 |
| 280 | 60% | 7,106,310 | 2867 | 509 | 5549 | 1412 | 4085 | 2137 | 7.53 | 529 | 16,484 | 96,601 | 424,801,055 |
| 280 | 80% | 7,052,084 | 2858 | 506 | 5509 | 1354 | 4089 | 2130 | 7.52 | 528 | 16,361 | 91,683 | 365,015,438 |
| 280 | 100% | 6,997,858 | 2850 | 504 | 5470 | 1297 | 4093 | 2122 | 7.52 | 527 | 16,237 | 86,765 | 305,229,821 |
| 300 | 0 | 7,788,282 | 3098 | 553 | 6073 | 1697 | 4365 | 2313 | 8.09 | 570 | 18,058 | 119,310 | 647,316,143 |
| 300 | 10% | 7,759,232 | 3094 | 552 | 6052 | 1666 | 4367 | 2309 | 8.09 | 570 | 17,992 | 116,675 | 615,288,134 |
| 300 | 20% | 7,730,182 | 3089 | 551 | 6031 | 1636 | 4369 | 2305 | 8.08 | 569 | 17,926 | 114,041 | 583,260,125 |
| 300 | 40% | 7,672,083 | 3080 | 548 | 5988 | 1574 | 4373 | 2297 | 8.08 | 568 | 17,794 | 108,772 | 519,204,107 |
| 300 | 60% | 7,613,984 | 3071 | 545 | 5946 | 1513 | 4377 | 2290 | 8.07 | 567 | 17,662 | 103,503 | 455,148,088 |
| 300 | 80% | 7,555,884 | 3062 | 543 | 5903 | 1451 | 4381 | 2282 | 8.06 | 566 | 17,529 | 98,234 | 391,092,070 |
Publisher’s Note: MDPI stays neutral with regard to jurisdictional claims in published maps and institutional affiliations. |
© 2022 by the authors. Licensee MDPI, Basel, Switzerland. This article is an open access article distributed under the terms and conditions of the Creative Commons Attribution (CC BY) license (https://creativecommons.org/licenses/by/4.0/).
Share and Cite
Abu Abdo, A.M.; El Naggar, H. Evaluation of the Incorporation of Tire-Derived Aggregates (TDA) in Rigid Pavement Mix Designs. Sustainability 2022, 14, 11775. https://doi.org/10.3390/su141811775
Abu Abdo AM, El Naggar H. Evaluation of the Incorporation of Tire-Derived Aggregates (TDA) in Rigid Pavement Mix Designs. Sustainability. 2022; 14(18):11775. https://doi.org/10.3390/su141811775
Chicago/Turabian StyleAbu Abdo, Ahmad M., and Hany El Naggar. 2022. "Evaluation of the Incorporation of Tire-Derived Aggregates (TDA) in Rigid Pavement Mix Designs" Sustainability 14, no. 18: 11775. https://doi.org/10.3390/su141811775