Article

Can Supplier Concentration Improve Corporate Risk Taking? Moderating Effects of Digital Transformation

1
School of Business, Hong Kong Baptist University, Hong Kong
2
School of Management, Shandong University of Technology, Zibo 255012, China
*
Author to whom correspondence should be addressed.
Sustainability 2022, 14(18), 11664; https://doi.org/10.3390/su141811664
Submission received: 12 August 2022 / Revised: 3 September 2022 / Accepted: 14 September 2022 / Published: 16 September 2022
(This article belongs to the Special Issue Achieving and Maintaining Supply Chain Sustainability)

Abstract

:
The competitive and cooperative relationships between suppliers and enterprises have important implications for enterprise strategy and operational decisions. Using data from listed manufacturing companies in China from 2007 to 2020, this paper empirically examines the impact of supplier concentration on corporate risk taking and its underlying mechanism. The results support the cooperative view of industrial organizations in a supply chain, which states that the higher the supplier concentration, the greater the level of corporate risk taking. The results are robust to various measures of the supplier concentration (Supply), sample selectivity bias, and endogeneity tests. This paper also shows that digital transformation has a moderating effect on supplier concentration and corporate risk taking. The supplier concentration can significantly increase risk taking in companies that have implemented digital transformation, while the effect is not significant in companies that have not implemented digital transformation. The conclusions drawn from this study provide practical guidance on industrial organization relationship coordination and digital transformation, suggesting that the implementation of digital transformation can help a firm to establish and consolidate a good relationship with suppliers and improve operational efficiency.

1. Introduction

Driven by the goal of “Made in China 2025”, China’s manufacturing industry and its supply chain are developing rapidly. Suppliers are an important part of the supply chain, and the supplier relationship of manufacturing enterprises has a significant impact on enterprise strategy and management decisions. Among them, risk taking, as an important decision of enterprises, reflects their willingness to take the initiative to choose high-risk and high-return projects and bear the fluctuation in returns in their investment decisions [1]. However, in the context of COVID-19 and normalized trade barriers, manufacturing firms’ supplier relationships have become more diversified and complex. Does supplier concentration affect firms’ risk taking? The exploration of this issue not only helps to optimize corporate supplier relationships but is also important to enhance corporate risk taking and improve corporate competitiveness.
The degree of information symmetry between suppliers and enterprises is a key factor in determining value cocreation among supply chain stakeholders. As a new model integrating big data, blockchain, cloud computing, and artificial intelligence [2], the digital economy can change the method of information dissemination and transmission efficiency and directly alleviate the information asymmetry between suppliers and enterprises. As the main body of the national economy, the manufacturing industry is undoubtedly the “main position” of industrial digitalization [3]. During the “13th Five-Year Plan” period (2016–2020), the application of digital technology widely covered all business aspects of China’s manufacturing industry, and a total of 49.3% of enterprises achieved full coverage of digital tools (InfoQ Research Institute, 2020). In the context of promoting the integration of industrial chains in various countries, can the implementation of digital transformation in enterprises enhance the effect of supplier concentration? To this end, we study the moderating effect of corporate digital transformation on supplier concentration affecting corporate risk taking.
Therefore, using a sample of listed Chinese manufacturing companies from 2007 to 2020, we examined the impact of supplier concentration on corporate risk taking and tested the moderating effect of digital transformation of enterprises. The results of this paper show that supplier concentration can enhance the level of corporate risk taking. Supplier concentration can increase corporate risk tolerance and enhance the level of risk taking. Furthermore, this paper finds that digital transformation enhances the positive relationship between supplier concentration and corporate risk taking. More specifically, the implementation of digital transformation improves information transparency and increases suppliers’ confidence in providing stable supplies to the firm.
The contribution of this paper is to study the effect of supplier concentration on enterprise risk taking and its influence mechanism from the perspective of supply chain management, which enriches the existing research. There are divergent research findings on the effect of enterprise supplier concentration on enterprise risk taking. One view is that supplier concentration can help enterprises obtain important channels of key resources and knowledge information, so the higher the concentration of suppliers, the more they can take advantage of holistic strategic collaboration [4], increasing enterprise risk taking. Another view is that the higher the concentration of suppliers, the greater the probability of eroding the profits of downstream enterprises [3] and the greater the tendency of enterprise management to make conservative business decisions, thus reducing enterprise risk taking. Accordingly, from the perspectives of the cooperative and competitive effects of the supplier relationships, we show that supplier concentration can increase enterprise risk taking, which enriches the existing literature research conclusions.
Another contribution of this paper is to examine the impact of firm digital transformation on the relationship between supplier concentration and corporate risk taking. Digital transformation enhances enterprise performance [5,6], improves risk resilience [7], and improves the organizational structure and operational processes [8]. Can enterprise digital transformation enhance the effect of supplier concentration on enterprise risk taking? Our study shows that digital transformation can reduce the information asymmetry between suppliers and enterprises and increase the effect of supplier concentration on enterprise risk taking.
The study proceeds as follows: Section 2 describes the literature review. Section 3 develops the hypothesis. Section 4 describes the sample and empirical methodology. Section 5 presents the empirical results. Section 6 concludes the paper.

2. Literature Review

2.1. Corporate Risk Taking

Prior studies find that economic policy is an external factor that affects corporate risk taking. Hilary and Hui [9] suggest that firms in culturally open countries have higher risk taking. It has also been found that corporate risk taking will increase when the legal protection regime is more investor-friendly [10,11]. The economic environment [12], industrial policy [13], and monetary policy [14] influence the level of corporate risk taking, but there are divergent findings on the impact of economic policy uncertainty on corporate risk taking. Liu et al. [15] found that economic uncertainty can promote corporate risk taking, while Peng et al. [16] found that economic uncertainty can reduce corporate risk taking.
Previous studies have also examined the impact of internal corporate factors such as shareholding structure and executives on corporate risk taking. Faccio [17] showed that the more concentrated the equity ratio, the lower the corporate risk taking. Li [18] argued that equity incentives can increase corporate risk taking, while Zhu and Fang [19] concluded that the effect is not significant. Li et al. [20] concluded that corporate strategy affects corporate risk taking. In addition, executives are the direct decision makers of corporate investment and financing and are also direct influencers of corporate risk taking. The literature has examined the effects of executive confidence [1], executive gender [21], and executive team discontinuity [22]. While a large volume of research exists on corporate risk taking, there are few studies on the influence of supplier concentration on corporate risk taking and even fewer studies on the mechanism of supplier concentration on corporate risk taking.

2.2. Supplier Concentration

There are controversial research findings on the effects of suppliers. One view, the cooperation view of industrial organization, is that supplier concentration can help a firm gain important access to key resources and knowledge information. Therefore, the higher the supplier concentration, the better the advantage of strategic collaboration that can be brought into play [4]. Studies have shown that supplier concentration can enhance information transparency [23], reduce capital costs [24], and increase firm performance [25]. Another view is that the higher the supplier concentration, the greater the probability to erode downstream profits [3] because the higher supplier concentration means that a firm is dependent on a few large suppliers for procurement [26]. The fact that suppliers hold the say and pricing power in the purchasing activities weakens the company’s profitability and cash flow [27] and increases audit fees [28] and surplus management [29] leading to increased operational risk [30].

2.3. Enterprise Digital Transformation

From the perspective of information transparency, previous studies found that enterprises’ digital transformation improves innovation and productivity [31]. Enterprises’ digital transformation enhances information flow, improves total factor productivity [32], and promotes the number of technological innovations [33]. Hu [34] found that digital technology accelerates innovation in firms’ products and services. Other studies have shown that digital transformation enhances firm performance [5], inhibits true surplus management [15], and optimizes risk resilience [7].
From a cost and expense perspective, some studies have argued that digital transformation cannot contribute to firm performance. Yu et al. [35] believe that enterprises’ digital transformation requires a large amount of investment and management costs, which lead to a decrease in firm performance [31].
In summary, previous literature has examined the external [9,10,11,12,13,14,15,16] and internal factors [17,18,19,20,21,22] that influence firms’ risk taking from competitive [26,27,28,29,30] or cooperative [23,24,25] perspectives to analyze the effects of supplier concentration on enterprises and the information effects [31,32,33,34] and cost issues [35] of enterprise digitalization. However, studies have analyzed the impact of suppliers on corporate risk taking from both the competitive and cooperative perspectives. In addition, studies related to the effect of enterprise digitalization in the context of the digital economy are yet to be enriched. Therefore, this paper studies supplier concentration and enterprise risk taking and its moderating role in digital transformation with certain theoretical and practical significance.

3. Hypothesis Development

Based on the cooperative view of industrial organizations, the higher the supplier concentration, the more companies are willing to form strategic partnerships with suppliers and make relationship-specific investments [28], thus forming relationship-specific assets. On the one hand, such relationship-specific assets help to improve the efficiency of a firm’s asset operations. Because of the cooperation effect arising from long-term fixed cooperation with a few suppliers, it helps to reduce the procurement cost, reduce the inventory backlog, and improve the inventory turnover rate [36], which in turn improves the profitability of the enterprise. On the other hand, such relationship-specific assets can enhance the reputation value of the enterprise. Because firms establish long-term relationships with a fixed number of large suppliers, there will be long-term, high-frequency business transactions [23] with significant interfirm performance correlations. There is a reputation bundling effect between large suppliers and firms [37]. More specifically, based on the business status of suppliers, it can accurately and effectively map the financial status of a firm. At the same time, a firm investing in high-risk projects will be perceived as having greater value-added potential and stronger growth capability in the future, which will send positive signals to the capital market [38]. Therefore, based on the strategic partnership between suppliers and companies, the higher the supplier concentration, the more they expect the firm to invest in high-risk projects. High-risk project investment also increases the volatility of the firm’s surplus, enhances the firm’s risk tolerance, and can improve the level of risk taking.
Based on the competitive view of industrial organizations, higher supplier concentration indicates that firms conduct procurement operations from a small number of suppliers and are more dependent on upstream business [28]. Porter argues that the higher a firm’s supplier concentration, the stronger the bargaining power of suppliers will be. These suppliers would probably raise raw material prices, lower product quality, and demand more stringent conditions such as early repayment and increased advance payments, making it more difficult for the firm to secure favorable contract terms in their procurement operations, resulting in higher procurement costs, lower profitability, and increased operational risk. In addition, the value of relationship-specific investments depends on the prospects of the enterprise. If the business outlook is good, both the supplier and the seller will be able to obtain higher expected returns from the relationship-specific investment. If the business outlook is bad, the supplier may give up doing business with the company, so the company will have to find a new supplier and will face high switching costs [29]. Thus, based on the pressure that supplier concentration may increase business risks and prospect expectations, corporate management tends to favor a prudent business strategy, which in turn reduces investment in high-risk projects and reduces risk tolerance, thus reducing corporate risk-taking willingness.
Based on the above theoretical analysis and considering the current environment and policies, we believe that suppliers and enterprises are more inclined to choose “cooperation” rather than “competition”. The reasons are as follows: Affected by the uncertain economic environment and the epidemic, it is more difficult for enterprises to operate. Strengthening supply chain management is an important path for enterprises to improve their competitiveness. In the 2016 Government Work Report, Premier Li Keqiang first proposed to “reshape industrial chain, supply chain, and value chain”. In 2022, the government’s work report emphasized: “implementing the project of leading enterprises to protect and stabilize the chain, and maintaining the security and stability of the supply chain”. Driven by government policies, enterprises have broken from the traditional business strategy and chosen to cooperate with external supply chain partners to achieve mutual wins among stakeholders. For example, Xiaomi has grown into the world’s fourth largest smartphone manufacturer in just a few years through cooperation with suppliers. Therefore, with the optimization of China’s business environment, enterprises need to obtain greater competitive advantages in the market with faster speed and lower cost. Then, they need to establish a stable cooperative relationship with their suppliers. Accordingly, this paper proposes the following hypothesis:
Hypothesis 1.
Supplier concentration can increase corporate risk taking, that is to say, the higher the concentration of suppliers, the greater the corporate risk taking will be.
Digital transformation applies a series of emerging technologies, such as artificial intelligence, big data, and cloud computing, to enterprise production and operation, which can realize two-way continuous as well as real-time information interactions between suppliers and enterprises [39]. The implementation of digital transformation in the enterprise can reduce the degree of information asymmetry, improve the access to resources, and enhance the risk tolerance of the enterprise. On the one hand, the firm that implements digital transformation has an advantage in information mining, collection, identification, and storage. The information structure becomes more timely, continuous, and complete [40]. On the other hand, a digitally transformed enterprise can restore all aspects of production and operation with the help of data. Their business processes become more efficient and transparent, and their internal operational and external monitoring mechanisms are further optimized and improved [37]. As a result, the suppliers’ information available to the enterprises implementing digital transformation is greatly enhanced, and they can monitor the firm’s daily operation and investment and financing decisions on time [41]. Suppliers can obtain timely information on the business status of the enterprise, enhance the accuracy of their judgments on the business outlook, reduce the risk of sudden interruptions in procurement cooperation between suppliers and the enterprise, and reduce the risk of the enterprise taking robust business decisions to “meet” the expectations of suppliers. Therefore, the implementation of digital transformation is conducive to the establishment of long-term cooperation between suppliers and enterprises. To enhance their sustainable development and competitiveness, the enterprise will increase investment in high-risk projects, enhance risk tolerance, and improve corporate risk taking. Based on the above analysis, this paper proposes the following hypothesis:
Hypothesis 2.
Compared with enterprises not implementing digital transformation, the supplier concentration in companies implementing digital transformation has a more positive impact on risk taking.

4. Data and Methodology

4.1. Sample Selection and Data Sources

We used data on China’s listed manufacturing companies from 2007 to 2020. Since the manufacturing industry is the main sector of the innovation-driven transformation and upgrading of China’s economy, Premier Li Keqiang pointed out in the government work report on 5 March 2015 that the “Made in China 2025” goal should be implemented to accelerate the transformation from a major manufacturer to a strong one, the core of which is innovation-driven development. Therefore, it is of theoretical and practical significance to study the relationship between suppliers and corporate risk taking in the manufacturing industry. In addition, considering the major revision of China’s accounting standards in 2006, the study period starts in 2007 to ensure the comparability and accuracy of data.
All data for this study were collected from the CSMAR database. The CSMAR database contains detailed information on A-share listed companies on the Shanghai and Shenzhen exchanges. Additionally, the following were excluded from the analysis: First, we excluded the ST sample. Because ST refers to the special treatment by the Shanghai and Shenzhen exchanges for listed companies such as those with two consecutive years of losses or major violations, the abnormal financial conditions of these listed companies would have caused the risk-taking level measured in this paper to be inconsistent with the facts. Second, we excluded duplicates and observations with missing data. According to the above criteria, our final sample consisted of 17,140 firm-year observations, as shown in Figure 1. As can be seen from the annual distribution of sample size in Figure 1, with the formation and improvement of China’s multi-level capital market, the number of listed companies is increasing, and the information disclosure is becoming more and more perfect. The study samples in this paper have been increasing year by year since 2010.
From the statistics in Figure 1, it can be seen that the percentage of samples implementing digital transformation in China has increased from 9.31% in 2007 to 76.34% in 2020, indicating that the proportion of digital transformation of listed companies in China has shown an increasing trend year by year and that the digital transformation of the manufacturing industry in China has achieved remarkable results. In addition, the number of samples implementing digital transformation was 9912, and the number of the sample that had not implemented digital transformation was 7228. The sample size that had not implemented digital transformation still accounted for a large proportion, which provided an opportunity for us to study the moderating effect of digital transformation.

4.2. Variable Descriptions

4.2.1. Dependent Variable

The dependent variable in the paper is corporate risk taking (Risk1 and Risk2). There are four main measures of risk taking that have been studied: debt ratio, R&D expenditure, capital expenditure, earnings volatility [42], and stock return volatility [1]. Due to the high volatility of the Chinese stock market and other reasons, earnings volatility is widely used to measure risk taking. Therefore, this paper used earnings volatility to measure corporate risk taking, which was calculated as follows. Equation (1) uses industry and annual averages to adjust a firm’s annual total asset margins (Adj_Roa) to mitigate the effects of industry and cycles. Risk1 in Equation (2) is the standard deviation of Adj_Roa, adjusted by industry and annual averages, calculated every three years on a rolling basis. Risk2 in Equation (3) is the extreme deviation of Adj_Roa, adjusted by industry and annual averages, calculated every three years on a rolling basis:
A d j _ R o a i t = E B I T i t A S S E T i t 1 X k i = 1 X k E B I T k i t A S S E T k i t
Risk 1 i t = 1 T 1 t = 1 T ( A d j _ R o a i t 1 T t = 1 T A d j _ R o a i t ) 2       T = 3
Risk 2 i t = M a x A d j _ R o a i t M i n A d j _ R o a i t
where Adj_Roa is the adjusted value of the firm’s annual return on total assets (Roa) using industry and annual averages; EBIT denotes earnings before interest and taxes; ASSET is the total assets of the enterprise; subscripts i, k, and t represent the enterprise, industry, and year, respectively; k represents the industry in which enterprise i is located; and Xk denotes the total number of enterprises in industry k in year t.

4.2.2. Independent Variable

The independent variable in this study is a concentration of suppliers (Supply). Following previous literature on supplier concentration [23,24,25], supplier concentration (Supply) was measured by the sum of the top five suppliers’ procurement as a proportion of the firm’s total annual procurement. This measure ranges between zero and one. A larger value of supply indicates that a company purchases more from its top five suppliers, which means the concentration of suppliers is greater. The robustness test for supply is the Herfindahl index proxy.

4.2.3. Moderator Variable

The moderator variable in this study is digital transformation (Dig). Drawing on the research of He [43] and Xu [44], the keywords and extension words representing “digital transformation” were extracted from the annual reports of listed companies by using python software to automatically split the words, and the collected feature word spectrum was searched, matched, and counted to form a digital transformation data pool. When the data pool is not 0, it means that the enterprise has carried out digital transformation, and the Dig value is 1. When the data pool is 0, it means that the enterprise has not carried out digital transformation, and the Dig value is 0.

4.2.4. Control Variables

Several independent variables can influence corporate risk taking. We followed previous research and identified variables. The longer a company has been in business and the larger it is, the higher its risk-taking level [1]. In this paper, we controlled corporate age and asset size. Since corporate debt is an important factor affecting corporate risk taking [22], we controlled for corporate debt, which was measured using the ratio of liabilities to assets (lev) [13]. In addition, we also controlled for information asymmetries between the firm and capital providers [15]. Specifically, we controlled for Dual [1], Board, Idep, Mstop [5], Industry, and Year [7]. The full range of variables and how they are measured are shown in Appendix A.

4.3. Empirical Models

To test Hypothesis 1 and Hypothesis 2 in the text, model (4) is constructed.
Risk 1 i t or   Risk 2 i t = α 0 + α 1 S u p p l y i t + α i C o n t r o l i t + y e a r + i n d + ε i t
where Risk1 and Risk2 are dependent variables and the independent variable (Supply) is supplier concentration. If α1 is significantly greater than 0, then supplier concentration is positively related to corporate risk taking, which supports Hypothesis 1. If α1 is significantly less than 0, then supplier concentration is negatively related to corporate risk taking, which does not support Hypothesis 1. Hypothesis 2 was also tested using model (1) by grouping the samples according to whether they had implemented digital transformation and using the grouped samples to run regressions to observe the coefficients of α1, thus determining whether Hypothesis 2 is valid.

5. Empirical Analysis

5.1. Descriptive Statistics

Panel A of Table 1 provides the summary statistics for the full sample. The mean (median) values were 0.061 (0.044) and 0.115 (0.084) for the risk-taking levels (Risk1 and Risk2). The mean values of Risk1 and Risk2 were greater than the median, and there was a large deviation. This indicates that the level of risk taking of listed manufacturing companies in China was very unbalanced and polarized. There were some samples with high corporate risk taking raising the average value of corporate risk taking. The mean supplier concentration (Supply) was 34.4%, and the median was 30.3%, indicating that the distribution of supplier concentration in the sample was symmetrical. However, the maximum value was 91.4%, which means that some companies focused more than 90% of their procurement business on the top five suppliers, and there was a very high concentration of suppliers.
Panel B of Table 1 is a sample test of supplier concentration grouping. According to the SEC’s manufacturing industry classification standard, supplier concentration was grouped according to the annual average value of the subdivided industry. Those higher than the annual average value of the industry were the high supplier concentration group, while those lower than the annual average value of the industry were the low supplier concentration group. From the grouped sample statistics, it can be seen that the mean values of Risk1 and Risk2 in the high supplier concentration group were higher than the mean values of the low supplier concentration group, and the mean difference test was significant at the 1% level. Therefore, our preliminary judgment is that the higher the concentration of suppliers, the greater the risk taking of enterprises.
Panel C of Table 1 shows the variable statistics for the digital transformation subgroup sample. From the risk-taking level (Risk1 and Risk2) statistics of the two groups of samples, the mean value of the enterprises implementing digital transformation was larger than that of the enterprises that had not implemented digital transformation, and the t-statistic of the mean value was significantly different at the 5% level, indicating that companies implementing digital transformation had a higher risk-taking ability. Finally, in terms of supplier concentration (Supply), the mean value of supplier concentration was significantly lower for digitally transformed companies than for nondigitally transformed companies. This finding may be because the implementation of digital transformation led to more transparent information about the company’s business situation, which attracted more suppliers to establish business relationships, thus reducing the reliance on large suppliers.

5.2. Correlation Analysis

Table 2 presents the Spearman correlations between key variables in the full sample. The correlation coefficients between supplier concentration (Supply) and corporate risk-taking level (Risk1 and Risk2) were 0.042 and 0.041, which were positively correlated at the 1% significance level, indicating that there was a significant positive correlation between supplier concentration and corporate risk-taking level without controlling for other influencing factors. The higher the concentration of suppliers, the greater the level of corporate risk taking, which can initially support hypothesis 1a of this paper. In addition, this paper conducted a variance inflation factor (VIF) diagnostic for all explanatory and control variables in the main regression, and the results showed that the mean VIF value was 1.37, with all values less than 2. Therefore, there was no serious problem of multicollinearity between the variables.

5.3. Multiple Regression Analysis

Table 3 shows the application of model (1) and the use of ordinary least squares to test the effect of supplier concentration on corporate risk taking. From the total sample regression results in columns (1) and (2) in Table 3, after controlling for industry, year, and other characteristics of the firm, supplier concentration (Supply) and firm risk taking (Risk1 and Risk2) were significantly positively correlated at the 1% level, indicating that the higher the concentration of suppliers, the stronger the level of risk taking of manufacturing firms, i.e., Hypothesis 1 of this paper was verified. Then, from the regression results of the control variables, there were significant positive correlations between the enterprise’s asset–liability ratio (Lev), the remuneration of the top three executives (Mstop), the combination of two jobs (Dual), and the enterprise risk taking (Risk1 and Risk2), indicating that the higher the enterprise’s debt ratio, the more executive remuneration, the greater the enterprise management’s tolerance of risk, and the higher the level of corporate risk taking. In contrast, there were significant negative relationships between firm size (Size), age, profitability (Roa), and the level of risk taking. This implies that firms with larger size, longer establishment, and higher profitability have stronger risk tolerance, their market shares are stable, and their business performances are less volatile, thus reducing the probability of firms actively increasing their risk-taking levels.
Referring to Huang and Song [23], supplier concentration was grouped into high and low samples according to the SEC industry type classification criteria based on the sample breakdown into industry and year means for group testing. Columns (3) and (4) in Table 3 report the regression results for the high supplier concentration sample. When the dependent variable was firm risk taking (Risk1 and Risk2), the coefficient of supply was positive and significant at the 1% level. Columns (5) and (6) show the regression results for the low supplier concentration sample. The result shows that supplier concentration (Supply) was positively related to corporate risk taking, regardless of whether the mean measure of risk taking (Risk1) or the extreme difference measure (Risk2) was used, but neither were significant. Accordingly, Hypothesis 1 was tested again. The empirical findings show that the higher the concentration of suppliers, the more strategic cooperation effects can be formed between industrial organizations, while enterprises with a low concentration of suppliers are more likely to form competitive relationships. Therefore, enterprises and suppliers should establish long-term and stable procurement business relationships, which can not only reduce transaction costs but also help optimize the allocation of resources and enhance the sustainable development and competitiveness of enterprises, thus enhancing the management’s tolerance for risk and the level of risk taking of enterprises.

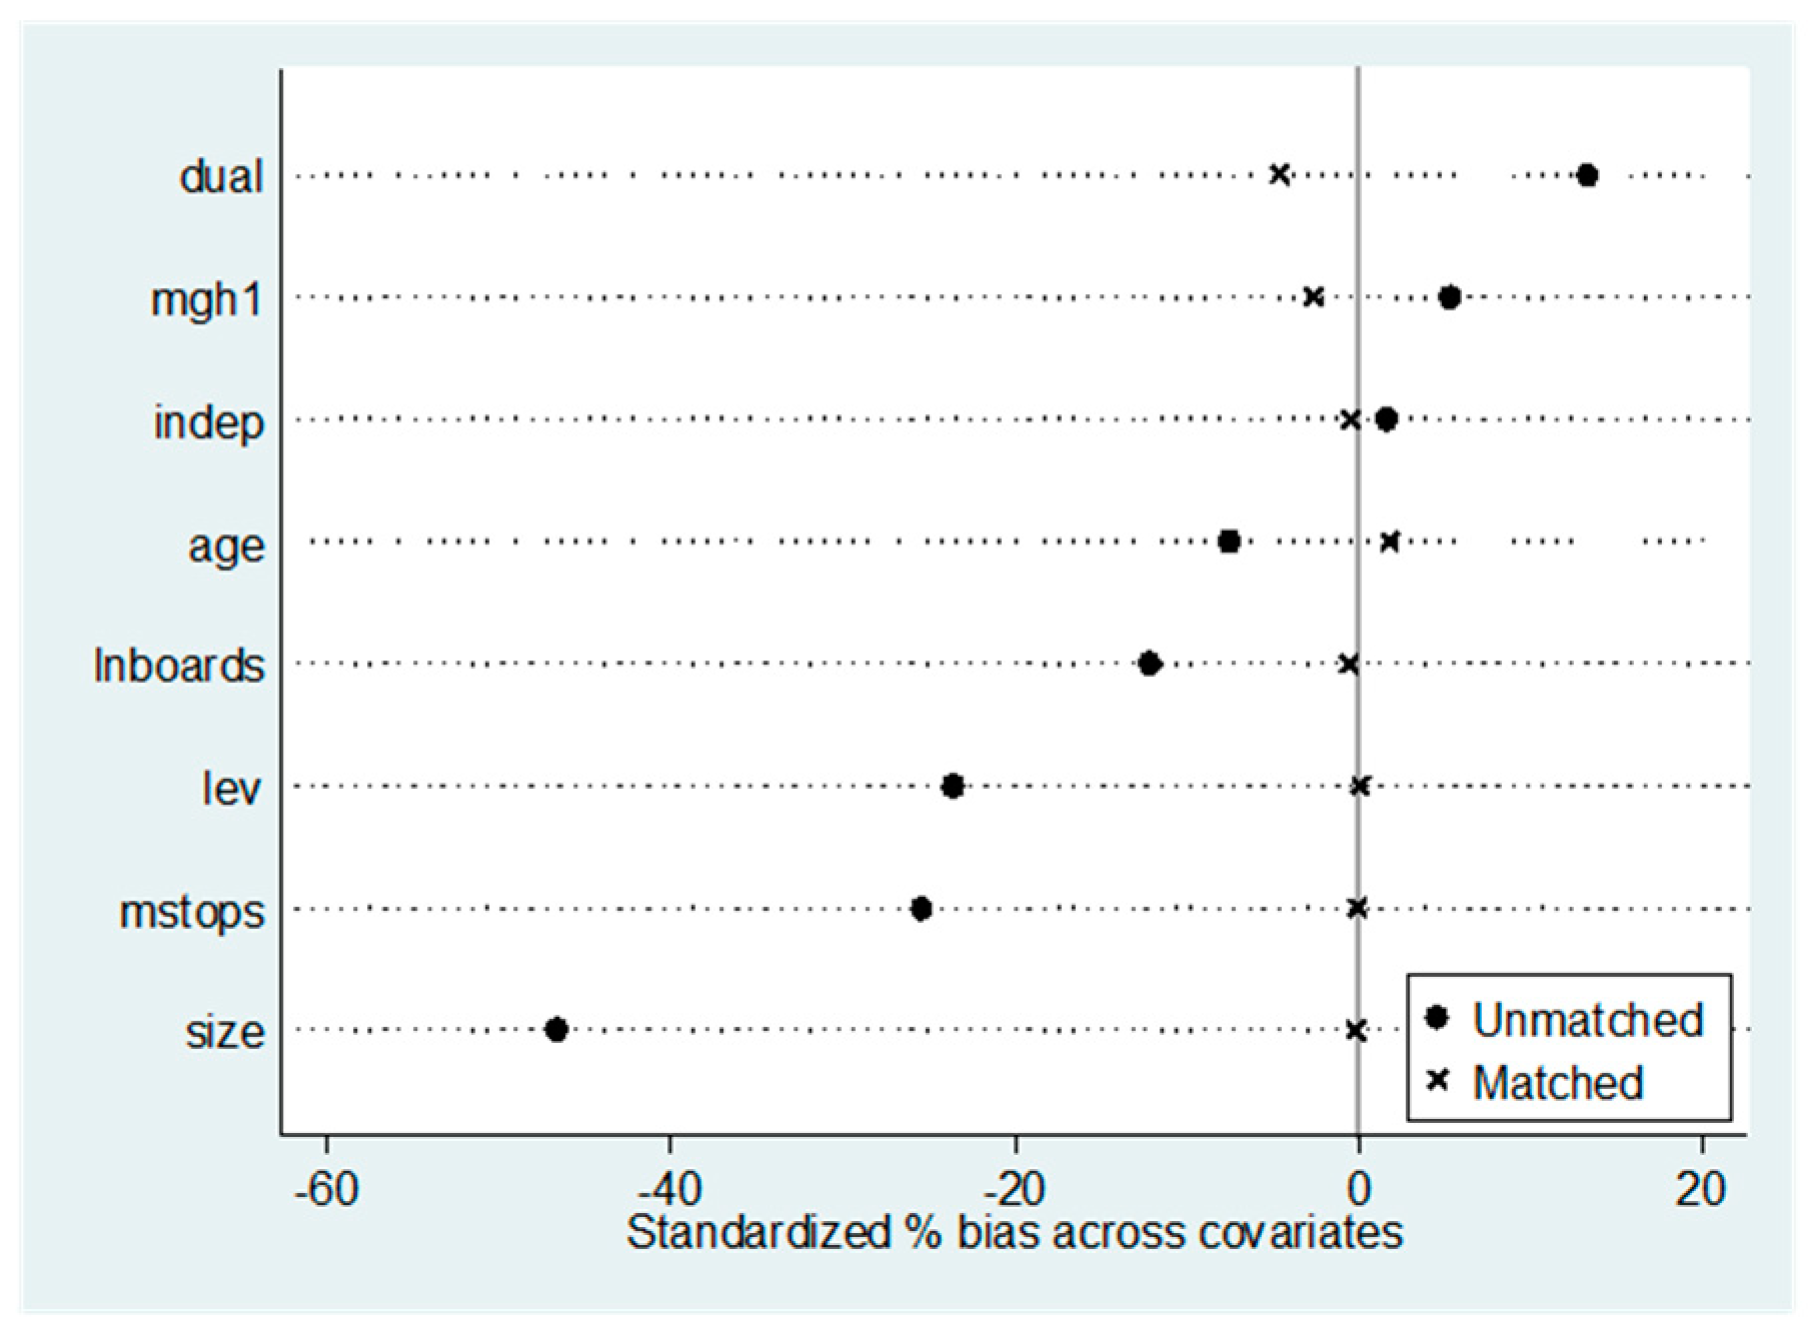
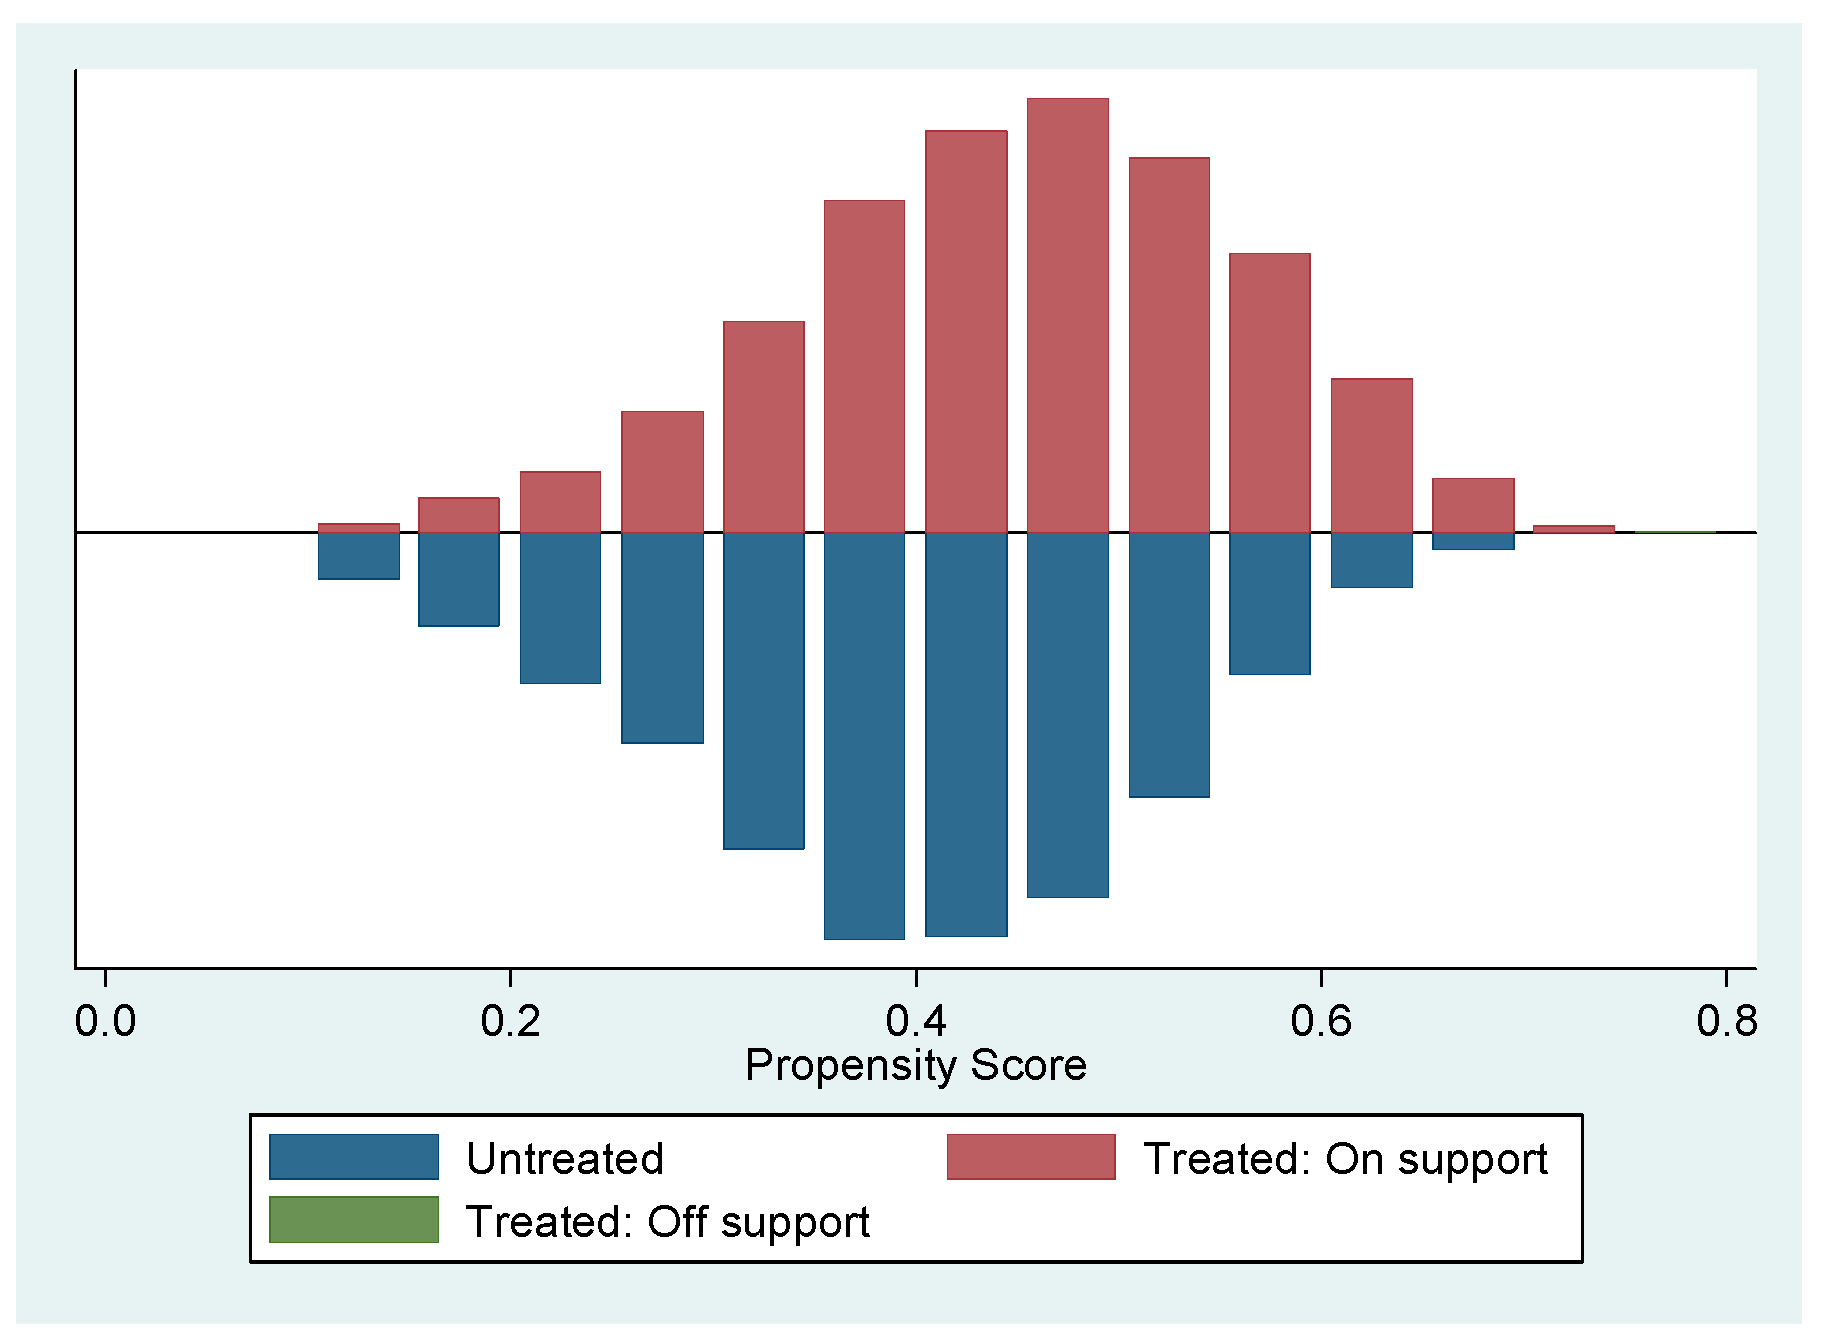
5.4. Robustness Check

First, the Herfindahl–Hirschman index was used to replace the supplier concentration variable, and the results are shown in panel A in Table 4. The empirical results found that supplier concentration and corporate risk taking (Risk1 and Risk2) still had a significant positive relationship at the 1% level, with regression coefficients of 0.025 and 0.045, indicating that supplier concentration can increase the level of corporate risk taking, and hypothesis 1 of this paper was verified again.
Second, considering that the sample selected in this paper was listed manufacturing companies but not all manufacturing companies disclose supplier concentration information, there may be sample selectivity bias. Drawing on the study by Xu [44], the Heckman two-step method was used to test whether the existence of selectivity bias affected the reliability of the empirical results, and the results are shown in panel B in Table 4. In the first stage, the mean value of the supplier concentration of firms within the same industry and year was used as the instrumental variable. The validity test of the instrumental variables shows that the Anderson LM statistic was 55.63, which rejected the null hypothesis that the model was unidentifiable at the 1% significance level. The Cragg–Donald Wald F statistic was 63.29, which rejected the null hypothesis of weak instrumental variables. Therefore, the inverse Mills coefficient (IMR) could be calculated by the instrumental variables selected in this paper. In the second stage, the inverse Mills coefficient (imr) was incorporated into the model to correct for sample selection bias, and the results of the test are shown in Table 4. The second-stage regression results show that the inverse Mills coefficient (imr) was 0.381, which was significant at the 1% level, indicating that the sample self-selection problem was better controlled. The regression coefficient for supply was 0.012 and was significantly positive at the 1% level, indicating that the higher the concentration of suppliers, the greater the corporate risk taking after correcting for the sample selection bias, which was consistent with the previous test of Hypothesis 1.
Finally, the PSM model was used to control for the effects of unobservable factors other than supplier concentration, and the results are shown in panel C in Table 4. The specific steps of PSM were as follows: The first step was sample grouping. Samples above the annual industry average of supplier concentration were the treated group, and samples below the industry annual average of supplier concentration were the control group. The second step calculated the propensity matching score. According to Size, Lev, Age, Board, Idep, and Mstop, 1:1 nearest neighbor matching was performed, and propensity scores were calculated using logit regression. The third step was the postmatching equilibrium test (as in Figure 2) and the common support test (as in Figure 3). The results in Figure 2 show that there was no significant difference in the covariates after matching between the two groups of samples, satisfying the balance test. The common range in Figure 3 was above 80%, indicating that the selected matching variables and matching methods were appropriate. In the fourth step, the impact of supplier concentration on enterprise risk taking was tested using three methods: 1:1 nearest neighbor matching, radius matching with a caliper of 0.001, and kernel matching. The results show that the corporate risk taking (Risk1) of the treatment group and the control group were significantly different at the 1% level for all three matching methods, and the mean value of risk taking of the treatment group was higher than the mean value of the control group, further supporting Hypothesis 1.

5.5. Enterprise Digital Transformation

The regression results are shown in Table 5. The regression results in columns (1) and (2) for samples that had not implemented digital transformation show that supplier concentration (Supply) was positively correlated with corporate risk taking (Risk1 and Risk2), but the results were statistically significant at the 10% level. The regression results in columns (3) and (4) for companies implementing digital transformation show that supplier concentration had a significant positive relationship with corporate risk taking at the 1% level, indicating that supplier concentration significantly increases corporate risk taking in companies implementing digital transformation. This finding suggests that the impact of supplier concentration on risk taking in listed manufacturing companies is moderated by the digital transformation of companies, i.e., hypothesis 2 of this paper is verified. This finding may be related to the fact that the implementation of digital transformation can enhance information transparency, improve the accuracy of corporate decision making, and enhance corporate business performance.

6. Conclusions

This paper used listed companies in China’s manufacturing industry from 2007 to 2020 to study the impact of supplier concentration on corporate risk taking. The study found that: first, there was a significant positive relationship between supplier concentration and corporate risk taking, that is, the higher the concentration of suppliers, the greater the corporate risk taking. Furthermore, the cooperation effect between suppliers and enterprises was confirmed. Second, the implementation of digital transformation had a moderating effect on the influence of suppliers on corporate risk taking, i.e., the concentration of suppliers of digitally transformed companies increased corporate risk taking, while this effect was not significant in companies that had not implemented digital transformation. This finding suggests that the implementation of digital transformation strengthens the cooperation between industrial organizations.
The contribution of this paper is reflected in the following points. First, existing studies have examined the impact of external environmental factors and internal factors on firm risk taking, while less attention has been paid to the effect of the supply chain. This paper explored the impact of supplier concentration on firm risk taking and complements the mechanism of interfirm relationships in the supply chain on risk taking. Second, this paper investigated and verified that digital transformation has a moderating effect and can enhance the level of risk taking of firms, providing an empirical basis for firms to promote digital transformation more. According to the findings of this study, it is suggested that enterprise managers should pay attention to the cultivation of affiliated suppliers and establish long-term and stable purchase and sales business relationships to reduce the uncertainty of enterprise purchase and sales business, which is conducive to enhancing the operational efficiency of enterprises and strengthening their risk-taking level. In addition, it is recommended that companies should pay attention to the implementation of digital transformation so that the digital transformation of enterprises can be implemented in the “transformation results”, which can help companies to increase information transparency and enhance the effectiveness of cooperation between companies in the supply chain.

Author Contributions

Y.Y.: conceptualization, methodology, software, data curation, formal analysis, visualization, and writing—original draft.; J.G.:writing—review and editing, supervision, and fundingacquisition. All authors have read and agreed to the published version of the manuscript.

Funding

This research was funded by the National Social Science Fund of China (Grant No. 20BJL128).

Data Availability Statement

The data sets used or analyzed in this study are publicly available and can also be accessible from the corresponding authors on demand.

Conflicts of Interest

The authors declare no conflict of interest.

Appendix A

Table A1. Variable definitions.
SymbolsVariable Definitions
Risk1Calculated from Equation (2)
Risk2Calculated from Equation (3)
SupplyTop five suppliers’ purchases as a proportion of total annual corporate purchases (%)
LevFinancial leverage, measured by the ratio of current liabilities to assets
SizeNatural logarithm of total assets
Agenatural logarithm of (current year − year the company was listed + 1)
DualA value of 1 is assigned when the positions of chairman and general manager are held by one person, otherwise a value of 0 is assigned.
BoardNatural logarithm of the total number of board members
IdepProportion of independent directors in the board members
MstopNatural logarithm of the total remuneration of the top three executives
yearAnnual dummy variables
indIndustry dummy variables

References

  1. Yu, M.G.; Li, W.G.; Pan, H.B. Managerial overconfidence and corporate risk-taking. Financ. Res. 2013, 1, 149–163. [Google Scholar]
  2. Zhou, J. Intelligent manufacturing—The main direction of “made in China 2025”. China Mech. Eng. 2015, 26, 2273–2284. [Google Scholar]
  3. Xu, X.M.; Quan, X.F.; Zhu, S.S. Supply chain concentration and firm innovation: An empirical study based on Chinese listed manufacturing firms. Bus. Econ. Manag. 2022, 42, 5–16. [Google Scholar]
  4. Li, Z.Q. Accounting governance of relationship based transactions-A paradigm exploration on the internationalization of accounting research in China. Financ. Res. 2017, 43, 4–27. [Google Scholar] [CrossRef]
  5. Li, Q.; Liu, L.G.; Shao, J.B. Digital transformation, supply chain integration and firm performance—The moderating effect of entrepreneurship. Econ. Manag. 2021, 10, 5–22. [Google Scholar] [CrossRef]
  6. Yi, L.X.; Wu, F.; Chang, X. Corporate digital transformation process and main business performance-empirical evidence from text identification of Chinese listed firms’ annual reports. Mod. Financ. Econ. 2021, 381, 24–38. [Google Scholar]
  7. Liu, Y.D.; Yu, J.; Wei, J. Digital innovation management: Theoretical framework and future research. Manag. World 2020, 36, 198–217. [Google Scholar]
  8. Hess, T.; Matt, C.; Benlian, A. Options for formulating a digital transformation strategy. MIS Q. Exec. 2016, 15, 123–139. [Google Scholar]
  9. Hilary, G.; Huik, W. Does religion matter in corporate decision making in America? J. Financ. Econ. 2009, 93, 455–473. [Google Scholar] [CrossRef]
  10. John, K.; Litov, L.; Yeung, B. Corporate Governance and Risk Taking. J. Financ. 2008, 63, 1679–1728. [Google Scholar] [CrossRef]
  11. Acharyav, V.; Amihud, Y.; Litov, L. Creditor Rights and Corporate Risk-taking. J. Financ. Econ. 2011, 102, 150–166. [Google Scholar]
  12. Mclean, R.D.; Zhao, M. The Business Cycle, Investor Sentiment, and Costly External Finance. J. Financ. 2014, 69, 1377–1409. [Google Scholar] [CrossRef]
  13. Wu, Q.P.; Ailing, L.X. Industrial policy support, enterprise life cycle and risk-taking. Bus. Econ. Manag. 2019, 1, 74–87. [Google Scholar]
  14. Dong, H.P.; Sun, Y. A study of monetary policy risk-taking channels for microlending data a perspective based on bank characteristics, borrowing firm characteristics and loan contract characteristics. Econ. Econ. 2020, 37, 151–162. [Google Scholar]
  15. Liu, Z.Y.; Wang, C.F.; Peng, T.; Guo, J. Policy uncertainty and firm risk-taking: Opportunity anticipation effect or loss aversion effect. Nankai Manag. Rev. 2017, 20, 15–27. [Google Scholar]
  16. Peng, T.; Huang, F.G.; Sun, L.X. Economic policy uncertainty and risk-taking: Evidence based on venture capital. J. Manag. Sci. 2021, 24, 98–114. [Google Scholar]
  17. Faccio, M.; Marchicam, T.; Mura, R. Large Shareholder Diversification and Corporate Risk-Taking. Rev. Financ. Stud. 2011, 24, 56–70. [Google Scholar] [CrossRef]
  18. Li, X.R.; Zhang, R.J. Equity incentives affect risk-taking: Agency costs or risk aversion? Account. Res. 2014, 1, 57–63. [Google Scholar]
  19. Zhu, X.L.; Fang, C.J. CEO power, executive team pay gap and corporate risk-taking. Econ. Econ. 2018, 35, 100–107. [Google Scholar]
  20. Li, R.; Cui, Y.; Zheng, Y. The Impact of Corporate Strategy on Enterprise Innovation Based on the Mediating Effect of Corporate Risk-Taking. Sustainability 2021, 13, 1023. [Google Scholar]
  21. Faccio, M.; Marchica, M.; Mura, R. CEO Gender, Corporate Risk-Taking, and the Efficiency of Capital Allocation. J. Corp. Financ. 2016, 39, 193–209. [Google Scholar] [CrossRef]
  22. Lv, L.X.; Wang, S.Q.; Li, X.Q. Executive team disruption and corporate risk-taking-the moderating role of the CEO-TMT power gap. Soft Sci. 2022, 5, 1–14. [Google Scholar]
  23. Huang, C.C.; Song, Y.F. An empirical study on the impact of supply chain concentration on the intensity of corporate R&D investment—The moderating role of the nature of property rights. Res. Dev. Manag. 2019, 31, 13–26. [Google Scholar] [CrossRef]
  24. Dan, D.; Judd, J.S.; Serfling, M. Customer concentration risk and the cost of equity capital. Soc. Sci. Electron. Publ. 2016, 61, 23–48. [Google Scholar]
  25. Lanier, D., Jr.; Wempe, W.F.; Zacharia, Z.G. Concentrated supply chain membership and financial performance: Chain and firm-level perspectives. J. Oper. Manag. 2010, 28, 1–16. [Google Scholar] [CrossRef]
  26. Hui, K.W.; Klasa, S.; Yeung, P.E. Corporate suppliers and customers and accounting conservatism. J. Account. Econ. 2012, 52, 115–135. [Google Scholar] [CrossRef]
  27. Pan, Y.; Pan, J.P.; Dai, Y.Y. Corporate litigation risk, judicial local protectionism and corporate innovation. Econ. Res. 2015, 3, 131–145. [Google Scholar]
  28. Fang, H.X.; Zhang, Y. Supplier/customer relationship-based transactions, surplus management and auditor decision making. Account. Res. 2016, 1, 79–86. [Google Scholar] [CrossRef]
  29. Raman, K.; Shahrur, H. Relationship-specific investments and earnings management: Evidence on corporate suppliers and customers. Account. Rev. 2008, 83, 1041–1081. [Google Scholar] [CrossRef]
  30. Zhao, X.Y.; Bao, Q. Institutional environment, relationship transactions and cash holding decisions. Audit Econ. Res. 2015, 30, 21–29. [Google Scholar]
  31. Ferreira, J.M.; Fernandes, C.I.; Ferreira, F.A. To be or not to be digital, that is the question: Firm innovation and performance. J. Bus. Res. 2019, 101, 583–590. [Google Scholar] [CrossRef]
  32. Zhao, C.Y.; Wang, W.C.; Li, X.S. How digital transformation affects total factor productivity of enterprises. Financ. Trade Econ. 2021, 42, 114–129. [Google Scholar]
  33. Liu, H.; Wang, P.; Li, Z. Is There Any Difference in the Impact of Digital Transformation on the Quantity and Efficiency of Enterprise Technological Innovation? Taking China’s Agricultural Listed Companies as an Example. Sustainability 2021, 13, 12972. [Google Scholar] [CrossRef]
  34. Hu, Q. Mechanism and performance of enterprise digital transformation. Zhejiang Acad. J. 2020, 3, 146–154. [Google Scholar]
  35. Yu, J.; Meng, Q.S.; Zhang, Y. Digital innovation: Exploration and enlightenment from new perspectives of innovation research. Stud. Sci. Sci. 2017, 35, 1103–1111. [Google Scholar]
  36. Jiang, Y.H.; Xing, M.Q. The degree of industry competition, supplier concentration and cash flow manipulation. Econ. Issues 2021, 5, 94–101. [Google Scholar]
  37. Kong, X. Why are social network transactions important? Evidence based on the concentration of key suppliers and customers in China. China J. Account. Res. 2011, 4, 121–133. [Google Scholar] [CrossRef]
  38. Yang, X.L.; Yang, L.G. Does accounting information transparency improve corporate risk-taking? Financ. Theory Pract. (Bimon.) 2021, 42, 82–88. [Google Scholar]
  39. Guo, H.; Han, J.P. The impact of open innovation on the growth of start-ups in the digital context: The mediating role of business model innovation. Manag. Rev. 2019, 31, 186–198. [Google Scholar]
  40. Zhi, J. Digital transformation of enterprises and enterprise value. Contemp. Financ. Stud. 2022, 5, 43–53. [Google Scholar]
  41. Qi, H.J.; Cao, X.Q.; Liu, Y.X. The impact of digital economy on corporate governance-based on the perspective of information asymmetry and managers’ irrational behavior. Reform 2020, 4, 50–64. [Google Scholar]
  42. Barnea, A.; Rubin, A. Corporate social responsibility as a conflict between shareholders. J. Bus. Ethics 2010, 97, 71–86. [Google Scholar] [CrossRef]
  43. He, F.; Liu, H.X. Assessment of the performance enhancement effect of digital change in real enterprises from the perspective of digital economy. Reform 2019, 4, 137–148. [Google Scholar]
  44. Xu, Z.H.; Wang, M.S. A study on the governance effect of digital transformation on excessive financialization of real enterprises. Secur. Mark. Her. 2022, 6, 2–14. [Google Scholar]
Figure 1. Annual distribution of sample size and percentage of digital transformation samples.
Sustainability 14 11664 g001
Figure 2. Equilibrium test.
Sustainability 14 11664 g002
Figure 3. Common range of values.
Sustainability 14 11664 g003
Table 1. Descriptive statistics analysis.
Panel ASample SizeMeanStd. Dev.MinP50Max
Risk117,1400.0610.0610.0040.0440.395
Risk217,1400.1150.1110.0070.0840.72
Supply17,1400.3440.1860.0660.3030.914
Lev17,1400.3930.2010.0480.3800.99
Age17,1402.8270.3461.6092.8903.466
Board17,1402.1140.1921.6092.1972.639
Idep17,1400.3750.0530.3130.3330.571
Mstop17,14014.310.73312.23914.30116.213
Size17,14021.8731.1519.55521.73225.306
Dual17,1400.0490.216001
Panel Bhigh supplier concentrationlow supplier concentrationT-test in means
nmeannmeanCoefficientT
Risk172170.06399230.0590.0039 ***4.22
Risk272170.11999230.1120.007 ***4.10
Panel Cdigital transformationNondigital transformationT-test in means
nMeannMeanCoefficientT
Risk199120.06272280.060.002 **2.21
Risk299120.11672280.1120.004 **2.33
Supply99120.32572280.372−0.047 ***−16.53
Note: Supplier concentration is grouped according to annual industry averages, with those above the annual industry averages being the high supplier group and those below the annual industry averages being the low supplier group. The t-statistics are reported. *** and ** indicate significance levels of 1%,and 5%, respectively.
Table 2. Correlation tests for the main variables.
Risk1Risk2SupplyLevAgeBoardIdepMstopSizeDual
Risk11.000
Risk20.998 ***1.000
Supply0.042 ***0.041 ***1.000
Lev0.0601 ***0.058 ***−0.096 *,**1.000
Age0.0149 **0.016 **−0.028 ***0.108 ***1.000
Board−0.027 ***−0.028 ***−0.058 ***0.129 ***0.0041.000
Idep0.0172 **0.018 **−0.007−0.0090.018 **−0.564 ***1.000
Mstop0.0269 ***0.029 ***−0.172 ***−0.017 **0.217 ***0.042 ***0.0091.000
Size−0.045 ***−0.045 ***−0.251 ***0.408 ***0.209 ***0.212 ***−0.0020.442 ***1.000
Dual0.0175 **0.0189 **0.0681 ***−0.1504 ***−0.1024 ***−0.0506 ***0.0251 ***0.0147−0.1532 ***1
Note: ***, **, and * indicate statistical significance at the 1%, 5%, and 10% levels, respectively.
Table 3. Regression results of supplier concentration and firm risk taking.
Full SampleHigh Supplier Concentration Low Supplier Concentration
Variables(1)(2)(3)(4)(5)(6)
Risk1Risk2Risk1Risk2Risk1Risk2
Supply0.013 ***
(4.47)
0.023 ***
(4.39)
0.018 ***
(3.10)
0.033 ***
(3.17)
0.002
(0.29)
0.003
(0.19)
Lev0.0345 ***
(9.63)
0.063 ***
(9.57)
0.046 ***
(8.45)
0.084 ***
(8.42)
0.024 ***
(5.06)
0.043 ***
(5.01)
Age−0.003 ***
(−2.23)
−0.006 **
(−2.14)
−0.004
(−1.51)
−0.007
(−1.53)
−0.004 *
(−1.88)
−0.006 *
(−1.74)
Board−0.002
(−0.71)
−0.005
(−0.79)
−0.001
(−0.17)
−0.001
(−0.10)
−0.005
(−1.35)
−0.010
(−1.41)
Idep0.007
(0.73)
0.014
(0.73)
0.023
(1.28)
0.043
(1.28)
−0.003
(−0.27)
−0.006
(−0.27)
Mstop0.003 ***
(4.00)
0.006 ***
(4.15)
0.003 **
(2.07)
0.005 **
(2.12)
0.003 ***
(3.25)
0.006 ***
(3.39)
Size−0.0047 ***
(−7.70)
−0.008 ***
(−7.71)
−0.006 ***
(−5.98)
−0.011 ***
(−6.00)
−0.004 ***
(−4.56)
−0.007 ***
(−4.60)
Dual0.005 **
(2.27)
0.009 **
(2.42)
0.008 ***
(2.58)
0.015 ***
(2.74)
0.001
(0.50)
0.003
(0.53)
_cons0.125 ***
(8.25)
0.230 ***
(8.25)
0.142 ***
(5.09)
0.246 ***
(5.14)
0.116 ***
(6.36)
0.212 ***
(6.35)
indYesyesYesYesyesyes
yearyesyesyesyesyesyes
N17140171407217721799239923
adj. R-sq0.0550.0560.0650.0650.0510.052
Note: The t-statistics are reported in parentheses under the estimated coefficients. ***, **, and * indicate significance levels of 1%, 5%, and 10%, respectively.
Table 4. Robustness checks.
Panel A: Substitution of independent variables
variableRisk1Risk2
CoefficientT-valueCoefficientT-value
Supply0.025 ***3.140.045 ***3.11
Controlsyes yes
_cons0.097 ***3.650.187 ***3.69
n11,95211,952
R-sq0.0760.076
Panel B: Heckman two-step method
Dependent variable: Risk1Stage 1Stage 2
CoefficientZ-valueCoefficientT-value
Supply−0.421 ***−2.580.012 ***4.19
imr 0.381 ***7.81
Controlsyesyesyesyes
_cons0.663 ***11.610.169 ***9.20
n17,14017,140
R-sq0.2380.073
Panel C: PSM test
MethodsTreated Group NControl Group NATTT-Value
nearest neighbor matching720243810.0042.872 ***
radius matching716398830.0033.312 ***
kernel matching720299060.478818.72 ***
Note: The t-statistics are reported. *** indicate significance levels of 1%,.
Table 5. Moderating effects of digital transformation.
VariableNondigital TransformationDigital Transformation
Risk1Risk2Risk1Risk2
(1)(2)(3)(4)
Supply0.007 *
(1.82)
0.014 *
(1.80)
0.0174 ***
(4.34)
0.032 ***
(4.25)
Lev0.035 ***
(6.75)
0.063 ***
(6.71)
0.033 ***
(6.17)
0.061 ***
(6.67)
Age−0.001
(−0.62)
−0.002
(−0.58)
−0.005 **
(−2.249)
−0.009 **
(−2.40)
Board−0.003
(−0.65)
−0.006
(−0.66)
−0.003
(−0.67)
−0.006
(−0.76)
Idep0.009
(0.57)
0.016
(0.53)
0.006
(0.45)
0.012
(0.49)
Mstop0.0001
(0.17)
0.001
(0.36)
0.006 ***
(5.20)
0.011 ***
(5.21)
Size−0.004 ***
(−4.70)
−0.008 ***
(−4.74)
−0.005 ***
(−5.96)
−0.009 ***
(−5.96)
Dual0.005 *
(1.80)
0.010 *
(1.89)
0.005
(1.52)
0.009
(1.64)
_cons0.152 ***
(6.55)
0.277 ***
(6.52)
0.096 ***
(4.40)
0.178 ***
(4.40)
N7228722899129912
adj. R-sq0.0610.0610.0580.059
Note: The t-statistics are reported in parentheses under the estimated coefficients. ***, **, and * indicate significance levels of 1%, 5%, and 10%, respectively.
Publisher’s Note: MDPI stays neutral with regard to jurisdictional claims in published maps and institutional affiliations.

