Article

Sustainability of Network Infrastructure in a Geospatial Resilience Context

by
Francisco Haces-Garcia
1,2,
Craig L. Glennie
1,2 and
Hanadi S. Rifai
2,*
1
National Center for Airborne Laser Mapping, University of Houston, Houston, TX 77204-5059, USA
2
Department of Civil and Environmental Engineering, University of Houston, Houston, TX 77204-4003, USA
*
Author to whom correspondence should be addressed.
Sustainability 2022, 14(18), 11415; https://doi.org/10.3390/su141811415
Submission received: 3 July 2022 / Revised: 4 September 2022 / Accepted: 7 September 2022 / Published: 12 September 2022
(This article belongs to the Topic Resilience of Interdependent Urban Systems)

Abstract

:
Increased societal reliance on critical infrastructures, such as the internet, has fueled resilience concerns. However, important geospatial differences complicate large-scale studies of critical infrastructure. This research develops a new geospatial framework to assess spatial disparities in critical internet infrastructure resilience. The framework is demonstrated using a testbed big data analysis for Texas assembled specifically for this study. Data on contributors to internet resilience—specifically, access flexibility, disruption risk, and disruption vulnerability—were incorporated for the study. An overall resilience score was calculated at the census tract level. Important geospatial patterns in network resilience emerged, with rural and urban areas in Texas showing stark differences. The developed techniques can be implemented to assess resilience geospatially, allowing for targeted efforts that ensure the survivability of critical infrastructure and assessments of digital divides.

Graphical Abstract

1. Introduction

Internet infrastructure provides equal access to education, essential services, and professional opportunities, affording users the potential to alleviate social or economic disparities. Moreover, important sectors of the economy and essential services rely on the internet for daily activities [1]. This has led the internet (and its corresponding network infrastructure) to be recognized as vital to several critical infrastructures [2,3]. However, increased reliance on the internet has exacerbated the effects of outages, making internet resilience a growing concern [4]. It is widely recognized that the internet is not sufficiently resilient [5]—especially during natural disasters and pandemics (such as the ongoing COVID-19 crisis), because of the additional strain that they put on infrastructure [6,7].
Resilience is not equal across different spatial scales, locations, and critical infrastructure systems (e.g., [8,9,10]). Differences in infrastructure conditions across regions hamper the comparison of resilience states. Some of a given infrastructure may be in excellent condition and use modern technologies, whereas other parts of the same infrastructure might be in poor condition with incompatible technology. This complicates the resilience assessment of large-scale critical infrastructure, including that of the internet, because the analysis has to consider these disparities. Unfortunately, such an assessment is a crucial step for stakeholders, especially to prioritize projects to confront infrastructural shortcomings across different locations (and, in the case of the internet, to mitigate digital divides). Beyond presenting a novel geospatial framework to assess the resilience of critical infrastructure and evaluate disparities, this study focuses on three key contributors—access flexibility, disruption risk, and disruption vulnerability—using a broad big data analysis approach. These resilience contributors are understudied for internet infrastructure, yet can have significant ramifications in terms of enhancing resilience. Beyond the lack of studies of each component, very few have assessed their geospatial interdependencies within the scope of critical infrastructure resilience—an issue that deserves further consideration. Moreover, the three contributors are crucially important to the resilience of internet infrastructure from the community-served perspective, as shown by this research, warranting their further study.
Resilience refers to a system’s ability to withstand disruptive events and recover quickly from an error state [11]. With regard to the internet as a vital component of critical infrastructure, resilience refers to maintaining communications (i.e., internet access) despite a network disruption event, and restoring them quickly in case of an outage. The different factors that contribute to resilience have been identified in the literature, and have been used to assess resilience by several researchers [4,7,11,12,13,14,15]. Some of the most widely accepted contributors to the resilience of systems such as the internet include system flexibility, failure risk, failure vulnerability, failure detection, failure response, and risk minimization [5,11,15,16]. In the context of internet resilience, previous studies have addressed network survivability. Network survivability studies the restoration of communications following a disruption, encompassing failure detection and response [17,18] and risk minimization [12,19,20,21,22]. However, little research has been conducted on network access flexibility, failure risk, and failure vulnerability. The present study begins to address this gap using quantitative definitions and the significance of each of the resilience contributors.
Internet access flexibility refers to the availability and accessibility of internet services at a given location, and is an important component of internet resilience. Availability is the level to which service is provided at a location, while accessibility refers to whether the corresponding population can use the service. Access flexibility can be a crucial factor in disruption scenarios whereby the only (or one of the few) access pathway for people experiences an outage; this can be jointly hampered by a high disruption risk and vulnerability. Elena-Bucea et al. [23] have shown important differences in quality of access based on education level, socioeconomic status, geography, and other factors. Failure risk (or risk of internet disruption) refers to the propensity of the internet service to be disrupted. To assess such a risk, which can significantly impact resilience, the concept of sudden-onset disasters [24] has been used in previous work. Sudden-onset disasters (SODs) have the capability of disrupting network activities, and include natural disasters and anthropogenic activities [25]. Natural disasters, in particular, can cause frequent and prolonged critical infrastructure outages. Network disruption risks can also be aggravated due to underlying technological limitations. Some examples of this include weather-dependent satellite-based services (or free-space optics) and the general interdependency with electric grids [26,27]. Vulnerability to internet disruption (or failure vulnerability) is best described as the factors exacerbating the harm caused by a service outage. It contrasts with disruption risk by studying the potential impacts of an outage, rather than its likelihood. In locations that rely on the internet for essential services and the subsistence of their local economies, the effects of prolonged outages can present with deleterious conditions and hamper economic growth. Such dependencies cause certain locations to be more vulnerable than others, making the vulnerability to service disruption an important contributor to study in a geospatial resilience context. The relationships between the resilience contributors underscore the necessity of incorporating them into a broad geospatial framework. For example, within a critical infrastructure resilience context, it is crucial to identify locations that are heavily dependent on infrastructure (i.e., high disruption vulnerability) while having a large amount of disruption events (i.e., high disruption risk) and few alternatives (i.e., low access flexibility).
There are significant challenges in assessing internet resilience [5]. Some of these are related to the inherent difficulties of resilience analyses in general, such as the lack of standardized assessment methodologies [11]. However, there are important added complexities for internet resilience. One of these is the variety of available network types, as technologies used within network infrastructure can vary significantly with geography. This can have significant impacts on the resilience of a network, as each technology is vulnerable to different external factors. Moreover, the direct competition for service populations results in a general disincentive for cooperation towards network resilience across different ISPs (internet service providers) and networks [1]. The nontrivial nature of detecting and reporting network outages, in addition to variable delivery technologies, contributes to the lack of availability of datasets describing network outages.
The rapid growth of network utilization, along with our increased reliance on critical infrastructures as a whole, makes it important to study geospatial disparities in resilience. The present study develops a new framework for such an analysis, and demonstrates the developed approach using the internet infrastructure in Texas as a testbed. Texas, despite being one of the most populated US states, has wide variation in population density, and is vulnerable to natural disasters. This makes Texas an ideal model study location to demonstrate the rigor of the framework developed in this research. Within the developed framework, internet access flexibility is addressed through the study of service availability and accessibility. The risk of internet disruption is addressed through the relative risk of sudden-onset disasters. Vulnerability to internet disruption is addressed by studying a subset of vulnerabilities based on the geospatial distributions of three regional user sectors: advanced industries, educational institutions, and telemedicine. These three sectors were carefully selected because of their far-reaching societal impacts when disrupted, and serve as a representative surrogate for overall vulnerability to internet outages in a region. While it is recognized that there may be other specific local vulnerabilities to internet disruption, studying these is beyond the scope of this demonstration of the proposed geospatial framework. The developed geospatial modeling framework presented in this study is novel; transferable and translatable to other regions, network topologies, and critical infrastructures; and readily expandable to incorporate additional vulnerabilities not specifically addressed in this paper.

2. Materials and Methods

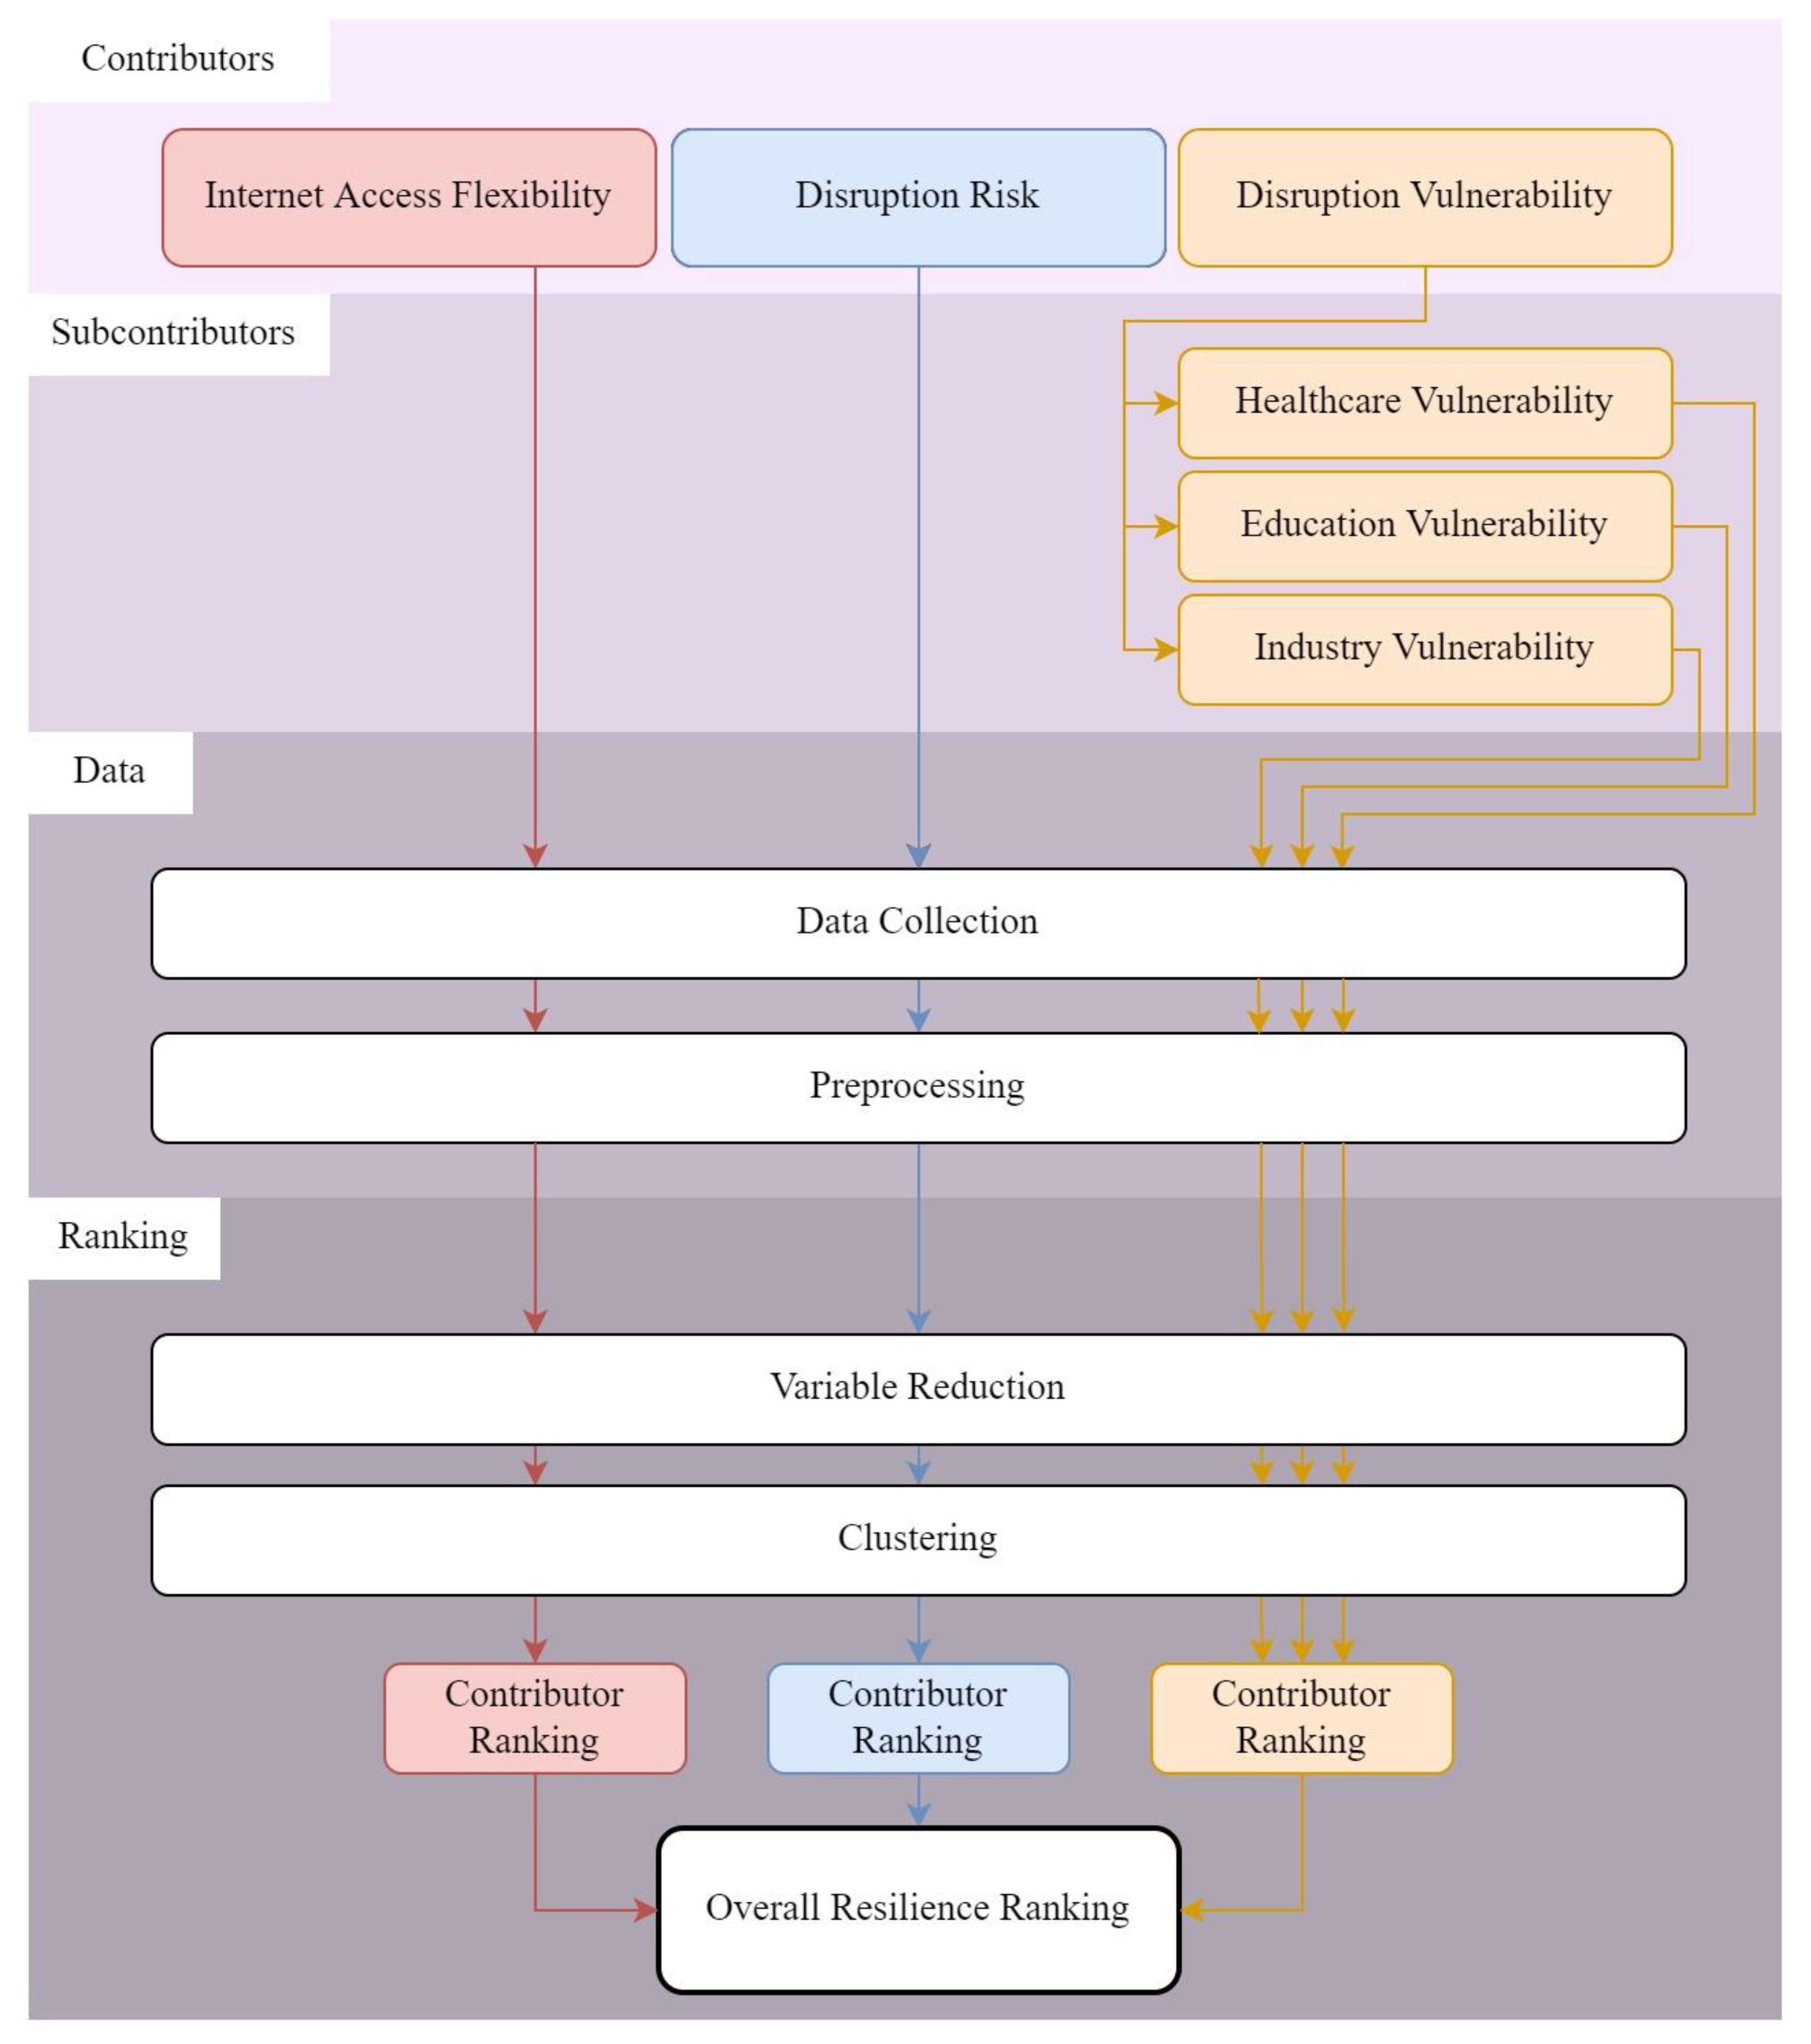
The developed framework is summarized in Figure 1. First, the contributors and sub-contributors to the resilience of the critical infrastructure are identified—in this case, internet access flexibility, risk of service disruption, and vulnerability to service disruption. These three contributors, as mentioned previously, have been understudied but, as shown later in this manuscript, are critical aspects that can guide decision-making towards enhanced resilience of critical infrastructure. Sub-contributors—factors that fall within a contributor to resilience, but are not related to one another—are discussed in more detail in the Supplementary Information (SI) (Sections S1.1–S1.3). Contributors to resilience are not reliably described by a few data points; therefore, the developed framework is designed to incorporate vast swaths of data through variable reduction. The reduced variables are then clustered to determine locations that behave similarly. Lastly, the attributes for each cluster are analyzed to provide individual rankings for each resilience contributor, and these rankings are then used to assign an overall resilience score, as discussed in more detail below. The methods constituting this framework are new within a critical infrastructure context, but have been commonly implemented in geospatial big data analyses (e.g., [28,29,30]).

2.1. Study Region

Texas is the second largest (by area), second most productive (by gross domestic product (GDP)), and second most populated state in the US. Five of the fifteen most populated cities in the US are in Texas—the most of any state [31]. This, however, should not mask the variation in population density in Texas as a consideration within a resilience context. The state is home to 3 of the 10 least populated counties in the United States [32], being the only state to have a city in the top 15 and a county in the bottom 10. The combination of large populations in unevenly distributed areas makes Texas a challenging state in which to provide resilient internet services. The heterogeneous nature of population distribution in Texas is further exacerbated by its weather patterns and its location along the Gulf of Mexico, which make Texas susceptible to natural disasters.
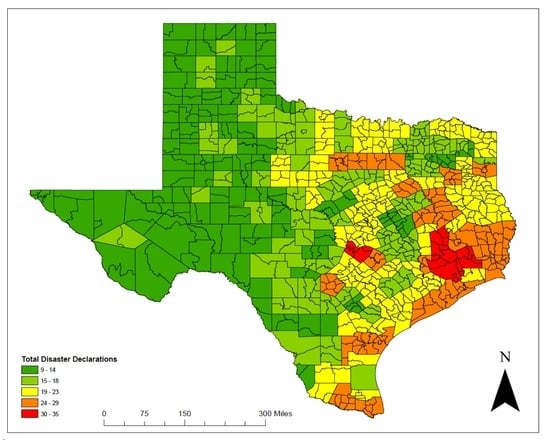
Between 1980 and 2019, Texas experienced both the highest amount of billion-dollar climate disasters and the highest cumulative damage by natural disasters in any state [33]. Because of the combination of these factors, which are crucial to network resilience, the network infrastructure of Texas was selected as a case study for implementing the geospatial modeling framework developed herein. A map of Texas illustrating population density is shown in Figure 2; as shown in the figure, much of West Texas and the panhandle have relatively low densities, whereas its coastal and near-coastal zones (in East and Central Texas) and its border valley region (in South Texas) exhibit much higher population densities, including its largest cities of Houston, Dallas, Austin, and San Antonio.

2.2. Data Collection

Since resilience contributors cannot be reliably interpreted by a few data points, diverse datasets were developed to analyze geospatial disparities in internet access, disruption risk, and disruption vulnerability. To assess internet access flexibility, datasets on ISPs (internet service providers) and cellular offerings were collected, along with governmental datasets on availability and accessibility complaints (a full description is available in Supplementary Material SI Section S1.1). As a measure of disruption risk, data on natural disasters and storm events (which have been identified as a significant portion of sudden-onset disasters (SODs)) were sought [24]. A full description of these datasets is available in SI Section S1.2. To study disruption vulnerability, data sources for local dependency on the internet were investigated. As mentioned previously, three sectors of the economy with significant dependence on the internet for day-to-day activities were identified and chosen for detailed study: telemedicine, education, and advanced industries; data for these sectors were gathered. Detailed descriptions of the data on each of these sectors are available in SI Section S1.3 Table S1 contains a complete listing of all of the datasets used in this study, and Table S7 provides a listing of the economic sectors implemented for the advanced industries sub-contributor.
Past studies have found it beneficial to study lower-level data aggregations to ensure that important geospatial disparities are not overlooked [34]. As such, data sources with high spatial resolution were sought, and efforts were made to keep their resolution as high as possible during the analysis. Because of the quality of the data sources, the internet access analysis was performed at the census tract level, while the disruption risk and disruption vulnerability analyses were performed at the county level. The possibility of interdependency with other critical infrastructures that may affect the assessment of disruption vulnerability is acknowledged; however, due to data limitations, this aspect was not incorporated in the study at this time.

2.3. Data Preprocessing

The first challenge in incorporating all datasets into a geospatial framework involved the different levels of aggregation of the data (i.e., at the county, ZIP code, or census tract levels). The 2010 ZIP Code Tabulation Areas (ZCTAs) from the Census Bureau were used to match ZIP code data with census tracts and counties. There are 5265 census tracts, 1782 ZCTAs, and 254 counties in Texas. Census tracts are always completely within a county; however, it is possible for a ZCTA to span multiple tracts and counties. To downscale internet access data, each census tract was assigned the most conservative value of overlapping ZIP-code-based data, along with the value for the county in which it is located. The data used for the remaining analyses did not need to be downscaled. It should be noted that all applicable county-based data were normalized by population, except in the cases of ratios (EG, percent medically underserved area) or unitless coefficients, such as location coefficients for labor data.

2.4. Data Analysis and Resilience Ranking

The contributors and sub-contributors to resilience are not reliably described by a few data attributes; thus, large amounts of data were collected for each location, as described in prior sections. However, such large datasets are challenging to analyze geospatially. Ideally, stakeholders should be able to glean actionable information by optimizing the observability of spatial differences within the datasets. Data-driven methods can be used to this end once the data have been preprocessed (as described in Section 2.3). Specifically, the methods within the proposed geospatial framework include performing dimensional reduction on the datasets for each resilience contributor, clustering for all of the locations in the study domain, and ranking the clusters based on their attributes. This procedure enables the simple differentiation between different clusters through attribute analysis.
Dimensional reduction (DR) is a technique that can be used to simplify a dataset with a large number of covariates. Since the datasets compiled for each contributor and sub-contributor contained multiple related attributes, DR was performed through an exploratory factor analysis (EFA) [35,36]. EFA identifies underlying variables to the input dataset, which can then be used to summarize the overall data structure. These underlying variables are linear combinations of the input variables, weighted to group certain input variables into each underlying variable. However, because each underlying variable accounts for different amounts of variance within the dataset, not all of the underlying variables identified by EFA may be significant to analyze. To assess which variables are significant to retain in each case, Horn’s parallel analysis (HPA) was conducted for each EFA [37]. The implemented version of HPA compares the eigenvalues from the input data covariance matrix to those generated from uncorrelated normal variables resampled 100 times. As is customary in the literature, the 95th percentile eigenvalue was used as a cutoff for significance [31]. Code originally developed by Cai (2016) [38], based on the HPA implementation by Ledesma and Valero-Mora (2007) [39], was adapted for the HPA. Although these coupled processes drastically reduce the amount of data to analyze, they do not indicate which locations may share similar behavior across our study area, nor do they provide a clear path to an actionable resilience ranking from the input data. To this end, a data-driven clustering technique was implemented at this stage.
Clustering is a useful tool to group similarly behaving data objects in a dataset. Since the underlying variables in our datasets had been identified, the values for those underlying variables for each location were obtained by evaluating the corresponding linear combination, given the weights resulting from the EFA. These scores could then be put through a clustering algorithm to group similarly performing locations together. In this research, k-means clustering analyses were performed for the underlying variable values, with a maximum iteration value of 1000, and 5 clustering repetitions for new initial cluster positions. In some cases, outlier locations were identified; these are certain locations that were different from the rest of the data and, thus, could not be grouped.
The data characteristics for each cluster were examined to identify data differences in both the underlying and input variables of each dataset. Since the amount of data was greatly reduced, and similarly performing locations were grouped together, analyzing the cluster and outlier characteristics revealed a clear distinction in data parameters. This enabled the ranking of cluster conditions for each resilience contributor. Clusters were ranked from best to worst conditions. The lowest ranking among the three resilience contributors was assigned as the overall resilience score, and defined as the limiting factor for the resilience ranking of that census tract. While various other weighting schemes could be used to calculate a resilience score, the lowest score was used in this study to highlight the resilience shortcomings of the study area.

3. Results

3.1. Internet Access Clustering Results

Figure S1 in the SI shows the clustering outputs prior to the ranking of internet access, while Table S2 shows a summary of notable attributes for each cluster. These results showed a clear division between urban and rural census tracts. Census tracts in large cities were grouped into clusters 1 and 3, while census tracts in medium-sized cities were placed in cluster 2. Some outliers were identified; these were census tracts with particularly high accessibility (i.e., high percent access) but lower availability than classes 1, 2, or 3 (i.e., lower number of ISPs). The outliers were generally located in the outskirts of cities, and were thus labeled “Urban Outliers”. Finally, clusters 4 and 5 generally showed rural census tracts, with cluster 4 being more reliant on satellite-based services. These clusters were ranked, with the urban clusters being at a distinct advantage relative to rural clusters, and the urban outliers being between the two, as shown in Figure 3. Interestingly, large parts of Texas in the coastal southern border region and in West Texas were among the worst-ranking parts of Texas (darker green shades) in terms of internet access.

3.2. Disruption Risk Clustering Results

The clusters for disruption risk are shown in Figure S2, and summary attributes are shown in Table S3. The outliers shown tend to have higher amounts of damage for certain disaster types; these are likely counties that are commonly affected by a single type of event (e.g. counties that flood routinely) or an extreme event. Cluster 5 showed counties with high damage overall (albeit not as high as the identified outliers), as well as the highest amount of disaster declarations due to hurricanes of any of the clusters. Clusters 2 and 3 grouped counties with moderate damages, with the former having the majority of the damages caused to crops, while the latter had the majority of damages caused to property. Clusters 1 and 4 showed counties with low damages, with cluster 1 having higher damages than cluster 4 overall. The ranking for all counties is shown in Figure 4.

3.3. Disruption Vulnerability Clustering Results

Three separate EFAs were performed to assess disruption vulnerability. The resulting clusters for vulnerability to labor disruption are shown in Figure S3 and summarized in Table S4. The identified outliers in this clustering analysis showed the highest wage, median employer location quotient (M-ELQ), and maximum employer location quotient (Max-ELQ) of any of the clusters, suggesting that these would be the most significantly disrupted locations in the event of an internet outage. Clusters 2 and 5 showed high wage averages, with moderate M-ELQs and high Max-ELQs, suggesting that certain advanced industries would be disrupted in case of outages. Clusters 1, 3, and 4 showed low average wages, with moderate M-ELQs and lower Max-ELQs, signifying a lesser disruption in the event of internet outage. The ranked clusters are shown in Figure 5a.
In the case of the clustering results for vulnerability to education disruption (as shown in Figure S4, with summary attributes in Table S5), the outliers showed the highest school credit hours (SCHs, or university-level school credits) per capita and the highest primary and secondary (K–12) enrolment of any of the clusters, signifying a significant disruption to education in the event of internet outage. Cluster 4 classified counties with high K–12 enrolment but relatively low SCH per capita, signifying a lack of universities in these counties. Cluster 5 classified the inverse situation, with high SCH per capita but low K–12 enrolment. Cluster 1 showed counties with moderate SCH per capita and K–12 enrolment. Cluster 3 showed counties with low SCH per capita and moderate K–12 enrolment, while Cluster 2 grouped low-enrolment locations overall. The ranked clustering results are shown in Figure 5b.
The healthcare clustering results in Figure S5 and Table S6 parallel those shown for internet access, as rural and urban locations tend to be clustered separately, with urban counties usually having a higher resilience ranking than rural counties. No outliers were identified for these data; however, a large number of counties were identified in cluster 2, with high shortages of healthcare personnel and low amounts of hospital beds per capita. The counties classified in cluster 2 were (generally) rural counties with low healthcare infrastructure. This indicates a potential for greater reliance on telemedicine. The literature has consistently found that telemedicine enhances healthcare in rural areas [40], and some studies have examined the pervasive effects of digital divides on telemedicine [41,42]. Cluster 1 was similar to cluster 2, with low amounts of total beds per capita but fewer critical mental and dental health personnel shortages. Cluster 3 grouped counties with staffing shortages but high amounts of hospital beds, while cluster 4 marked the opposite (i.e., a moderate number of hospital beds with few staffing shortages). Cluster 4 classified counties with moderate hospital beds and shortage numbers. The ranked clusters are shown in Figure 5c.
The resulting average vulnerability classification is shown in Figure 6. Although some outliers are shown, no clear distinction between urban and rural counties could be discerned, indicating that the diverse kinds of identified vulnerabilities affect both densely and sparsely populated areas. Importantly, the first, second, and third quartiles for the overall vulnerability were 3.33, 3.33, and 4.00, respectively. This shows a narrow distribution with a low median, which could indicate that relatively few counties have more than one kind of vulnerability.

3.4. Overall Resilience Rankings

The results for overall resilience classification are shown in Figure 7. For this classification, the worst cluster ranking between internet access, disruption risk, and disruption vulnerability is assigned to a given census tract, with each census tract using its county value for the applicable EFAs (i.e., disruption risk and disruption vulnerability). Generally, rural census tracts had worse rankings than urban tracts (see Discussion). No census tract had an overall resilience classification lower than 4, signifying that no one census tract is well-ranked in all three resilience contributors.

4. Discussion

The overall rankings shown in Figure 7 display important trends for internet resilience. Generally, rural census tracts had lower resilience rankings than urban census tracts. This means that in prioritization efforts, a consideration of the causes of lower resilience between urban and rural settings would need to be undertaken. Practically speaking, isolating the specific causes of the lower resilience rankings in different regions can lead to informed decisions regarding corrective measures. This can be more clearly appreciated in Figure 8, which shows the distribution of the rankings for urban and rural clusters (with urban clusters being defined as those with a population density greater than 500 people per square kilometer). Rural tracts generally had a lower cluster mean than urban tracts (p < 0.01, nrural = 1984, nurban = 3269), indicating that rural areas generally have a lower resilience ranking than urban areas. Internet access was the driving contributor for the overall resilience rankings in 83.2% of rural tracts, with another 15.2% of rural tracts being limited by their disruption vulnerability. In contrast, disruption vulnerability was the limiting factor in 59.4% of urban areas, with internet access limiting 40.3% of urban tracts. Across both rural and urban tracts, disruption risk limited the resilience ranking of fewer than 2% of cases. This shows that a large majority of rural census tracts, and a portion of urban census tracts, are limited by their internet availability and accessibility, linking the improvement of infrastructure and access to potential benefits in resilience.
Important insights into the state of network resilience in Texas can be gleaned from the results of this study, and can be used to guide the improvement of vulnerabilities in the future. In the case of internet access, distinctions were made between availability and accessibility, with the Houston area being separated from other large cities (i.e., Dallas and San Antonio) due to lower accessibility rates. This shows that service accessibility is an important factor to consider in network resilience analyses, exemplifying the effects of pervasive digital divides (which are discussed in SI Section S2.0), and showing the necessity of targeted efforts to make reliable internet services more accessible. While the main distinguishing factor among urban clusters was service accessibility, rural areas were generally separated by the availability of non-satellite services. This brings into focus the important relationship between Figure 2, Figure 3 and Figure 7. Figure 3 (the results from the internet access EFA) generally shows South and West Texas with lower internet access rankings. This lowers their overall resilience classification (shown in Figure 7). However, as can be observed in Figure 2, there are higher population densities in South Texas than in West Texas. This could indicate that infrastructure investment focused in South Texas would improve the quality of access to wider populations—an observation that could not be drawn without the geospatial component of this resilience analysis.
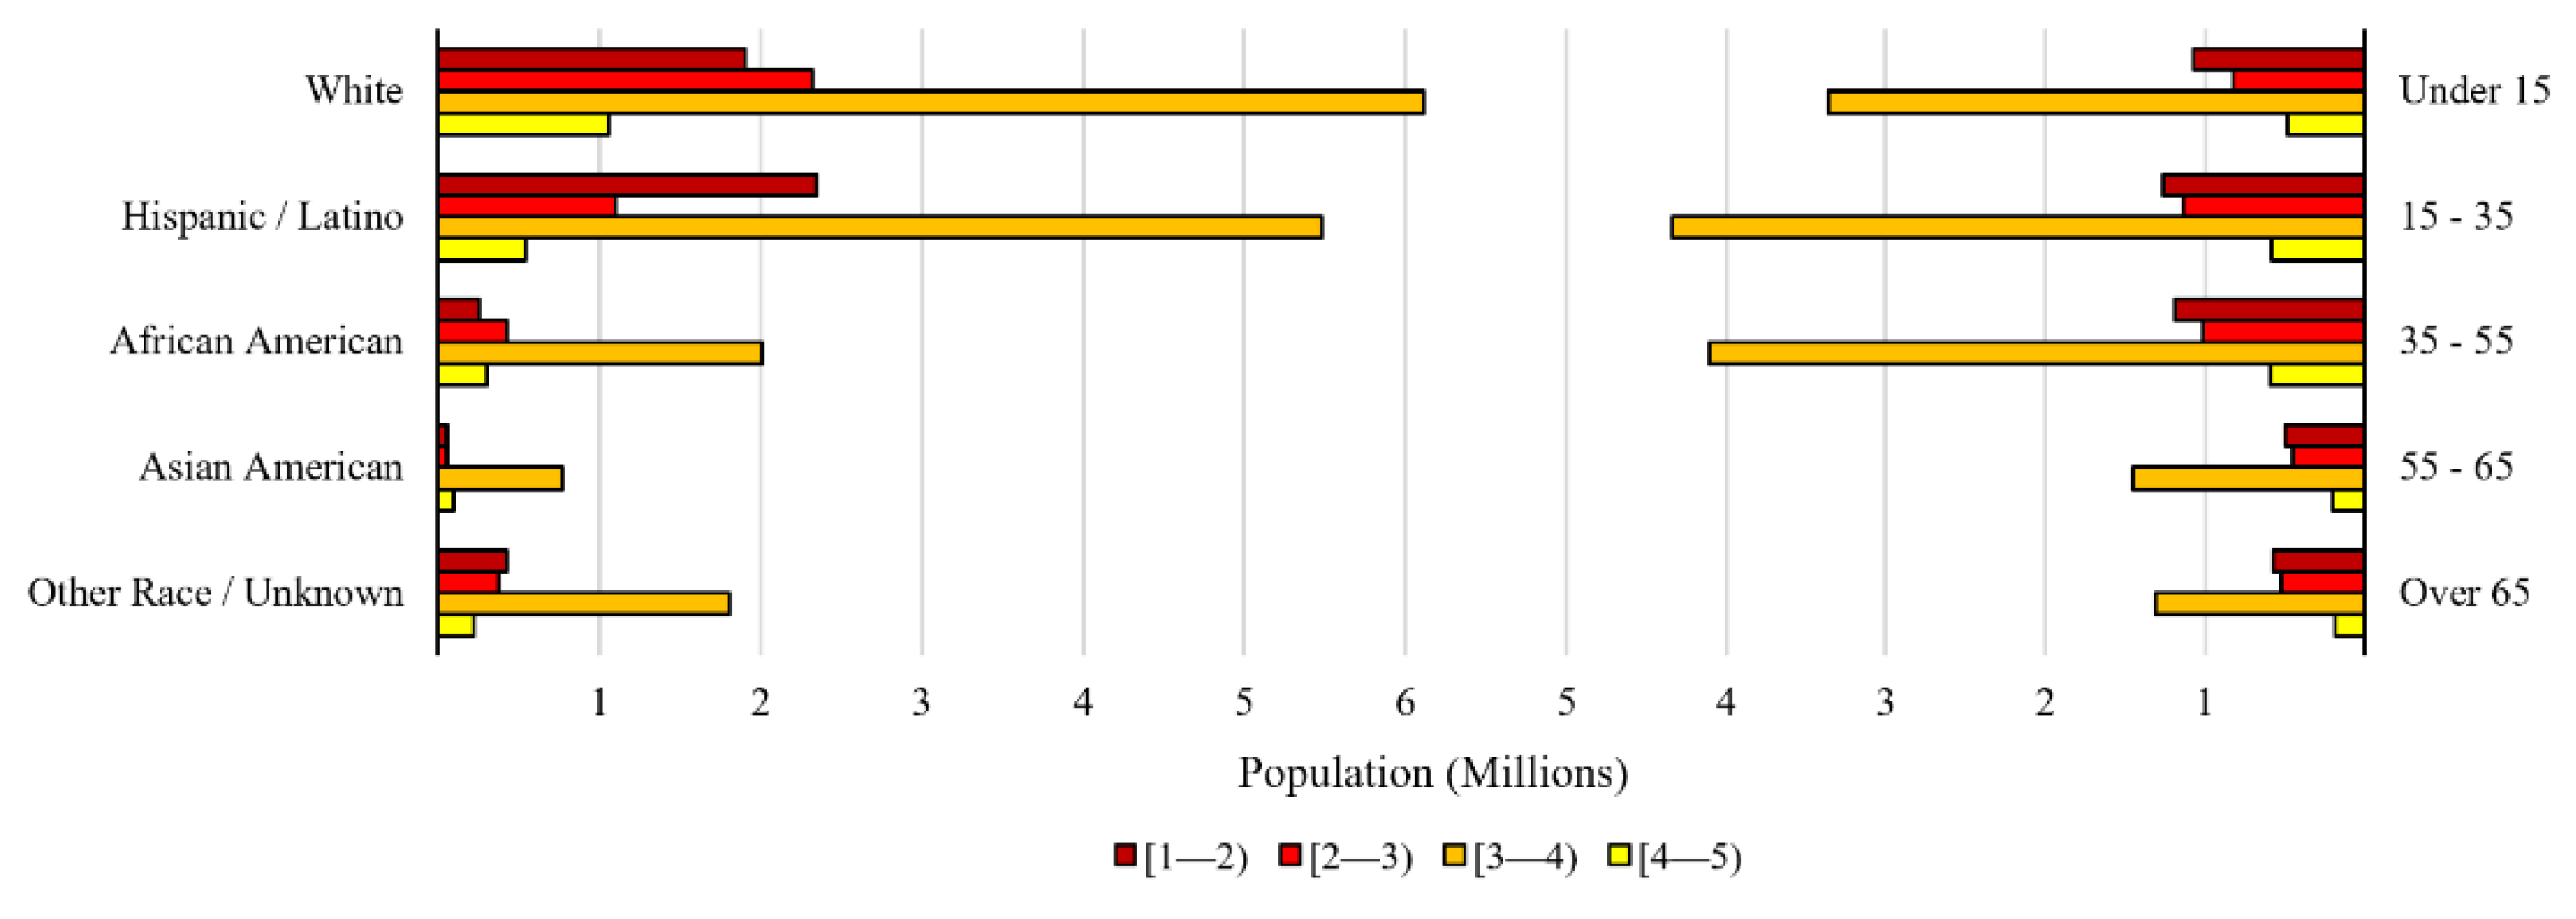
A demographic study of the internet resilience rankings also presents important insights. Figure 9 shows the age and race distribution for the different rankings. The Hispanic/Latino population in the first (worst) rank is over twice that in the second—a trend that is not repeated across any other race or age group. This can be attributed to the large Hispanic/Latino populations in South Texas—a region that generally has low resilience rankings, as discussed in the previous paragraphs. Across all ages and races, over 50% of the population resides in locations ranked between 3 and 4—an indication that large populations live in moderately ranked areas. However, 18.2% of the population (of which 47.0% is Hispanic and 38% is white) lives in clusters ranked between 1 and 2, showing that an important portion of the population has low network resilience, and could benefit from targeted improvements to network conditions.
The DR in this study was performed by EFA; however, a number of alternatives exist for variable reduction—for example, principal component analysis (PCA). EFA requires a number of explanatory factors to be defined prior to analysis, while PCA outputs a number of principal components equal to the number of variables in the input dataset. In both cases, however, the number of variables (or principal components) to be retained is ultimately user-defined. In this study, HPA was used to determine the number of explanatory variables to retain. Beyond variable-reduction algorithms, machine learning and other novel data science developments could be implemented for the DR in similar analyses, and represent areas for future development.
The different spatial aggregations of underlying data are an important consideration for any geospatial analysis. In this case, the access flexibility contributor had data available at the census tract level, while the disruption risk and disruption vulnerability analyses were performed at the county levels. Data availability often determines the analysis resolution (as was the case in this study); however, the impacts of using different spatial aggregations in analysis should be recognized. Beyond preventing a detailed output for all resilience contributors, incorporating various spatial aggregations may exaggerate (or diminish) the observed resilience trends. Several strategies to mitigate these effects are available within the proposed framework; data within a contributor could be aggregated at the same level, data could be normalized by area or population, or contributors with lower data qualities could be assigned lower weights when combining the analysis results into an overall resilience ranking.
The methods introduced in this study assimilate large amounts of data into a comprehensive geospatial resilience analysis framework. The demonstration of the framework presented herein provides decision-makers with critical insights into the state of network resilience in Texas, underscoring the significance of the proposed framework to critical infrastructure analysis. This framework is easily transferrable to other locations, critical infrastructures, and resilience contributors. This presents a key novelty and usefulness over other geospatial frameworks in the literature, which are generally designed for specific critical infrastructure systems (such as electric [43] or water [44] infrastructure) or specific resilience contributors (such as vulnerability to climate change [45]), limiting the scope of their analysis.
To further optimize the development of geospatial resilience analyses, several of the sub-processes presented in this study could be automated. The resilience of infrastructures changes with new population patterns, unforeseen risks, and changing vulnerabilities. As such, a system capable of automatically assimilating new geospatial data from distributed sources into an up-to-date comprehensive resilience analysis would be beneficial to stakeholders, as well as to society as a whole. This research provides a comprehensive geospatial framework that can be used to assess the resilience of critical infrastructure, and is distinct from prior work in the field in that the study considers geospatial resilience in the context of specific uses of the infrastructure and the sociodemographic characteristics of the user community.

5. Conclusions

This study presents a novel geospatial assessment technique for the resilience of network infrastructure. The spatial distributions of three understudied contributors to the resilience of network infrastructures were analyzed and incorporated into a broad resilience assessment. Important insights into the disparities in internet access, disruption risk, and disruption vulnerability in Texas were obtained. In particular, differences in internet access across urban and rural areas decrease the overall resilience of infrastructure in parts of the state. Moreover, the sociodemographic underpinnings of the geospatial resilience assessments reveal differences in the potential benefits of targeted infrastructure improvement efforts. Therefore, and in order to enhance internet resilience, the differences in access and the sociodemographic characteristics of the communities served need to be understood. Such an understanding will better inform stakeholder interests, as well as supporting decision-making for the augmentation of existing infrastructure and the development of new infrastructure. The presented framework can be transferred to other resilience contributors, critical infrastructures, and locations. Future work on this topic could automate the developed framework and generate continuously updated geospatial resilience analyses based on up-to-date datasets published by the various distributed data sources used in this study.

Supplementary Materials

The following are available online at https://www.mdpi.com/article/10.3390/su141811415/s1, Figure S1: Clusters from k-means of internet access EFA. Figure S2: Clusters from k-means of sudden-onset disasters EFA. Figure S3: Clusters from k-means of advanced industries EFA. Figure S4: Clusters from k-means of education EFA. Figure S5: Clusters from k-means of healthcare/medical EFA. Table S1: Description of datasets used for geospatial analysis; note that the summary of attributes is not all-inclusive. Table S2: Notable cluster characteristics for internet access EFA; the median is presented unless otherwise indicated. Table S3: Notable cluster characteristics for disruption risk EFA; the median is presented unless otherwise indicated. Table S4: Notable cluster characteristics for labor disruption vulnerability EFA; the mean is presented unless otherwise indicated. Table S5: Notable cluster characteristics for education disruption vulnerability EFA; the mean is presented unless otherwise indicated. Table S6: Notable cluster characteristics for medical disruption vulnerability EFA; the mean is presented unless otherwise indicated. Table S7: Advanced industries (Rothwell and Kulkarni, 2015)—in the top 50% of STEM employers as well as in the top 21% for research and development spending per employee.

Author Contributions

Conceptualization, F.H.-G., C.L.G. and H.S.R.; methodology, F.H.-G. and C.L.G.; software, F.H.-G.; validation, C.L.G. and H.S.R.; formal analysis, F.H.-G.; investigation, F.H.-G.; resources, C.L.G. and H.S.R.; data curation, F.H.-G.; writing—original draft preparation, F.H.-G.; writing—review and editing, F.H.-G., H.S.R. and C.L.G.; visualization, F.H.-G.; supervision, C.L.G. and H.S.R.; project administration, H.S.R. and C.L.G.; funding acquisition, H.S.R. and C.L.G. All authors have read and agreed to the published version of the manuscript.

Funding

This research was funded by the National Center for Airborne Laser and Mapping (NCALM, NSF Grant #1830734) and the Hurricane Resilience Research Institute. Their support is gratefully acknowledged.

Data Availability Statement

All data used in this study are described in Table S1 of this manuscript, and are publicly available from their respective sources.

Acknowledgments

The authors acknowledge the Hurricane Resilience Research Institute (HuRRI) at UH and the National Science Foundation (NSF) National Center for Airborne Laser and Mapping (NCALM) for funding this study.

Conflicts of Interest

The authors declare no conflict of interest.

References

  1. Aceto, G.; Botta, A.; Marchetta, P.; Persico, V.; Pescapé, A. A comprehensive survey on internet outages. J. Netw. Comput. Appl. 2018, 113, 36–63. [Google Scholar] [CrossRef]
  2. Çetinkaya, E.K.; Broyles, D.; Dandekar, A.; Srinivasan, S.; Sterbenz, J.P.G. Modelling communication network challenges for Future Internet resilience, survivability, and disruption tolerance: A simulation-based approach. Telecommun. Syst. 2013, 52, 751–766. [Google Scholar] [CrossRef]
  3. Cybersecurity and Infrastructure Security Agency, “Information Technology Sector,” Infrastructure Security. Available online: https://www.cisa.gov/information-technology-sector (accessed on 3 August 2022).
  4. Wu, J.; Zhang, Y.; Mao, Z.M.; Shin, K.G. Internet routing resilience to failures. In Proceedings of the 2007 ACM CoNEXT Conference-3rd International Conference on Emerging Networking EXperiments and Technologies, CoNEXT, New York, NY, USA, 10–13 December 2007. [Google Scholar] [CrossRef]
  5. Sterbenz, J.P.G.; Hutchison, D.; Çetinkaya, E.K.; Jabbar, A.; Rohrer, J.P.; Schöller, M.; Smith, P. Resilience and survivability in communication networks: Strategies, principles, and survey of disciplines. Comput. Networks 2010, 54, 1245–1265. [Google Scholar] [CrossRef]
  6. Alba, D.; King, C. So We’re Working From Home. Can the Internet Handle It? New York Times, 16 March 2020. [Google Scholar]
  7. Gomes, T.; Tapolcai, J.; Esposito, C.; Hutchison, D.; Kuipers, F.; Rak, J.; de Sousa, A.; Iossifides, A.; Travanca, R.; Andre, J.; et al. A survey of strategies for communication networks to protect against large-scale natural disasters. In Proceedings of the 2016 8th International Workshop on Resilient Networks Design and Modeling, RNDM 2016, Halmstad, Swede, 13–15 September 2016; pp. 11–22. [Google Scholar] [CrossRef]
  8. Rajput, P.; Sinha, M.K. Geospatial evaluation of drought resilience in sub-basins of Mahanadi river in India. Water Supply 2020, 20, 2826–2844. [Google Scholar] [CrossRef]
  9. Rajabifard, A.; Foliente, G.; Paez, D. COVID-19 Pandemic, Geospatial Information, and Community Resilience; Global Applications and Lessons. Available online: http://taylorandfrancis.com (accessed on 1 September 2022).
  10. Zhang, N.; Yang, S.; Jia, P. Cultivating Resilience During the COVID-19 Pandemic: A Socioecological Perspective. Annu. Rev. Psychol. 2022, 73, 575–598. [Google Scholar] [CrossRef]
  11. Dinh, L.T.; Pasman, H.; Gao, X.; Mannan, M.S. Resilience engineering of industrial processes: Principles and contributing factors. J. Loss Prev. Process Ind. 2012, 25, 233–241. [Google Scholar] [CrossRef]
  12. Tornatore, M.; Andre, J.; Babarczi, P.; Braun, T.; Folstad, E.; Heegaard, P.; Hmaity, A.; Furdek, M.; Jorge, L.; Kmiecik, W.; et al. A survey on network resiliency methodologies against weather-based disruptions. In Proceedings of the 2016 8th International Workshop on Resilient Networks Design and Modeling, RNDM 2016, Halmstad, Swede, 13–15 September 2016; pp. 23–34. [Google Scholar] [CrossRef]
  13. Ashraf, M.W.; Idrus, S.M.; Iqbal, F.; Butt, R.A.; Faheem, M. Disaster-Resilient Optical Network Survivability: A Comprehensive Survey. Photonics 2018, 5, 35. [Google Scholar] [CrossRef] [Green Version]
  14. Lomba-Fernández, C.; Hernantes, J.; Labaka, L. Guide for Climate-Resilient Cities: An Urban Critical Infrastructures Approach. Sustainability 2019, 11, 4727. [Google Scholar] [CrossRef]
  15. Brodmerkel, A.; Carpenter, A.T.; Morley, K.M. Federal financial resources for disaster mitigation and resilience in the U.S. water sector. Util. Policy 2019, 63, 101015. [Google Scholar] [CrossRef]
  16. Comes, T.; van de Walle, B. Measuring disaster resilience: The impact of hurricane sandy on critical infrastructure systems. In Proceedings of the ISCRAM 2014 Conference Proceedings-11th International Conference on Information Systems for Crisis Response and Management, Univesrity Park, PA, USA, 18–21 May 2014; pp. 195–204. [Google Scholar]
  17. Ma, C.; Savas, S.S.; Wang, X.; Zhang, J.; Zhao, Y.; Gao, G.; Mukherjee, B. Traveling Repairman Problem to Restore Virtual Networks in All-Optical Networks after a Disaster. In Proceedings of the Asia Communications and Photonics Conference, ACPC 2015, Hong Kong, China, 19–23 November 2015; Volume 7. [Google Scholar] [CrossRef]
  18. Nelson, B.C.; Steckler, B.D.; Stamberger, J.A. The Evolution of Hastily Formed Networks for Disaster Response: Technologies, Case Studies, and Future Trends. In Proceedings of the IEEE Global Humanitarian Technology Conference, Seattle, WA, USA, 30 October–1 November 2011. [Google Scholar]
  19. Gangopadhyay, B.; Pedro, J.; Spälter, S. Multi-failure Resilient and Cost-effective Hyper-scale Transport Networks for the 5G-era. In Proceedings of the 2019 Optical Fiber Communications Conference and Exhibition (OFC), San Diego, CA, USA, 3–7 March 2019; pp. 1–3. [Google Scholar]
  20. Saito, H. Spatial Design of Physical Network Robust Against Earthquakes. J. Light. Technol. 2014, 33, 443–458. [Google Scholar] [CrossRef]
  21. Savas, S.S.; Tornatore, M.; Habib, M.F.; Chowdhury, P.; Mukherjee, B. Disaster-resilient control plane design and mapping in software-defined networks. In Proceedings of the IEEE International Conference on High Performance Switching and Routing, HPSR, Yokohama, Japan, 14–17 June 2016; pp. 1–6. [Google Scholar] [CrossRef]
  22. Tran, P.N.; Saito, H. Disaster Avoidance Control against Tsunami. In Proceedings of the 2016 28th International Teletraffic Congress (ITC 28), Wurzburg, Germany, 12–16 September 2016; Volume 1, pp. 26–34. [Google Scholar] [CrossRef]
  23. Elena-Bucea, A.; Cruz-Jesus, F.; Oliveira, T.; Coelho, P.S. Assessing the Role of Age, Education, Gender and Income on the Digital Divide: Evidence for the European Union. Inf. Syst. Front. 2020, 23, 1007–1021. [Google Scholar] [CrossRef]
  24. Berliner, E.; Benmoshe, B.; Dvir, A.; Hadas, Y. Wireless infrastructure deployment model for sudden-onset disasters through real-time monitoring. In Proceedings of the 2016 IEEE 21st International Workshop on Computer Aided Modelling and Design of Communication Links and Networks (CAMAD), Toronto, ON, Canada, 23–25 October 2016; pp. 194–200. [Google Scholar] [CrossRef]
  25. Kwasinski, A. Effects of Notable Natural Disasters of 2017 on Information and Communication Networks Infrastructure. In Proceedings of the 2018 IEEE International Telecommunications Energy Conference (INTELEC), Turino, Italy, 7–11 October 2018; pp. 1–8. [Google Scholar] [CrossRef]
  26. Neumayer, S.; Zussman, G.; Member, S.; Cohen, R. Assessing the Vulnerability of the Fiber Infrastructure to Disasters. IEEE/ACM Trans. Netw. 2011, 19, 1610–1623. [Google Scholar] [CrossRef] [Green Version]
  27. Omer, M.; Nilchiani, R.; Mostashari, A. Measuring the resilience of the global internet infrastructure system. In Proceedings of the 2009 3rd Annual IEEE Systems Conference, Vancouver, BC, Canada, 23–26 March 2009; pp. 156–162. [Google Scholar]
  28. Huang, W.; Duan, W.; Nover, D.; Sahu, N.; Chen, Y. An integrated assessment of surface water dynamics in the Irtysh River Basin during 1990–2019 and exploratory factor analyses. J. Hydrol. 2021, 593, 125905. [Google Scholar] [CrossRef]
  29. Li, S.; Dragicevic, S.; Castro, F.A.; Sester, M.; Winter, S.; Çöltekin, A.; Pettit, C.; Jiang, B.; Haworth, J.; Stein, A.; et al. Geospatial big data handling theory and methods: A review and research challenges. ISPRS J. Photogramm. Remote. Sens. 2016, 115, 119–133. [Google Scholar] [CrossRef]
  30. Praveen, P.; Babu, C.J.; Rama, B. Big data environment for geospatial data analysis. In Proceedings of the 2016 International Conference on Communication and Electronics Systems (ICCES), Coimbatore, India, 21–22 October 2016; pp. 1–6. [Google Scholar]
  31. US Census Bureau. City and Town Population Totals: 2010–2019. Available online: https://www.census.gov/data/tables/time-series/demo/popest/2010s-total-cities-and-towns.html (accessed on 1 September 2022).
  32. Owuor, S. The 10 Least Populated US Counties. World Atlas. 2019. Available online: https://www.worldatlas.com/articles/the-10-least-populated-us-counties.html (accessed on 11 August 2020).
  33. Smith, A. 2010–2019: A Landmark Decade of U.S. Billion-Dollar Weather and Climate Disasters. Climate.gov. 2020. Available online: https://www.climate.gov/news-features/blogs/beyond-data/2010-2019-landmark-decade-us-billion-dollar-weather-and-climate (accessed on 1 September 2022).
  34. Cruz-Jesus, F.; Vicente, M.R.; Bacao, F.; Oliveira, T. The education-related digital divide: An analysis for the EU-28. Comput. Hum. Behav. 2016, 56, 72–82. [Google Scholar] [CrossRef]
  35. Spearman, C. General Intelligence. Objectively Determined and Measured. Am. J. Psychol. 1904, 15, 201. [Google Scholar] [CrossRef]
  36. Thompson, B. Exploratory and Confirmatory Factor Analysis; American Psychological Association: Washington, DC, USA, 2004. [Google Scholar]
  37. Horn, J.L. A rationale and test for the number of factors in factor analysis. Psychometrika 1965, 30, 179–185. [Google Scholar] [CrossRef]
  38. Cai, L. HornParallelAnalysis(data, K). MATLAB Central File Exchange. 2016. Available online: https://www.mathworks.com/matlabcentral/fileexchange/57859-hornparallelanalysis-data-k (accessed on 11 August 2020).
  39. Ledesma, R.D.; Valero-Mora, P. Determining the number of factors to retain in EFA: An easy-to-use computer program for carrying out parallel analysis. Pract. Assess. Res. Eval. 2007, 12, 2. [Google Scholar] [CrossRef]
  40. Palozzi, G.; Schettini, I.; Chirico, A. Enhancing the Sustainable Goal of Access to Healthcare: Findings from a Literature Review on Telemedicine Employment in Rural Areas. Sustainability 2020, 12, 3318. [Google Scholar] [CrossRef]
  41. Drake, C.; Zhang, Y.; Chaiyachati, K.H.; Polsky, D. The Limitations of Poor Broadband Internet Access for Telemedicine Use in Rural America: An Observational Study. Ann. Intern. Med. 2019, 171, 382–384. [Google Scholar] [CrossRef]
  42. Eberly, L.A.; Khatana, S.A.M.; Nathan, A.S.; Snider, C.; Julien, H.M.; Deleener, M.E.; Adusumalli, S. The digital divide: How COVID-19’s telemedicine expansion could exacerbate disparities. Circulation 2020, 142, 510–512. [Google Scholar] [CrossRef] [PubMed]
  43. Klein, L.J.; Albrecht, C.M.; Zhou, W.; Siebenschuh, C.; Pankanti, S.; Hamann, H.F.; Lu, S. N-dimensional geospatial data and analytics for critical infrastructure risk assessment. In Proceedings of the 2019 IEEE International Conference on Big Data, Los Angeles, CA, USA, 9–12 December 2019; pp. 5637–5643. [Google Scholar] [CrossRef]
  44. Mottaleb, K.A.; Krupnik, T.J.; Keil, A.; Erenstein, O. Understanding clients, providers and the institutional dimensions of irrigation services in developing countries: A study of water markets in Bangladesh. Agric. Water Manag. 2019, 222, 242–253. [Google Scholar] [CrossRef] [PubMed]
  45. Hawchar, L.; Naughton, O.; Nolan, P.; Stewart, M.G.; Ryan, P.C. A GIS-based framework for high-level climate change risk assessment of critical infrastructure. Clim. Risk Manag. 2020, 29, 100235. [Google Scholar] [CrossRef]
Figure 1. Overarching geospatial modeling framework.
Sustainability 14 11415 g001
Figure 2. Texas population density at the census tract level: Significant variability is evident across the state, indicating the irregular distribution of population centers, and amplifying the connectivity resilience challenge. The major cities in Texas are highlighted in red, with the outlines indicating their respective metropolitan areas. This figure can be used as reference for population distributions in other maps within this study.
Sustainability 14 11415 g002
Figure 3. Clusters for Internet access EFA, ranked from worst to best (from darker green to lighter greens, respectively).
Sustainability 14 11415 g003
Figure 4. Clusters for disruption risk EFA, ranked from worst to best (from darker to lighter blues, respectively).
Sustainability 14 11415 g004
Figure 5. EFA clusters for sub-contributors to disruption vulnerability: (a) ranked EFA clusters for labor, (b) ranked EFA clusters for education, and (c) ranked EFA clusters for healthcare/medical factors (ranked from worst to best in darker to lighter reds, respectively).
Sustainability 14 11415 g005
Figure 6. Overall disruption vulnerability, ranked from worst to best (darker to lighter reds, respectively), The data show the mean rankings for medical, education, and labor vulnerabilities for each county.
Sustainability 14 11415 g006
Figure 7. Resilience classification for census tracts, ranked from worst to best (darker to lighter reds, respectively). The data show the worst ranks achieved based on internet access, disruption risk, and overall disruption vulnerability.
Sustainability 14 11415 g007
Figure 8. Distribution of cluster classifications by resilience contributors: For rural census tracts, the internet access bar is remarkably similar to that of overall resilience, indicating that internet access drives the overall resilience ranking for rural tracts. This indicates that internet access flexibility tends to be the limiting factor for network resilience in rural areas (1.5 columns).
Sustainability 14 11415 g008
Figure 9. Demographic analysis of clusters: 18.2% of the population lives in locations with a resilience rank between 1 and 2, 15.7% lives in locations ranked between 2 and 3, 57.9% in locations ranked between 3 and 4, and 8% in locations ranked between 4 and 5 (1.5 columns).
Sustainability 14 11415 g009
Publisher’s Note: MDPI stays neutral with regard to jurisdictional claims in published maps and institutional affiliations.

