Article

How Non-Governmental-Organization-Built Small-Scale Irrigation Systems Are a Failure in Africa

1
Laboratory of Hydro-Science, and Agriculture (LEHSA), International Institute for Water and Environmental Engineering (2iE), Rue de la Science, 01 Ouagadougou 01 BP 594, Burkina Faso
2
National Laboratory of Research in Energetics and Spatial Meteorology (LAREME), Norbert Zongo University (UNZ), Koudougou BP 376, Burkina Faso
*
Author to whom correspondence should be addressed.
Sustainability 2022, 14(18), 11315; https://doi.org/10.3390/su141811315
Submission received: 2 June 2022 / Revised: 19 June 2022 / Accepted: 4 August 2022 / Published: 9 September 2022

Abstract

:
Every year, millions of dollars are invested in irrigation development in Sahelian African countries. After shifting from governmental organizations to non-governmental organizations (NGOs), the vulnerability of local populations has not changed much over the last 60 years in Africa. In this study, ten 1 ha small-scale irrigation systems—spread over the two driest climatic zones—were investigated in Burkina Faso. The soils and subsoils were characterized using double-ring infiltration measurements and two soil databases. The irrigation systems’ operability was assessed by sampling 10–12 farmers per system. A total of eight pumping tests were performed on a sample of wells. To assess the yield of cultivated onion, 5 to 7 squares were followed up in each of the 10 systems. Results indicated that water availability was ensured nowhere. The 32 wells were dug in clayey subsoils. Six of them yielded available water Ve flows ranging from 0.0 to 6.1 m3/day, far below the 80 m3/(ha·day) required by onion. To solve this issue, the NGOs shifted to a low-pressure drip irrigation solution, but the too-low pressure of 0.1 bar led to clogging. Ultimately, all 10 systems (except Louda) broke down a few months after the project’s end.

1. Introduction

In order to help build resilience and facilitate climate-friendly activities in rural areas, multiple so-called help efforts for development projects were or are underway in Africa [1,2]. Although displaying poor performance, most of these projects are not technically or scientifically well documented. Various reasons have been given to explain the failure of these rural development irrigation projects. Social capital—the bonds people form through friendship and acquaintances—is considered a key resource for achieving development project success, especially in the collective maintenance of wide infrastructure and commercialization [1,2]. Similar to this factor, others have pointed to the weak administrative organization of governmental institutions and NGOs, i.e., such as in the failure of the South Korea-funded project in DR Congo [3]. In a review of the project failures, Bekker et al. [4] found multiple reasons in the case of Mpumalanga in South Africa, among which were (i) poor communication, (ii) lack of monitoring and evaluation, (iii) lack of client or beneficiary involvement, (iv) lack of project planning, (v) financial difficulties, (vi) poor project scheduling, (vii) incomplete project drawing, (viii) conflict, (ix) poor technical performance, and (x) changing client requirements. It is remarkable that many of these factors are commonly found in other non-agricultural sectors such as governmental construction projects [5]. In most cases, GOs (governmental organizations) were mainly responsible. Therefore, requests for development help have shifted to local and international NGOs. These NGOs, often torn between efforts to ensure their own financial survival and their support for rural development [6], have, in turn, found themselves providing questionable sustainable development, and examples abound in developing countries [7,8]. Financial constraints, organizational issues, and positive reports have convinced NGOs to concentrate on small-scale irrigation.
In fact, research has frequently reported the higher performance of small-scale over large-scale irrigation, although this depends on several factors [9]. In terms of water use for agriculture and food security, large-scale irrigation projects have advantages that cannot be provided by types such as small systems. Among these advantages is the size of the area itself: usually several thousands of hectares. This correlates with allocating plots to thousands of rural families and, therefore, providing them with a means for food security and the opportunity to fight poverty. The key bottleneck with large-scale infrastructure is the inefficiency of the farmer organization at exploiting a complex infrastructure. Consequently, many have highlighted the need for a paradigm shift in the approach to helping African farmers and moving to small-scale irrigation, which is considered more performant [10,11]. This study investigated the sustainability of an NGO-built small-scale irrigation project in the Sahelian region of Burkina Faso in West Africa. It endeavored to draw key lessons by answering the following questions: (i) How reliable was water availability? (ii) What resulted from water distribution through a poorly engineered and designed infrastructure? (iii) What was the impact on farmers’ crop production? (iv) What reliable water resource and service can be proposed for future small irrigation projects? These questions were investigated through a sample of 10 small-scale (1 ha) irrigation schemes, implemented by a consortium of local and international NGOs. The project was commonly called BRACED, funded by UK aid under the explicit title: “Project to strengthen the resilience of 620 thousand women, children and men in Burkina Faso to climate extremes and improve food security and household incomes” (BRACED/2015–2019). The key results demonstrated that (i) the non-equitable and unreliable water distribution; (ii) the extreme smallness of the farm plots distributed to more than 50 women and installed on a 1 ha piece of land; and (iii) the unsuitable—though the object of much publicity—drip irrigation were non-sustainable recurrent “solutions” proposed by the non-governmental organizations.

2. Materials and Methods

2.1. Climate Change and Its Impact

Burkina Faso is a Sahelian country characterized by a rainy season of 3 to 4 months and a dry season of 8 to 9 months (October to June), depending on the location within three climatic zones (Figure 1). The Sahelian zone is located in the north of the country and receives the least rainfall, less than 600 mm of annual precipitation. The North Sudanian zone is in the center, with a range of 600 to 900 mm of rain a year. The South Sudanian zone lies in the south of the country, with an annual average rainfall of more than 900 mm [12]. In all three zones, while rainfall is unpredictable and variable, the dry spells during the rainy season have increased since 1970 and the number of rainy days is decreasing [13]. These changes in the climate pattern, combined with anthropic deforestation, impact people and livelihoods. Agriculture, highly dependent on rainfall, has become more vulnerable. During the 8 to 9 months of the dry season, most rural people, and particularly women, in the Sahelian and the North Sudanian zones are jobless, vulnerable, and recurrently exposed to pauperization. Displacement (migration and exodus) has accelerated in recent decades precisely because of the deterioration of climatic conditions [14]. This resilience action, although it allows a transfer of funds from urbanized to rural areas, generates serious socioeconomic consequences, resulting in the acculturation of the population and a reduction in the workforce (for a family type of agriculture that is very weakly mechanized).

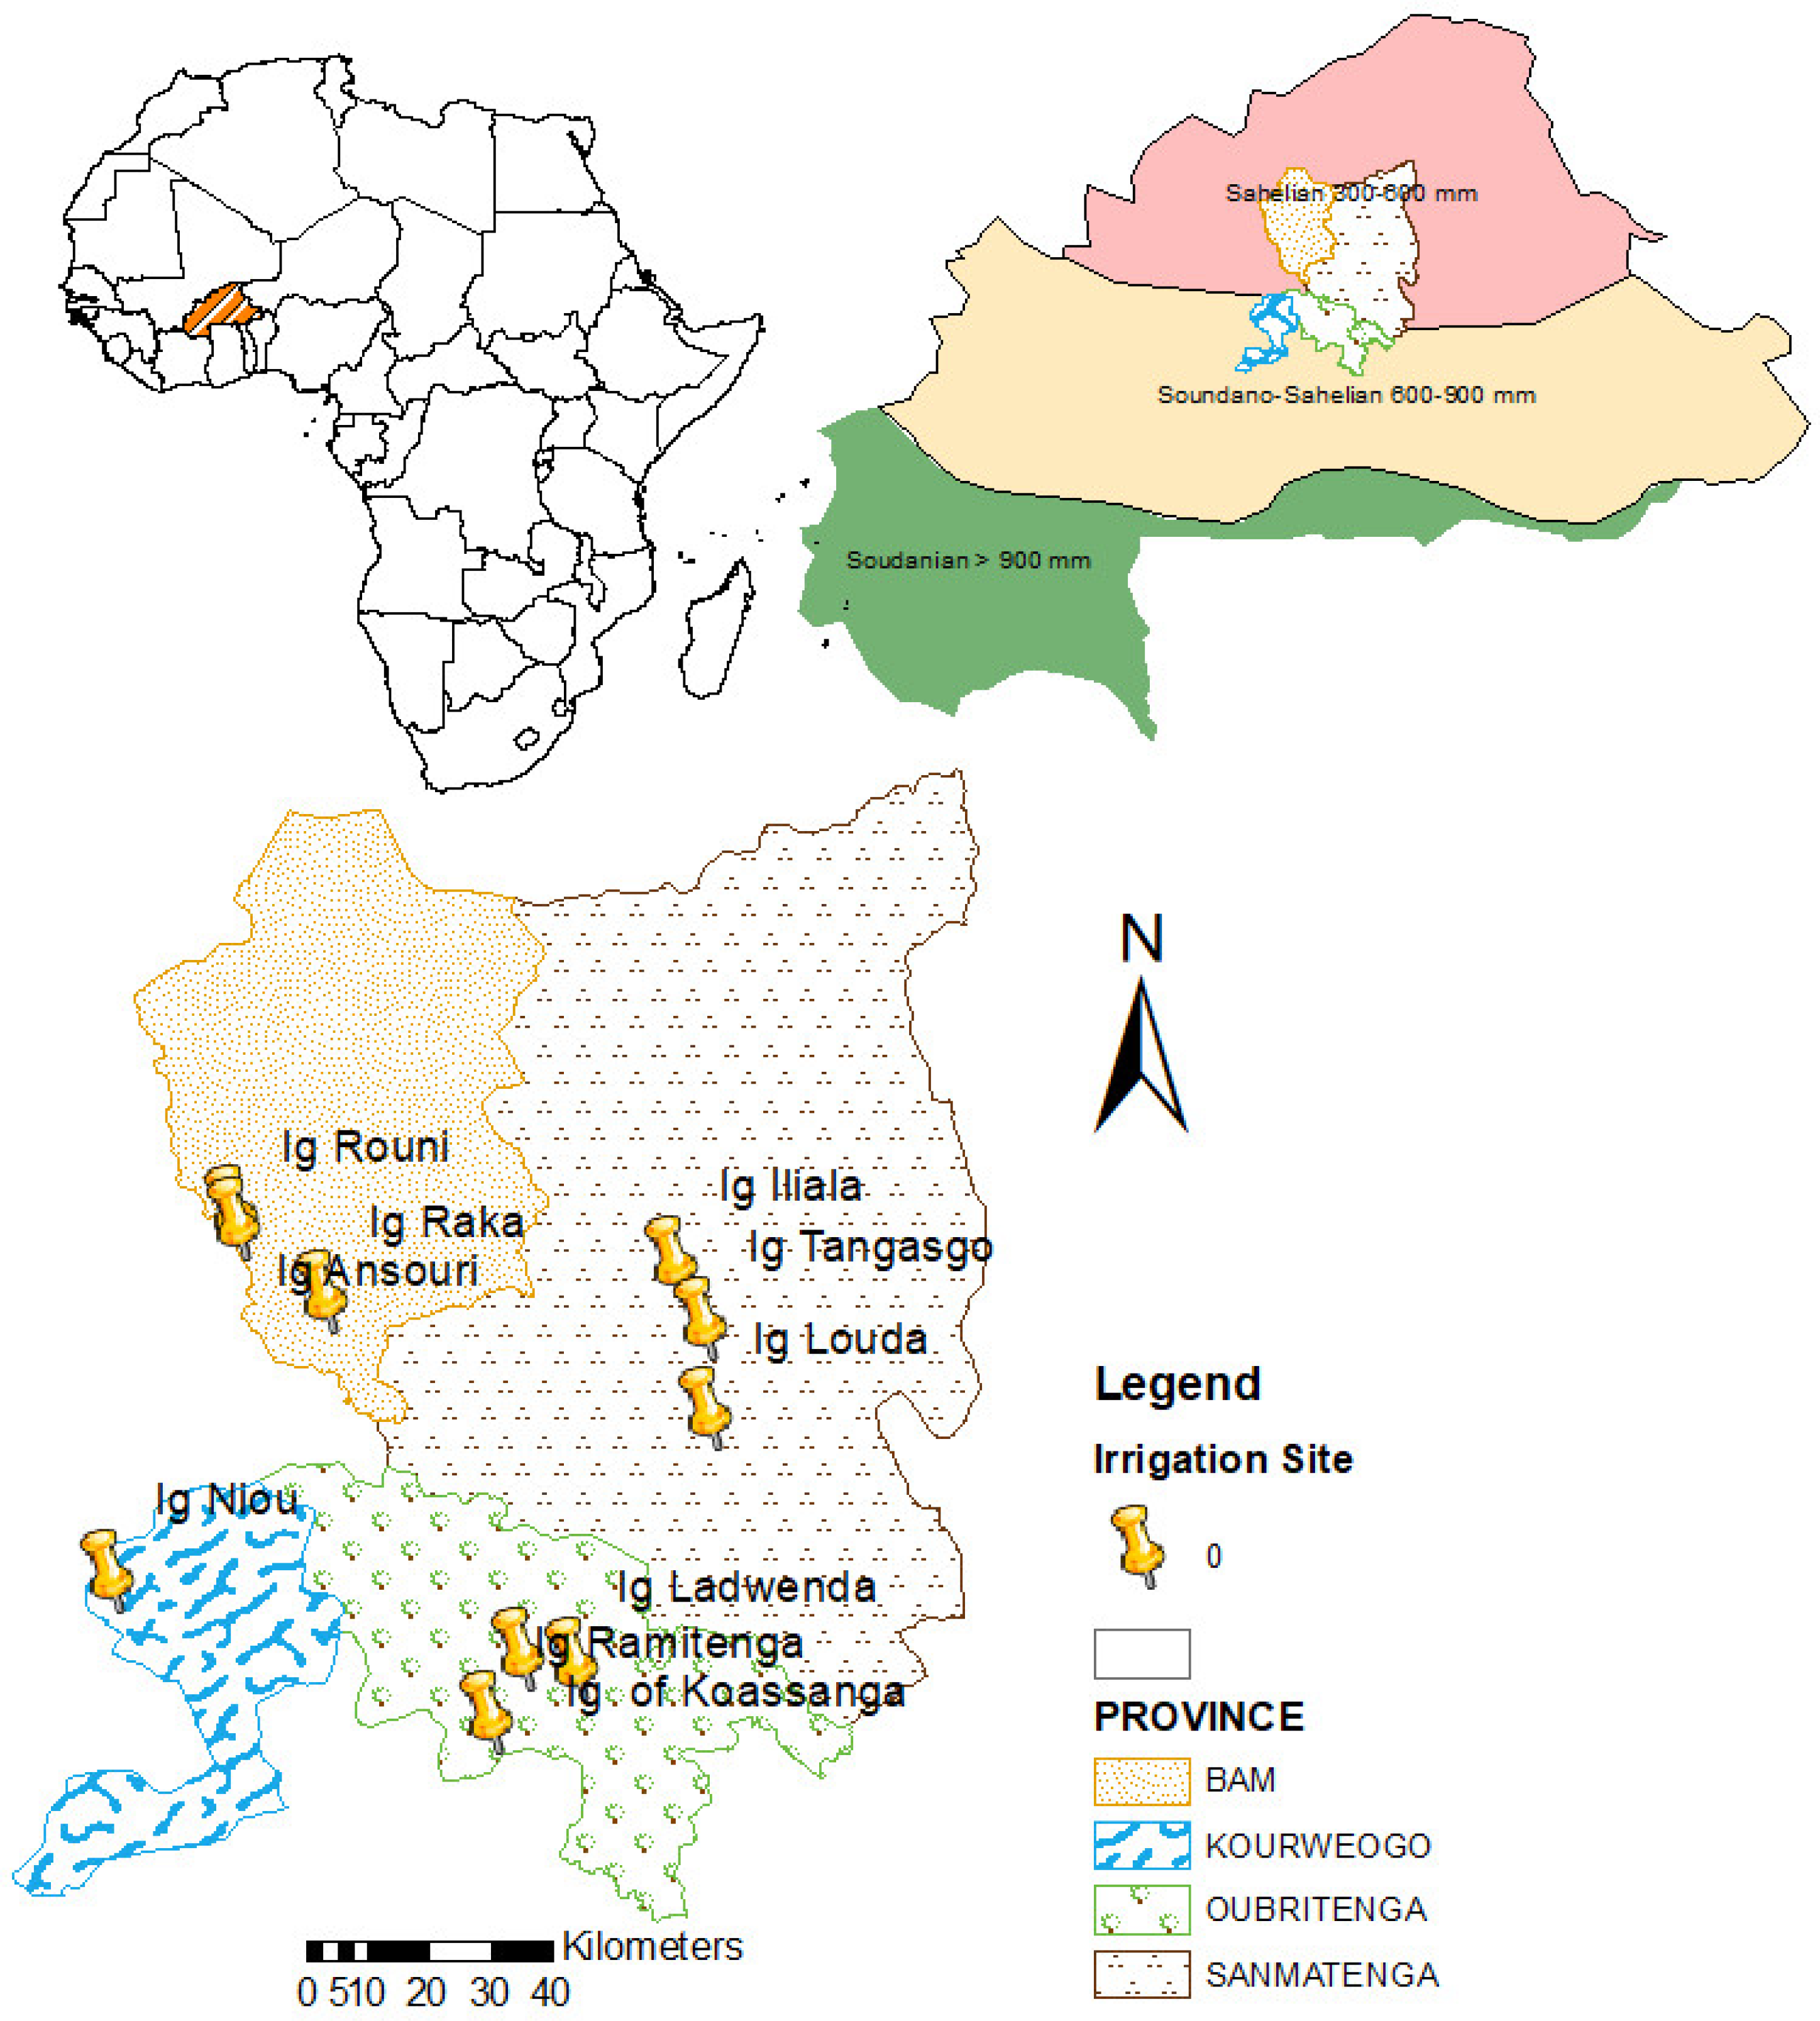
2.2. Site Location and Climate

The ten sites of this study were first selected so as to capture the possible impact of certain climatic patterns and surface water resources in relation to water availability and reliability for irrigation (Table 1). It was also noted that nine of the 1 ha irrigation sites—namely, Rouni, Ansouri, and Raka in the province of Bam and Ilyala, Tangasgo, and Louda in the province of Namentenga—were chosen in the Sahelian zone, which experiences an exacerbated water scarcity, especially during the dry season (October to June). The remaining four irrigation projects—i.e., Ladwenda, Ramitenga, Kouassanga (province of Oubritenga), and Niou (province of Bam)—are situated in the North Sudanian zone, with a slightly higher rainfall but severe occurrences of dry spells (Figure 1). In addition, to increase the groundwater availability in flow and shallowness, half of the 32 wells were dug near surface water retention dams at distances varying from 115 to 1000 m.

2.3. The Soils

Although each site differed from the others, all the soils presented low permeability, complicating drainage and internal water circulation. In the province of Oubritenga (Ladwenda, Ramitenga, and Kouassanga sites), the soils were little evolved, essentially generated from hydric erosion during the rainy season on land where deforestation and drought have spared only the poor vegetation of acacias and Balanitaceaes. The hydromorphic formations lie on gravelly materials and are often associated with lithosols on top of ferruginous concretions [15]. Soils in the province of Bam around the site of Niou were mainly composed of hydromorphic soils built on top of clay–sand formations. These soils belong to the pseudogley (stagnosols) group with blue mottles, indicating ferric iron reduction processes and very low permeability. In the province of Sanmatenga, while the site of Louda was also located on hydromorphic soils of pseudogley, Tangasgo was located on lithosols built from ferruginous concretions, as in Oubritenga, with very low internal drainage. However, in this province, the soil of the Ilyala site was made of lithosols spread on top of a ferruginous cuirass that also considerably reduced water circulation [16]. The last three sites in the province of Bam were all located on hydromorphic soils with pseudogley and mottles of iron reduction, revealing poor drainage conditions and the presence of water for a long period during the year (Figure 1).

2.4. The Population and Livelihood

The BRACED project rightly targeted vulnerable populations in the Sahel with the goal of building resilience to the impact of a changing climate. The populations in the area are mainly Mossi, Fulani, and Samo, the majority being Mossi, representing more than 50% of the total population of the country [17]. This ethnic group practices extensive agriculture during the rainy season. At the beginning of the dry season—from November to December—women manually dig small wells and practice irrigation on a few tens of square meters. Most people, and especially women, are jobless during this period. Fulani people, representing 10% of the Burkina Faso population, are rather nomadic by tradition, practicing extensive livestock farming, although repetitive droughts have led many families to settle permanently or semi-permanently in nearby Mossi villages, albeit separated from the Mossi. The Samo ethnic groups very often live in the same villages as the Mossi. Agriculture is the main source of income for these populations, who are permanently forced to overcome the challenge of producing enough food with traditional limited tools (hoe, pick, donkey traction plow) for 3 to 4 months to sustain life year-round since there is no rain for 8 months.
In order to make the most of the soil humidity during the short rainy season, various water and soil water conservation techniques are used by local populations with mitigated results for several reasons. The adoption of soil and water conservation techniques (SWCTs) such as zaï, half-moon stone bunds, have been reported to increase sorghum yield by 30 to 50% during the rainy season in some parts of Burkina Sahel [18]. The soils are poor, with low organic matter content and low permeability, resulting in greater runoff and erosion. SWCTs generally improve soil moisture, but to be really efficient, manure is needed, for example, using zaï holes to strengthen proper crop development [19]. However, although leaves can be collected from trees in the Sahelian savannah, manure is better made when there are cattle breeding, which requires an abundant availability of water. A survey in the Yatenga province (Sahelian region of Burkina Faso) [20] showed that in cases of lasting drought, farmers are reluctant to produce compost and manure, as water is central to the efficient use of this organic matter in the soil. In fact, when dry spells during the rainy season are frequent and long, most water conservation techniques are simply inefficient since their prime objective is to improve soil moisture. As a consequence, irrigation systems with better water control for crop production are needed.

2.5. Irrigation System Model

A unique 1 ha irrigation system including the same components was implemented by the BRACED project for all 10 sites. The 1 ha piece of land was given to a women’s association composed of 50 women and 2 to 3 men. Each member of the group cultivated a plot of land within the 1 ha. The water resource was a well of 8 to 12 m depth. According to the site, 3 to 4 wells were dug in the irrigated area. Per site, water extraction from the wells was performed by 1 to 3 solar-powered pumping kits—the kit comprising a 315 Wp solar panel and an electric surface pump with a theoretical flow rate of 2.7 m3/h and a total dynamic head of 40 m. These pumps carried the water through a network of buried PE-DN32 pipes to prismatic tanks of about 0.8 m3 (1.1 m × 0.9 m × 0.8 m). These tanks were placed on the ground and made of hollow agglomerations of 15 m × 20 m × 40 m. The heads were capped with a 5 cm thick reinforced concrete chain. Once the water was in the tanks, the farmers, equipped with watering equipment (bailers and watering cans), drew the water to irrigate the plots.

2.6. Equipment Inventory and Survey

The study endeavored to encompass the installed material and its effective use by women farmers. All hydraulic structures were geolocated in each of the 10 irrigation schemes by taking their Garmin GPS e-trex 30 coordinates as close as possible to the elements. Then, the coordinates were extracted from the GPS to create maps with Google Earth and ArcMap. Tests of the functionality of hydraulic infrastructures (pumping tests, watering equipment) were performed on the wells and the irrigation canals in order to check their operability at the moment of the study. A complementary diagnosis of the availability of water using an open questionnaire with 10–12 farmers and field observations was also performed per site.

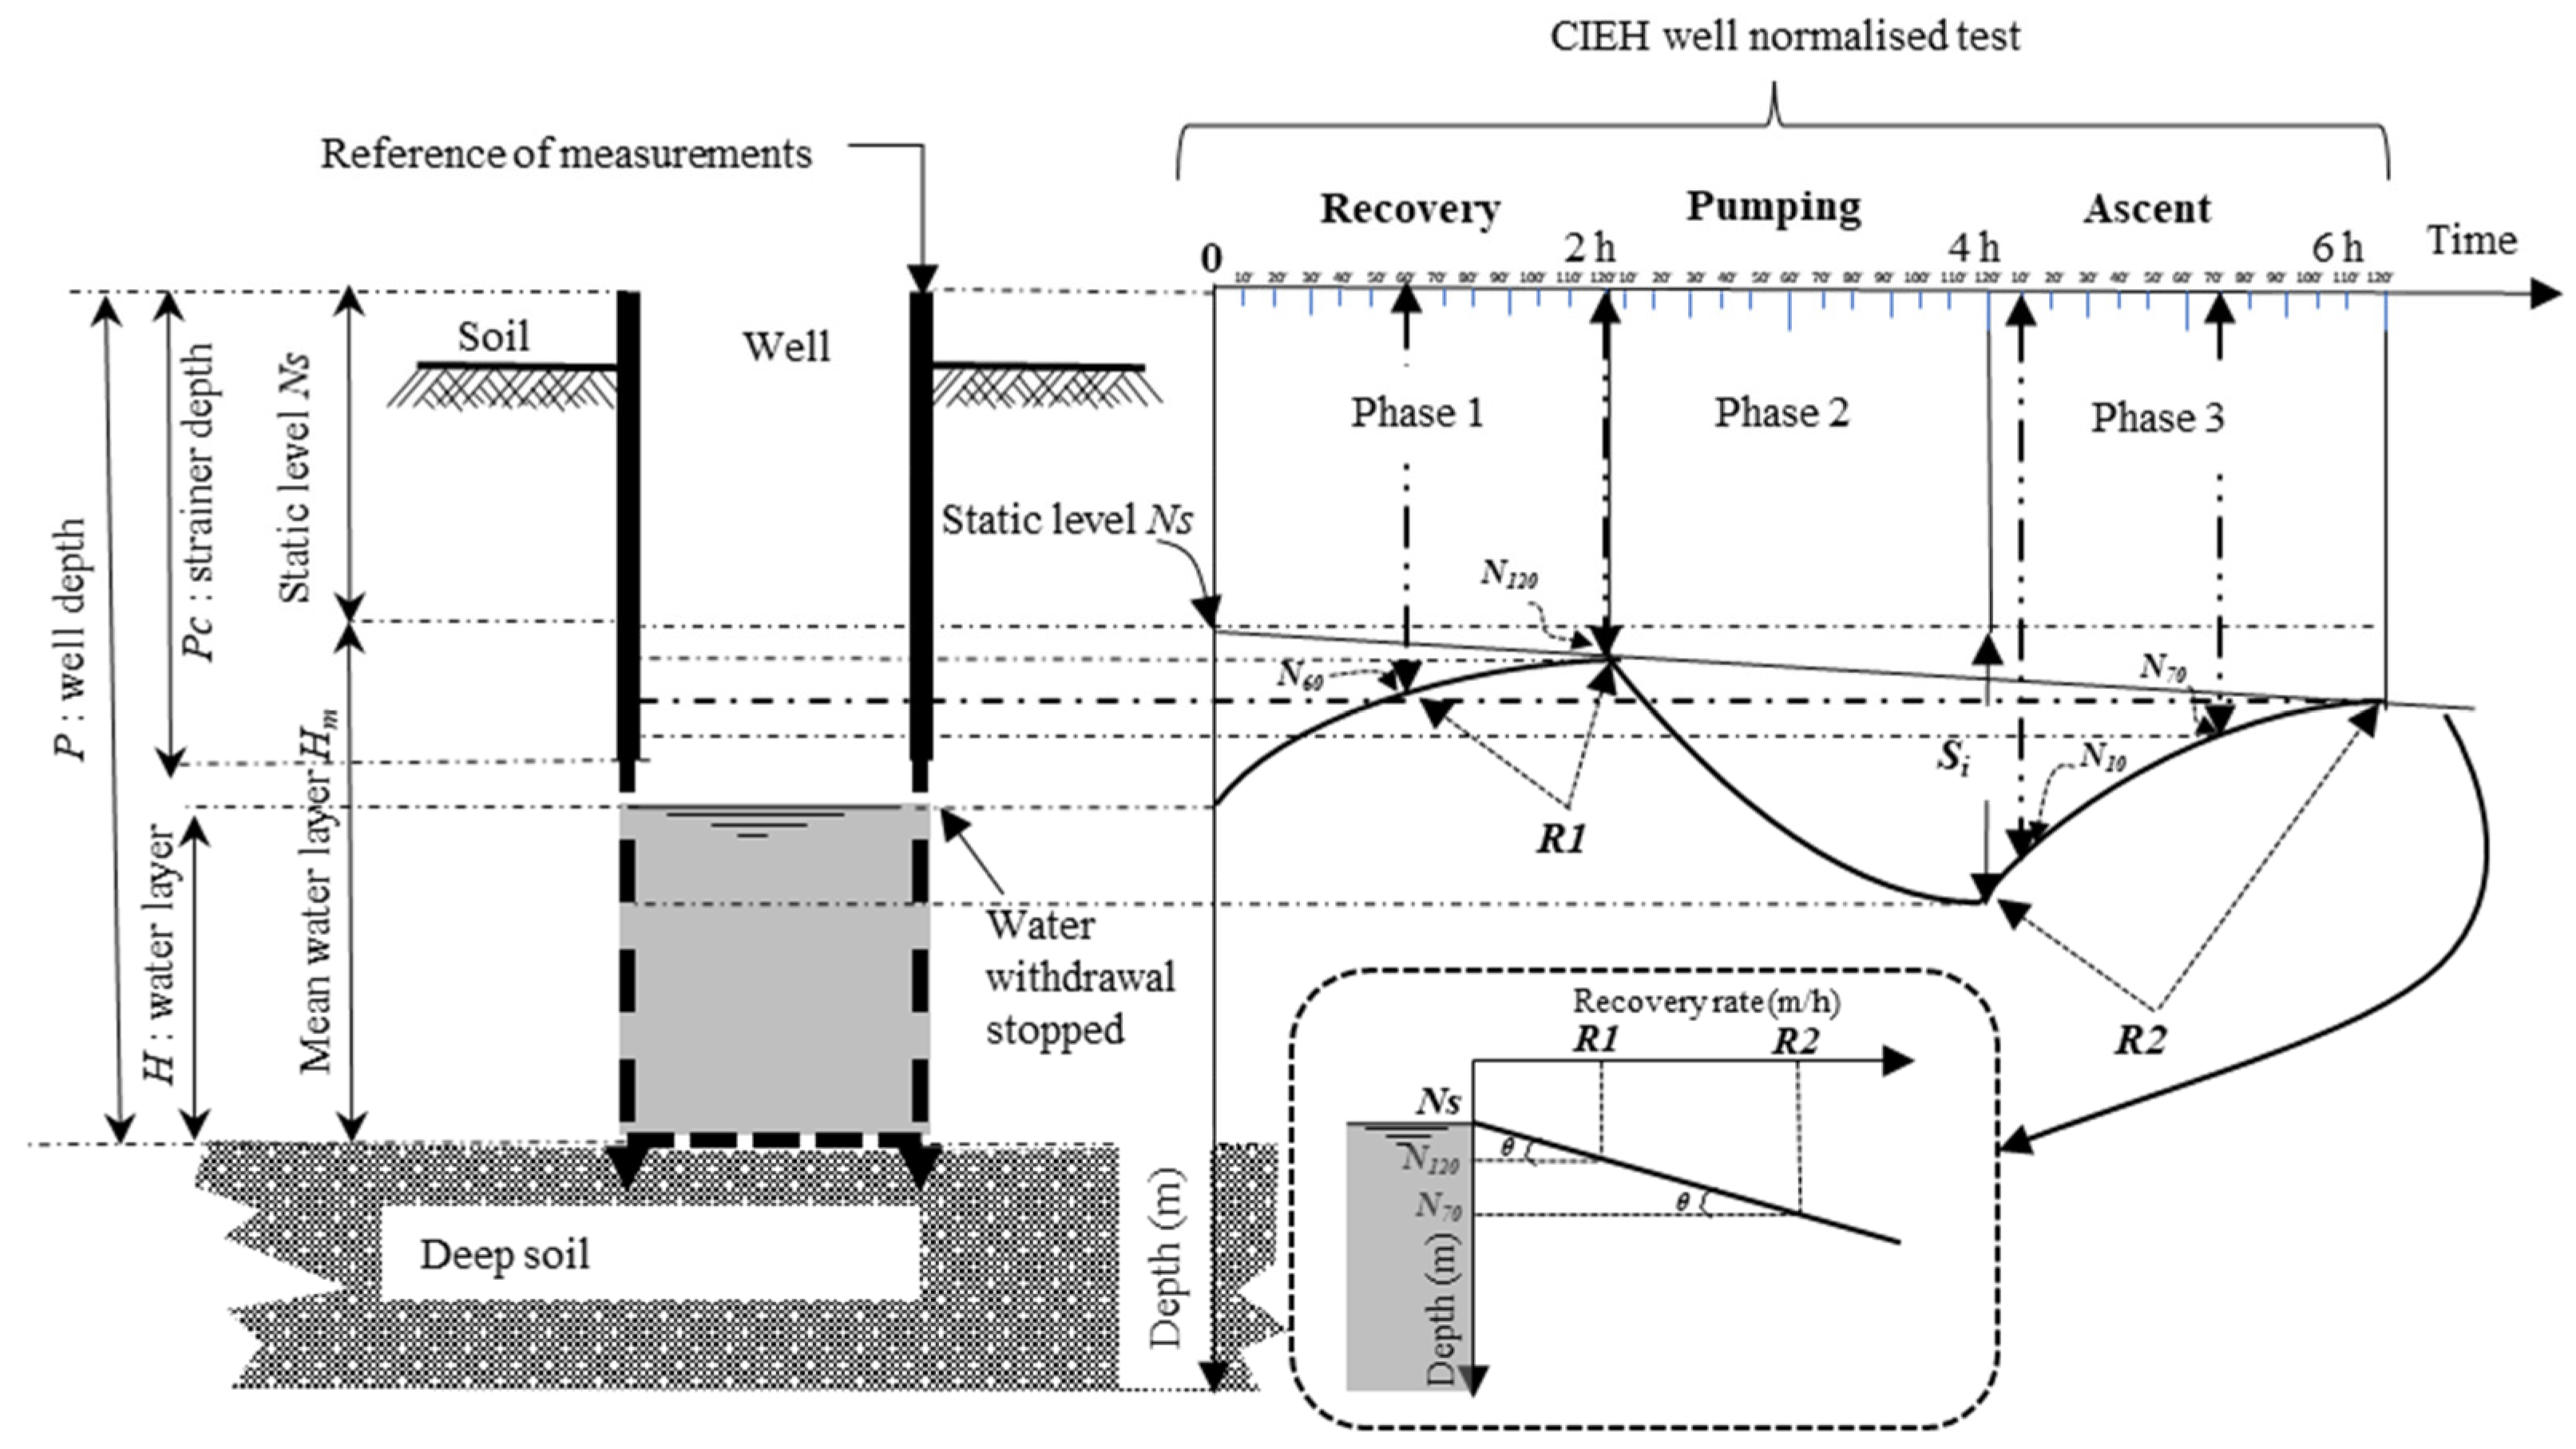
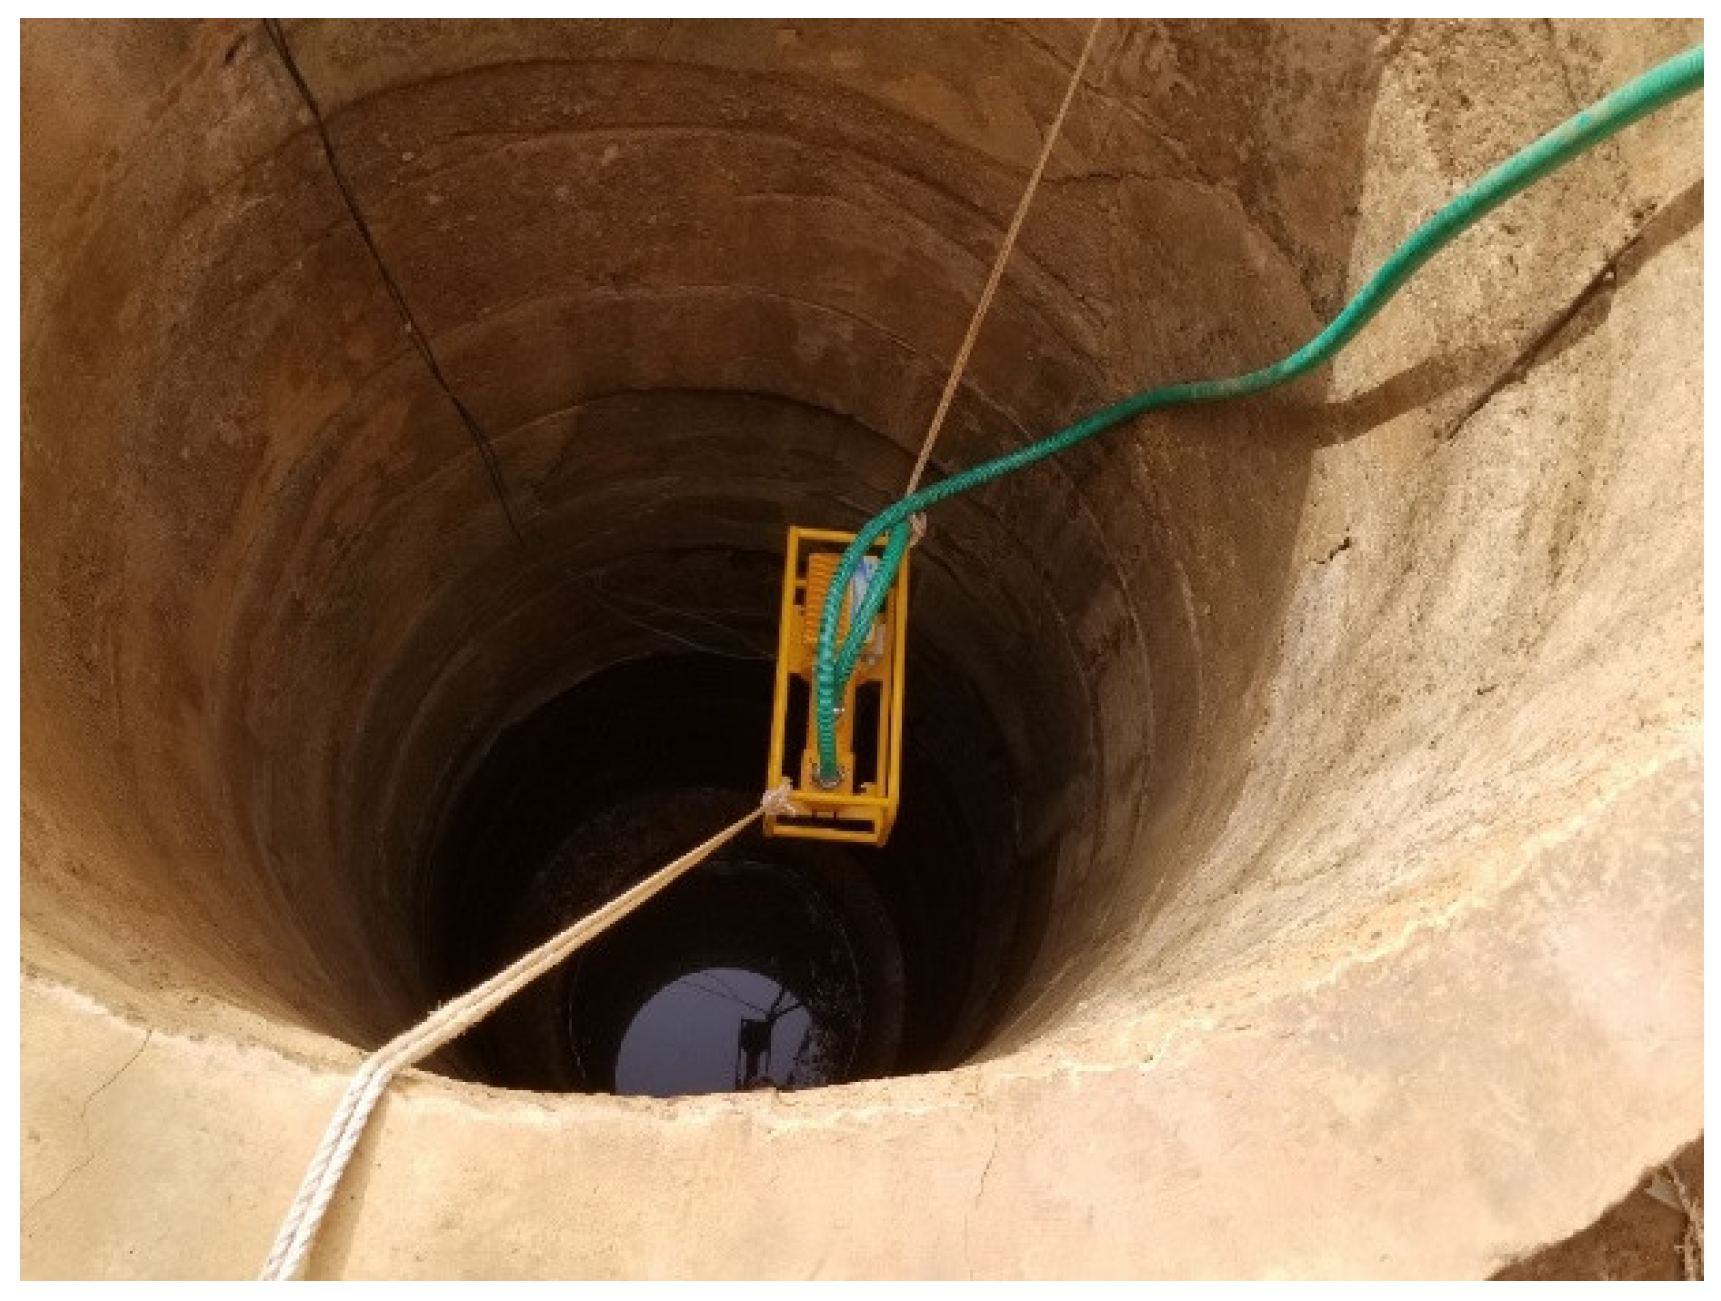
2.7. Pumping Test on Wells

The simplified CIEH method [21] was used in the wells. This method only considers the upwelling of the water level after recovery and ascent. At the end of the process, it yields the specific flow rate Ce (m3/h/m) and the daily exploitable water volume, Ve (m3/day), of the well during the dry season. The in situ implementation of the test is slightly more complex and longer (6 h) than the hand-borehole (100 to 200 mm diameter) rapid (1 h) test method [22]. However, the CIEH test has proven to be practical and more reliable. The test is applicable to all wells, whether pumped or at rest. All drawdown equipment (air pump, traditional drawing using a bailer, etc.) can be used for this test. In the current study, the solar pumps available at the sites were used for the pumping phase. The test is performed using a unique test flow rate Q of 2.44 m3/h and in 3 phases. The suitable well diameters are provided by CIEH and range from D = 0.90 m to D = 1.80 m, while the total depth of the well should not be higher than 20 m. The test is suitable for low-flow wells located in clayey/laterite alterations over basement rock. To be significant, the test must be conducted during the dry season and at least 2 months after the end of the rainy season. The test should only begin 2 h after the users have stopped pumping in the well (recovery phase). The test involved a total of 8 out of 32 wells.
The three phases are (Figure 2):
  • Phase 1: Recovery. In this phase, it is necessary to stop the drawdown by users if it is in progress. Then, the ascent is followed with the help of a probe for at least 2 h. If the value of the ascent after 1 h is less than 1 cm, it is valid to simply select the static level (NS) for the value of the water level below the mark. Otherwise, it is necessary to continue the operation until 2 h have passed.
  • Phase 2: Pumping. One should follow the descent of the water table during pumping using the probe at precise timesteps (every 10 min). The maximum pumping time is 3 h, and the well must be emptied until only a 1 m water layer remains. For the current study, solar pumps with an average flow rate of 2.44 m3/h were used. Because these pumps need sunshine, the recovery began at 9 a.m. to carry out the pumping between 11 a.m. and 2 p.m. This guaranteed a regularity of flow during pumping.
  • Phase 3: Ascent. After the pumping is stopped, it is necessary to carefully measure the ascent for 2 h at given timesteps (every 10 min). Afterward, normal operation of the well can resume.
The interpretation of the test results is structured in 4 steps. The first step describes how the static level Ns (m) and the mean water layer Hm (m) above the well bottom are drawn from recovery and ascent measurements and the well depth P (m) (Figure 2). The second step consists of computations yielding the quantification of the piezometric level variation, i.e., the probable water layer H0 (m) above the well bottom at the end of the dry season. This step also provides the coefficient L (m/m) expressing the piezometric level variation rate over an entire dry season. In the third step, the so-called specific flow rate Ce (m3/h/m) is computed. Finally, in the fourth step, the three variables (L, Ce, H0) are applied to Abacus N3 (Figure 3) to determine the well’s daily exploitable water Ve (m3/day).
In the example, when computations in Equations (4) and (5) yield the well water layer at the beginning of the dry season H0 (7.5 m) and the piezometric natural variation during the dry season L (0.27 m/m), the curves to be used in the left and the right graphs are known. Then, the value of the specific flow Ce (0.82 m3/h/m) computed in Equation (7) allows drawing the segments “(a)”, “(b)” and “(c)”, leading to the determination of the well’s daily exploitable water Ve (26 m3/day) at the intersection of segment “(c)” and the Ve axis.
The equations related to the data processing and interpretations are described below.

2.7.1. Determination of Mean Static Level Ns before the Pumping Test

From the test data sheet (see Figure 2 and Phases 1–3, described previously) and using Equation (1), the recovery and ascent rates, R1 and R2, are calculated as follows:
R 1 = N 60 N 120 R 2 = N 10 N 70
where R1: recovery rate after withdrawal stop, in m/h;
N60: water level from reference after 60 min, in m;
N120: water level from reference after 120 min, in m;
R2: ascent rate after pumping stop, in m/h;
N10: water level from reference after 10 min, in m;
N70: water level from reference after 70 min, in m.
Via linear extrapolation using the tangent of the corresponding angle tan, θ (see Figure 2 and Equation (2)), between the static level after 120 min of recovery at the rate (N120, R1), the static level after 70 min of ascent, and the related rate (N70, R2), one can determine the most probable static level, NS, when the well is at rest (no withdrawal, no pumping) by the expression:
N s = N 120 R 2 N 70 R 1 R 2 R 1 .
Hence (Figure 2), the total water layer, Hm, related to the static level is provided by the expression:
H m = P N s
where Hm: mean water layer related to the static level, in m;
P: depth of the well measured from reference, in m;
Ns: the static water level of the well at rest (before the test), in m.

2.7.2. The Piezometric Level Fluctuation Rate Coefficient, L (m/m), during the Complete Dry Season

Through a survey, the operator of the test must assess (i) the usual duration of the dry season, Ds (months or days); (ii) the elapsed time, De (months or days), from the end of the rainy season to the date of the test by using observations of old surrounding wells; and (iii) the dry season total piezometric level variation, ΔH (m). From these three quantities, the probable maximum water layer at the beginning of the dry season is computed by the expression:
H 0 = H m + Δ H D e D s .
The piezometric level fluctuation rate coefficient, L (m/m), is deduced from the previous Equation (4) as:
L = Δ H H 0 .

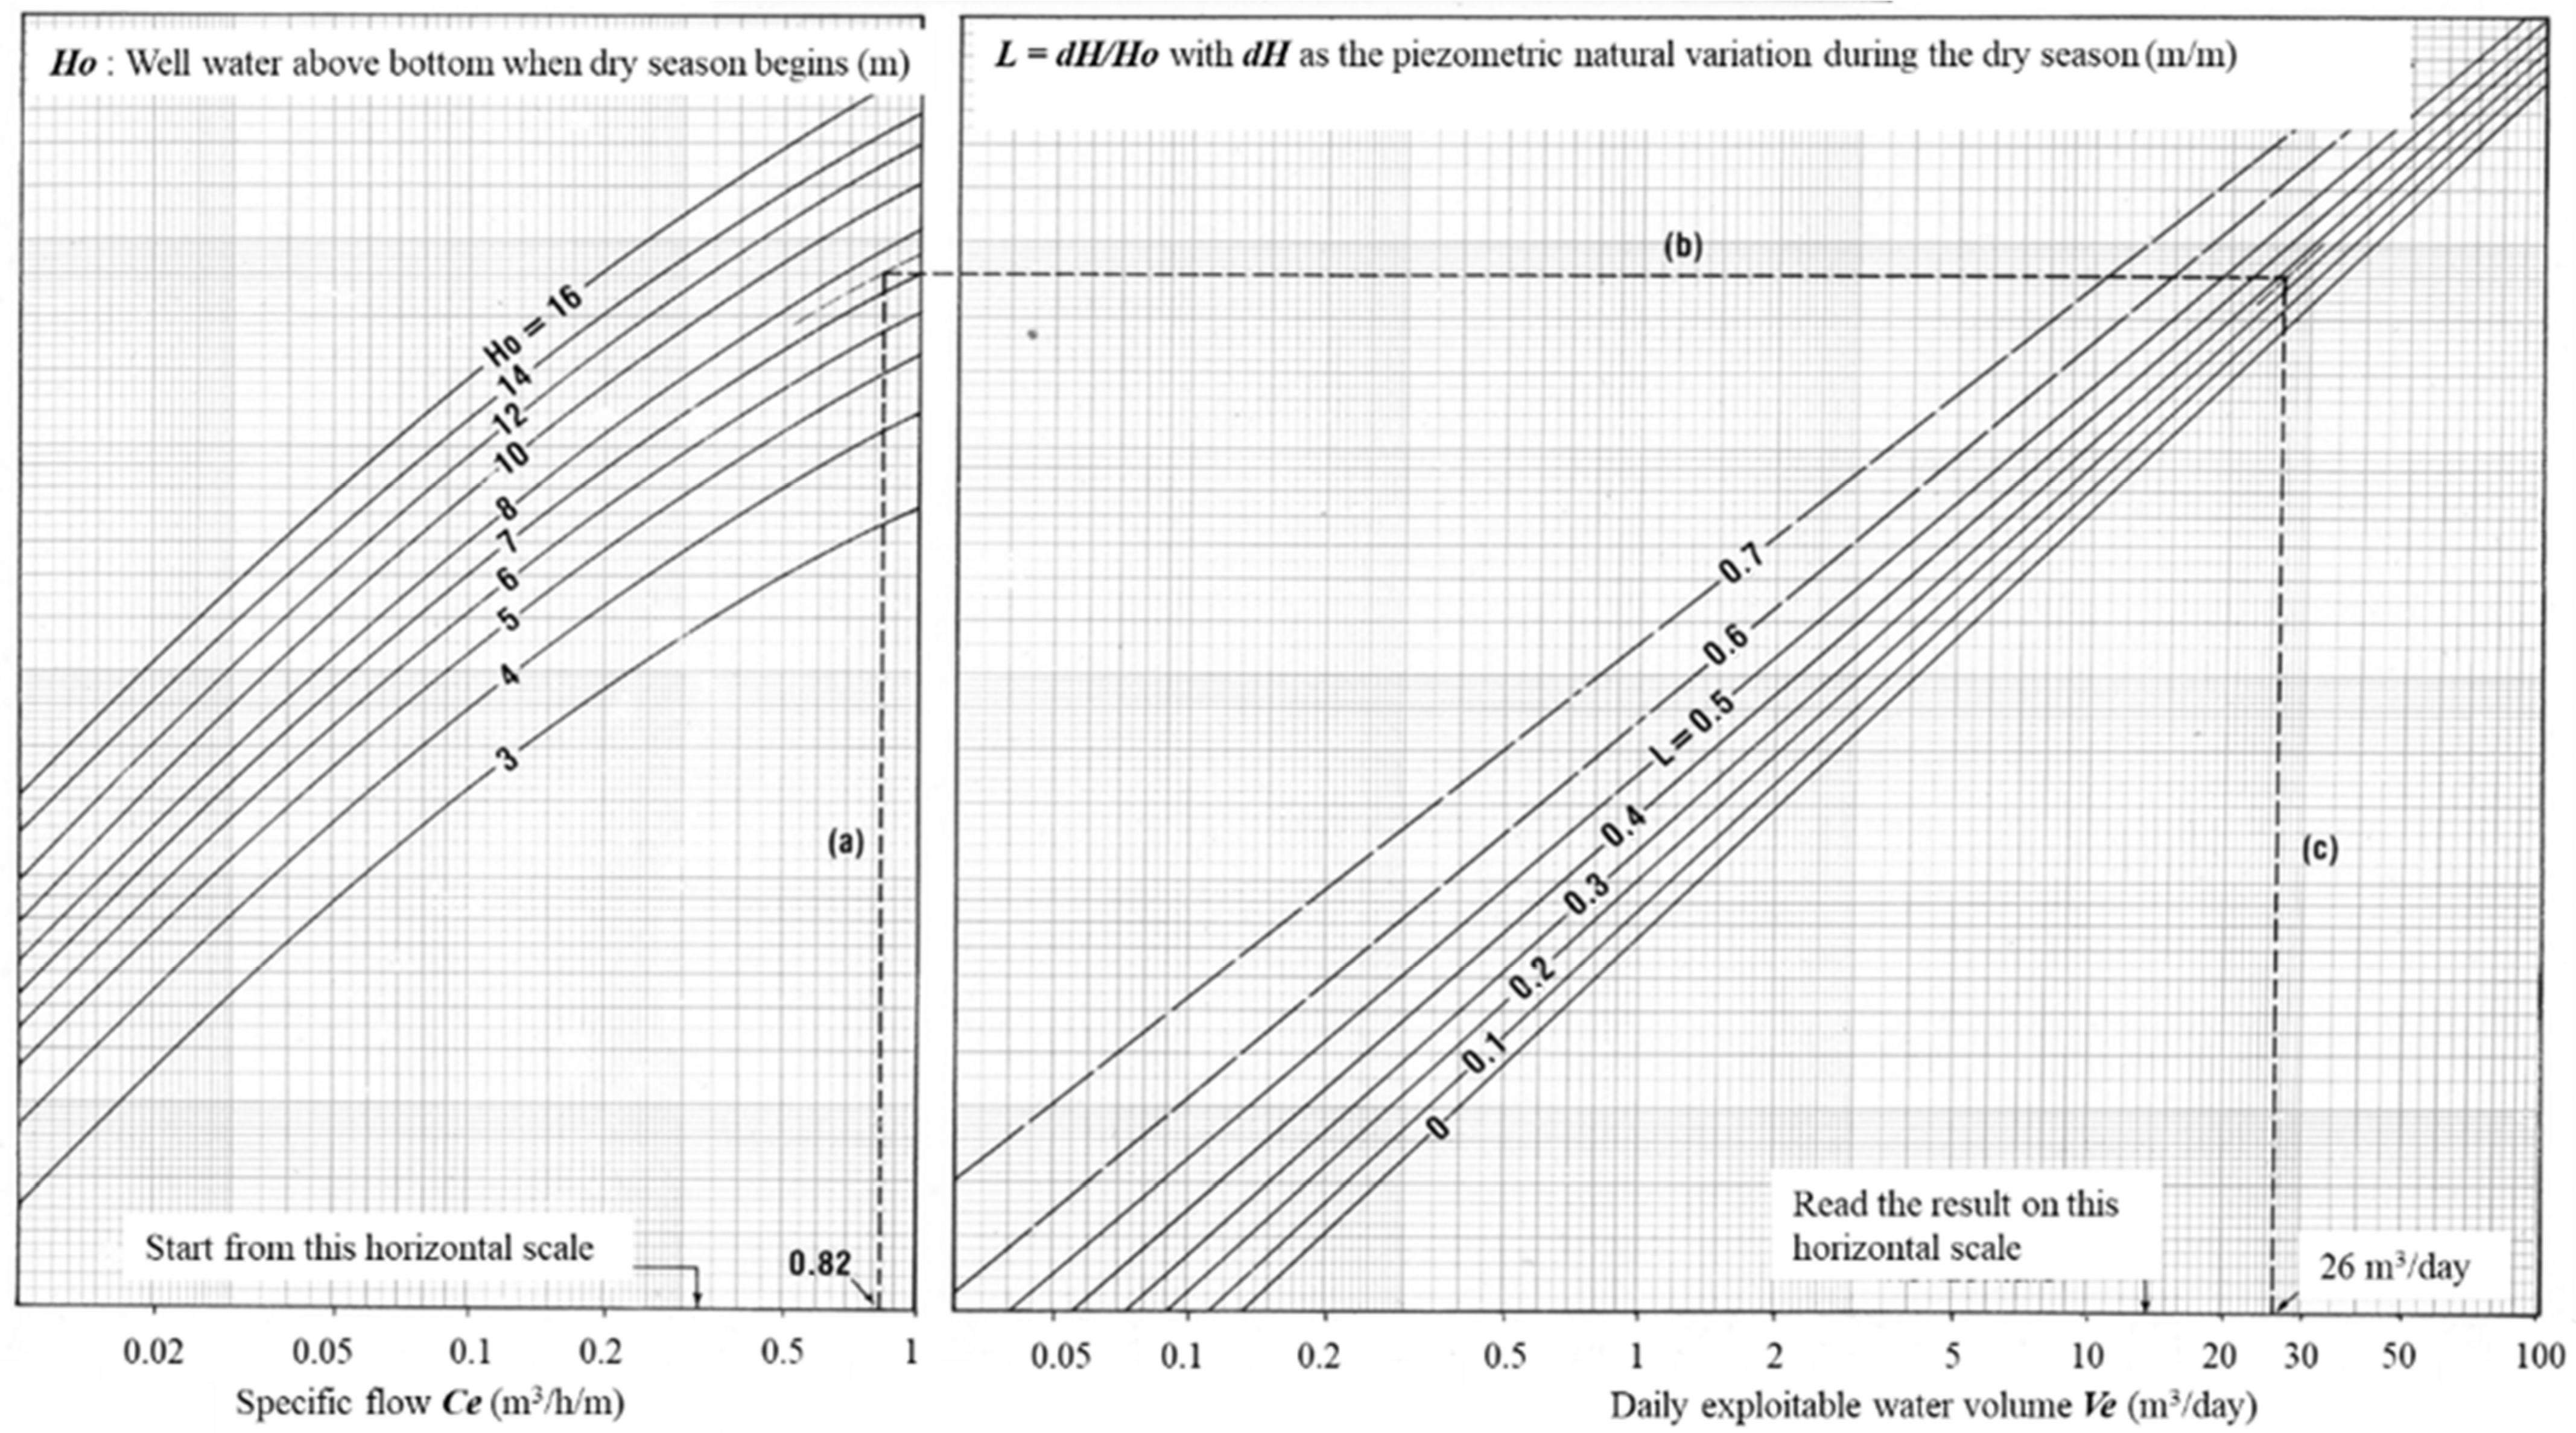
2.7.3. Determination of the Specific Flow Rate Ce (m3/h/m)

The instant flow rate across the well wall at the end of pumping (Phase 2) is provided by the expression:
Q i = V s R 2 = ( π D 2 4 1 ) R 2
where Qi is the instant flow rate across the well wall, in m3/h;
R2 is the ascent flow rate, in m/h;
D is the diameter of the well (m);
Vs is the specific volume of the well, in m3/m.
The specific flow across the unit height of the well wall, which is proportional to the instant flow rate (Equation (6)) but inversely proportional to the drawdown, Si, at the end of the pumping phase (Figure 3) is provided by:
C e = Q i S i
where Ce is the specific flow rate, in m3/(h·m);
Qi is the instant flow rate across the well wall, in m3/h;
Si is the dropdown at the end of pumping (Phase 2), in m.

2.7.4. The Well’s Daily Exploitable Volume of Water, Ve

The daily exploitable water volume, Ve, is a function of three variables (Ce, L, H0) established in Equations (4), (5), and (7). The abacus in Figure 3 is used to compute the values of Ve (m3/day). These values are considered when planning to use the well for any purpose, especially for irrigation.

Crop Yield Assessment

Yield squares were used to calculate the average yields and productions of the irrigated farm plots in each of the 10 irrigation systems. Thus, with a metric ribbon and stakes, 5 to 7 squares of yield were marked covering the entire one-hectare farm. This ensured that an entire square was in the plot of a single farmer. Then, the crops harvested in the square were weighed with a scale. The yield of the crops (especially onion bulbs) was assessed from these measured data.

3. Results

3.1. Water Availability: Reality or Illusion?

For all 10 sampled sites of the investigation, it was possible to describe the key factors of water availability in detail. Table 2 presents this description. The important factors selected were: (i) the climatic zone, (ii) the number of wells on the irrigation site, (iii) the diameter and depth of the wells, (iv) the static level on the date of the investigation (January–February), (v) the distance to the lake nearby, (vi) the flow rate per pumping test, and (vii) the daily available flow as assessed by the CIEH method (Equation (7)). The data in Table 2 indicate that a total of 32 lined wells were built, with an average of 3 wells on each 1 ha irrigation scheme area.

3.2. The Adverse Impact of Climate and Clay

Of the 32 wells, 12 were dug in the Sudano-Sahelian zone, where, as a reminder, the rainfall is 650 to 900 mm/year (Figure 1), the rest being located in the more arid Sahelian strip, with 300 to 650 mm/year. It also appeared from the results (Table 2) that the wells had a diameter of 1.80 m and a depth, P, measured in January–February 2019, which was variable according to the irrigation scheme, the maximum being 15 m in Ansouri and the minimum 4.2 m in Ladwenda. Static levels, Ns, measured in January–February also varied from 3.3 m in Ladwenda to 10.8 m in Tangasgo in the Sudano-Sahelian zone. Values were not available for four sites, but a strength of the CEIH well-performance-checking method is that it does not prevent conducting the test and calculating (Equations (4), (5), and (7)) the daily available water volume, Ve (m3/day). The wells were resolutely dug in subsoils mainly composed of clay, as indicated by the geology of the area. Pumping tests carried out on six wells at the sites provided a daily available water volume flow ranging from 0.0 to 6.1 m3/day, far below the 80 m3/(ha·day) required for onion in the region (see FAO database CLIMWAT for CropWat 8.0).
With the exception of Louda—where vegetable growing continues until April during the dry season—production was stopped in mid-March on all the irrigation schemes after a single season, and from October to March it was mainly devoted to the production of onion bulb. However, the objective of determining the “availability” of water was clearly visible in the fact that half of the 10 sites were located near dams, hoping for a long-term highwater table [23]. In terms of the presence of water in the clay soil, it appeared that, from October to early March at all sites, water was visible in 95% of the 32 wells. However, the presence of water is not an indication of its availability for irrigation. Indeed, clays have very low permeability, and they “hardly release water,” thus resulting in flows too low to irrigate in an area as big as only 1.0 ha [24].
This partly explains the reasons for the failure of the Nare underground dam built in 2003 in Sanmatenga in Burkina Faso [25]. One of the objectives was to irrigate an area of at least 0.25 ha, but the low flows were a constraint that hindered the development of the perimeter. In fact, for gravity irrigation, the required equipment flows in Burkina Faso were 3 to 6 L per second per hectare, 10 to 20 m3/(h·ha); flows fell to 5 to 8 m3/(h·ha) for sprinkler irrigation, and even to 2 to 5 m3/(h·ha) when drip irrigation was practiced [26]. However, as the measured data indicated, the flows on the sites reached a maximum of 0.25 m3/h, obtained in Louda on Sahelian sandy ground, the flows in clay soil being lower on all other sites. This is one of the main reasons why the entire area of 1.0 ha could not be exploited on any of the 10 sites of the project.

3.3. Surface Pumps Are Inappropriate for Extracting Water from Wells

To solve the problem of water unavailability in wells for the purposes of expanding the areas of exploited traps and/or the possibility of undertaking a double dry season campaign, the BRACED project proposed over-digging the wells up to approximately 20 m in depth and to adapting the pumping equipment. This would provide a larger volume of vacuum to drain and store the water seeping from the clay soil to be pumped for irrigation the next day. However, the adoption of such a solution requires the replacement of surface pumps with submerged pumps to stop the current descent and ascent of said surface pumps in the wells in order to bring them closer to the free surface of the water. Not only were the surface pumps not suitable, but they would also have broken down as a result of cavitation [27]. In addition, descent/ascent is a hard job, with a risk of falling. The main hydraulic problem remained the too-high suction height. Even if submersible pumps were chosen to solve this issue, the very low daily available flow Ve of 0.0 to 6.1 m3/day would not secure water for the women farmers on the 10 irrigation schemes. In fact, even with an evapotranspiration ET0 of 80 m3/(ha·day) for onion, for example, the crop needs could not be met.

3.4. Water Distribution: Reliable or Disillusion?

3.4.1. Inequity and Smallness of Plot Sizes

The variations and small sizes of the farm plots within the same irrigation scheme drew attention to problems that needed to be solved. At first, the high demand on waterpoints was greater when water resources were scarce. Therefore, one might logically have expected that inequities would be more exacerbated in the Sahelian zone than in the Sudano-Sahelian zone. However, based on the data (Table 3), it appeared that inequity was not related to the climatic zone because Niou and Kouassanga—in the Sudano-Sahelian zone—and Ansouri, Rouni, and Raka—in the Sahelian zone—were indifferently affected. The explanation could not, therefore, be purely technical. In fact, the investigations revealed that the variations in the allocated plots of land were generated by the “avowed inability” of the concerned farmer to exploit their entire farm plot. Initially, each women’s farming group made an egalitarian distribution of the project area according to the number of voluntary farmers. Subsequently, various reasons were invoked by some women—the arduousness of drawing from deep-water wells, the arduousness of transporting buckets and watering cans on their shoulders after drawing, the lower experience of some in terms of using equipment—to de facto reduce the exploited area of their farm plots. Other women farmers were then asked to develop the abandoned land, resulting in inequities. Thus, the combined effects of the difficulty of water extraction, the distribution of water, and the limited experience in market gardening of the women farmers led to an additional reduction in the areas of the already small plots.
This situation highlighted a particularity of small-scale irrigation. When small-scale irrigation arises from family demand and the need for financial support, chances are great that maintenance and exploitation will be more regular than when it is undertaken by a group of farmers for whom no clear responsibility is set related to the sustainability of the common infrastructure. Reducing the size of the scheme [11] is not enough to boost performance. Consistent plot sizes and adequate water distribution equipment should be provided to women farmers. In fact, the greater the number of farmers to whom farm plots are assigned within the same small-scale irrigation scheme, the closer the maintenance issues are to the ones with large-scale irrigation systems, not to mention the critical issue of the financial viability of the farmer’s income.
In order to encourage the full and equitable operation of the allocated plots, it is necessary to remove the three constraints of (i) difficult water extraction, (ii) arduous water distribution, and (iii) the limited experience of women operators in the use of equipment. The BRACED project and its partners, the local NGOs, clearly perceived these problems, although it is regrettable that this came late, only a few months before the closure of the project.

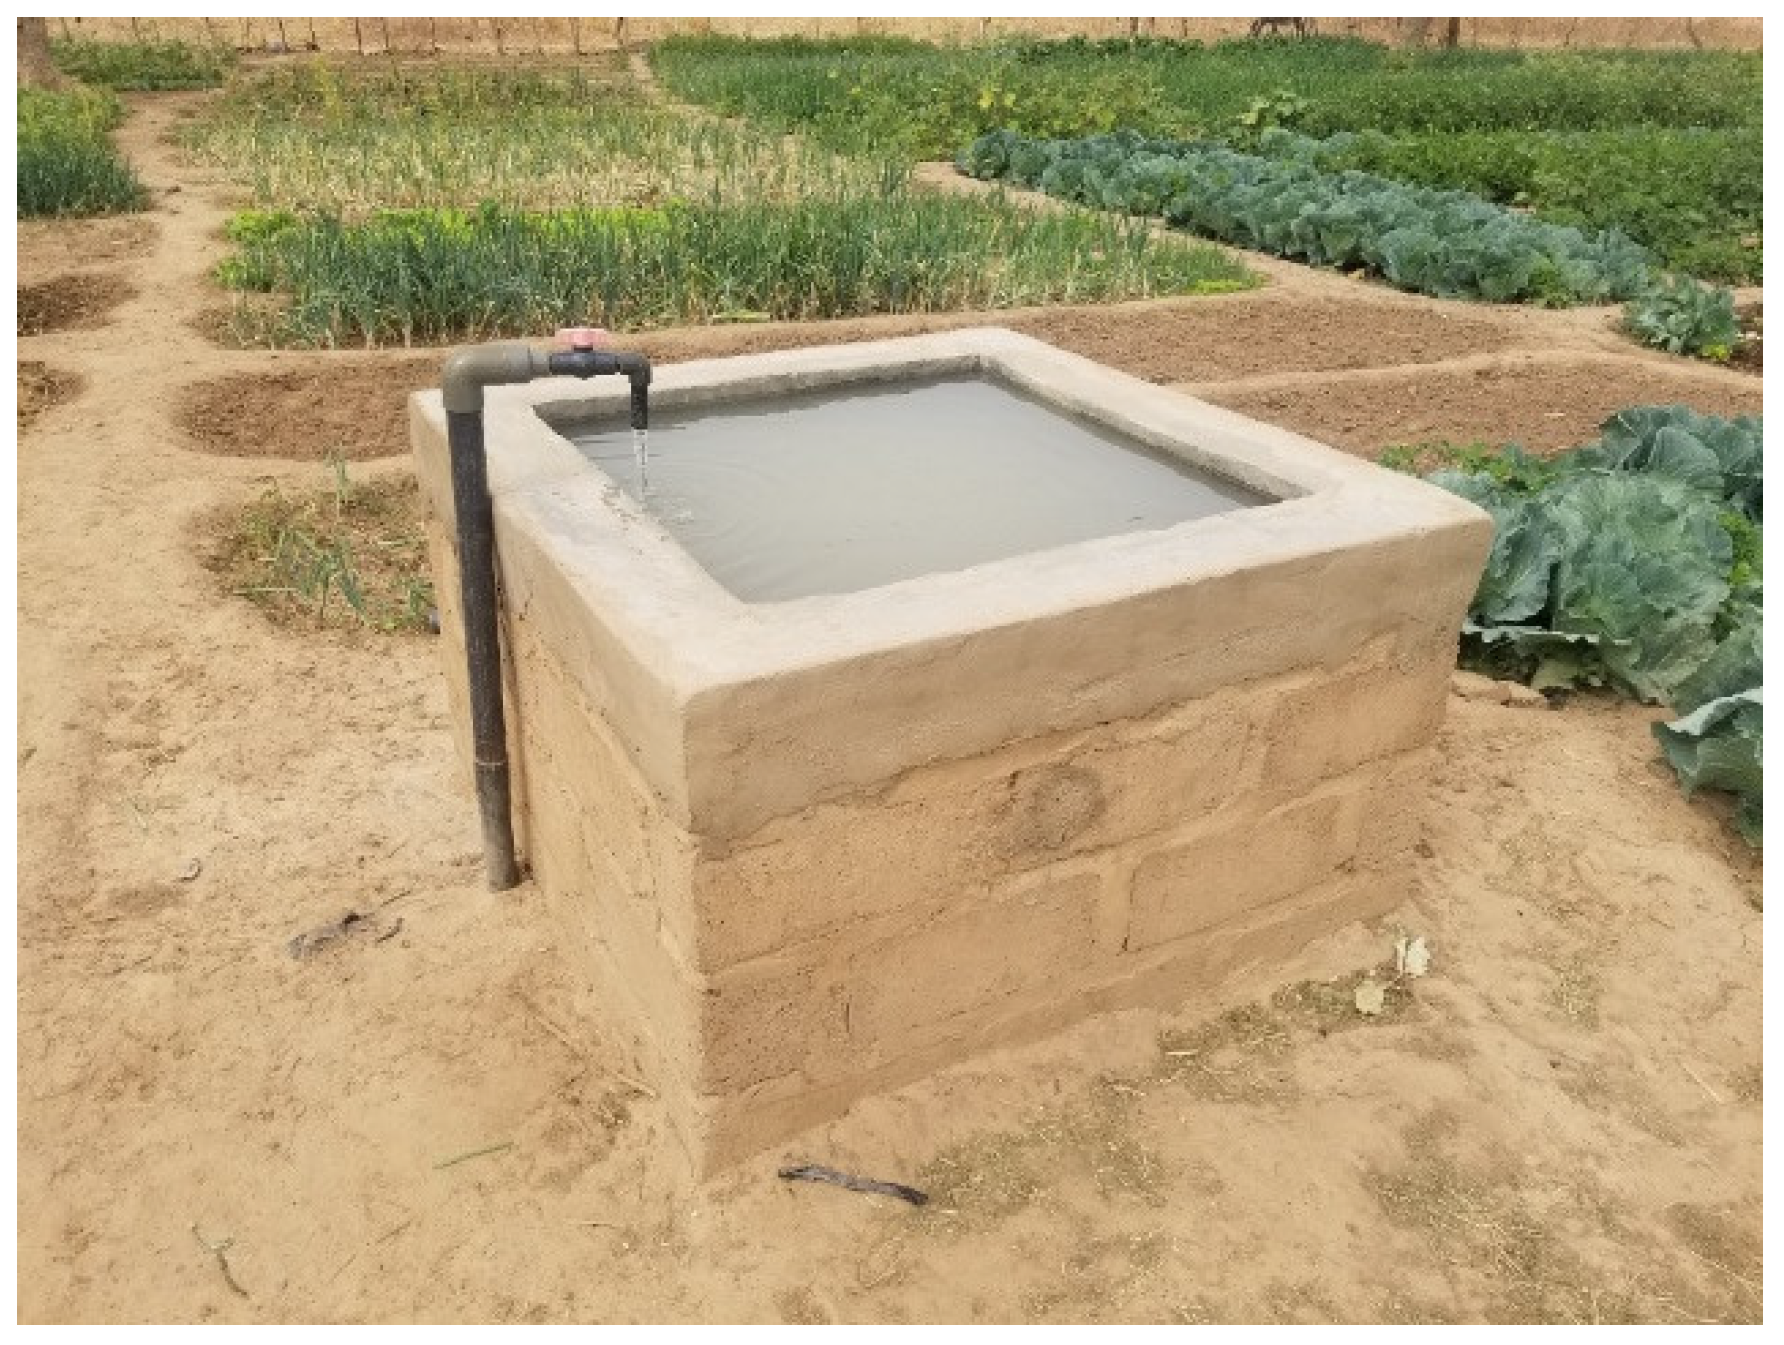
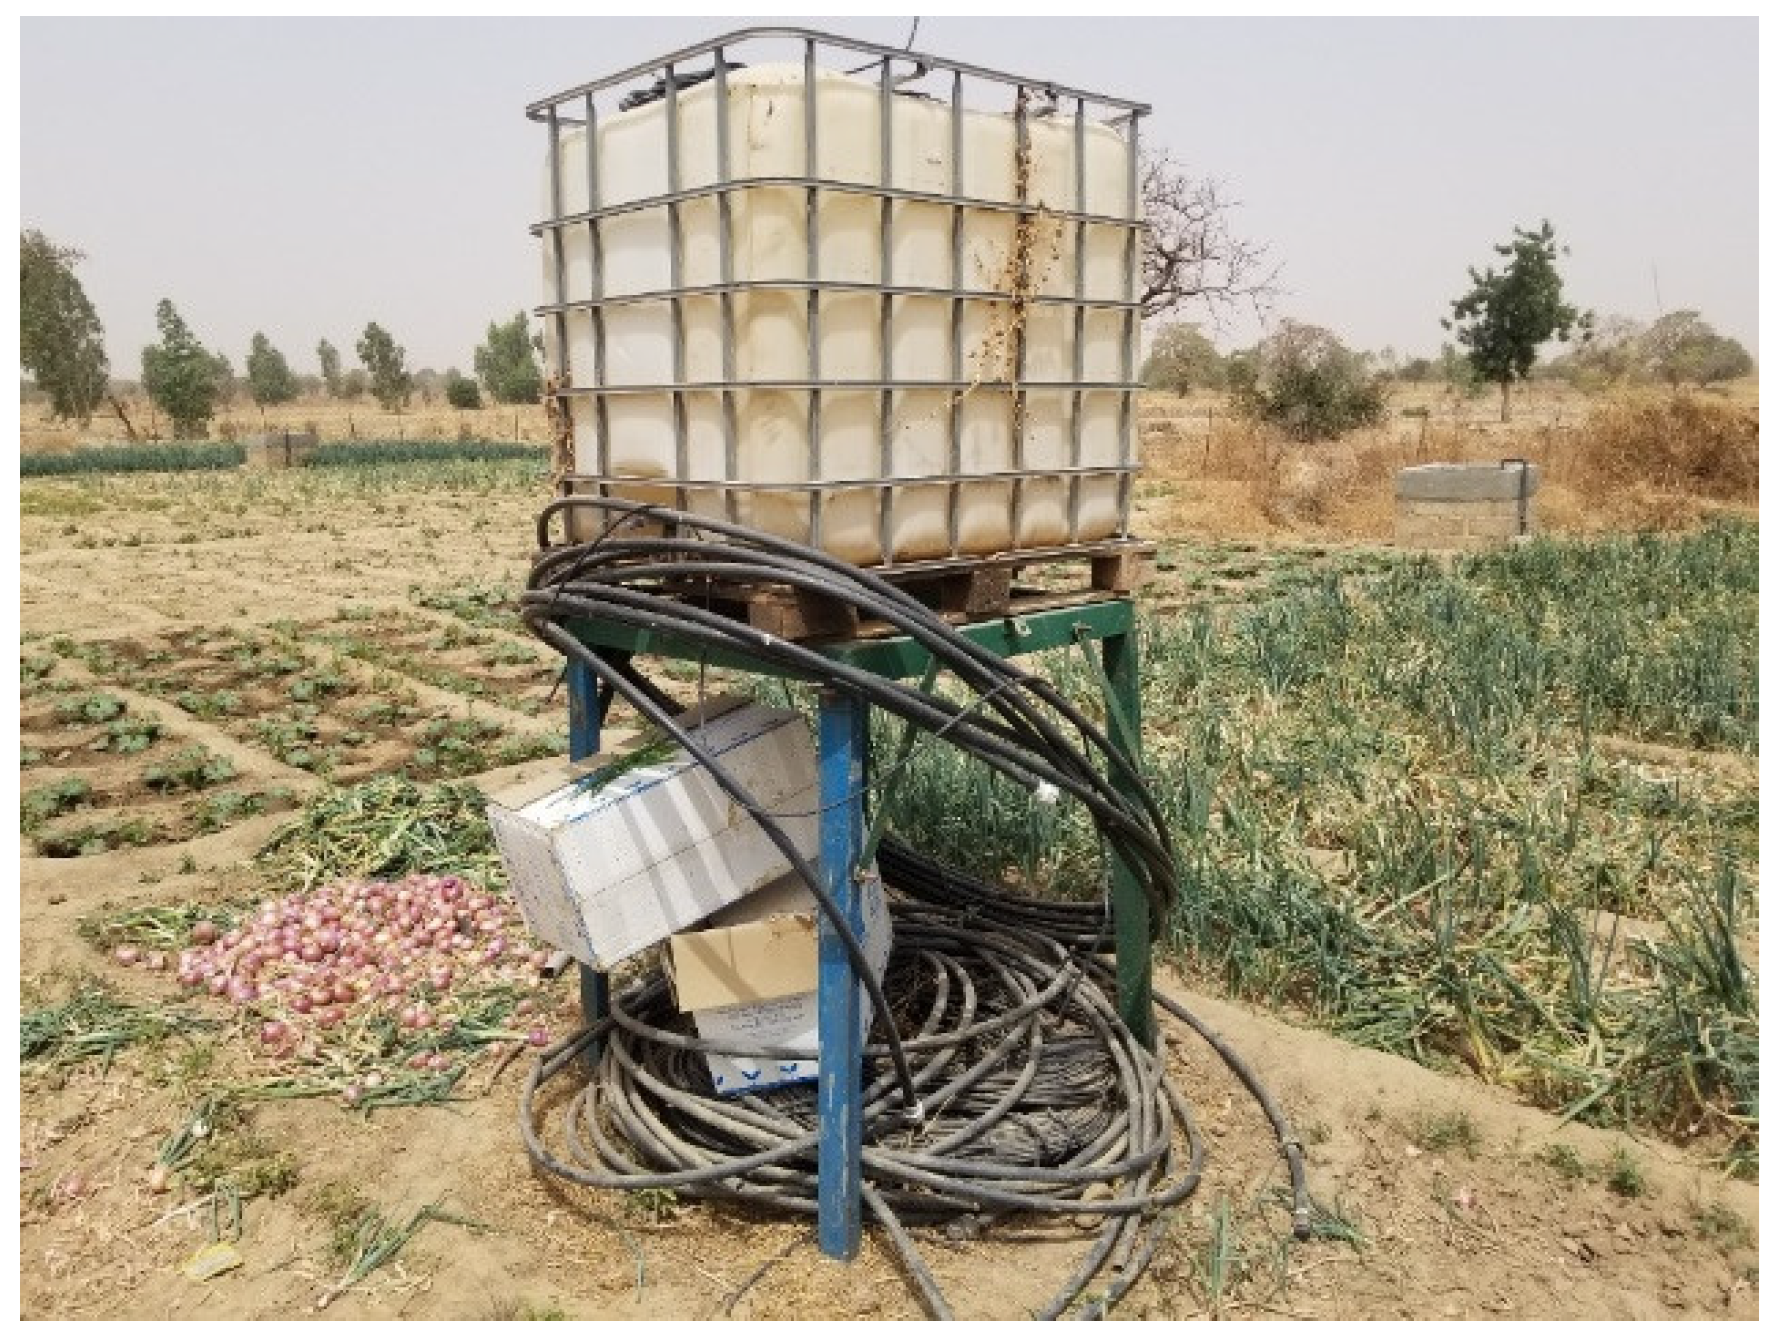
3.4.2. Difficulty of Water Extraction

The solutions provided by the BRACED project to the problem of water extraction were enthusiastically received but proved precarious, thus always calling for a better option. Indeed, the project had the excellent initiative to power the irrigation scheme pumping with photovoltaic solar energy. The solar pumps supplied were surface pumps—therefore intended for pumping surface water from bodies such as ponds or lakes—from the Indian manufacturer Jain, with a nominal flow rate of 45 L/min (or 2.7 m3/h) and a total manometric height (HMT) of 40 m (model JSPB0.3/HF 2.4–5). A total of two or three were installed per site to serve two to four wells. Each pump was delivered with a solar panel of 315 Wc. As mentioned above, these surface pumps should have been replaced by submersible solar pumps to allow for the safe and sustainable pumping of a water table that reached a depth of more than 12 m in the dry season. Pumping groundwater to a depth of more than 6 m leads to the cavitation (destruction of propellers) [27] of the pumps and their destruction (Figure 4). A survey 6 months after the end of the project revealed that 50% of the pumps were broken down. In May 2022, all the irrigation schemes but Louda’s (close to an empty reservoir but with shallow groundwater) were broken down and abandoned, with the metallic grid fences rolled up to avoid—according to the farmers—useless destruction by divagating animals.

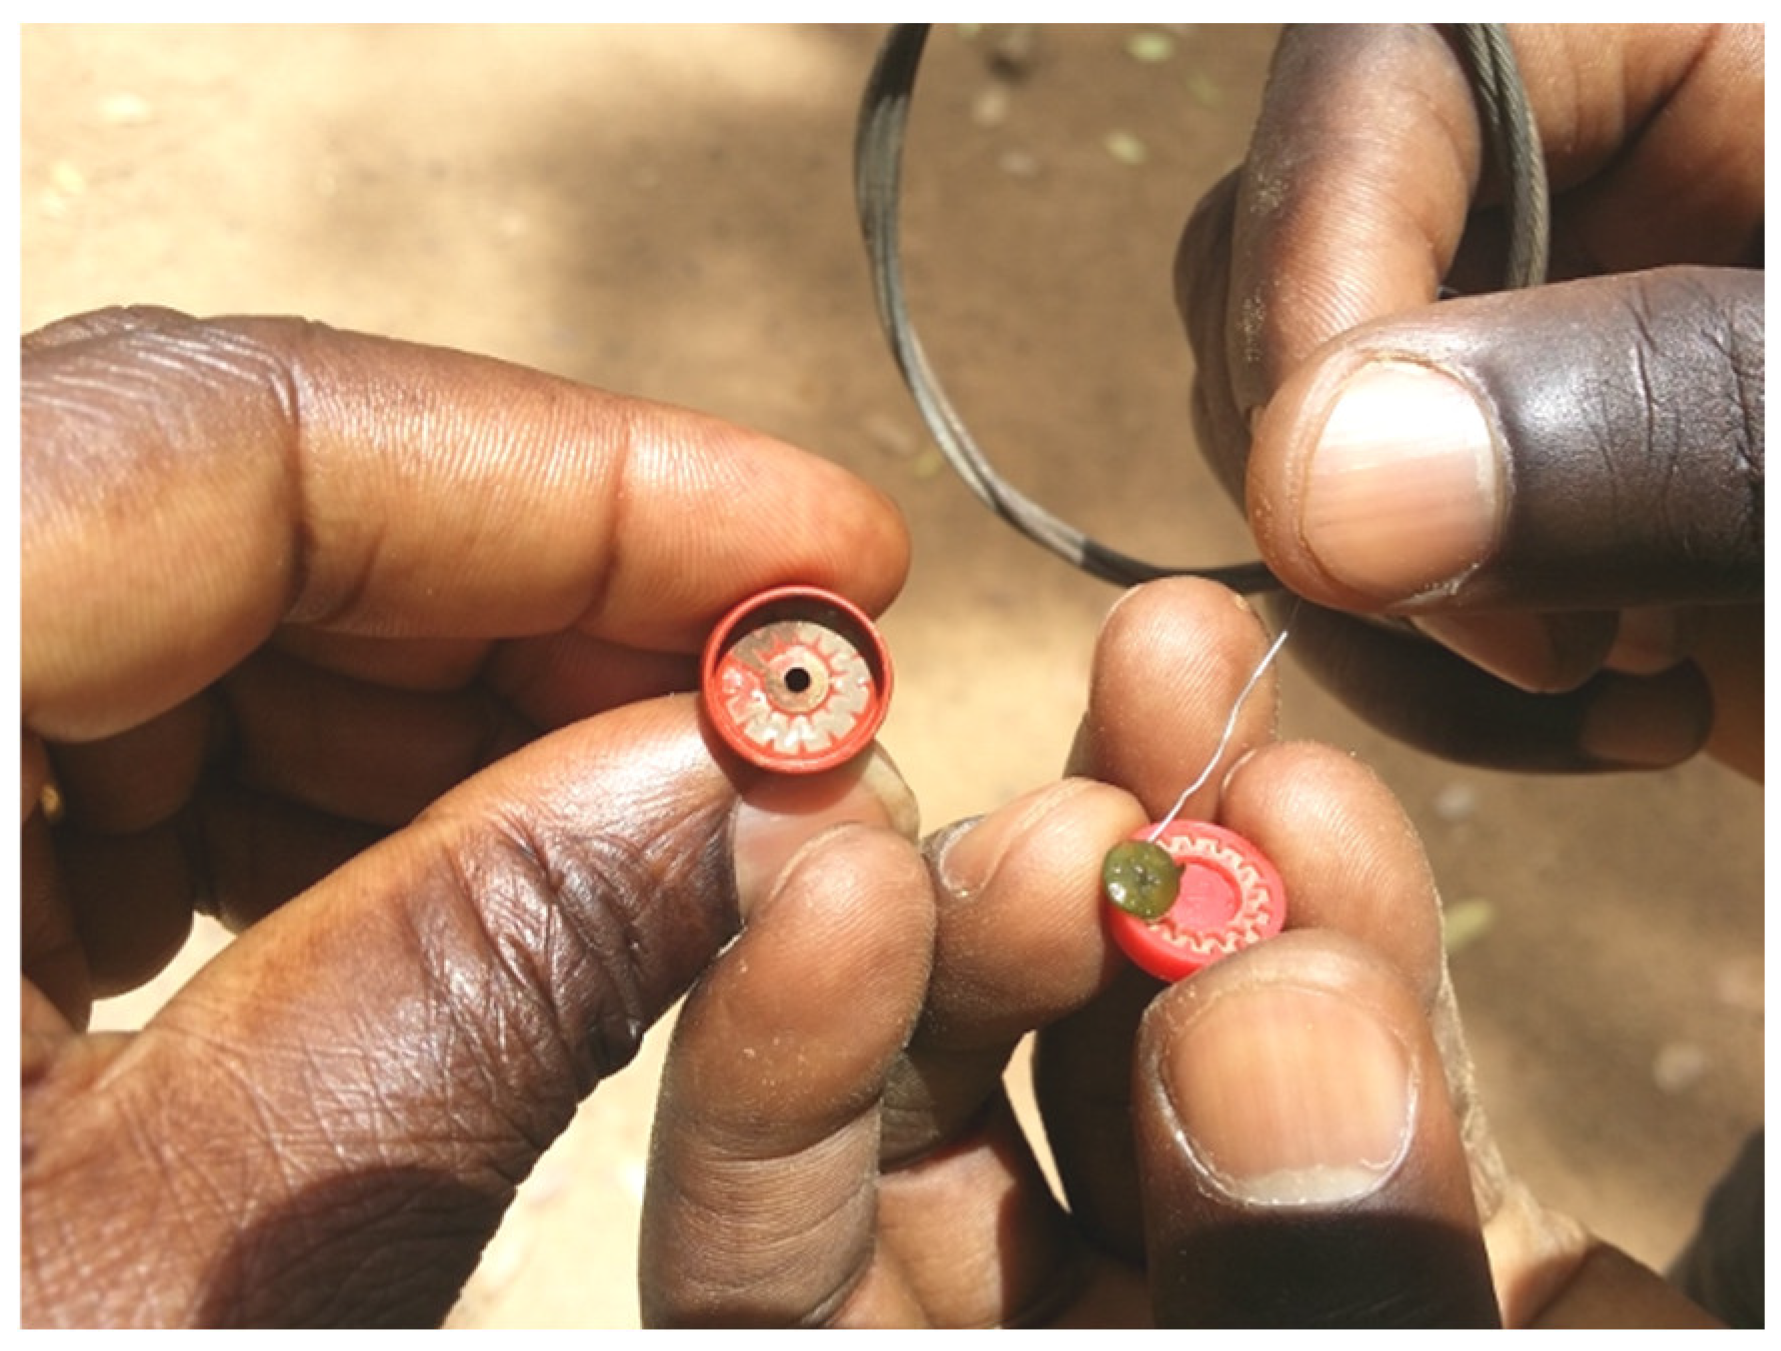
3.4.3. Burdensome and Inefficient Water Distribution

Similarly, the solutions provided by the BRACED project, aimed at alleviating the arduousness of the distribution of water to plants, were well appreciated by the farmers in the beginning, but they later showed their limits, leaving open the possibility for improvement. In fact, to solve the issue of arduousness, square basins of 1 m3 volume were built [28] to store the pumped water and allow its recovery by operators filling the watering cans, which would then be poured on the crops in the plots. The typical basin was a cement brick and mortar structure, with a surface area of 1 m2 delimited by low walls emerging about 1 m above the ground (Figure 5). The judicious distribution of a sufficient number of basins on 1 ha (between six and eight basins) undoubtedly reduced the travel time of the operators to the water from the well, but the work remained essentially arduous. In addition, it seemed that there was not enough communication with the operators—who were already making use of rustic ponds in market gardening—about a better way to build these basins. Field investigations and interviews with farmers indicated that the basins had three main weaknesses: (i) they required crossing an obstacle—the wall, which was 1 m high—to collect the water; (ii) they were not suitable for pregnant women; and (iii) they did not alleviate the arduousness of water transport by women farmers, who carried two watering cans at the same time at arm’s length and regularly complained of muscle and joint pain.
By closely observing the pre-existing rustic basins and interacting with the beneficiaries, we determined that a more optimal basin would be a cylindrical one, but with the notable difference that the wall should be half—i.e., 50 cm—embedded in the ground, thus leaving only 50 cm aboveground. This model would at least eliminate the obstacle of the low wall and would correspond to local habits.
The arduousness of distributing water to plants required the implementation of appropriate technologies for transporting water from wells and directly distributing it to crops. The BRACED project and its partners also clearly perceived this necessary evolution. However, they proposed a low-pressure (0.1 bar) drip irrigation kit solution, confident that this would solve the difficulty. Although the material stored on the premises of the BRACED partners at sites such as Niou was visible, among the 10 irrigation scheme sites in this study, it was only actually installed and tested in Kouassanga (Figure 6). The typical kit included (i) a cubic plastic tank of 1 m3, placed on (ii) a metallic support 1 m high; the tank transferred water to (iii) a 20 m pipe serving as a manifold, which, in turn, fed—through a central valve—(iv) a series of 20 parallel 10 m laterals. The lateral spacing was therefore 1 m. The tank was filled by hand or through one of the solar pumps delivered to the irrigation scheme. This system could have alleviated the arduousness of transporting and watering had it not had weaknesses that were quickly exposed on the ground. In Kouassanga, farmers explained that they benefited from a quick presentation of the system after its installation by the selling enterprise. During the implementation—again according to the operators—they encountered a considerable difficulty: the tank emptied into the laterals as soon as the central valve of the manifold was opened, forcing them to fill the tank frequently. This difficulty had already been encountered with the basins but was exacerbated by the drip kit that fed 20 laterals at a time.
Although it was the most immediate, this difficulty was not the most serious of the low-pressure drip networks. The main problem was the threat to the sustainability of the system, namely, clogging [29]. Clogging in these networks was almost inevitable because of the low pressure, which favored the deposition of particles wherever the water velocity was low. This occurred even when the water was filtered and cleared of fine particles such as clays. From a well or even a borehole, the plug took the form of limestone or ferric iron precipitation [30] or the development of algae directly in the drippers (Figure 7). Even high-pressure (more than 4–5 bar) and well-filtered drip networks have this clogging problem, which is partly solved by (i) a decrease in risk from high pressure, (ii) a more complex filtration system that includes sand filters and disc filters, and (iii) the treatment of the network with commercial non-acidic anti-clogging agents to destroy algae and disperse clays [31]. It immediately appeared that such a filtration and maintenance device exceeded the current technical level of the farmer in the Sahelian zone. Thus, although drip irrigation technology was the subject of surprising publicity and enthusiasm, it seemed that the small farmers of the Sudano-Sahelian and Sahelian zones were not yet ready to adopt it [32]. On the other hand, while offering important advantages in terms of water saving (2 to 5 m3/(h·ha)), the microsprinkler is not as sensitive to clogging and does not require a complex frequency and level of maintenance. Furthermore, it can bring consistency to the shapes and colors of fruit, as well as create a milder microclimate in the dry Sahelian environment [33]. For more than 20 years (beginning in 1998), the International Institute of Water and Environmental Engineering (2iE) has been implementing an experimental space of 0.5 ha in Kamboinsé, where drip and microsprinklers are applied. The conclusions are clear: the experiment indicated that microsprinklers are a more sustainable and climate-suitable technology [34] for Sahelian small farmers if they are provided with a pressure of at least 1.5 bar and a sufficient water flow of at least 5 to 8 m3/(h·ha)—not from wells, but real boreholes in the crystalline basement rock.

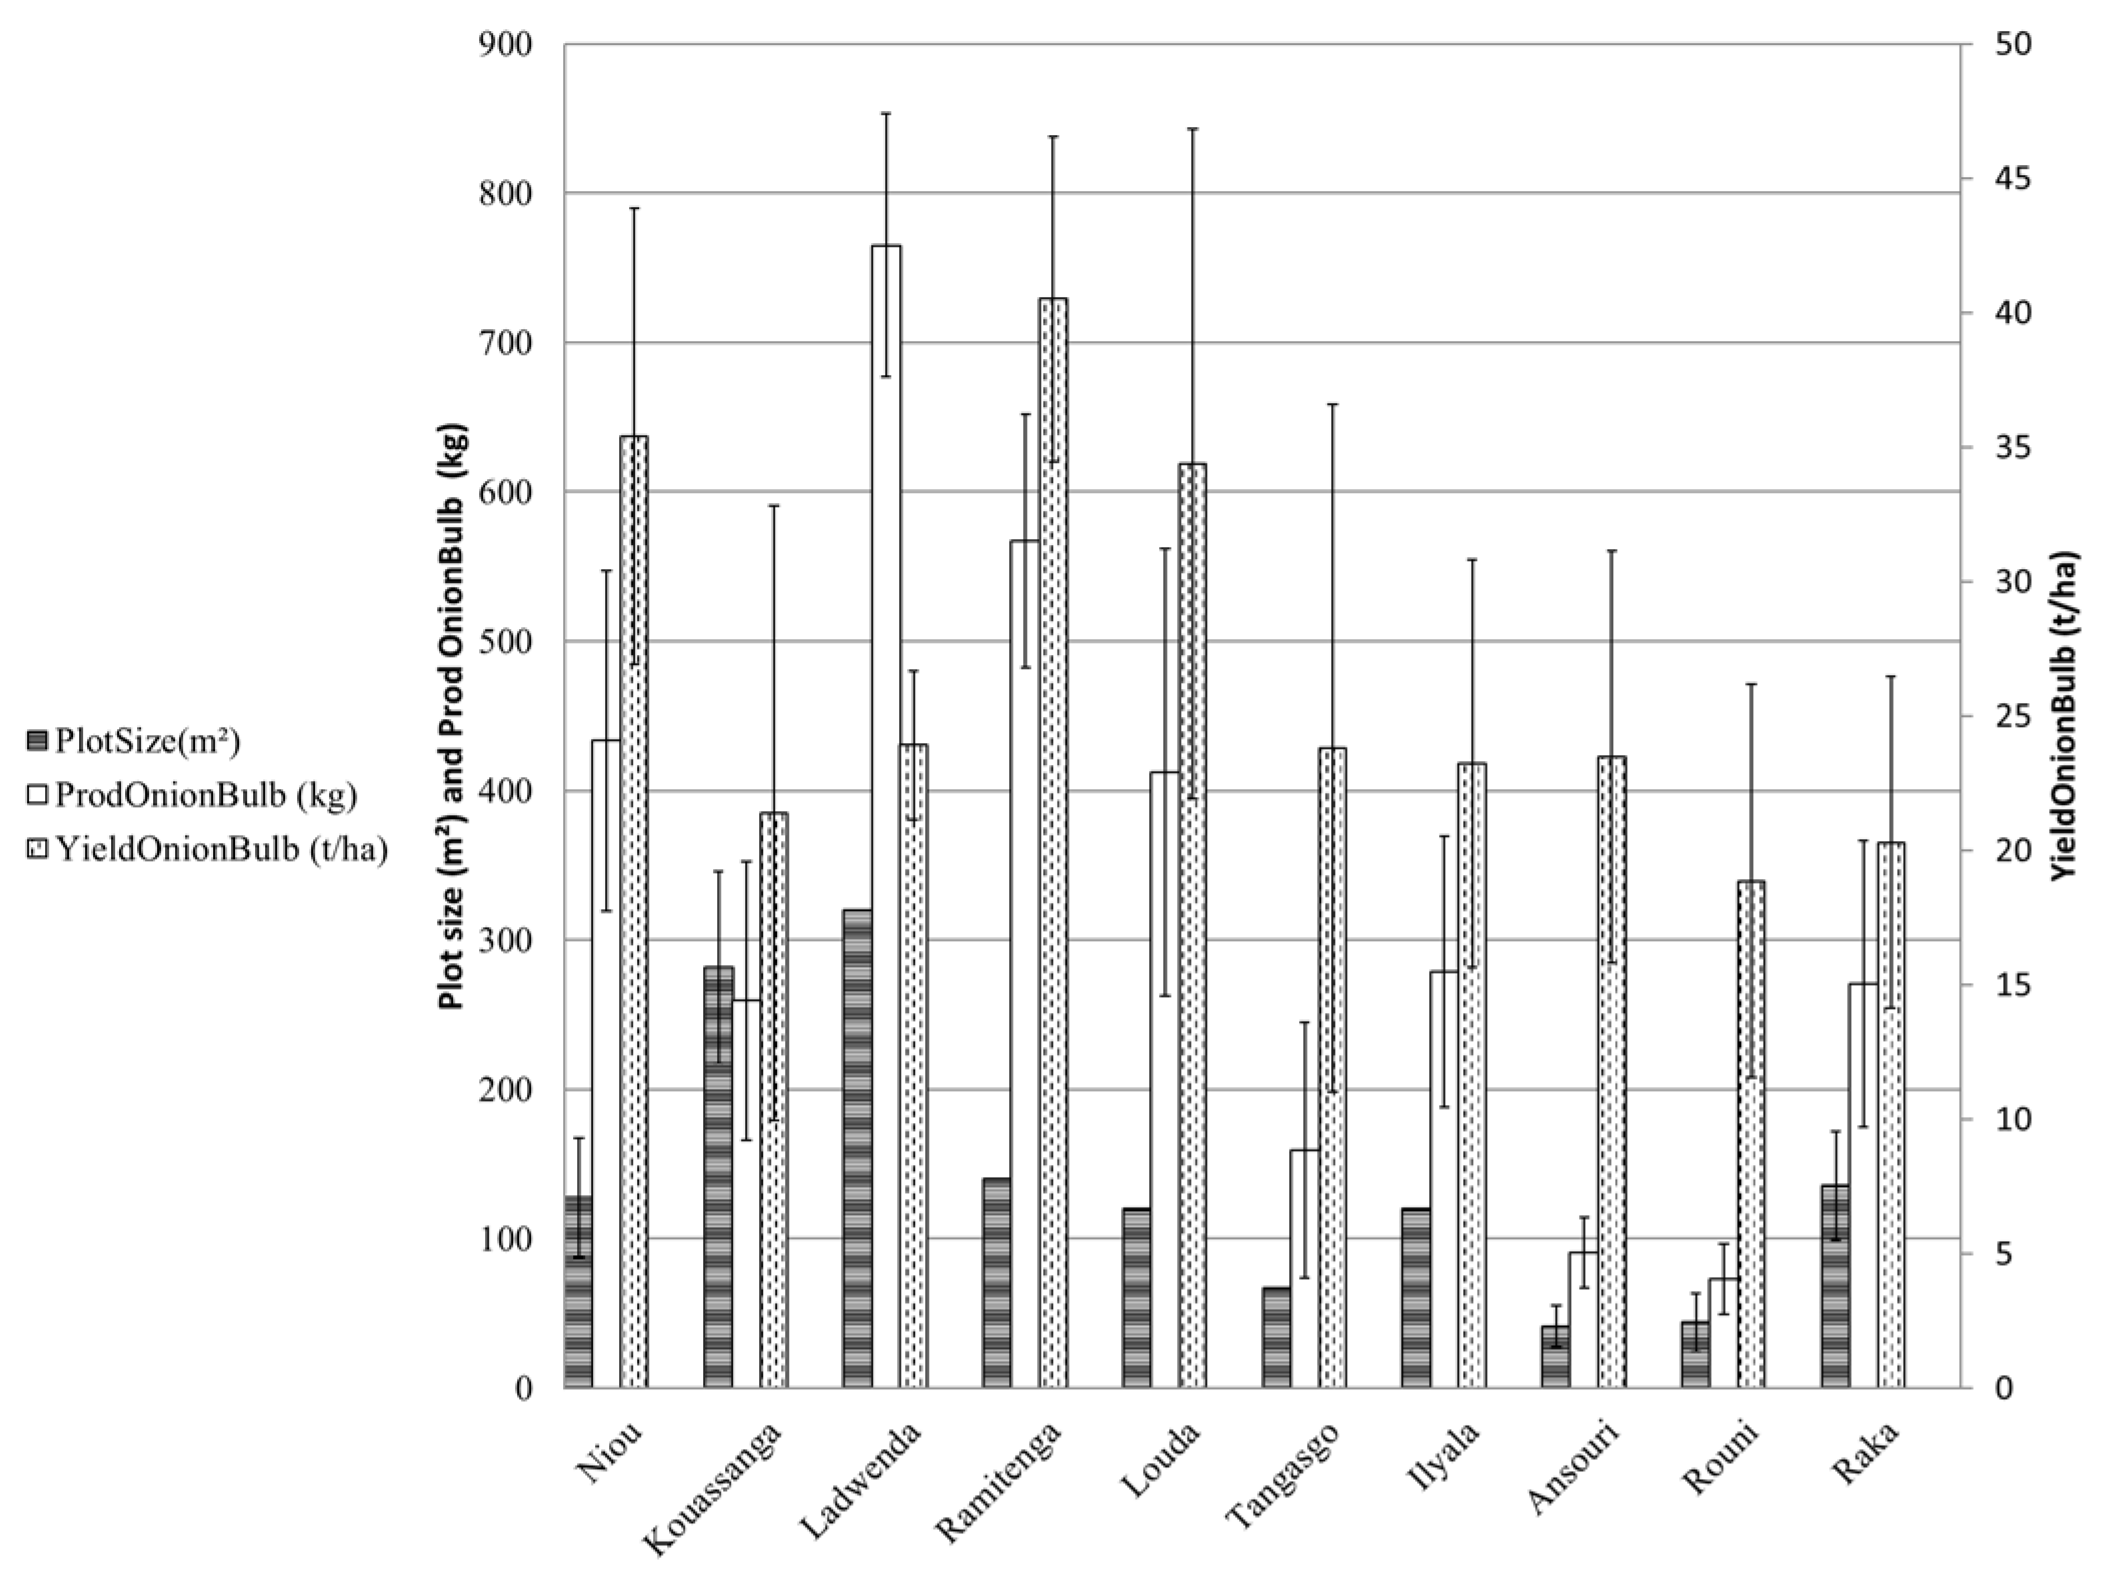
3.4.4. A Poor Irrigation Service Leading to Low Production

While onion bulb yields were good, production remained low across all irrigation schemes (Figure 8 and Table 3). To judge the quality of the yields, they were compared with those obtained at research stations or in the literature. The best yields reported in the literature on the onion bulb were 30 to 35 t/ha [35]. Average yields of 20 to 34 t/ha observed in the irrigation schemes, therefore, highlighted an excellent performance in terms of the productivity of the land unit exploited. The case of Ramitenga, with its 41 t/ha, is mentioned here because the production initially reported by the first person in charge of the grouping was exaggerated (double the values displayed in Table 3, in fact). Despite the limited water resources, this result can be explained by several factors. First of all, the producers present were, in fact, those who were the most motivated because they were not discouraged by the arduousness of the manual water distribution process, and they were more inclined to accept advice on technical matters relating to seeds, plowing, fertilizer applications, and harvesting. Then, because of the small size of the farm plots, 41 to 282 m2—barely the surface of a housing plot in Ouagadougou—control of the production factors was higher, as demonstrated by many studies [36]. The producers could have counted on significant production if the low areas had not only produced 73 to 400 kg of onion bulb per farmer in all 10 irrigation schemes. By way of comparison, an area of 1/5 hectares (or 2000 m2)—which is the most common farm plot area on irrigated developments downstream of dams in Burkina Faso [37]—with an onion bulb yield of 20 t/ha would lead to the production of 4 tons.

3.4.5. Need for Reliable Water Resources

The development of resilient small-scale irrigation in the Sudano-Sahelian and Sahelian zones cannot be achieved without an engineering strategy that respects the constraints of these areas. The first of these constraints is water availability (Table 4). Burkina Faso is 90% located in the crystalline basement zone, and hydrogeological water resources are mainly located in fractures with low flows, often less than 5 m3/h [38]. Table 4 shows the characteristics of 149 boreholes in the vicinity of the 10 sites of the BRACED project. It appears that the layer of rock alterations, mainly of clay, regularly exceeded 20 m thickness, a depth greater than those of the wells dug. In addition, drilling failure rates were high—on average, 60%—suggesting a bleak outlook for groundwater irrigation. It was still possible, by paying attention to the estimated flows (Table 4), to find boreholes of 5 m3/h [39]. Solid geophysical investigations, prior to any drilling, must make it possible to identify such waterpoints. By associating microsprinkler irrigation with these boreholes—and not drip irrigation, whose clogging constraints are difficult to solve for smallholders—a real sustainable rural development can be triggered [40]. Networks for a 1 ha irrigation scheme, including a water tower of at least 30 m3 placed at a height of 15 m, are expensive and difficult to stabilize. In the AEPS (Simplified Drinking Water Supply System), networks currently designed in rural areas by the National Drinking Water Service (ONEA) rarely exceed 10 m in height [41]. In irrigation, the constraints are greater: it takes at least 1.5 bar (15 m) to properly operate a microsprinkler [42]. Because of these difficulties and the higher cost of water towers, this study recommends storing solar electrical energy on lithium iron phosphate (LiFePO4) batteries with a life expectancy of 12 years to allow for irrigating at night. These batteries are durable, and lithium is currently the object of active research into its recycling in order to reduce the environmental footprint [43]. Such systems cost more than USD 6500, less per hectare than their equivalents with water towers, although their total cost—considering a 75 m deep borehole and a flow rate of 5 m3/h—is estimated at USD 62,000. A small reservoir 3 m above the ground could be used to meet domestic water needs. In such a system, irrigation is conducted by direct solar pumping during the day and by battery at night. This would increase the amount of water available for watering and irrigation at night. Increasing the area of the farm plots is an additional measure that can be taken to support the resilience of farms. Small areas lead to low incomes, even if the yields are excellent.

4. Conclusions

In this study, NGO-built small-scale irrigation systems in developing countries were investigated in terms of the sustainability and reliability of the water service and crop production through the cases of 10 irrigation schemes in the Sahelian country of Burkina Faso. It appeared that water availability was not ensured in any of the systems. Thirty-two wells were dug but all were located in subsoils mainly composed of clay. Pumping tests conducted using CIEH methods on six of the wells at the sites provided a daily available water volume flow ranging from 0.0 to 6.1 m3/day, far below the 80 m3/(ha·day) required for onion in the region. In terms of the water presence in clayey soil at all sites, it appeared that, from October to early March, water was visible in 95% of the 32 wells. However, the presence of water does not mean that it is available for irrigation. Clay has a very low permeability and “hardly releases water,” thus resulting in flows that are too low to irrigate an area of only 1.0 ha. Water distribution was also found far from the expected areas. Inequity in plot sizes did not seem to be linked with the climatic zone because Niou and Kouassanga—in the Sudano-Sahelian zone—and Ansouri, Rouni, and Raka—in the Sahelian zone—were indifferently affected. The investigations revealed that the variations among the allocated plots of land were generated by the inability of many farmers to exploit their entire farm plot. Beyond that, various reasons were given by the women—the arduousness of drawing from deep-water wells, the arduousness of transporting buckets and watering cans on their shoulders after drawing, and the lack of experience in terms of using the equipment. When small-scale irrigation resulted from family demand and the need for financial support, chances were great that its maintenance and exploitation were more regular than when it was practiced by a group of farmers for whom no clear responsibility was set related to the sustainability of the common infrastructure. Reducing the size of the scheme was not enough to boost performance. Consistent plot sizes and adequate water distribution equipment should be provided to women farmers. The negative impact of the previous finding on crop production was contested but visible. While onion bulb yields were good, production remained low across all irrigation schemes. The farmers could have counted on significant production if the small areas had not produced only 73 to 400 kg of onion bulb per farmer on all the 10 irrigation schemes. Increasing the area of the farm plots can be an additional measure to support the resilience of farms. Small areas lead to low incomes, even if the yields are excellent. Furthermore, field investigations and interviews with farmers indicated that the basins provided for water distribution had three main weaknesses: (i) they required crossing an obstacle—the 1 m high wall—to collect water; (ii) they were not suitable for pregnant women; and (iii) they did not alleviate the arduousness of water transport by women farmers, who carried two watering cans at the same time at arm’s length and regularly complained of muscle and joint pain. The typical basin should be a cylindrical one, but with the notable difference that the wall should be half—i.e., 50 cm—embedded in the ground, thus leaving only 50 cm visible. This model would at least eliminate the obstacle of the low wall and would correspond to local habits. The BRACED project and its partners also clearly perceived the need to reduce the laboriousness of water distribution. The system had to evolve. However, they proposed a low-pressure (0.1 bar) drip irrigation kit solution, confident that it would solve the problem. However, the 1 m elevated tank emptied into the laterals as soon as the central valve of the manifold was opened, forcing the women farmers to fill the tank frequently. In addition, the too-low pressure of 1 m led to clogging issues. Thus, despite the tremendous publicity and enthusiasm, it seems that the small farmers of the Sudano-Sahelian and Sahelian zones were not yet ready to adopt drip irrigation technologies. Rather, field experiments indicate that microsprinklers would be a more sustainable and climate-suitable technology for Sahelian small farmers if they are provided with a pressure of at least 1.5 bar and a sufficient water supply, i.e., 5–8 m3/(h·ha). Unfortunately, because of poor engineering choices, all the small-scale irrigation systems (except Louda) broke down, as it appeared from a survey in May 2022.

Author Contributions

Conceptualization, D.N.; formal analysis, D.N.; investigation, A.K. and S.A.S.; methodology, A.K., D.N. and S.A.S.; visualization, A.K.; writing—original draft, A.K.; writing—review and editing, A.K., D.N. and S.A.S. All authors have read and agreed to the published version of the manuscript.

Funding

This work was financially supported by the World Bank through its Excellency Centre in Africa (CEA), of which the International Institute for Water and Environmental Engineering (2iE) is partner.

Data Availability Statement

The data presented in this study are available upon request from the corresponding author. The data are not publicly available at the request of Institute 2iE.

Acknowledgments

The authors would like to especially thank Seth Nii Moi Allotey, English lecturer at the University of Legon in Ghana, for taking the time to read and correct this paper.

Conflicts of Interest

The authors have no relevant financial or non-financial interests to disclose.

References

  1. Fielke, S.; Taylor, B.M.; Coggan, A.; Jakku, E.; Davis, A.M.; Thorburn, P.J.; Webster, A.J.; Smart, J.C.R. Understanding Power, Social Capital and Trust alongside near Real-Time Water Quality Monitoring and Technological Development Collaboration. J. Rural Stud. 2022, 92, 120–131. [Google Scholar] [CrossRef]
  2. da Silva Cavalcante, D.F.; da Silva Medina, G.; Cruz, J.E. Getting It Right in Rural Development Initiatives: The Importance of Livelihood Assets in Commercializing Family Farm Production in Brazil. Hum. Ecol. 2022, 50, 49–59. [Google Scholar] [CrossRef]
  3. Lim, H.B.; Kim, C. The Failure of a Rural Development Project: South Korean Official Development Assistance in the Democratic Republic of the Congo. Asian J. Agric. Rural Dev. 2020, 10, 259–269. [Google Scholar] [CrossRef]
  4. Bekker, M.C.; Mashaba, J.T. A Critical Review of Agricultural Related Construction Project Failures at the Department of Agricultural, Rural Development and Environmental Affairs (DARDLEA): Mpumalanga. S. Afr. J. Agric. Ext. 2018, 46, 83–91. [Google Scholar] [CrossRef]
  5. Damoah, I.S.; Kumi, D.K. Causes of Government Construction Projects Failure in an Emerging Economy: Evidence from Ghana. Int. J. Manag. Proj. Bus. 2018, 11, 558–582. [Google Scholar] [CrossRef]
  6. Shava, E. Financial Sustainability of NGOs in Rural Development Programmes. Dev. Pract. 2021, 31, 393–403. [Google Scholar] [CrossRef]
  7. Balint, P.J. Bringing Solar Home Systems to Rural El Salvador: Lessons for Small NGOs. Energy Policy 2006, 34, 721–729. [Google Scholar] [CrossRef]
  8. Liu, Q.; Wang, R.Y.; Dang, H. The Hidden Gaps in Rural Development: Examining Peasant–NGO Relations through a Post-Earthquake Recovery Project in Sichuan, China. China Q. 2018, 233, 43–63. [Google Scholar] [CrossRef]
  9. Kamwamba-Mtethiwa, J.; Weatherhead, K.; Knox, J. Assessing Performance of Small-Scale Pumped Irrigation Systems in Sub-Saharan Africa: Evidence from a Systematic Review. Irrig. Drain. 2016, 65, 308–318. [Google Scholar] [CrossRef]
  10. Burney, J.A.; Naylor, R.L. Smallholder Irrigation as a Poverty Alleviation Tool in Sub-Saharan Africa. World Dev. 2012, 40, 110–123. [Google Scholar] [CrossRef]
  11. de Fraiture, C.; Giordano, M. Small Private Irrigation: A Thriving but Overlooked Sector. Agric. Water Manag. 2014, 131, 167–174. [Google Scholar] [CrossRef]
  12. UNDP. Independent Country Programme Evaluation Burkina Faso. 2020. Available online: http://web.undp.org/evaluation/evaluations/adr/burkina-faso.shtml (accessed on 31 May 2022).
  13. Ibrahim, B.; Karambiri, H.; Polcher, J.; Yacouba, H.; Ribstein, P. Changes in Rainfall Regime over Burkina Faso under the Climate Change Conditions Simulated by 5 Regional Climate Models. Springer 2014, 42, 1363–1381. [Google Scholar] [CrossRef]
  14. Diallo, A. Changement climatique et migrations humaines au Sénégal: Une approche en termes de vulnérabilité du système socio-écologique. Rev. Régulation Capital. Inst. Pouvoirs 2019, 26, 15800. [Google Scholar] [CrossRef]
  15. Chesworth, W. (Ed.) Encyclopedia of Soil Science; Encyclopedia of Earth Sciences Series; Springer Netherlands: Dordrecht, The Netherlands, 2008; ISBN 978-1-4020-3994-2. [Google Scholar]
  16. MARHR/DGIHRH. Geographic Information System Data of Burkina Faso. Available online: https://geospatial.com/resources/country-data/burkina-faso/ (accessed on 31 May 2022).
  17. Sop, T.K.; Oldeland, J. Local Perceptions of Woody Vegetation Dynamics in the Context of a ‘Greening Sahel’: A Case Study from Burkina Faso. Land Degrad. Dev. 2013, 24, 511–527. [Google Scholar] [CrossRef]
  18. Sawadogo, H. Using Soil and Water Conservation Techniques to Rehabilitate Degraded Lands in Northwestern Burkina Faso. Int. J. Agric. Sustain. 2011, 9, 120–128. [Google Scholar] [CrossRef]
  19. Nyamekye, C.; Thiel, M.; Schönbrodt-Stitt, S.; Zoungrana, B.J.-B.; Amekudzi, L.K. Soil and Water Conservation in Burkina Faso, West Africa. Sustainability 2018, 10, 3182. [Google Scholar] [CrossRef]
  20. Barbier, B.; Yacouba, H.; Karambiri, H.; Zoromé, M.; Somé, B. Human Vulnerability to Climate Variability in the Sahel: Farmers’ Adaptation Strategies in Northern Burkina Faso. Environ. Manage 2009, 43, 790–803. [Google Scholar] [CrossRef]
  21. CIEH. Essais de débit Simplifies sur Forages d’hydraulique Villageoise (Simplified Flow Testing on Village Boreholes). Comité Interafricain d’Etudes (CIEH), Série Hydraulique Villageoise, Ouagadougou, Burkina Faso. Available online: http://documentation.2ie-edu.org/cdi2ie/opac_css/index.php?lvl=notice_display&id=10155 (accessed on 31 May 2022).
  22. MacDonald, A.M.; Barker, J.A.; Davies, J. The Bailer Test: A Simple Effective Pumping Test for Assessing Borehole Success. Hydrogeol. J. 2008, 16, 1065–1075. [Google Scholar] [CrossRef]
  23. Reddy, D.V.; Nagabhushanam, P. Search for Hydraulic Connectivity between Surface Reservoirs and Surrounding Aquifers in the Reservoir-Triggered Seismic Environment (Koyna Region, India) Using Hydrochemical and Isotopic Signatures. J. Seismol. 2016, 20, 43–62. [Google Scholar] [CrossRef]
  24. Piccoli, I.; Furlan, L.; Lazzaro, B.; Morari, F. Examining Conservation Agriculture Soil Profiles: Outcomes from Northeastern Italian Silty Soils Combining Indirect Geophysical and Direct Assessment Methods. Eur. J. Soil Sci. 2020, 71, 1064–1075. [Google Scholar] [CrossRef]
  25. Ishida, S.; Tsuchihara, T.; Yoshimoto, S.; Imaizumi, M. Sustainable Use of Groundwater with Underground Dams. Jpn. Agric. Res. Q. 2011, 45, 51–61. [Google Scholar] [CrossRef]
  26. Bazie, C. Etude D’avant-Projet Détaillé de Fermes Piscicoles et Maraichères Sous Pompage Photovoltaique dans les Localités de Moussodougou et de Tiéfora; International Institute for Water and Environmental Engineering (2iE): Ouagadougou, Burkina Faso, 2021. [Google Scholar]
  27. Zhu, H.; Qiu, N.; Wang, C.; Si, Q.; Wu, J.; Deng, F.; Liu, X. Prediction of Cavitation Evolution and Cavitation Erosion on Centrifugal Pump Blades by the DCM-RNG Method. Scanning 2021, 2021, e6498451. [Google Scholar] [CrossRef] [PubMed]
  28. Carvajal, F.; Agüera, F.; Sánchez-Hermosilla, J. Water Balance in Artificial On-Farm Agricultural Water Reservoirs for the Irrigation of Intensive Greenhouse Crops. Agric. Water Manag. 2014, 131, 146–155. [Google Scholar] [CrossRef]
  29. Bounoua, S.; Tomas, S.; Labille, J.; Molle, B.; Granier, J.; Haldenwang, P.; Izzati, S.N. Understanding Physical Clogging in Drip Irrigation: In Situ, in-Lab and Numerical Approaches. Irrig. Sci. 2016, 34, 327–342. [Google Scholar] [CrossRef]
  30. Keita, A. Subsurface Drainage of Valley Bottom Irrigated Rice Schemes in Tropical Savannah: Case Studies of Tiefora and Moussodougou in Burkina Faso; CRC Press/Balkema: Leiden, The Netherlands, 2015; ISBN 978-1-138-02816-6. [Google Scholar]
  31. de Kreij, C.; van der Burg, A.M.M.; Runia, W.T. Drip Irrigation Emitter Clogging in Dutch Greenhouses as Affected by Methane and Organic Acids. Agric. Water Manag. 2003, 60, 73–85. [Google Scholar] [CrossRef]
  32. Friedlander, L.; Tal, A.; Lazarovitch, N. Technical Considerations Affecting Adoption of Drip Irrigation in Sub-Saharan Africa. Agric. Water Manag. 2013, 126, 125–132. [Google Scholar] [CrossRef]
  33. Iglesias, I.; Salvia, J.; Torguet, L.; Montserrat, R. The Evaporative Cooling Effects of Overtree Microsprinkler Irrigation on ‘Mondial Gala’ Apples. Sci. Hortic. 2005, 103, 267–287. [Google Scholar] [CrossRef]
  34. Feng, Y.; Wei, J.; Zhang, G.; Sun, X.; Wang, W.; Wu, C.; Tang, M.; Gan, Z.; Xu, X.; Chen, S.; et al. Effects of Cooling Measures on ‘Nijisseiki’ Pear (Pyrus Pyrifolia) Tree Growth and Fruit Quality in the Hot Climate. Sci. Hortic. 2018, 238, 318–324. [Google Scholar] [CrossRef]
  35. Piri, H.; Naserin, A. Effect of Different Levels of Water, Applied Nitrogen and Irrigation Methods on Yield, Yield Components and IWUE of Onion. Sci. Hortic. 2020, 268, 109361. [Google Scholar] [CrossRef]
  36. Paul, M.; wa Gĩthĩnji, M. Small Farms, Smaller Plots: Land Size, Fragmentation, and Productivity in Ethiopia. J. Peasant Stud. 2018, 45, 757–775. [Google Scholar] [CrossRef]
  37. Zorom, M.; Barbier, B.; Mertz, O.; Servat, E. Diversification and Adaptation Strategies to Climate Variability: A Farm Typology for the Sahel. Agric. Syst. 2013, 116, 7–15. [Google Scholar] [CrossRef]
  38. Akurugu, B.A.; Chegbeleh, L.P.; Yidana, S.M. Characterisation of Groundwater Flow and Recharge in Crystalline Basement Rocks in the Talensi District, Northern Ghana. J. Afr. Earth Sci. 2020, 161, 103665. [Google Scholar] [CrossRef]
  39. Savadogo, N.A.; Nakolendousse, S.; Diallo, S. Étude comparée de I’apport des méthodes électromagnetique MaxMin et électriques dans l’implantation des foragès à gros débits dans les régions de socle cristallin du Burkina Faso. J. Afr. Earth Sci. 1997, 24, 169–181. [Google Scholar] [CrossRef]
  40. Shinde, M.G.; Pawar, D.D.; Kale, K.D.; Dingre, S.K. Performance of Cabbage at Different Irrigation Levels under Drip and Microsprinkler Irrigation Systems *. Irrig. Drain. 2021, 70, 581–592. [Google Scholar] [CrossRef]
  41. Magoum, I. BURKINA FASO: Two SDWFs Provide Drinking Water to Households in Nébiélianayou. Available online: https://www.afrik21.africa/en/burkina-faso-two-sdwfs-provide-drinking-water-to-households-in-nebielianayou/ (accessed on 9 May 2022).
  42. Coates, R.W.; Delwiche, M.J.; Brown, P.H. Control of Individual Microsprinklers and Fault Detection Strategies. Precis. Agric. 2006, 7, 85–99. [Google Scholar] [CrossRef]
  43. Or, T.; Gourley, S.W.D.; Kaliyappan, K.; Yu, A.; Chen, Z. Recycling of Mixed Cathode Lithium-Ion Batteries for Electric Vehicles: Current Status and Future Outlook. Carbon Energy 2020, 2, 6–43. [Google Scholar] [CrossRef] [Green Version]
Figure 1. Locations of the 10 irrigation sites within the three climatic zones of Burkina Faso.
Sustainability 14 11315 g001
Figure 2. CIEH well-pumping test principle and variables.
Sustainability 14 11315 g002
Figure 3. Abacus N3. Determination of the well’s daily exploitable water Ve.
Sustainability 14 11315 g003
Figure 4. Surface solar pump riskily lowered into a well to pump the deep aquifer in Ramitenga.
Sustainability 14 11315 g004
Figure 5. Catchment basin for water distribution that caused trouble for pregnant women in Ansouri.
Sustainability 14 11315 g005
Figure 6. Drip irrigation kit abandoned by women farmers at Kouassanga.
Sustainability 14 11315 g006
Figure 7. Dripper clogged by disk-shaped algae despite filtration.
Sustainability 14 11315 g007
Figure 8. Measurement of onion bulb production across 10 irrigation schemes—dry season, 2018–2019. The error bars represent the 70% confidence interval (± standard deviation).
Sustainability 14 11315 g008
Table 1. Scheme locations and climate.
Site NameLongitude (DD)Latitude (DD)Annual Rainfall (mm)Climate
Boussé (Niou)1.9407 W12.7720 N630Sudano-Sahelian
Kouassanga1.3380 W12.6595 N600Sudano-Sahelian
Ladwenda1.2602 W12.6443 N600Sudano-Sahelian
Ramitenga1.3831 W12.5642 N600Sudano-Sahelian
Louda1.0625 W13.0107 N500Sahelian
Tangasgo1.0701 W13.1441 N510Sahelian
IIyala1.1125 W13.2343 N530Sahelian
Ansouri1.7607 W13.3087 N520Sahelian
Rouni1.7548 W13.2913 N500Sahelian
Raka1.6273 W13.1819 N500Sahelian
Table 2. Water availability variables of the 10 irrigation schemes.
SiteClimatic ZoneNumber of WellsDiameter D (m)Depth P (m) (A)Static Level NS (m)Distance to Closest Dam (m) (B)SubsoilTest Flow Rate Q (m3/h)CIEH Daily Expl. Water VE (A) (m3/day)Observation
NiouSudano-Sahelian41.8 ± 0.010.9 ± 3.46.4 ± 0.4N.A.ClayeyN.A.N.A.NS: 02/2019
KouassangaSudano-Sahelian31.8 ± 0.07.5 ± 2.6N.A.300.0ClayeyN.A.N.A.NS: 02/2019
LadwendaSudano-Sahelian31.8 ± 0.05.4 ± 1.23.5 ± 0.2115.0Clayey0.1 ± 0.03.6 ± 1.1NS: 02/2019
RamitengaSudano-Sahelian21.8 ± 0.07.0 ± 0.54.6 ± 0.4250.0Clayey0.24.3NS: 02/2019
LoudaSahelian31.810.06.4 ± 0.31060.0Sandy2.1 ± 0.56.1 ± 0.6NS: 02/2019
TangasgoSahelian31.812.010.8N.A.Clayey0.120.40NS: 02/2019
IlyalaSahelian31.812.0N.A.260.0Clayey0.0-Pumping from a water stream
AnsouriSahelian41.815N.A.N.A.Clayey2.40.0Empty after 1:30 pumping
RouniSahelian31.812N.A.N.A.Clayey2.43.6 ± 3.0Empty after 2:00 pumping
RakaSahelian41.88N.A.N.A.Clayey2.42.3 ± 0.4Empty after 2:00 pumping
Legend: (A) X.X ± S = average ± standard deviation; (B) from the GIS database of BEWACO 1996; N.A. = non-available.
Table 3. Production and financial performance of ten 1 ha irrigation schemes.
SiteSeasonCycle (j)No. FarmersPlot Size (m²)Prod Onion Bulb (kg)Yield Onion Bulb (t/ha)
Niou2018–201915012128 ± 40 (a)433 ± 11435 ± 8
Kouassanga2018–201915012282 ± 64259 ± 9321 ± 11
Ladwenda2018–201915012320 ± 0765 ± 8824 ± 3
Ramitenga2018–201915012140 ± 0567 ± 8541 ± 6
Louda2018–201915010120 ± 0413 ± 15034 ± 12
Tangasgo2018–20191501067 ± 0159 ± 8624 ± 13
Ilyala2018–201915010120 ± 0279 ± 9123 ± 8
Ansouri2018–20191501041 ± 1491 ± 2323 ± 8
Rouni2018–20191501144 ± 1973 ± 2419 ± 7
Raka2018–201915012135 ± 37270 ± 9620 ± 6
(a) In the notation format, 128 ± 40, 128 is the mean, and 40 represents the standard deviation; 70% of observations are within the interval (confidence interval is 70%).
Table 4. Characteristics of water availability on BRACED project sites.
Irrigation Scheme (a)No. of WaterpointsThickness of Alterations (b) (m)Drilled Depth DD (m)Positive Borehole (%)Water Inflow Depth VInf (m)Estimated Flow (m3/h)Test Flow (c) (m3/h)Vicinity of Surf. Water (d)
Niou1454 ± 1267 ± 0864%35 ± 2803 ± 0302 ± 02No
Boussé1532 ± 1257 ± 1853%18 ± 1802 ± 0200 ± 01Yes
Kouassanga1818 ± 0758 ± 1450%16 ± 1805 ± 1501 ± 01Yes
Ladwenda1518 ± 0657 ± 1060%25 ± 2301 ± 0201 ± 01Yes
Ramitenga826 ± 1160 ± 1650%22 ± 2901 ± 0100 ± 01Yes
Louda1625 ± 1359 ± 1469%30 ± 2303 ± 0400 ± 00Yes
Tangasgo2423 ± 1565 ± 2358%17 ± 1801 ± 0100 ± 00Non
Ilyala619 ± 1358 ± 1150%19 ± 2101 ± 0100 ± 00Yes
Ansouri1033 ± 2175 ± 1570%27 ± 3101 ± 0100 ± 01No
Rouni1033 ± 2175 ± 1570%27 ± 3101 ± 0100 ± 01No
Raka1331 ± 2171 ± 2762%33 ± 3502 ± 0203 ± 07No
Legend: (a) Within a radius of 5 Km, calculated with GIS from the BEWACO database on wells and boreholes in Burkina Faso, 1996; (b) in the notation format 54 ± 12, 12 represents the standard deviation; (c) pumping test on boreholes; (d) within a radius of at least 1000 m.
Publisher’s Note: MDPI stays neutral with regard to jurisdictional claims in published maps and institutional affiliations.

