
Co-Implementation of Tillage, Precision Nitrogen, and Water Management Enhances Water Productivity, Economic Returns, and Energy-Use Efficiency of Direct-Seeded Rice

 , ,
, ,  ,
,
Abstract
:1. Introduction
2. Materials and Methods
2.1. Experimental Site and Treatments Details
2.2. Crop Culture
2.3. Data Collection
2.4. Economic Budgeting and Water Productivity Estimation
2.5. Energy Estimation
2.6. Statistical Analysis
3. Results
3.1. Growth and Yield Attributes
3.2. Productivity
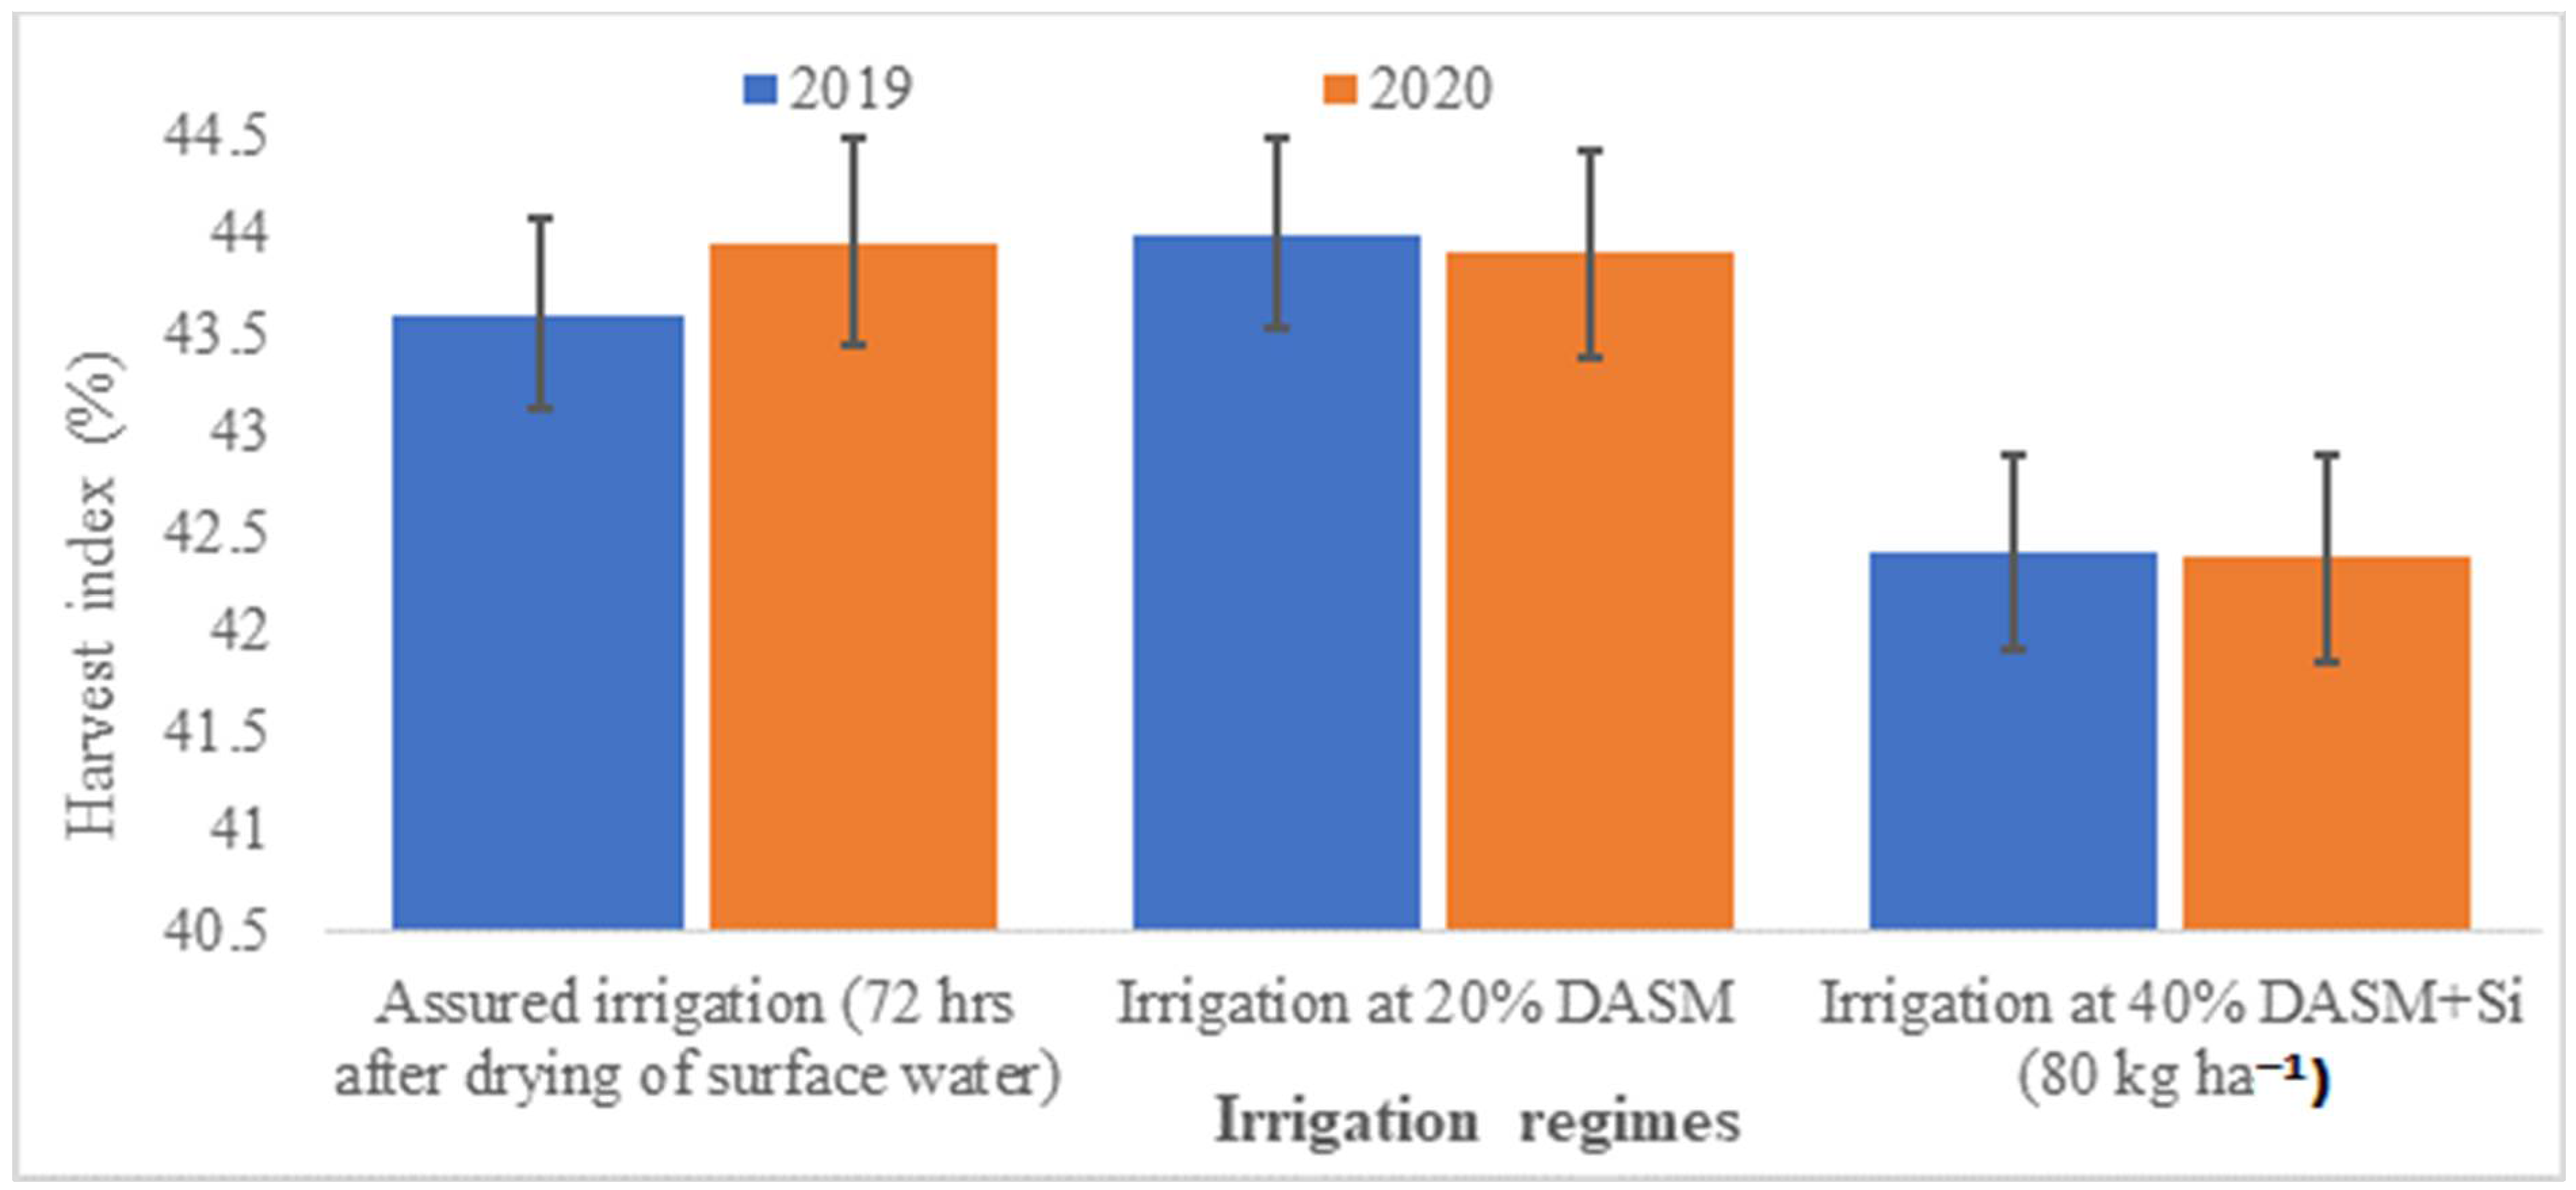
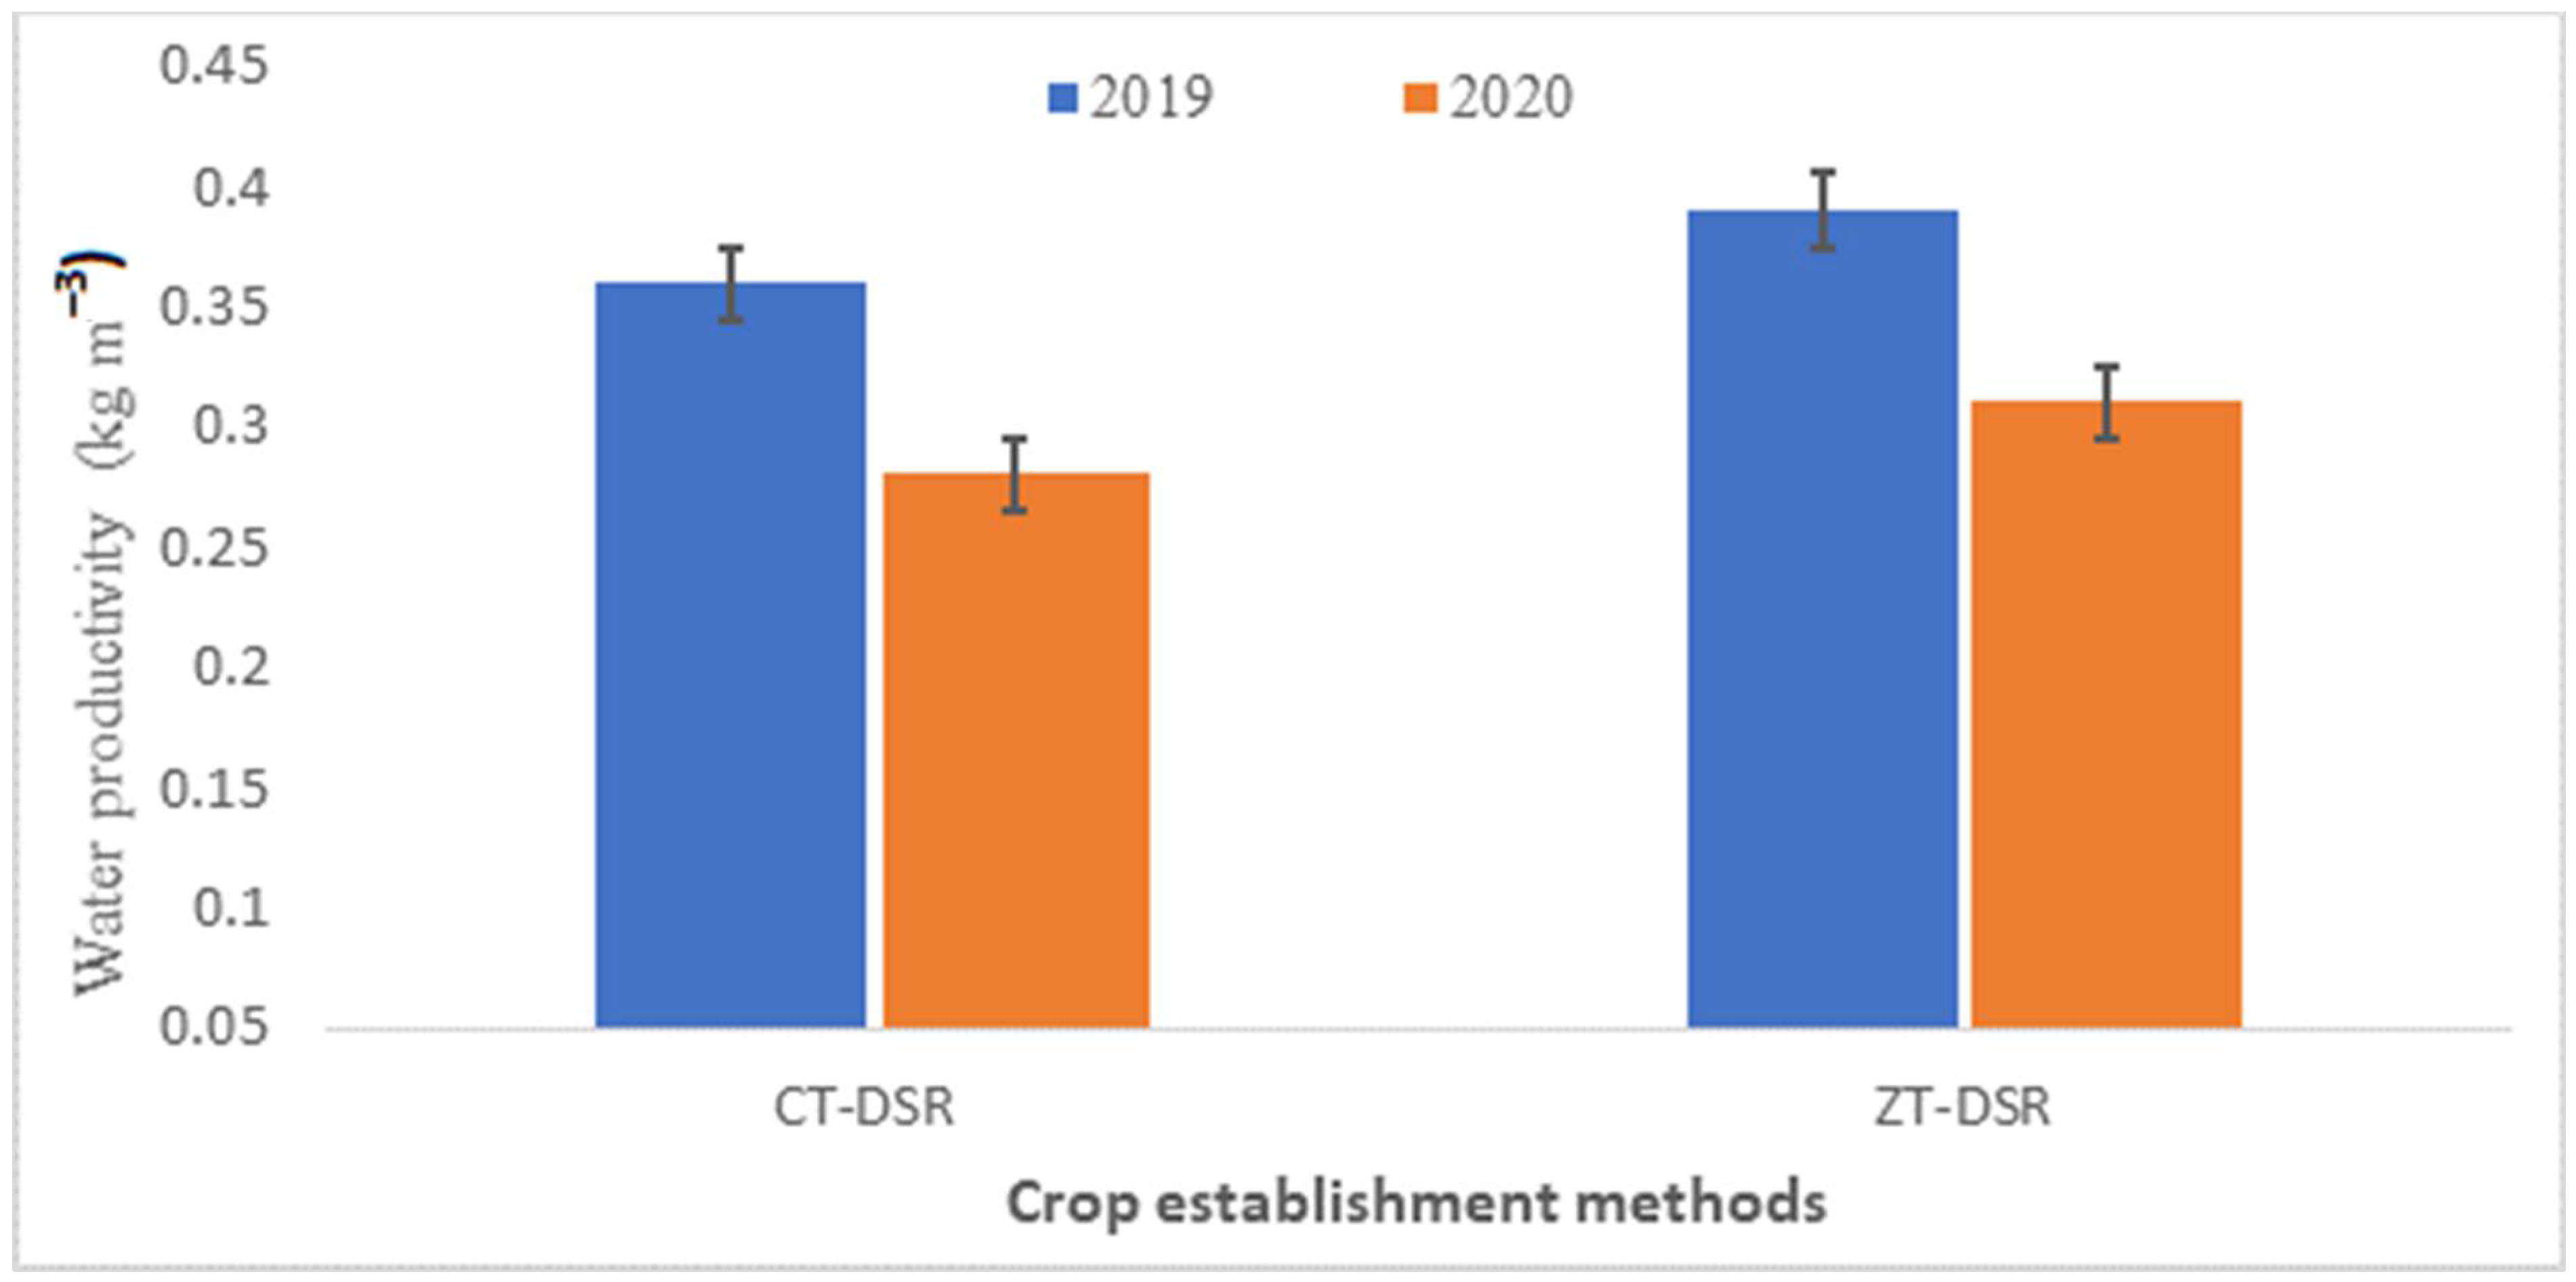
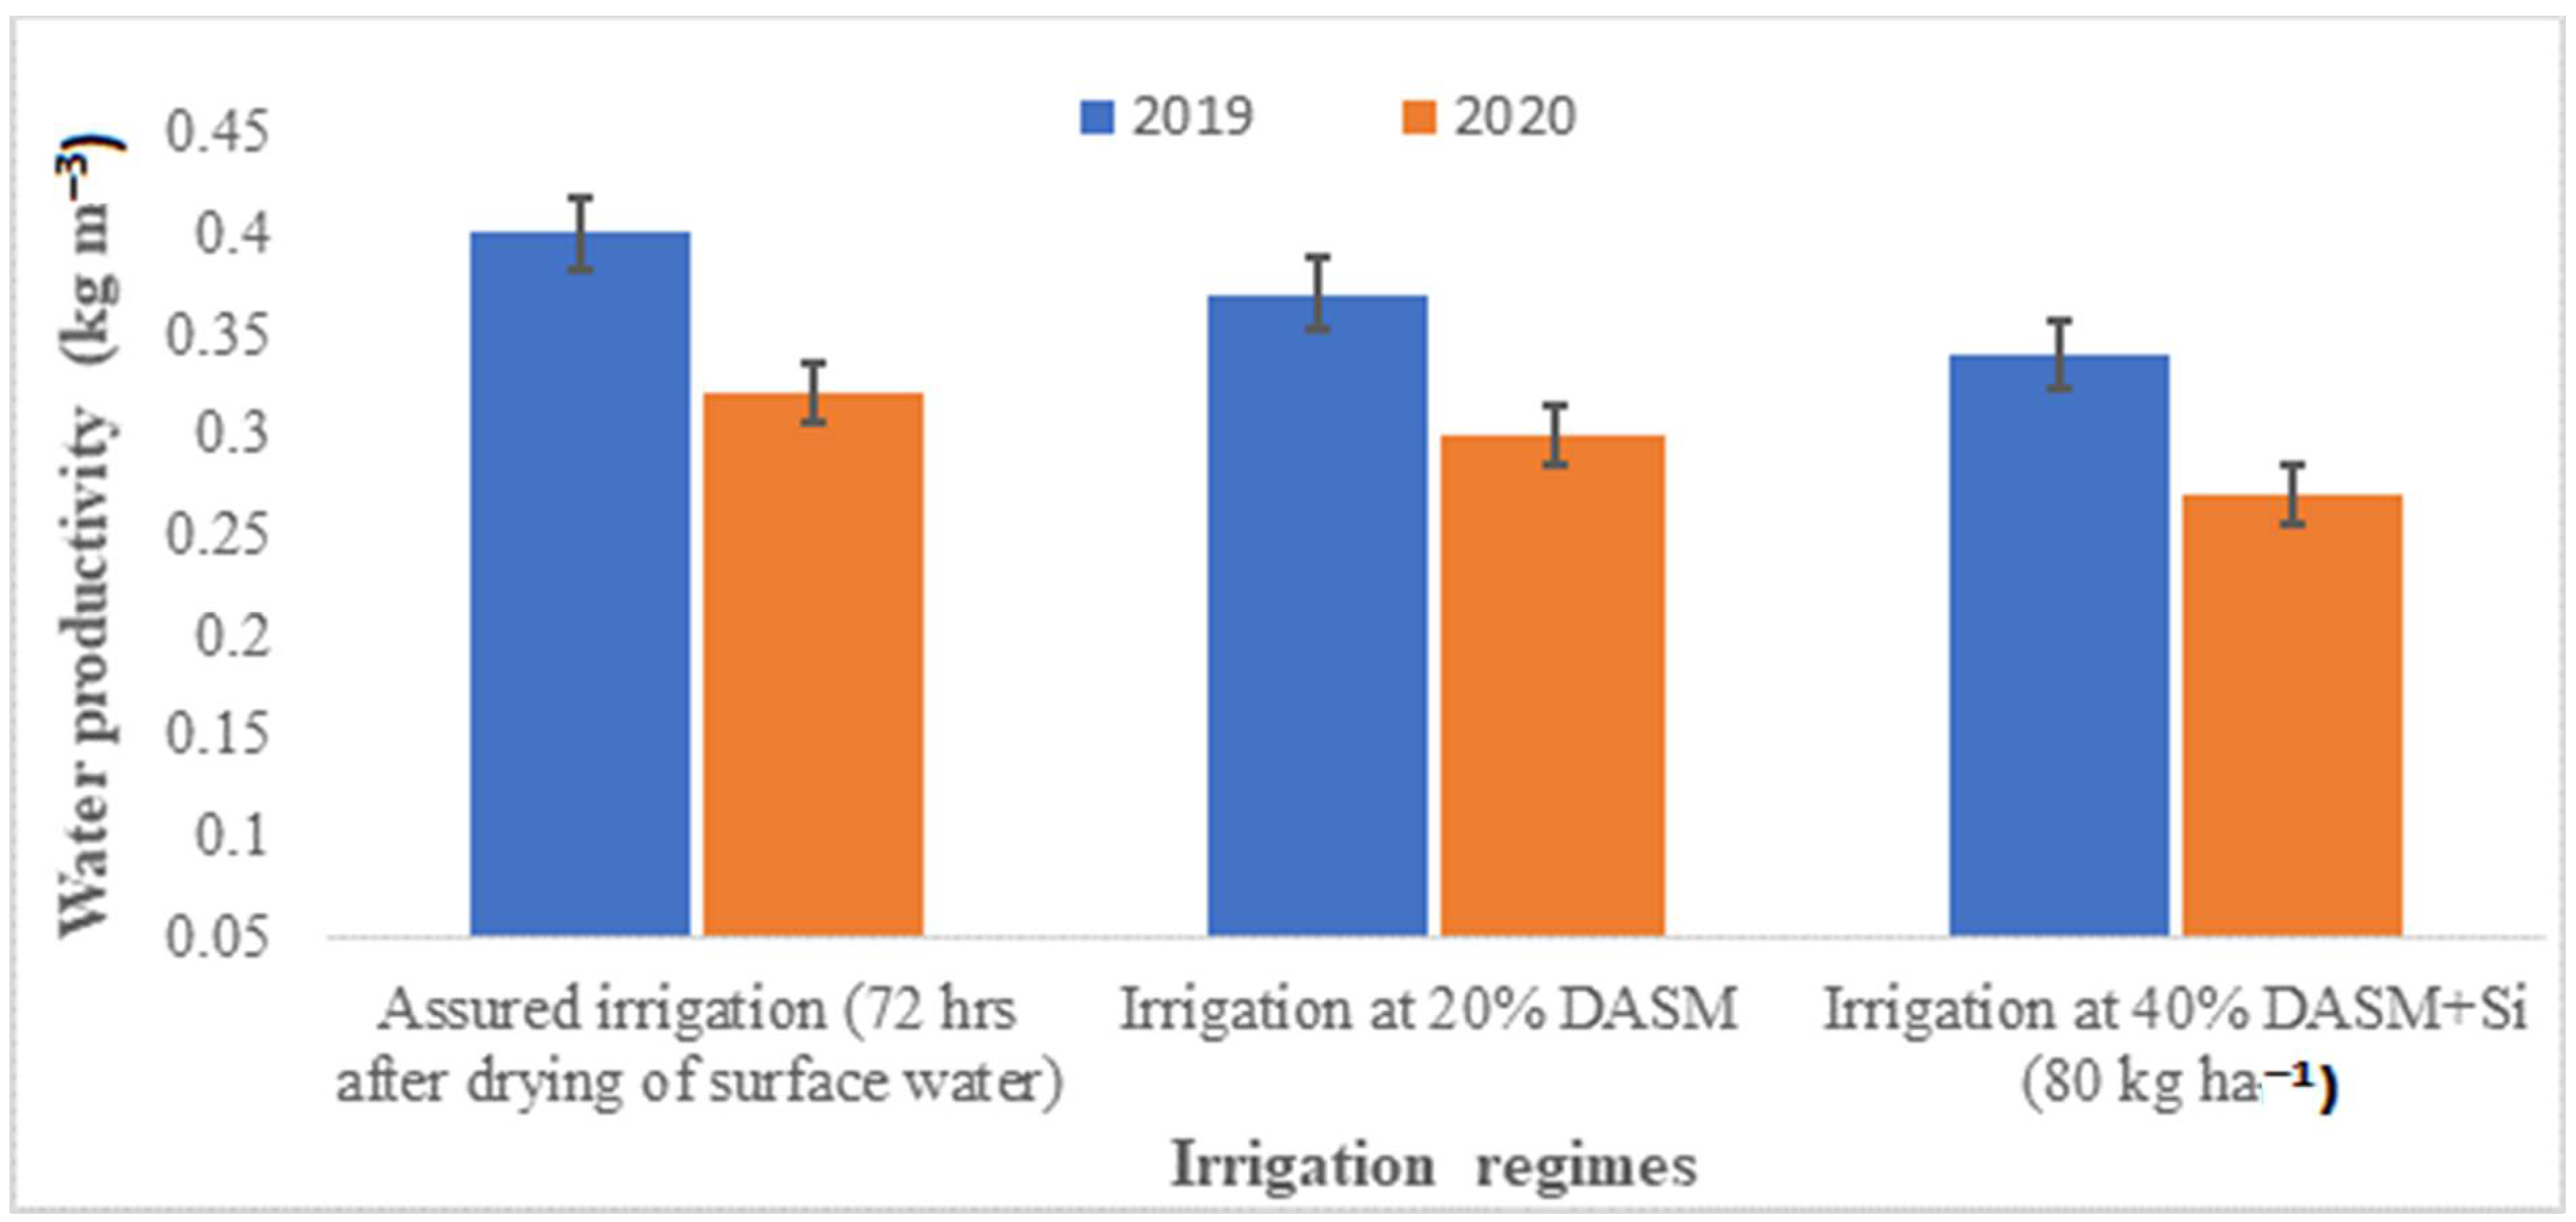
3.3. Crop Establishment Methods × Irrigation Regimes Interactions
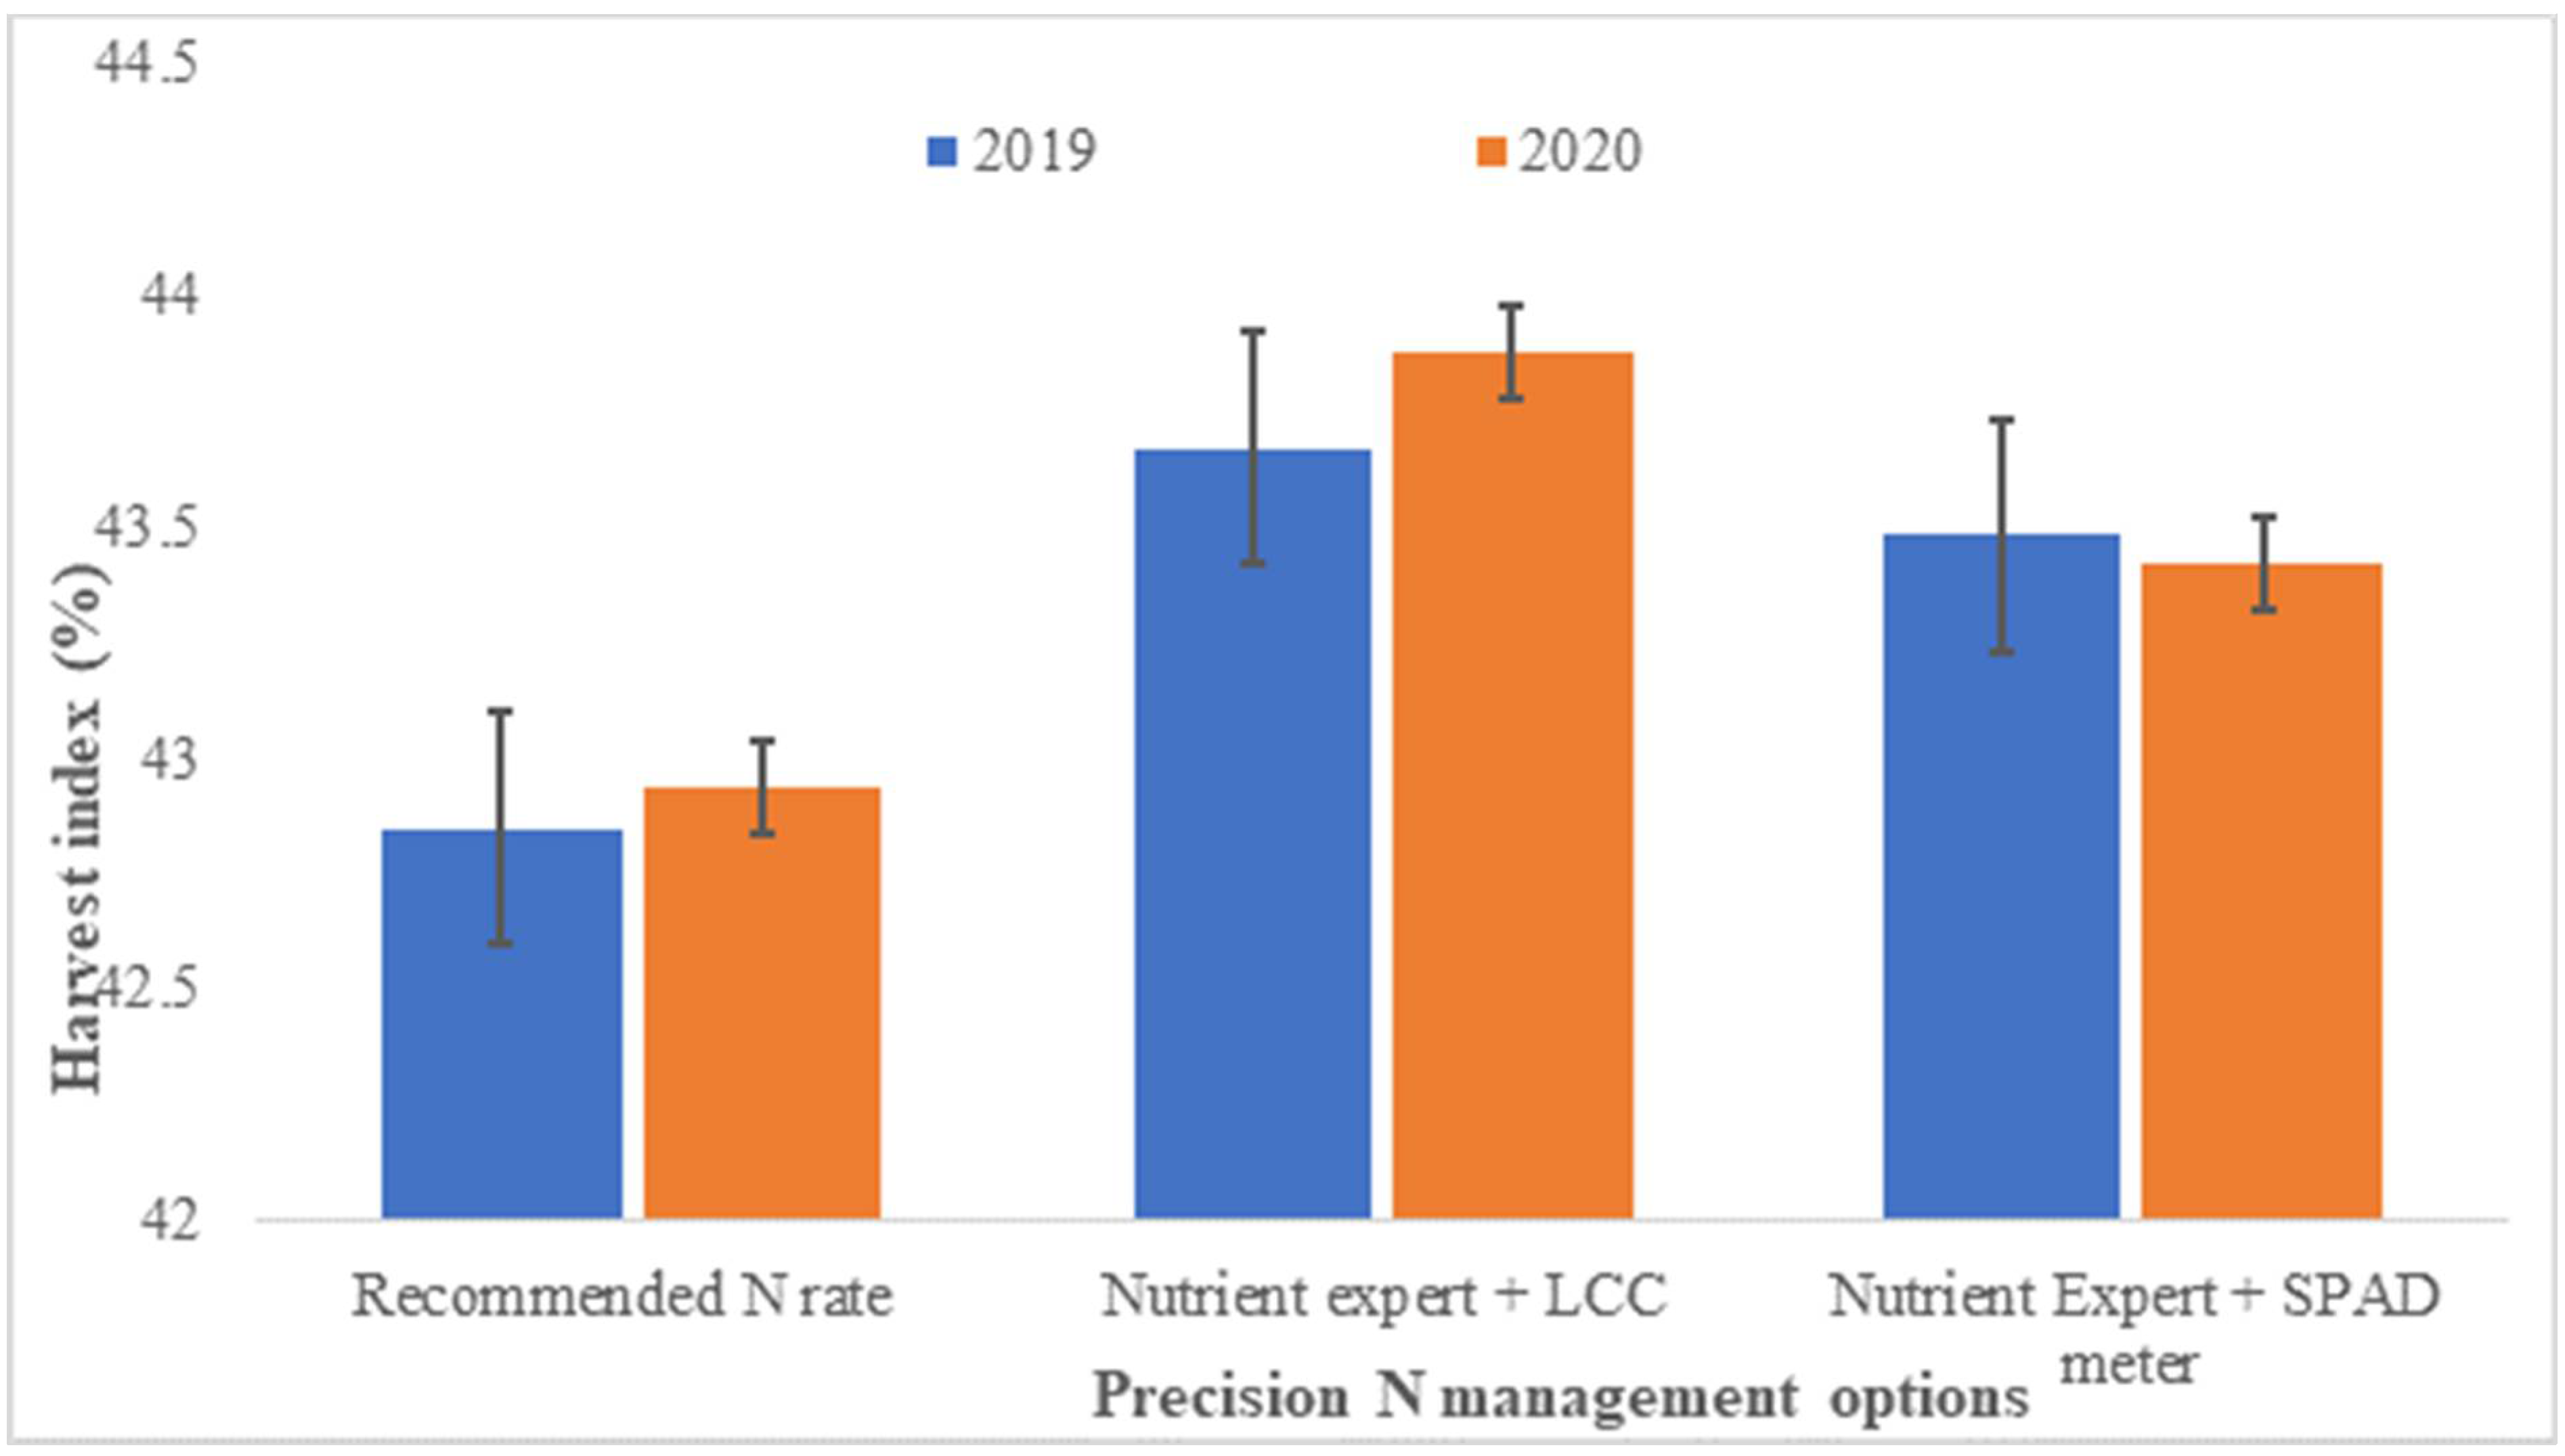
3.4. Precision N Management × Irrigation Regimes Interactions
3.5. Economic Profitability
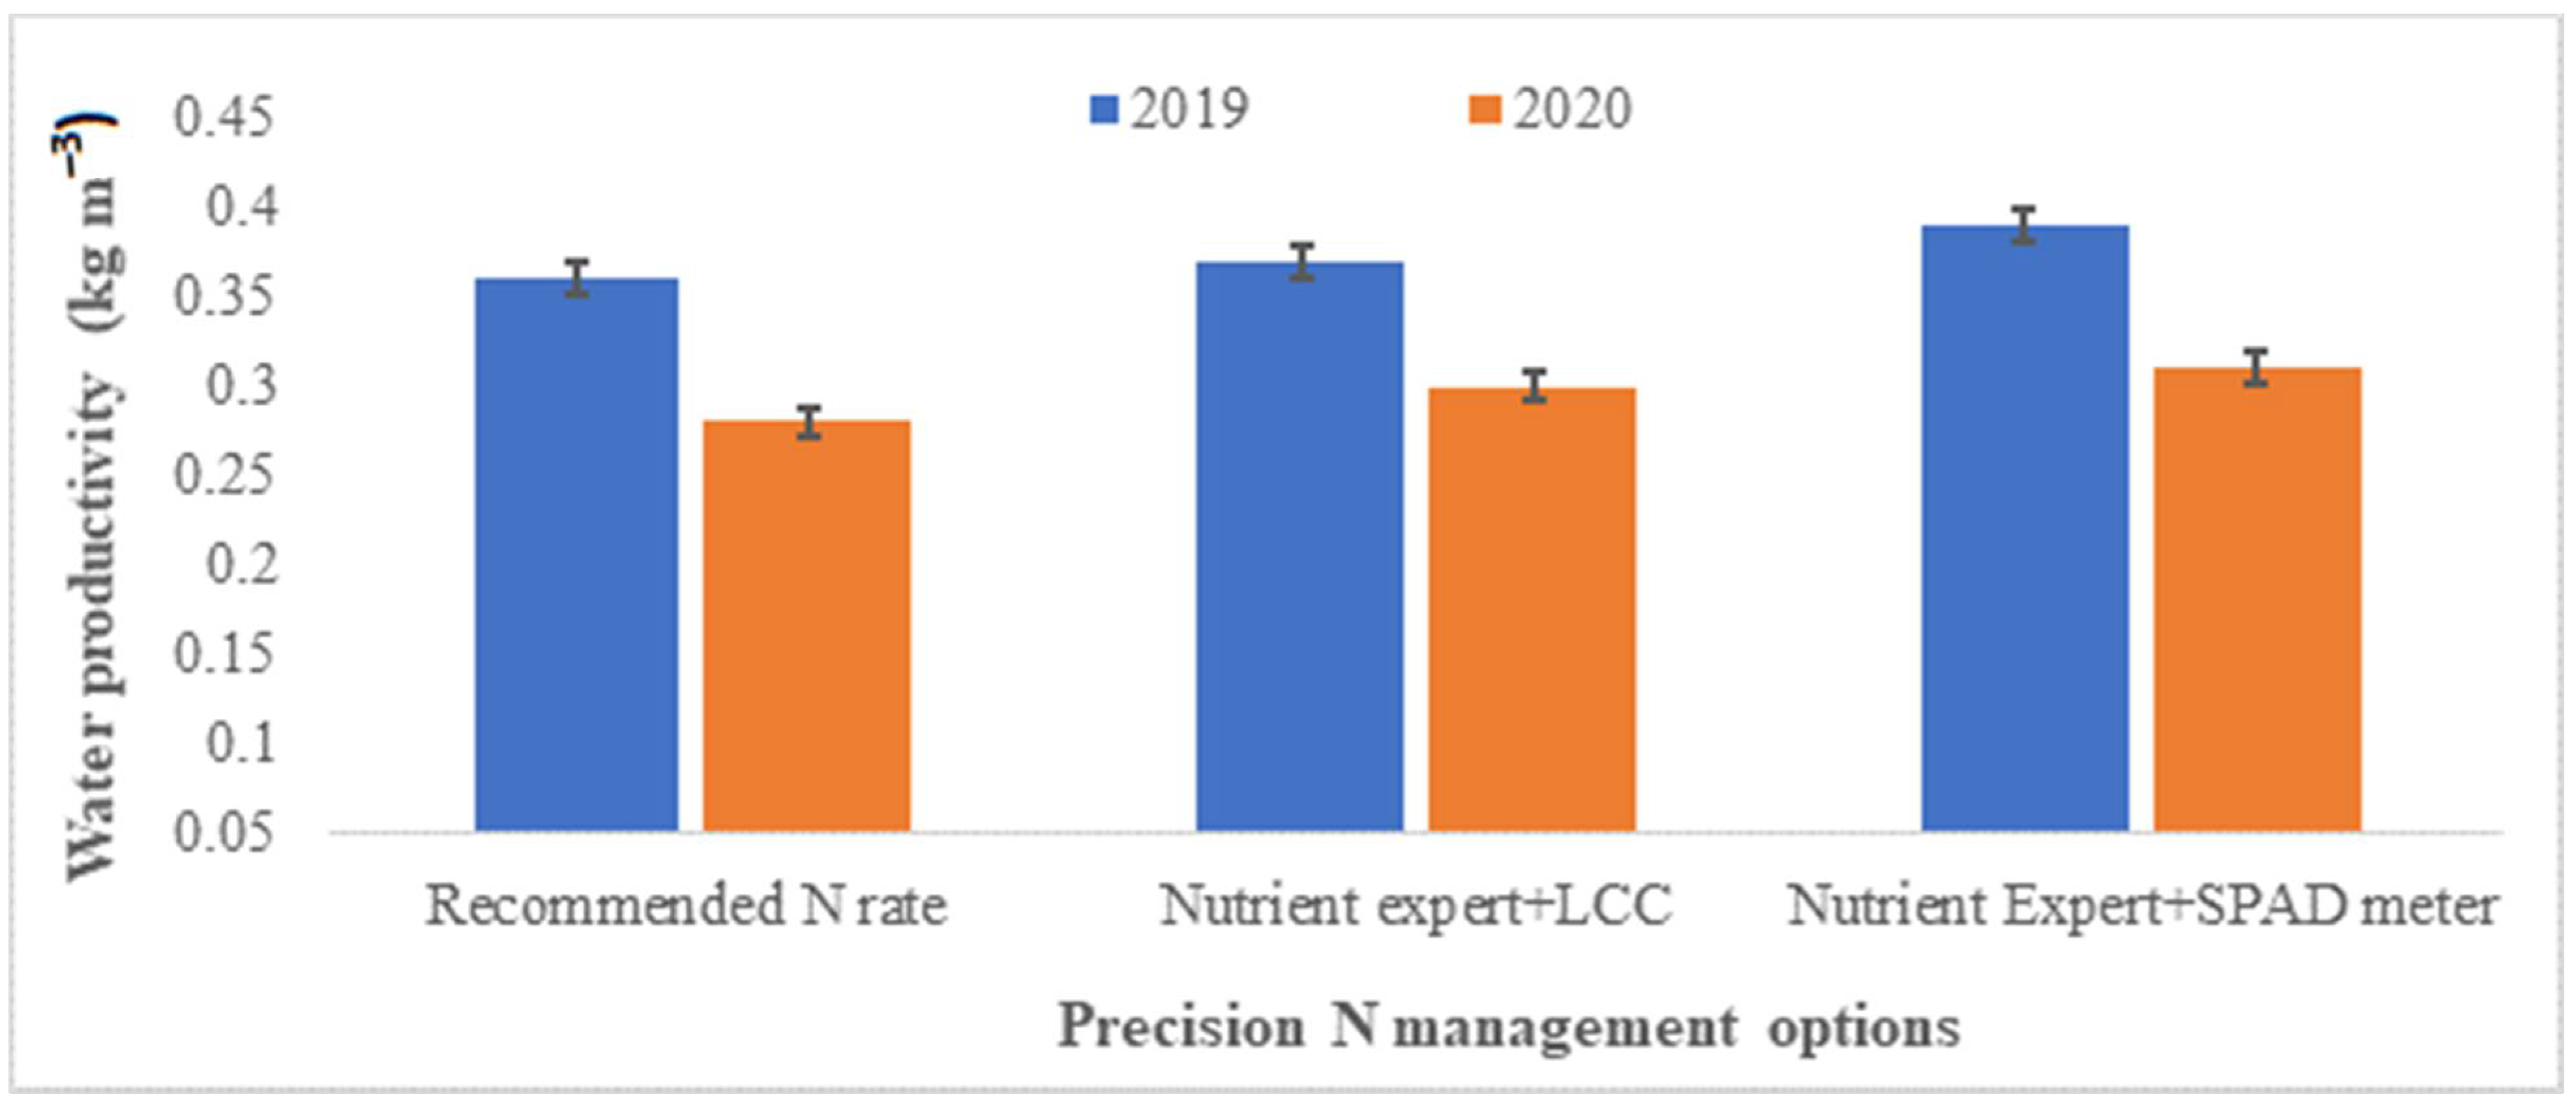
3.6. Water Productivity
3.7. Energy Dynamics
4. Discussion
4.1. Growth, Yield Attributes, and Yields
4.2. Economics: Cost of Cultivation, Gross Return, Net Return, and B:C
4.3. Resource-Use Efficiency: Water Productivity, Monetary Efficiency, and Energy-Use Efficiencies
5. Conclusions
Author Contributions
Funding
Institutional Review Board Statement
Informed Consent Statement
Data Availability Statement
Acknowledgments
Conflicts of Interest
Abbreviations
| AI | active ingredients |
| CTPR | conventional puddled transplanted rice |
| CT | conventional tillage |
| COC | cost of cultivation |
| DAS | days after sowing |
| DASM | depletion of available soil moisture |
| DMA | dry matter accumulation |
| DSR | direct seeded rice |
| GHGs | greenhouse gases |
| INR | Indian rupees |
| LCC | leaf color chart |
| LAI | leaf area index |
| ME | monetary efficiency |
| MJ | megajoule |
| NUE | nitrogen use efficiency |
| PE | production efficiency |
| RDN | recommended dose of nitrogen |
| SPAD | soil plant analysis development meter |
| WP | water productivity |
| WUE | water-use efficiency |
| ZT | zero tillage |
References
- Gupta, D.K.; Bhatia, A.; Kumar, A.; Das, T.K.; Jain, N.; Tomer, R.; Malyan, S.K.; Fagodiya, R.K.; Dubey, R.; Pathak, H. Mitigation, of greenhouse gas emission from rice-wheat system of the Indo-Gangetic Plains: Through tillage, irrigation and fertilizer management. Agric. Ecosyst. Environ. 2016, 230, 1–9. [Google Scholar] [CrossRef]
- Yadav, G.S.; Das, A.; Kandpal, B.K.; Babu, S.; Lal, R.; Datta, M.; Das, B.; Singh, R.; Singh, V.K.; Mohapatra, K.P.; et al. The food-energy-water-carbon nexus in a maize-maize-mustard cropping sequence of the Indian Himalayas: An impact of tillage-cum-live mulching. Renew. Sust. Energ. Rev. 2021, 151, 111602. [Google Scholar] [CrossRef]
- Rani, T.S.; Jayakiran, K. Evaluation of different planting techniques for economic feasibility in rice. Electron. J. Environ. Agric. Food Chem. 2010, 9, 150–153. [Google Scholar]
- Biswakarma, N.; Pooniya, V.; Zhiipao, R.R.; Kumar, D.; Verma, A.K.; Shivay, Y.S.; Lama, A.; Choudhary, A.K.; Meena, M.C.; Bana, R.S.; et al. Five years integrated crop management in direct seeded rice–zero till wheat rotation of north-western India: Effects on soil carbon dynamics, crop yields, water productivity and economic profitability. Agric. Ecosyst. Environ. 2021, 318, 107492. [Google Scholar] [CrossRef]
- Mahajan, G.; Chauhan, B.S.; Timsina, J.; Singh, P.P.; Singh, K. Crop performance and water- and nitrogen-use efficiencies in dry-seeded rice in response to irrigation and fertilizer amounts in northwest India. Field Crops Res. 2012, 134, 59–70. [Google Scholar] [CrossRef]
- Yadav, G.S.; Das, A.; Lal, R.; Babu, S.; Meena, R.S.; Saha, P.; Singh, R.; Datta, M. Energy budget and carbon footprint in a no-till and mulch-based rice–mustard cropping system. J. Clean. Prod. 2018, 191, 144–157. [Google Scholar] [CrossRef]
- Dass, A.; Chandra, S.; Uphoff, N.; Choudhary, A.K.; Bhattacharyya, R.; Rana, K.S. Agronomic fortification of rice grains with secondary and micronutrients under differing crop management and soil moisture regimes in the north Indian Plains. Paddy Water Environ. 2017, 15, 745–760. [Google Scholar] [CrossRef]
- Yadav, G.S.; Babu, S.; Das, A.; Mohapatra, K.P.; Singh, R.; Avasthe, R.K.; Roy, S. No till and mulching enhance energy use efficiency and reduce carbon footprint of a direct-seeded upland rice production system. J. Clean. Prod. 2020, 271, 122700. [Google Scholar] [CrossRef]
- Chauhan, B.S.; Opeña, J. Effect of tillage systems and herbicides on weed emergence, weed growth, and grain yield in dry-seeded rice systems. Field Crops Res. 2012, 137, 56–69. [Google Scholar] [CrossRef]
- Hira, G.S. Water management in northern states and the food security of India. J. Crop Improve. 2009, 23, 136–157. [Google Scholar] [CrossRef]
- Bouman, B.A.M.; Lampayan, R.M.; Tuong, T.P. Water Management in Irrigated Rice: Coping with Water Scarcity; International Rice Research Institute: Los Baños, Philippines, 2007; pp. 1–54. [Google Scholar]
- Soni, P.; Sinha, R.; Perret, S.R. Energy use and efficiency in selected rice-based cropping systems of the Middle-Indo Gangetic Plains in India. Energy Rep. 2018, 4, 554–564. [Google Scholar] [CrossRef]
- Rathore, S.S.; Babu, S.; Shekhawat, K.; Singh, R.; Yadav, S.K.; Singh, V.K.; Singh, C. Designing energy cum carbon-efficient environmentally clean production system for achieving green economy in agriculture. Sustain. Energy Technol. Assess. 2022, 52, 102190. [Google Scholar] [CrossRef]
- Erdal, G.; Esengun, K.; Guduz, O. Energy use and economic analysis of sugar beet production in Tokat province of Turkey. Energy 2007, 32, 34–41. [Google Scholar] [CrossRef]
- Pratap, V.; Verma, S.K.; Dass, A.; Yadav, D.K.; Jaysawal, P.K.; Madane, A.J. Productivity and profitability of direct-seeded rice under varying establishment methods and weed management practices. Indian J. Agric. Sci. 2021, 91, 537–541. [Google Scholar]
- Choudhary, A.K.; Suri, V.K. Integrated nutrient management technology for direct-seeded upland rice (Oryza sativa) in northwestern Himalayas. Commun. Soil Sci. Plant Anal. 2014, 45, 777–784. [Google Scholar] [CrossRef]
- Harish, M.N.; Choudhary, A.K.; Kumar, S.; Dass, A.; Singh, V.K.; Sharma, V.K.; Varatharajan, T.; Dhillon, M.K.; Sangwan, S.; Dua, V.K.; et al. Double zero-tillage and foliar-P fertilization coupled with microbial-inoculants lead to improved maize productivity and quality in a maize–wheat rotation of semi-arid agro-ecology. Sci. Rep. 2022, 12, 3161. [Google Scholar] [CrossRef]
- Bana, R.S.; Rana, K.S.; Singh, R.; Godara, S.; Grover, M.; Yadav, A.; Choudhary, A.K.; Singh, T.; Choudahary, M.; Bansal, R.; et al. No-tillage with residue retention and foliar sulphur nutrition enhances productivity, mineral biofortification and crude protein in rainfed pearl millet under Typic Haplustepts. Elucidating the responses imposed on an eight-year long-term experiment. Plants 2022, 11, 943. [Google Scholar]
- Singh, H.; Buttar, G.S.; Brar, A.S.; Deol, J.S. Crop establishment method and irrigation schedule effect on water productivity, quality, economics and energetics of aerobic direct-seeded rice (Oryza sativa L.). Paddy Water Environ. 2017, 15, 101–109. [Google Scholar] [CrossRef]
- Shukla, A.K.; Singh, V.K.; Diwedi, B.S.; Sharma, S.K.; Singh, Y. Nitrogen use efficiency using leaf colour chart in rice-wheat cropping system. Indian J. Agric. Sci. 2006, 76, 651–656. [Google Scholar]
- Kumar, V.; Singh, A.K.; Jat, S.L.; Parihar, C.M.; Pooniya, V.; Singh, B.; Sharma, S. Precision nutrient and conservation agriculture practices for enhancing productivity, profitability, nutrient-use efficiencies and soil nutrient status of maize (Zea mays) hybrids. Indian J. Agric. Sci. 2015, 85, 926–930. [Google Scholar]
- Pratap, V.; Verma, S.K.; Dass, A.; Yadav, D.K.; Madane, A.J.; Maurya, R.; Jaysawal, P.K. Effect of sowing and weed control methods on nutrient uptake and soil fertility in direct-seeded rice (Oryza sativa). Indian J. Agric. Sci. 2021, 91, 1337–1341. [Google Scholar]
- Yang, J.; Zhang, J. Crop management techniques to enhance harvest index in rice. J. Exp. Bot. 2010, 61, 3177–3189. [Google Scholar] [CrossRef] [PubMed]
- Kumawat, A.; Sepat, S.; Kaur, R.; Kumar, D.; Jinger, D. Effect of irrigation scheduling and nitrogen application on productivity and profitability of direct seeded rice (Oryza sativa). Indian J. Agron. 2016, 61, 506–508. [Google Scholar]
- Ishfaq, M.; Akbar, N.; Anjum, S.A.; Anwar-Ijl Haq, M. Growth, yield and water productivity of dry direct seeded rice and transplanted aromatic rice under different irrigation management regimes. J. Integr. Agric. 2020, 19, 2656–2673. [Google Scholar] [CrossRef]
- Subbiah, B.V.; Asija, G.L. A rapid procedure for the determination of available nitrogen in soils. Curr. Sci. 1956, 25, 259–260. [Google Scholar]
- Olsen, B.C.; Cole, C.V.; Watenabe, F.S.; Dean, L.A. Estimation of Available Phosphorus by Extraction with Sodium Carbonate; USDA: Washington, DC, USA, 1954; Circular No. 939; p. 19.
- Hanway, J.J.; Heidel, H. Soil analyses methods as used in Iowa State College Soil Testing Laboratory. Iowa Agric. 1952, 57, 131. [Google Scholar]
- Walkley, A.J.; Black, I.A. Estimation of soil organic carbon by the chromic acid titration method. Soil Sci. 1934, 37, 29–38. [Google Scholar] [CrossRef]
- Jackson, M.L. Soil Chemical Analysis; Prentice Hall of India Pvt. Limited: New Delhi, India, 1967; pp. 331–334. [Google Scholar]
- Piper, C.S. Soil and Plant Analysis; The University of Adelaide Press: Adelaide, Australia, 1950; pp. 286–287. [Google Scholar]
- Rana, K.S.; Choudhary, A.K.; Sepat, S.; Bana, R.S.; Dass, A. Methodological and Analytical Agronomy; An Indian Agricultural Research Institute: New Delhi, India, 2014; p. 276. [Google Scholar]
- Dass, A.; Chandra, S. Irrigation, spacing and cultivar effects on net photosynthetic rate, dry matter partitioning and productivity of rice under system of rice intensification in mollisols of northern India. Exp. Agric. 2013, 49, 504–523. [Google Scholar] [CrossRef]
- Jackson, T.M.; Khan, S.; Hafeez, M. A comparative analysis of water application and energy consumption at the irrigated field level. Agric. Water Manag. 2010, 97, 1477–1485. [Google Scholar] [CrossRef]
- Mohammadi, A.; Rafiee, S.H.; Mohtasebi, S.; Rafiee, H. Energy inputs-yield relationship and cost analysis of kiwifruit production in Iran. Renew. Energy 2010, 35, 1071–1075. [Google Scholar] [CrossRef]
- Esengun, K.; Erdal, G.; Gunduz, O.; Erdal, H. An economic analysis and energy use in stake-tomato production in Tokat province of Turkey. Renew. Energy 2007, 32, 1873–1881. [Google Scholar] [CrossRef]
- Zangeneh, M.; Omid, M.; Akram, A. A comparative study on energy use and cost analysis of potato production under different farming technologies in Hamadan province of Iran. Energy 2010, 35, 2927–2933. [Google Scholar] [CrossRef]
- Safa, M.; Tabatabaeefar, A. Energy consumption in wheat production in irrigated and dry land farming. World J. Agric. Res. 2002, 4, 86–90. [Google Scholar]
- Anonymous. Units, Equivalents and Energy Constants. Cooperative Extension Service; Institute of Food and Agricultural Sciences, University of Florida: Gainesville, FL, USA, 2004. [Google Scholar]
- Mohammadi, A.; Tabatabaeefar, A.; Shahin, S.; Rafiee, S.; Keyhani, A. Energy use and economical analysis of potato production in Iran, a case study: Ardabil province. Energy Convers. Manag. 2008, 49, 3566–3570. [Google Scholar] [CrossRef]
- Dass, A.; Chandra, S.; Choudhary, A.K.; Singh, G.; Sudhishri, S. Influence of field re-ponding pattern and plant spacing on rice root–shoot characteristics, yield and water productivity of two modern cultivars under SRI management in Indian mollisols. Paddy Water Environ. 2016, 14, 45–59. [Google Scholar] [CrossRef]
- Rahman, R.; Sofi, J.A.; Kirmani, N.A.; Dar, I.H.; Chesti, M.H.; Bangroo, S.A.; Mir, S.A.; Wani, O.A. Impact of biochar and pyrolytic temperature on nutrient content of different feed stocks. J. Indian Soc. Soil Sci. 2021, 69, 463–467. [Google Scholar] [CrossRef]
- Mansoor, S.; Kour, N.; Manhas, S.; Zahid, S.; Wani, O.A.; Sharma, V.; Wijaya, L.; Alyemeni, M.N.; Alsahli, A.A.; El-Serehy, H.A.; et al. Biochar as a tool for effective management of drought and heavy metal toxicity. Chemosphere 2021, 271, 129458. [Google Scholar] [CrossRef]
- Ramakrishna, Y.; Singh, S.; Parihar, S.S. Influence of irrigation regime and nitrogen management on productivity, nitrogen uptake and water use by rice (Oryza sativa L.). Indian J. Agron. 2007, 52, 102–106. [Google Scholar]
- Mahdi, S.S.; Choudhury, S.R.; Gupta, S.K.; Jan, R.; Bangroo, S.A.; Bhat, M.A.; Wani, O.A.; Bahar, F.A.; Dhekale, B.; Dar, S.A. Impact of Climate Change on Soil Carbon-Improving Farming Practices Reduces the Carbon Footprint. In Innovative Approaches for Sustainable Development; Springer: Cham, Switzerland, 2022; pp. 299–310. [Google Scholar]
- Pooniya, V.; Jat, S.L.; Choudhary, A.K.; Singh, A.K.; Parihar, C.M.; Bana, R.S.; Swarnalakshmi, K.; Rana, K.S. Nutrient expert’ assisted site–specific–nutrient–management: An alternative precision fertilization technology for maize–wheat cropping system in South-Asian Indo–Gangetic Plains. Indian J. Agric. Sci. 2015, 85, 996–1002. [Google Scholar]
- Zahed, Z.; Mufti, S.; Kumar, S.S.; Wani, O.A.; Mushtaq, F.; Rasool, R.; Babu, S.; Abidi, I.; Gaber, A.; Hossain, A. Organic and inorganic mulches combination improves the productivity, quality and profitability of rainfed potato in the temperate himalayan region. Gesunde Pflanz. 2022, 1–14. [Google Scholar] [CrossRef]
- Bashir, S.S.; Hussain, A.; Hussain, S.J.; Wani, O.A.; Nabi, S.Z.; Dar, N.A.; Baloch, F.S.; Mansoor, S. Plant drought stress tolerance: Understanding its physiological, biochemical and molecular mechanisms. Biotechnol. Biotechnol. Equip. 2021, 35, 1912–1925. [Google Scholar] [CrossRef]
- Kumari, K.; Dass, A.; Sudhishri, S.; Kaur, R.; Rani, A. Yield components, yield and nutrient uptake pattern in maize (Zea mays) under varying irrigation and nitrogen levels. Indian J. Agron. 2017, 62, 104–107. [Google Scholar]
- Rajpoot, S.K.; Rana, D.S.; Choudhary, A.K. Crop and water productivity, energy auditing, carbon footprints and soil health indicators of Bt-cotton transplanting led system intensification. J. Environ. Manag. 2021, 300, 113732. [Google Scholar] [CrossRef] [PubMed]
- Hsiao, T.C. Plant responses to water stress. Ann. Rev. Plant. Physiol. 1973, 24, 519–570. [Google Scholar] [CrossRef]
- Salisbury, F.B.; Ross, C.W. Plant Physiology; 3rd Indian Reprint 2009; Cengage Learning India Pvt Ltd.: New Delhi, India, 2009. [Google Scholar]
- Flexas, J.; Ribas-Carbo, M.; Hanson, D.T.; Bota, J.; Otto, B.; Cifre, J.; McDowell, N.; Medrano, H.; Kaldenhoff, R. Tobacco aquaporin NtAQP1 is involved in mesophyll conductance to CO2 in vivo. Plant 2006, 48, 427–439. [Google Scholar]
- Xu, W.; Cui, K.; Xu, A.; Nie, L.; Huang, J.; Peng, S. Drought stress condition increases root to shoot ratio via alteration of carbohydrate partitioning and enzymatic activity in rice seedlings. Acta Physiol. Plant. 2015, 37, 9. [Google Scholar] [CrossRef]
- Walker, T.M. Hybrid rice response nitrogen fertilization for Mid southern United states rice production. Agron. J. 2008, 100, 381–386. [Google Scholar] [CrossRef]
- Mansoor, S.; Ali Wani, O.; Lone, J.K.; Manhas, S.; Kour, N.; Alam, P.; Ahmad, A.; Ahmad, P. Reactive Oxygen Species in Plants: From Source to Sink. Antioxidants 2022, 11, 225. [Google Scholar] [CrossRef]
- Shekara, B.; Krishnamurthy, N. Effect of irrigation schedules on growth and yield of aerobic rice (Oryza sativa) under varied levels of farm yard manure in Cauvery command area. Indian J. Agron. 2010, 55, 35–39. [Google Scholar]
- Majumdar, K.; Jat, M.L.; Shahi, V.B. Effect of spatial and temporal variability in cropping seasons and tillage practices on maize yield responses in eastern India. Better Crops-South Asia 2012, 6, 4–6. [Google Scholar]
- Satyanarayana, T.; Majumdar, K.; Pampolino, M.; Johnston, A.M.; Jat, M.L.; Kuchanur, P.; Sreelatha, D.; Sekhar, J.C.; Kumar, Y.; Maheswaran, R. Nutrient Expert®: A tool to optimize nutrient use and improve productivity of maize. Better Crop-South Asia 2012, 6, 18–21. [Google Scholar]
- Sapkota, T.B.; Majumdar, K.; Jat, M.L.; Kumar, A.; Bishnoi, D.K.; Mcdonald, A.J.; Pampolino, M. Precision nutrient management in conservation agriculture-based wheat production of North-west India: Profitability, nutrient use efficiency and environmental footprint. Field Crops Res. 2014, 155, 233–244. [Google Scholar] [CrossRef]
- Parihar, C.M.; Jat, S.L.; Singh, A.K.; Majumdar, K.; Jat, M.L.; Saharawat, Y.S.; Pradhan, S.; Kuri, B.R. Bio-energy, water-use efficiency and economics of maize-wheat-mung bean system under precision-conservation agriculture in semi-arid agro-ecosystem. Energy 2017, 119, 245–256. [Google Scholar] [CrossRef]
- Mohammad, A.; Sudhishri, S.; Das, T.K.; Singh, M.; Bhattacharyya, R.; Dass, A.; Khanna, M.; Sharma, V.K.; Dwivedi, N.; Kumar, M. Water balance in direct-seeded rice under conservation agriculture in North-western Indo-Gangetic Plains of India. Irrig. Sci. 2018, 36, 381–393. [Google Scholar] [CrossRef]
- Correndo Boxler, A.M.; Garcia, F. Oferta hídricay respuesta a la fertilización en maíz, trigo y soja en el norte de la región pampeana argentina (Water availability and response to fertilization in maize, wheat, and soybean in the northern pampean region of Argentina). In Proceedings of the XIX CLACS-XXII CACS. AACS., Mar del Plata, Buenos Aires, Argentina, 16–20 April 2012. [Google Scholar]
- Parihar, C.M.; Jat, S.L.; Singh, A.K.; Kumar, B.; Pradhan, S.; Pooniya, V.; Yadav, O.P. Conservation agriculture in irrigated intensive maize-based systems of north-western India: Effects on crop yields, water productivity and economic profitability. Field Crops Res. 2016, 193, 104–116. [Google Scholar] [CrossRef]


| S. No. | Parameters | Analytical Values | Method Employed |
|---|---|---|---|
| 1 | Available Nitrogen | 176.2 kg ha−1 | Alkaline permanganate method [26] |
| 2 | Available Phosphorus | 11.6 kg ha−1 | 0.5 M NaHCO3, pH = 8.5 [27] |
| 3 | Available Potassium | 272.5 kg ha−1 | Ammonium acetate method [28] |
| 4 | Organic Carbon | 0.41% | Rapid titration method [29] |
| 4 | pH | 8.3 | 1:2.5 Soil: water suspension [30] |
| 5 | Soil Texture | Clay loam | International pipette method [31] |
| Irrigation Regimes | No. of Irrigation | Depth of Each Irrigation Water (mm) | Total Irrigation Water Applied (mm) | |||||||
|---|---|---|---|---|---|---|---|---|---|---|
| CT-DSR | ZT-DSR | CT-DSR | ZT-DSR | CT-DSR | ZT-DSR | |||||
| 2019 | 2020 | 2019 | 2020 | 2019 | 2020 | 2019 | 2020 | |||
| Irr.–Assured | 15 | 14 | 13 | 12 | 50 | 50 | 750 | 700 | 650 | 600 |
| Irr. at 20% DASM | 13 | 12 | 11 | 10 | 55 | 55 | 715 | 660 | 605 | 550 |
| Irr. at 40% DASM+Si80 | 9 | 8 | 8 | 7 | 60 | 60 | 540 | 480 | 480 | 420 |
| Component | Unit | Energy Equivalent Coefficient (MJ unit−1) | Source | |
|---|---|---|---|---|
| Inputs | ||||
| 1 | Seed | kg | 14.7 | [34] |
| 2 | Human labor | |||
| Male | h | 1.96 | [35] | |
| Female | h | 1.57 | [36] | |
| 3 | Machinery | |||
| 4 | Tractors | h | 62.80 | [37] |
| 5 | Others | H | 62.70 | [37] |
| 6 | Fuel (Petrol) | L | 46.30 | [38] |
| Chemical fertilizers | ||||
| 7 | N | kg | 66.14 | [35] |
| 8 | P2O5 | kg | 12.44 | [35] |
| 9 | K2O | kg | 11.15 | [35] |
| 10 | Micronutrients | kg | 20.9 | [39] |
| 11 | Herbicides | L | 238.32 | [36] |
| 12 | Irrigation | M3 | 1.02 | [40] |
| Output | ||||
| 13 | Rice | |||
| Main product | kg | 14.7 | [34] | |
| By-product | kg | 14.7 | [34] |
| Treatments | Dry Matter Accumulation at Harvest (g m−2) | LAI at Flowering | Effective Tillers (no. m−2) | Panicle Length (cm) | Panicle Weight (g) | Grains Panicle−1 | 1000-Grain Weight (g) | |||||||
|---|---|---|---|---|---|---|---|---|---|---|---|---|---|---|
| 2019 | 2020 | 2019 | 2020 | 2019 | 2020 | 2019 | 2020 | 2019 | 2020 | 2019 | 2020 | 2019 | 2020 | |
| Crop establishment methods | ||||||||||||||
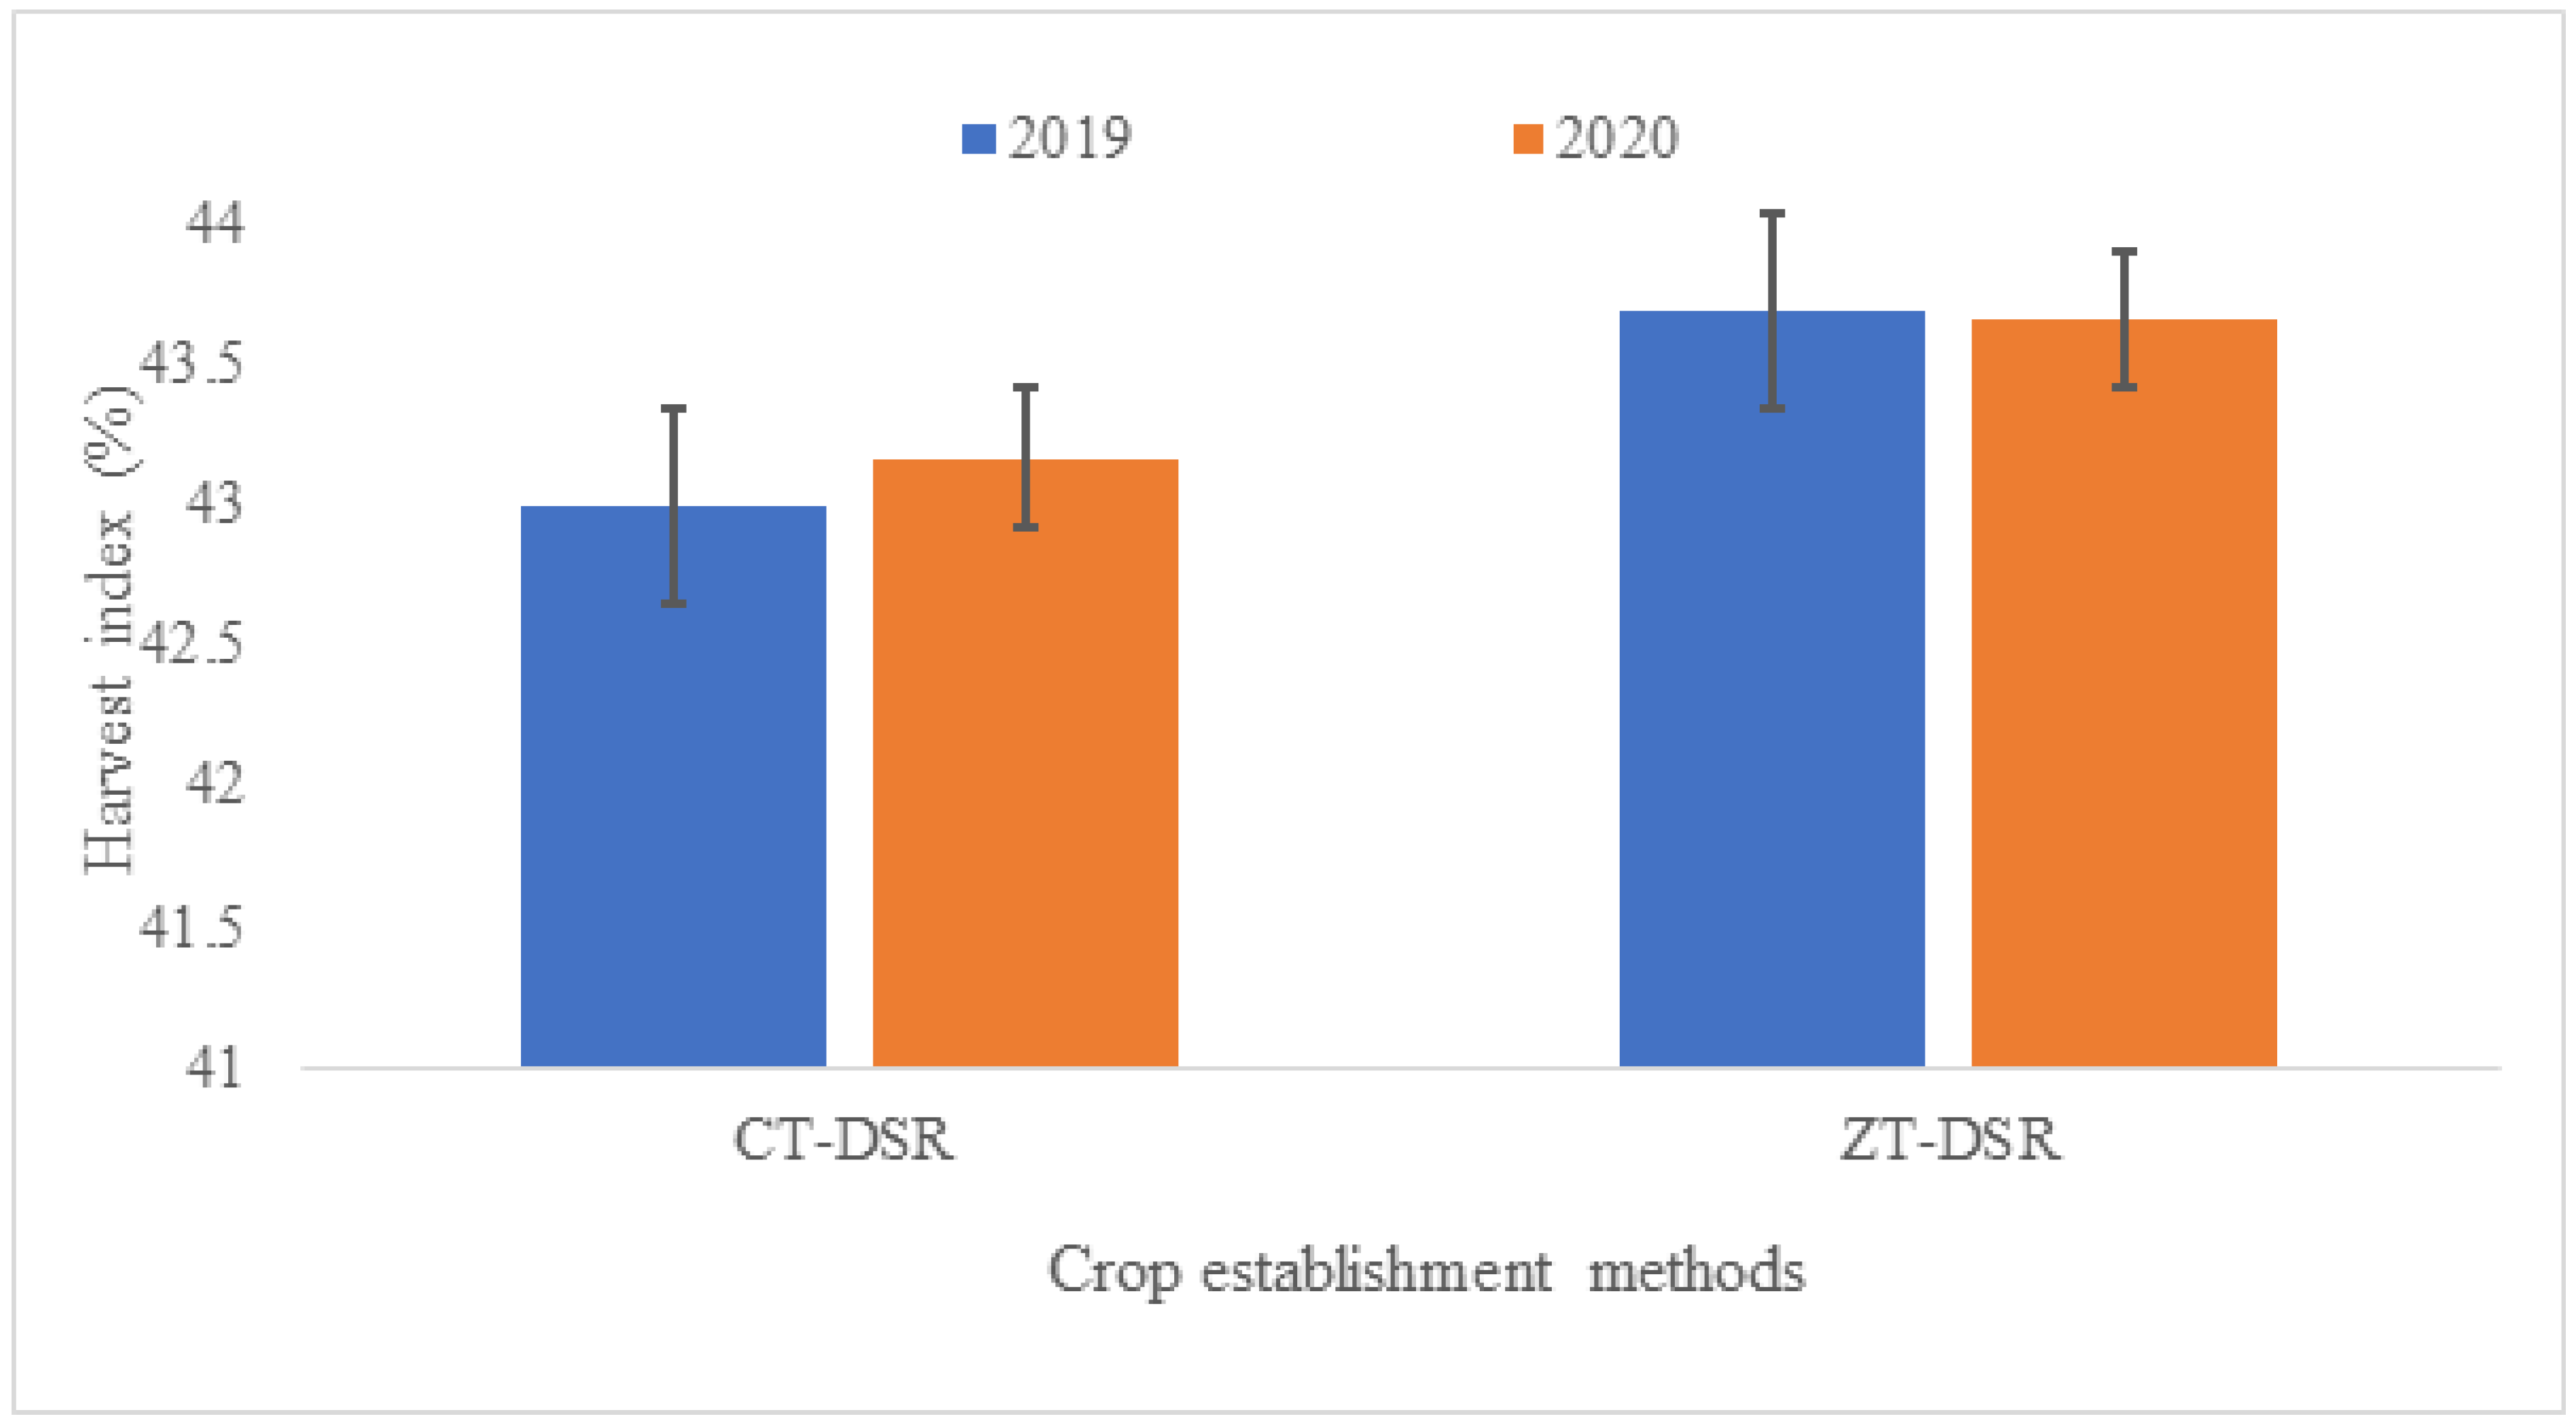
| CT-DSR | 783.3 a | 627.2 a | 4.35 a | 3.96 a | 324 a | 299 a | 24.6 a | 23.5 a | 2.13 a | 1.96 a | 70.5 a | 64.6 a | 24.4 a | 23.0 a |
| ZT-DSR | 763.1b | 608.4 a | 4.22 b | 3.85 b | 316 b | 294 b | 24.1 a | 23.1 a | 2.04 a | 1.86 a | 68.3 a | 62.8 a | 24.0 a | 22.7 a |
| Irrigation regimes | ||||||||||||||
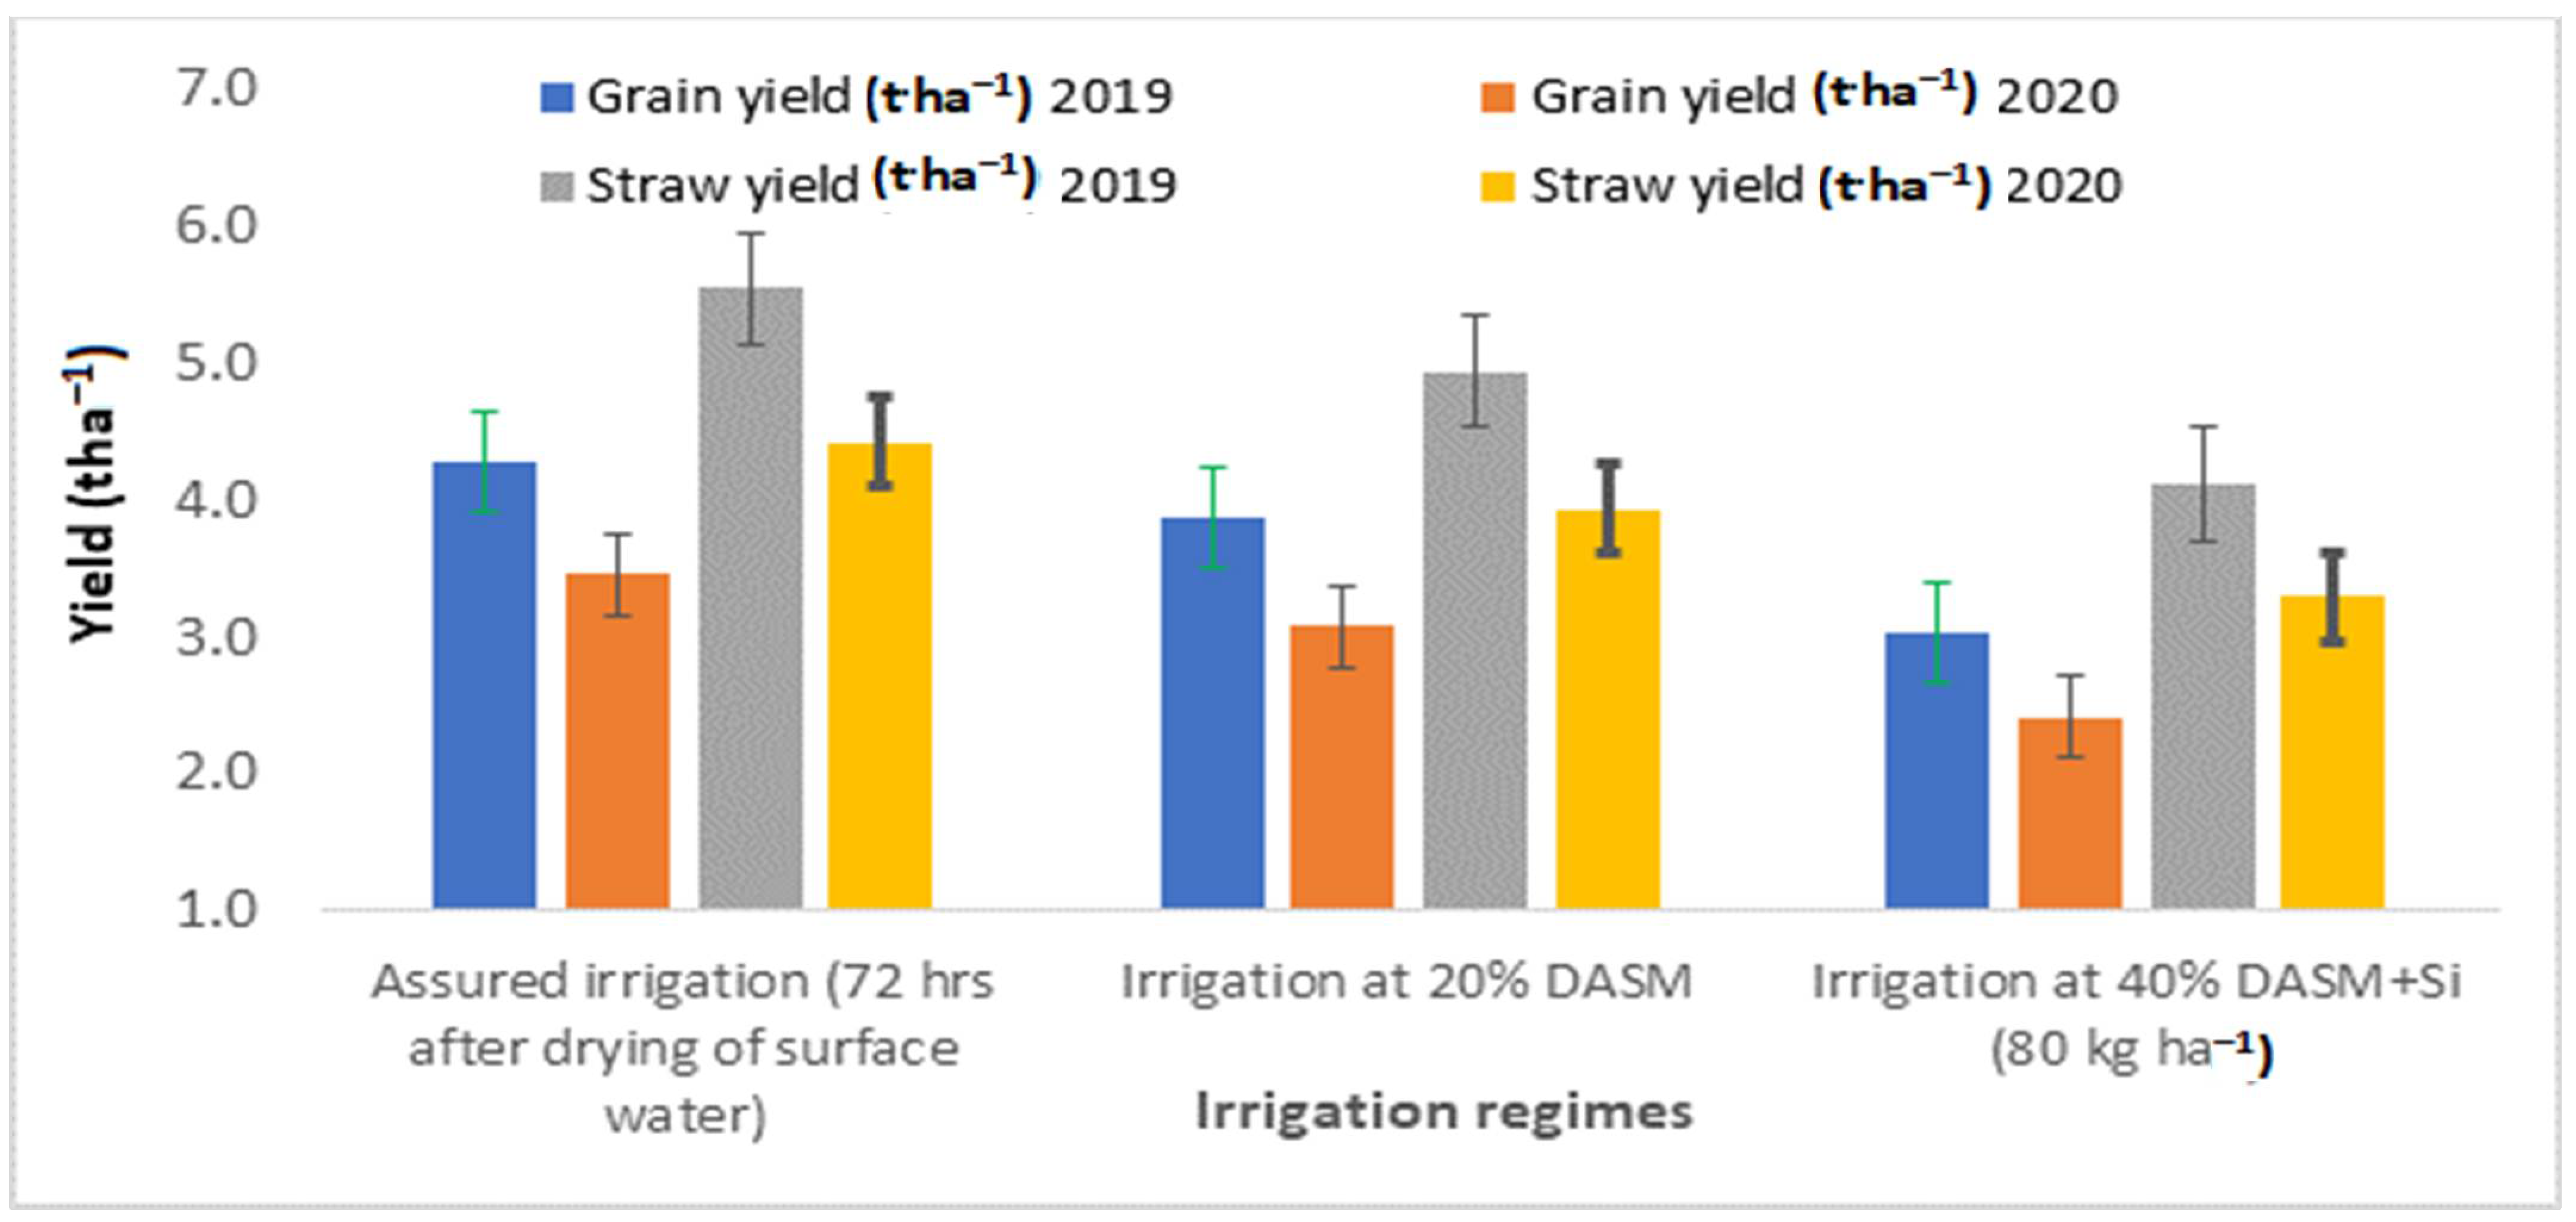
| Irr. –Assured | 882.9 a | 708.9 a | 4.50 a | 4.23 a | 336 a | 314 a | 24.8 a | 24.4 a | 2.33 a | 2.17 a | 74.1 a | 68.4 a | 25.0 a | 23.8 a |
| Irr. at 20% DASM | 792.5 b | 631.4 b | 4.29 b | 4.01b | 326 b | 300 b | 24.5 a | 23.5 b | 2.07 ab | 1.92 b | 69.3 b | 64.4 b | 24.2 b | 23.1 b |
| Irr. at 40% DASM+Si80 | 644.2 c | 513.1c | 4.07 c | 3.47 c | 298 c | 276 c | 23.8 b | 21.9 c | 1.87 b | 1.65 c | 64.8 c | 58.3 c | 23.4 c | 21.6 c |
| N management options | ||||||||||||||
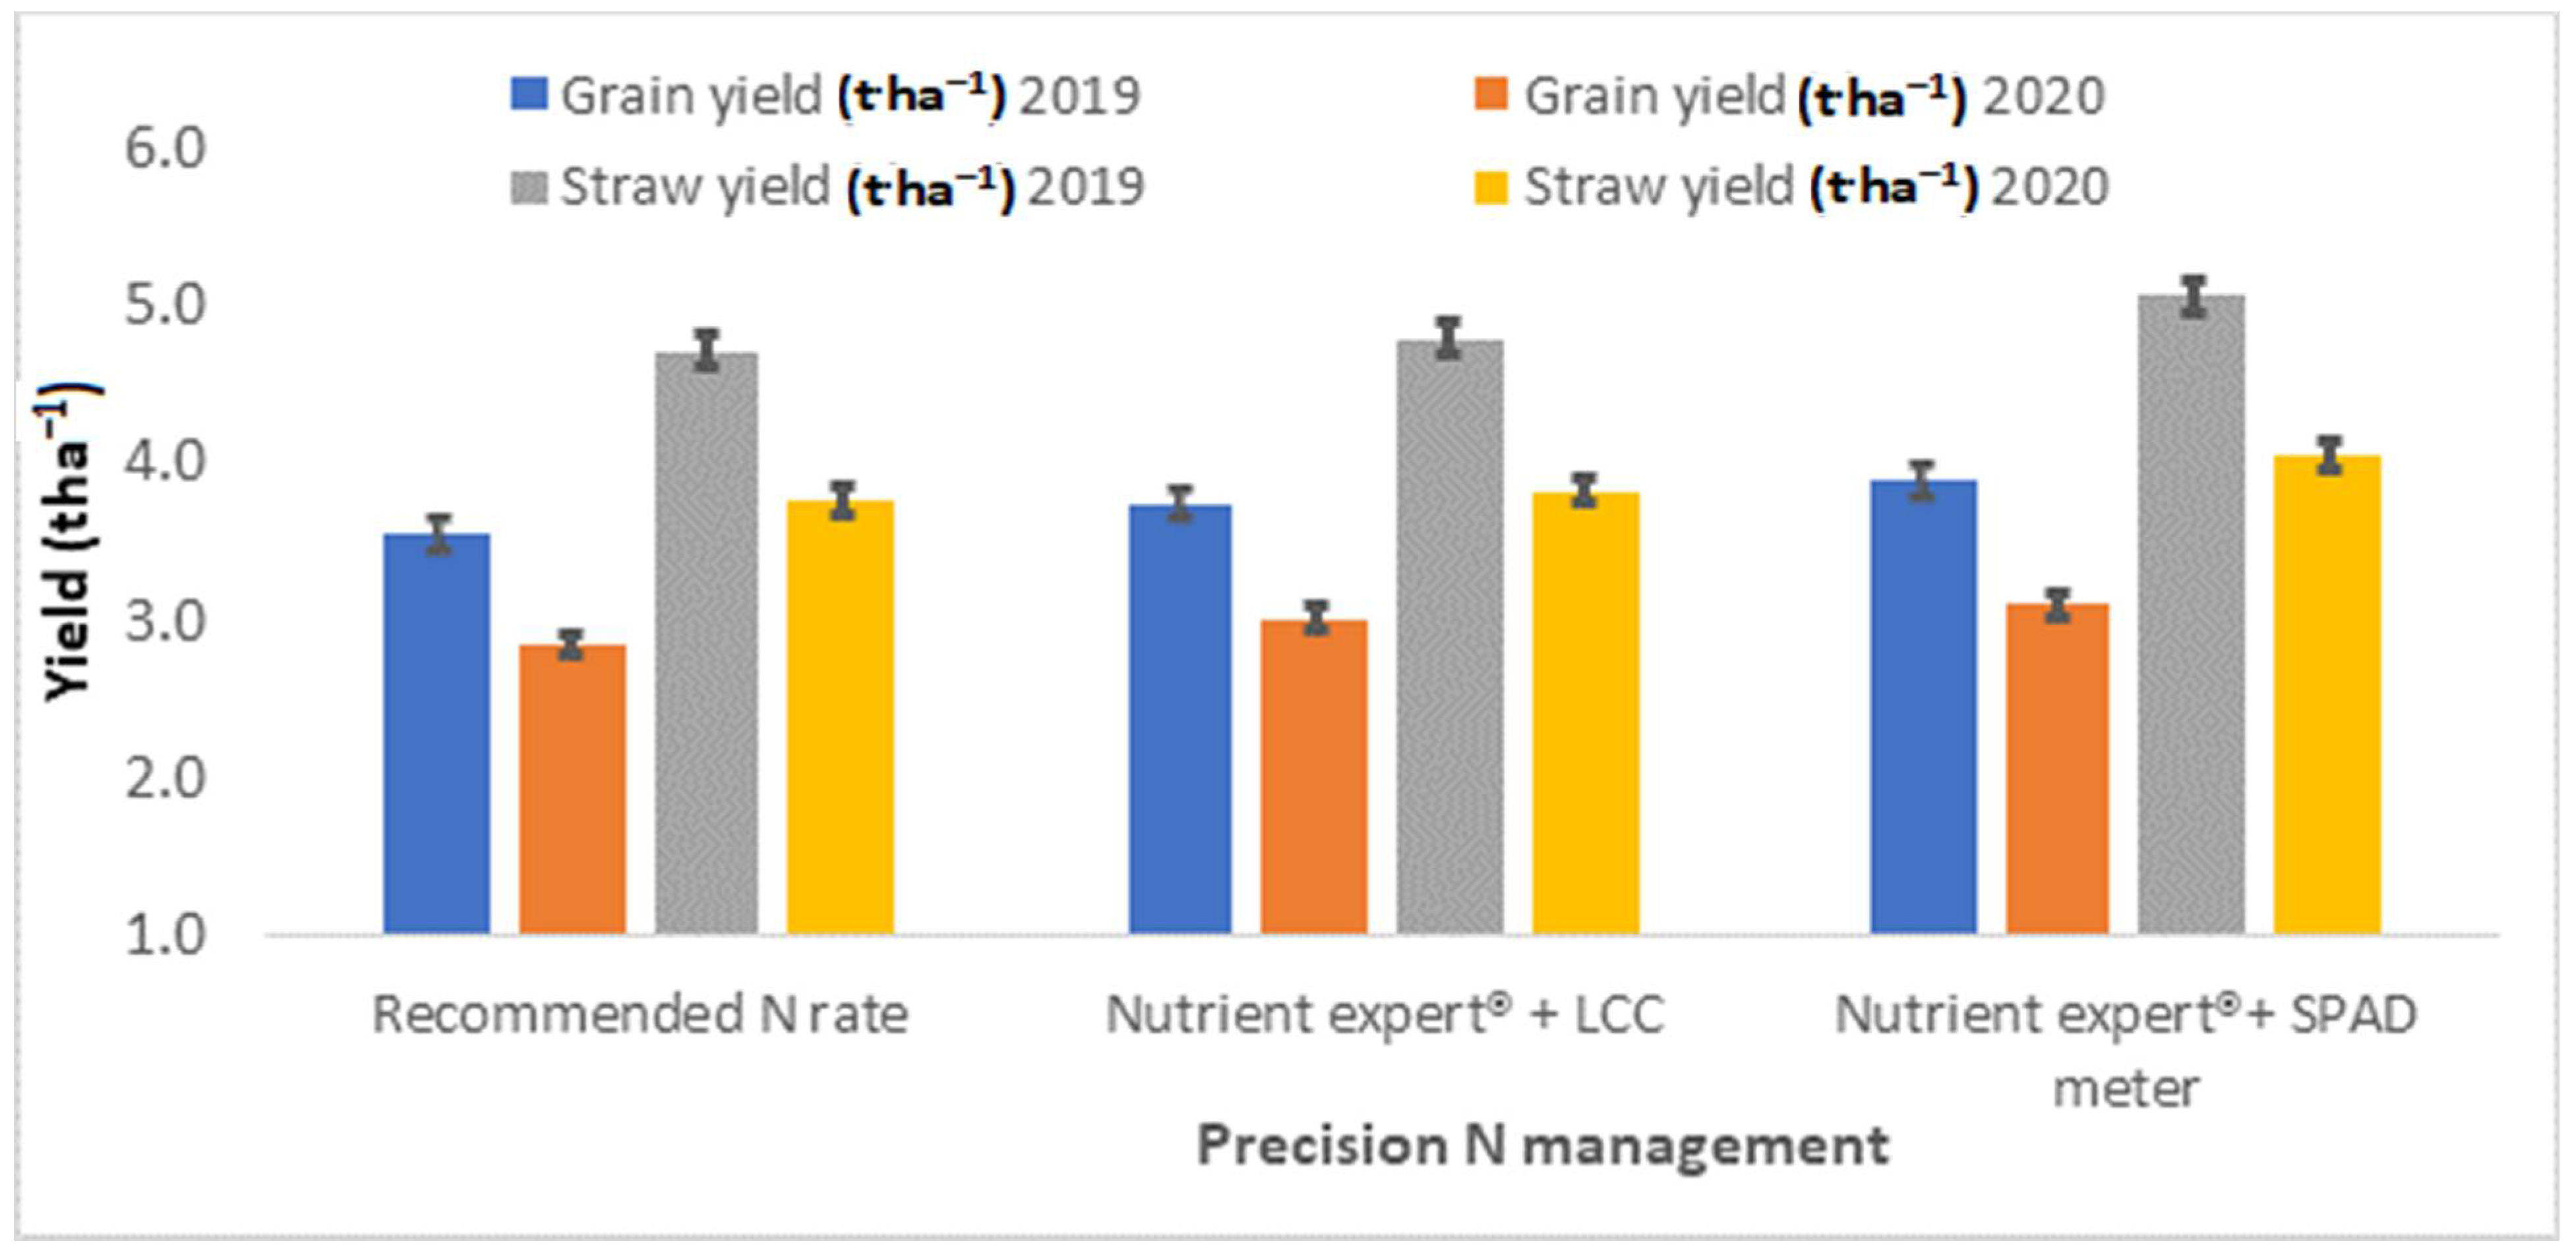
| RDN | 743.6 c | 594.7 c | 4.14 b | 3.71 b | 312 b | 286 b | 23.9 b | 22.8 b | 2.00 b | 1.80 b | 62.6 c | 57.1 c | 23.6 b | 22.3 b |
| NE®+LCC | 769.3 b | 615.9 b | 4.33 a | 3.99 a | 322 a | 298 a | 24.5 a | 23.5 a | 2.04 ab | 1.94 a | 70.0 b | 64.2 b | 24.4 a | 23.0 a |
| NE®+SPAD | 806.7 a | 642.7 a | 4.40 a | 4.04 a | 326 a | 305 a | 24.7 a | 23.6 a | 2.23 a | 2.00 a | 75.6 a | 69.9 a | 24.5 a | 23.2 a |
| Irrigation Regimes/Crop Establishment Methods | Grain Yield (t ha−1) | |||
|---|---|---|---|---|
| 2019 | 2020 | |||
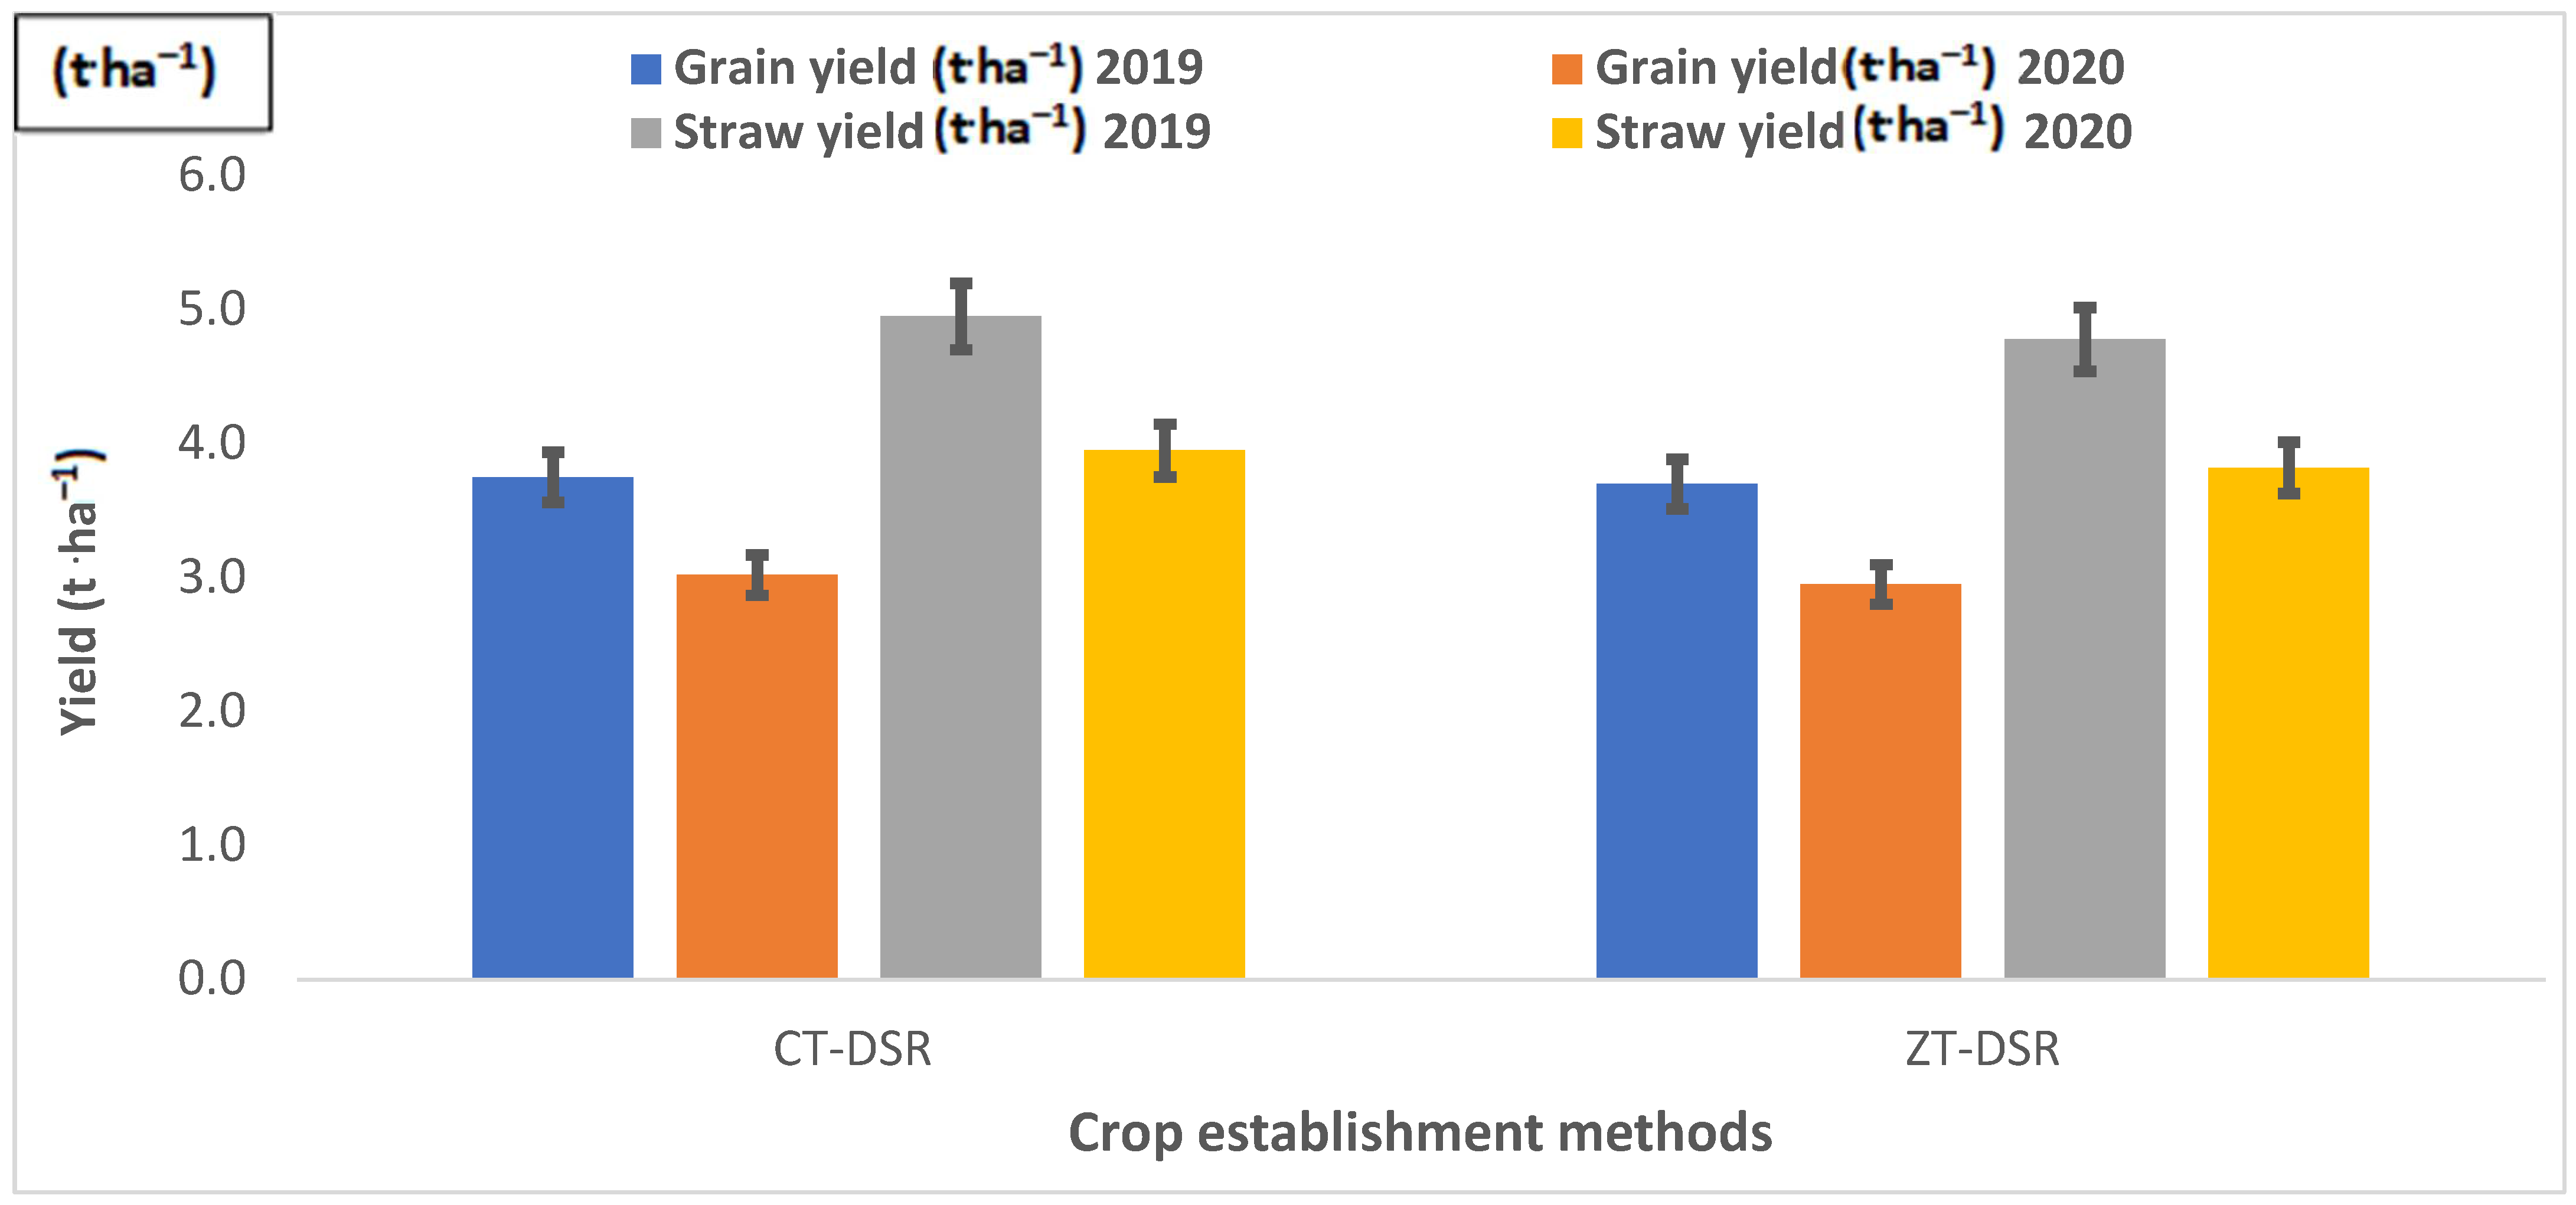
| CT-DSR | ZT-DSR | CT-DSR | ZT-DSR | |
| Irr.–Assured | 4.43 a | 4.13 ab | 3.63 a | 3.29 b |
| Irr. at 20% DASM | 3.95 bc | 3.79 c | 3.14 bc | 3.02 c |
| Irr. at 40% DASM+Si80 | 2.88 e | 3.19 d | 2.30 e | 2.53 d |
| N-Management Options/Irrigation Regimes | Straw Yield (t ha−1) | |||||
|---|---|---|---|---|---|---|
| 2019 | 2020 | |||||
| Irr.–Assured | Irr. at 20% DASM | Irr. at 40% DASM+Si80 | Irr.–Assured | Irr. at 20% DASM | Irr. at 40% DASM+Si80 | |
| RDN | 5.32 bc | 4.58 de | 4.26 ef | 4.25 b | 3.65 cde | 3.40 def |
| NE®+LCC | 5.38 b | 4.88 cd | 4.15 ef | 4.30 ab | 3.89 bc | 3.31 ef |
| NE®+SPAD | 5.91 a | 5.35 b | 3.96 f | 4.71 a | 4.27 b | 3.16 f |
| Treatments | COC (USD ha−1) | Gross Returns (USD ha−1) | Net Returns (USD ha−1) | B:C Ratio | Monetary Efficiency (USD ha−1 day−1) | Production Efficiency (kg ha−1 day−1) | ||||||
|---|---|---|---|---|---|---|---|---|---|---|---|---|
| 2019 | 2020 | 2019 | 2020 | 2019 | 2020 | 2019 | 2020 | 2019 | 2020 | 2019 | 2020 | |
| Crop establishment methods | ||||||||||||
| CT-DSR | 666.4 | 654.8 | 1595.2 a | 1281.1 a | 928.9 a | 626.3 a | 2.38 a | 1.95 a | 8.2 a | 5.6 a | 33.2 a | 27.3 a |
| ZT-DSR | 737.5 | 719.8 | 1568.4 a | 1247.2 a | 830.9 b | 527.4 b | 2.12 b | 1.73 b | 7.4b | 4.8 b | 32.8 a | 26.6b |
| Irrigation regimes | ||||||||||||
| Irr. –Assured | 729.6 | 714.8 | 1814.0 a | 1461.9 a | 1084.4 a | 747.1a | 2.50 a | 2.05 a | 9.6 a | 6.7 a | 37.9 a | 31.2 a |
| Irr. at 20% DASM | 702.6 | 688.1 | 1637.0 b | 1301.2b | 934.4 b | 613.1 b | 2.34 b | 1.90 b | 8.3 b | 5.5 b | 34.2 b | 27.8 b |
| Irr. at 40% DASM+Si80 | 673.6 | 658.9 | 1294.5 c | 1029.2 c | 620.9 c | 370.3c | 1.92 c | 1.56 c | 5.5 c | 3.3c | 26.9 c | 21.8 c |
| N management options | ||||||||||||
| RDN | 706.3 | 691.8 | 1509.9 b | 1207.2 b | 803.6 b | 515.4 b | 2.14 b | 1.75 b | 7.1b | 4.6b | 31.4 b | 25.6 b |
| NE®+LCC | 699.8 | 685.1 | 1584.8 ab | 1272.8 a | 885.0 ab | 587.7 a | 2.26 ab | 1.86 a | 7.8 ab | 5.3 a | 33.1 ab | 27.2 ab |
| NE®+SPAD | 699.8 | 685.1 | 1650.7 a | 1312.4 a | 950.9 a | 627.4 a | 2.35 a | 1.91 a | 8.4 a | 5.7 a | 34.4 a | 27.9 a |
| Treatments | Total Energy Input (MJ ha−1) | Total Energy Output (MJ ha−1) | Net Energy (MJ ha−1) | Energy-Use Efficiency | Energy Profitability | Specific Energy (MJ kg−1 ha−1) | ||||||
|---|---|---|---|---|---|---|---|---|---|---|---|---|
| 2019 | 2020 | 2019 | 2020 | 2019 | 2020 | 2019 | 2020 | 2019 | 2020 | 2019 | 2020 | |
| Crop establishment methods | ||||||||||||
| CT-DSR | 19,546 | 18,948 | 117,036 a | 93,819 a | 97,490 a | 74,871 a | 6.00 a | 4.96 a | 5.00 a | 3.96 a | 5.44 b | 6.55 b |
| ZT-DSR | 62,719 | 62,121 | 114,195 a | 91,048 a | 51,476 b | 28,927 b | 1.82 b | 1.47 b | 0.82 b | 0.47 b | 17.28 a | 21.48 a |
| Irrigation regimes | ||||||||||||
| Irr. –Assured | 41,362 | 40,815 | 132,128 a | 106,140 a | 90,767 a | 65,325 a | 4.46 a | 3.68 a | 3.46 a | 2.68 a | 9.95 c | 12.24 c |
| Irr. at 20% DASM | 40,950 | 40,352 | 118,578 b | 94,516 b | 77,629 b | 54,164 b | 4.05 b | 3.31 b | 3.05 b | 2.31b | 10.82 b | 13.38 b |
| Irr. at 40% DASM+Si80 | 41,085 | 40,436 | 96,140 c | 76,644 c | 55,056 c | 36,209 c | 3.23 c | 2.65 c | 2.23 c | 1.65 c | 13.30 a | 16.42 a |
| N management options | ||||||||||||
| RDN | 42,543 | 41,945 | 111,169 c | 88,912 c | 68,625 c | 46,967 c | 3.53 c | 2.90 c | 2.53 c | 1.90 c | 12.30 a | 15.17 a |
| NE®+LCC | 40,427 | 39,829 | 115,082 b | 92,236 b | 74,654 b | 52,407 b | 4.02 b | 3.32 b | 3.02 b | 2.32 b | 11.12 b | 13.71b |
| NE®+SPAD | 40,427 | 39,829 | 120,596 a | 96,152 a | 80,169 a | 56,324 a | 4.19 a | 3.43 a | 3.19 a | 2.43 a | 10.65 c | 13.17 b |
Publisher’s Note: MDPI stays neutral with regard to jurisdictional claims in published maps and institutional affiliations. |
© 2022 by the authors. Licensee MDPI, Basel, Switzerland. This article is an open access article distributed under the terms and conditions of the Creative Commons Attribution (CC BY) license (https://creativecommons.org/licenses/by/4.0/).
Share and Cite
Pratap, V.; Dass, A.; Dhar, S.; Babu, S.; Singh, V.K.; Singh, R.; Krishnan, P.; Sudhishri, S.; Bhatia, A.; Kumar, S.; et al. Co-Implementation of Tillage, Precision Nitrogen, and Water Management Enhances Water Productivity, Economic Returns, and Energy-Use Efficiency of Direct-Seeded Rice. Sustainability 2022, 14, 11234. https://doi.org/10.3390/su141811234
Pratap V, Dass A, Dhar S, Babu S, Singh VK, Singh R, Krishnan P, Sudhishri S, Bhatia A, Kumar S, et al. Co-Implementation of Tillage, Precision Nitrogen, and Water Management Enhances Water Productivity, Economic Returns, and Energy-Use Efficiency of Direct-Seeded Rice. Sustainability. 2022; 14(18):11234. https://doi.org/10.3390/su141811234
Chicago/Turabian StylePratap, Vijay, Anchal Dass, Shiva Dhar, Subhash Babu, Vinod Kumar Singh, Raj Singh, Prameela Krishnan, Susama Sudhishri, Arti Bhatia, Sarvendra Kumar, and et al. 2022. "Co-Implementation of Tillage, Precision Nitrogen, and Water Management Enhances Water Productivity, Economic Returns, and Energy-Use Efficiency of Direct-Seeded Rice" Sustainability 14, no. 18: 11234. https://doi.org/10.3390/su141811234