Review

Review on Infrared Imaging Technology

1
Shandong Hi-Speed Construction Management Group Co., Ltd., Jinan 250001, China
2
TECH Traffic Engineering Group Co., Ltd., Beijing 100048, China
3
Shandong High-Speed Group Co., Ltd., Jinan 250014, China
4
School of Traffic and Transportation, Lanzhou Jiaotong University, Lanzhou 730070, China
5
School of Qilu Transportation, Shandong University, Jinan 250002, China
6
Suzhou Research Institute, Suzhou 215000, China
*
Authors to whom correspondence should be addressed.
Sustainability 2022, 14(18), 11161; https://doi.org/10.3390/su141811161
Submission received: 2 August 2022 / Revised: 29 August 2022 / Accepted: 2 September 2022 / Published: 6 September 2022

Abstract

:
The application of infrared camera-related technology is a trending research topic. By reviewing the development of infrared thermal imagers, this paper introduces several main processing technologies of infrared thermal imagers, expounds the image nonuniformity correction, noise removal, and image pseudo color enhancement of infrared thermal imagers, and briefly analyzes some main algorithms used in image processing. The technologies of blind element detection and compensation, temperature measurement, target detection, and tracking of infrared thermal imager are described. By analyzing the main algorithms of infrared temperature measurement, target detection, and tracking, the advantages and disadvantages of these technologies are put forward. At the same time, the development of multi/hyperspectral infrared remote sensing technology and its application are also introduced. The analysis shows that infrared thermal imager processing technology is widely used in many fields, especially in the direction of autonomous driving, and this review helps to expand the reader’s research ideas and research methods.

1. Introduction

Infrared is a type of electromagnetic wave. If the temperature of an objects is above the thermodynamic absolute temperature, infrared radiation occurs. Thermal infrared imaging usually refers to mid-infrared imaging and far-infrared imaging. Thermal imaging is the use of infrared detectors and optical imaging objectives, receiving the infrared radiation energy of the measured target, and reflecting its distribution pattern to the photosensitive element of the infrared detector; the detector sends information to the electronic components of the sensor, image processing, thereby obtaining infrared thermal images [1]. Infrared thermal imaging is a non-destructive and non-contact detection technology, which was first applied in the military field [2]. It is divided into refrigeration type and uncooled type infrared technology. The refrigeration type infrared thermal imager was used in the laboratory in the early stage because of the relatively large volume of the refrigeration equipment. The research of the refrigeration type imager is in the aspects of improving the working temperature, long wave detection, and system integration. Uncooled infrared focal plane technology belongs to the third generation of infrared detection technology. The detectors used are mainly focal plane detectors and two-color detectors. The uncooled type is widely used. Hyperspectral remote sensing is a remote sensing science and technology with high spectral resolution, and its foundation is spectroscopy. Remote sensing technology is to accurately receive and record the wavelength changes caused by the interaction between electromagnetic waves and materials and provide rich ground feature information through the reflected difference of action. This feature is determined by the macroscopic and microscopic characteristics of ground features. From the initial remote sensing technology to the present hyperspectral remote sensing stage, remote sensing technology has entered a new stage, and is widely used in geological survey [3], agriculture [4], vegetation remote sensing [5], marine remote sensing [6], environmental monitoring [7], and other aspects. However, it has many spectrum segments and data redundancy, so a series of processing such as dimension reduction and denoising is needed.
With the development of science and technology, many advantages of infrared thermal imaging and hyperspectral remote sensing technology have been exploited, such as forming a thermal image by passively receiving radiation from the human body. In the process of taking thermal images, the human body does not accept the effects of X-ray, ultrasonic, and electromagnetic waves. This diagnostic method has the advantages of being harmless to the human body, good concealment, and all-weather work; it is widely used in medical treatment [8], construction [9], electric power [10], aviation [11], transportation [12], and other fields. However, infrared thermal imaging requires a series of processing steps because of its low image contrast and poor image detail resolution. The purpose of this review is to summarize the previous research, point out the shortcomings of the research, and summarize the optimization algorithm based on deep learning and the development direction of infrared thermal imager, which has great application potential in an advanced driving assistance system.

2. Infrared Thermal Imagers

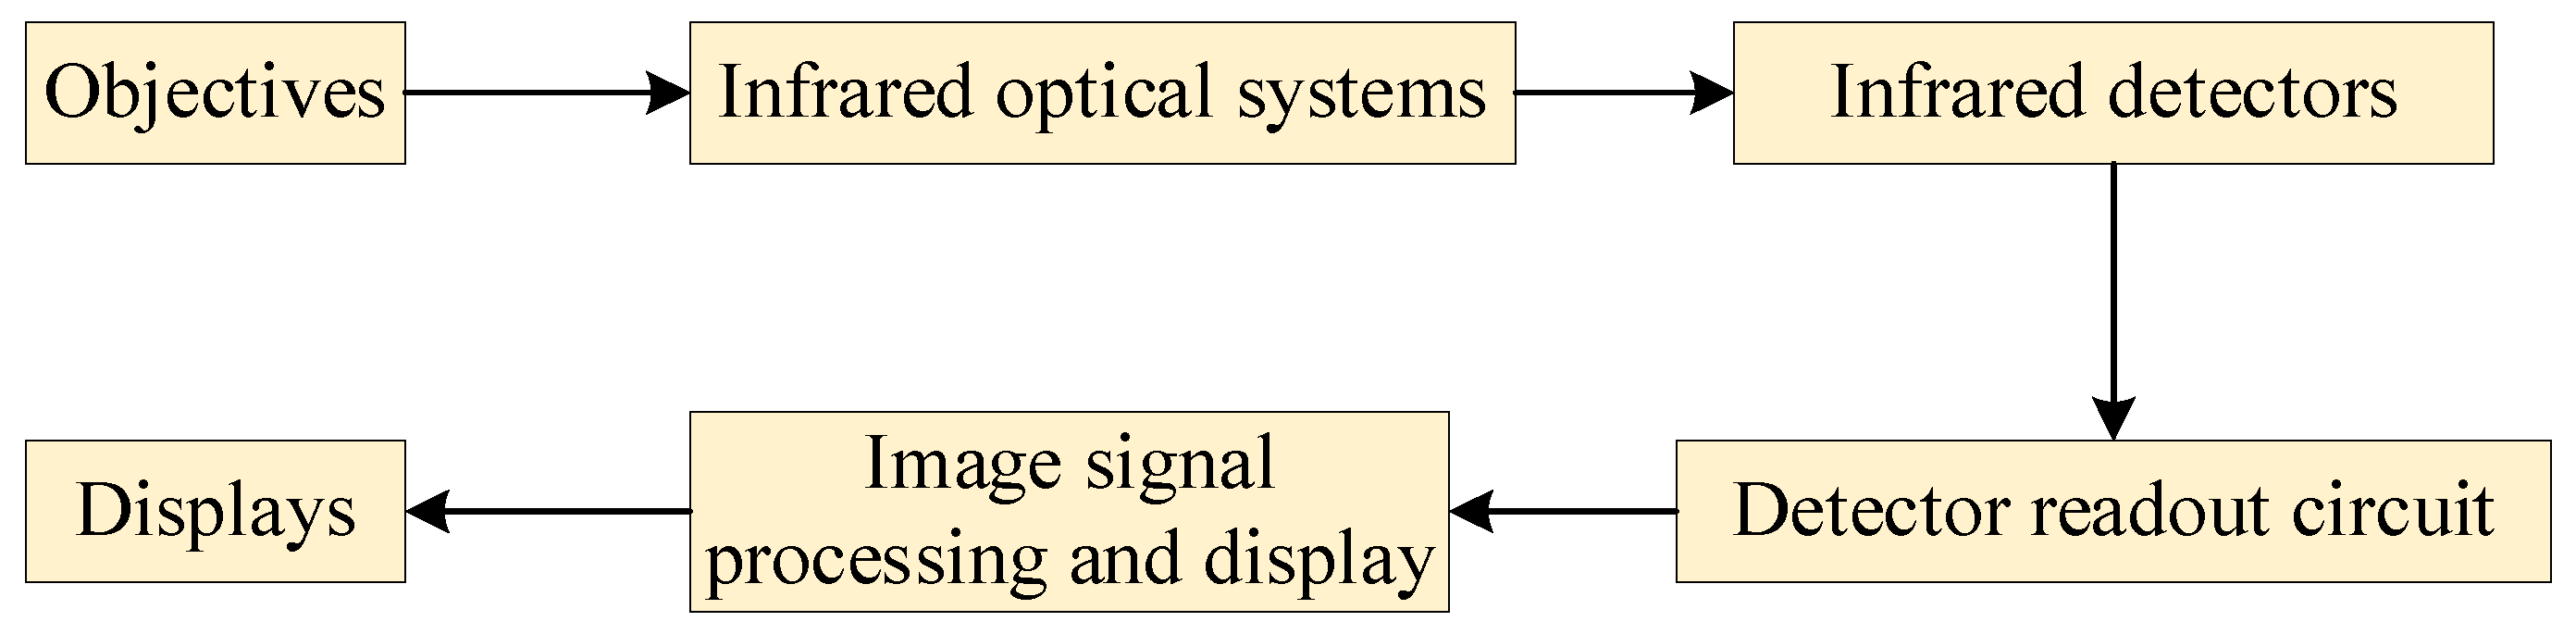
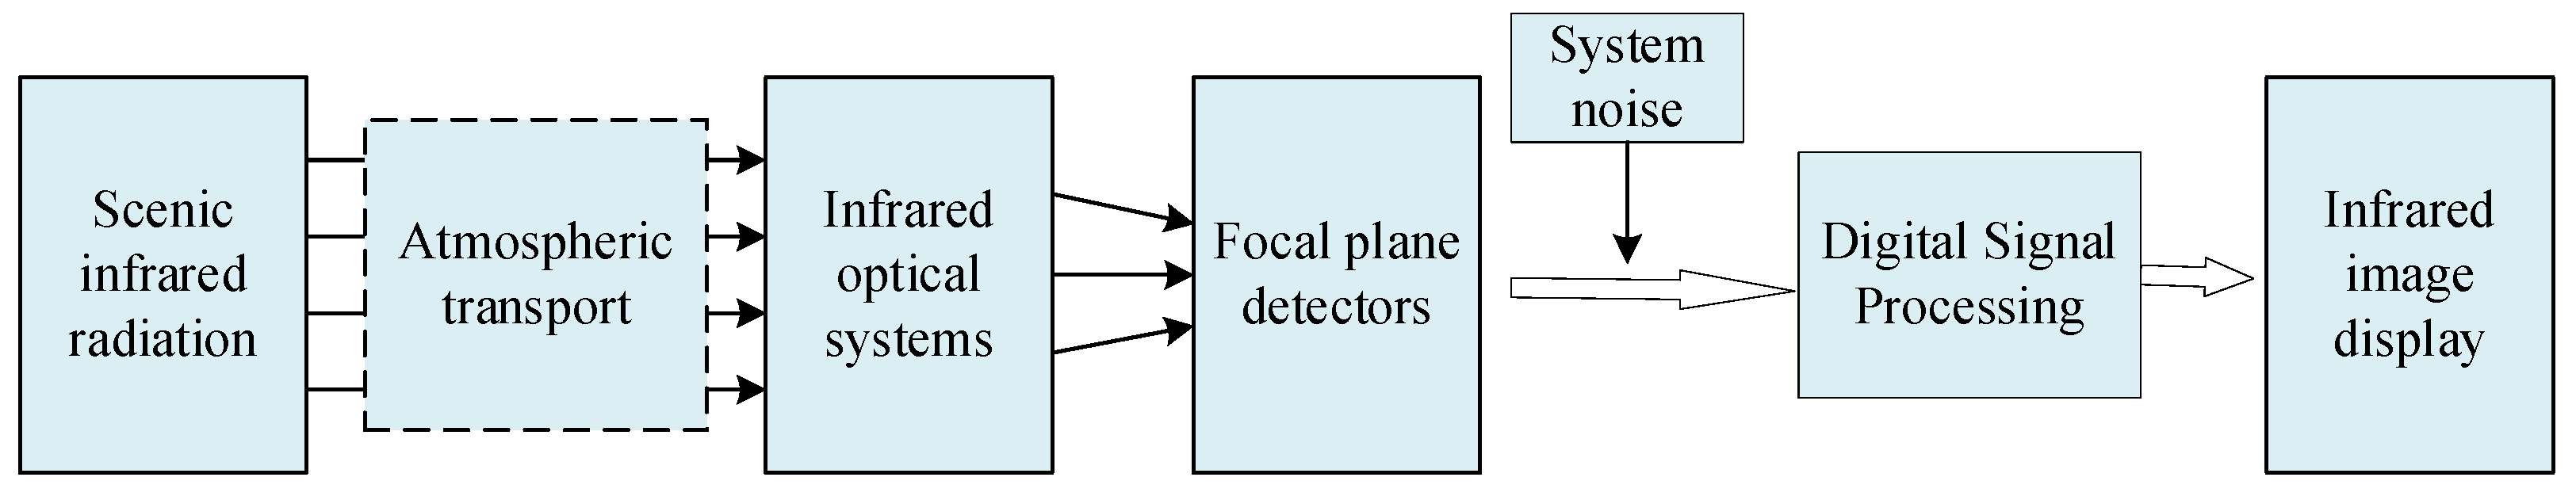
Components of an Infrared Thermal Imager

Thermal imaging systems generally have four basic components: the optical system, the infrared detector, the electronic information processing system, and the display system. As shown in Figure 1, the function of the optical system is to focus the received infrared rays onto the photosensitive elements of the infrared detector. The infrared detector converts infrared radiation into an electrical signal. It is the core component of the thermal imaging camera. Amplification and processing of electrical signals is carried out by electronic information processing systems. The display shows the electrical signal as a visible image on a monitor or LED screen.
Focal plane thermal imaging cameras have a two-dimensional flat detector shape. They have an electronic scanning function. The target to be measured is simply passed through a simple objective lens, focusing infrared on the plane of the infrared detector array, essentially similar to the principle of photography. The imaging principle is shown in Figure 2 [13].
Focal plane detectors consist of arrays of tens of thousands of sensing elements. The uniformity of its response rate is good, as well as its size in microns and low power consumption. The resistive microbolometer type is the most technically mature among infrared detectors, with the broadest range of applications. As the infrared radiation passes through the optical lens onto the detection pixel, it causes the temperature of the sensitive area to rise and the resistance of the thermal film to change. The principle is shown in Figure 3.
As shown in Figure 3, R1 is the built-in detector, R2 is the working detector, R3 and R4 are standard resistors, and E is the sampled electrical signal. As there is no infrared radiation, the bridge circuit remains balanced and no voltage signal is output at this time. When there is infrared radiation, the temperature of resistance R2 changes, so the resistance value of R2 also changes. At this time, the circuit is an unbalanced state, and a voltage difference is generated at both ends of the signal output circuit. Therefore, there will be output of voltage signal [15].
The performance indicators of infrared thermal imager are pixels, spatial resolution, temperature resolution, minimum resolution, spectral response, frame rate, detection recognition, and identification distance. Its main function is to convert the infrared radiation emitted by the measured target into a two-dimensional grayscale or pseudo-color signal, thus showing the two-dimensional temperature distribution of the target. It can also be detected at a long distance, with precise guidance, strong detection capability, long detection distance, and ability to work around the clock in rain and fog or completely lightless environments.

3. Thermal Imaging Camera Processing Technology

The image collected by the infrared thermal imager is dark, the contrast between the target image and the background is low, the resolution is low, and the edge is fuzzy. Due to the limitations of the external environment and the infrared thermal imager’s own materials, the accuracy of temperature measurement is low. Due to the influence of various noises, the image collected by the infrared thermal imager needs to be processed to improve the accuracy. The processing technology of infrared thermal imager is to correct, denoise, and enhance the non-uniformity of infrared image through relevant algorithms, so as to improve the temperature measurement accuracy, contrast, resolution, and signal-to-noise ratio of infrared image.

3.1. Infrared Image Processing Technology

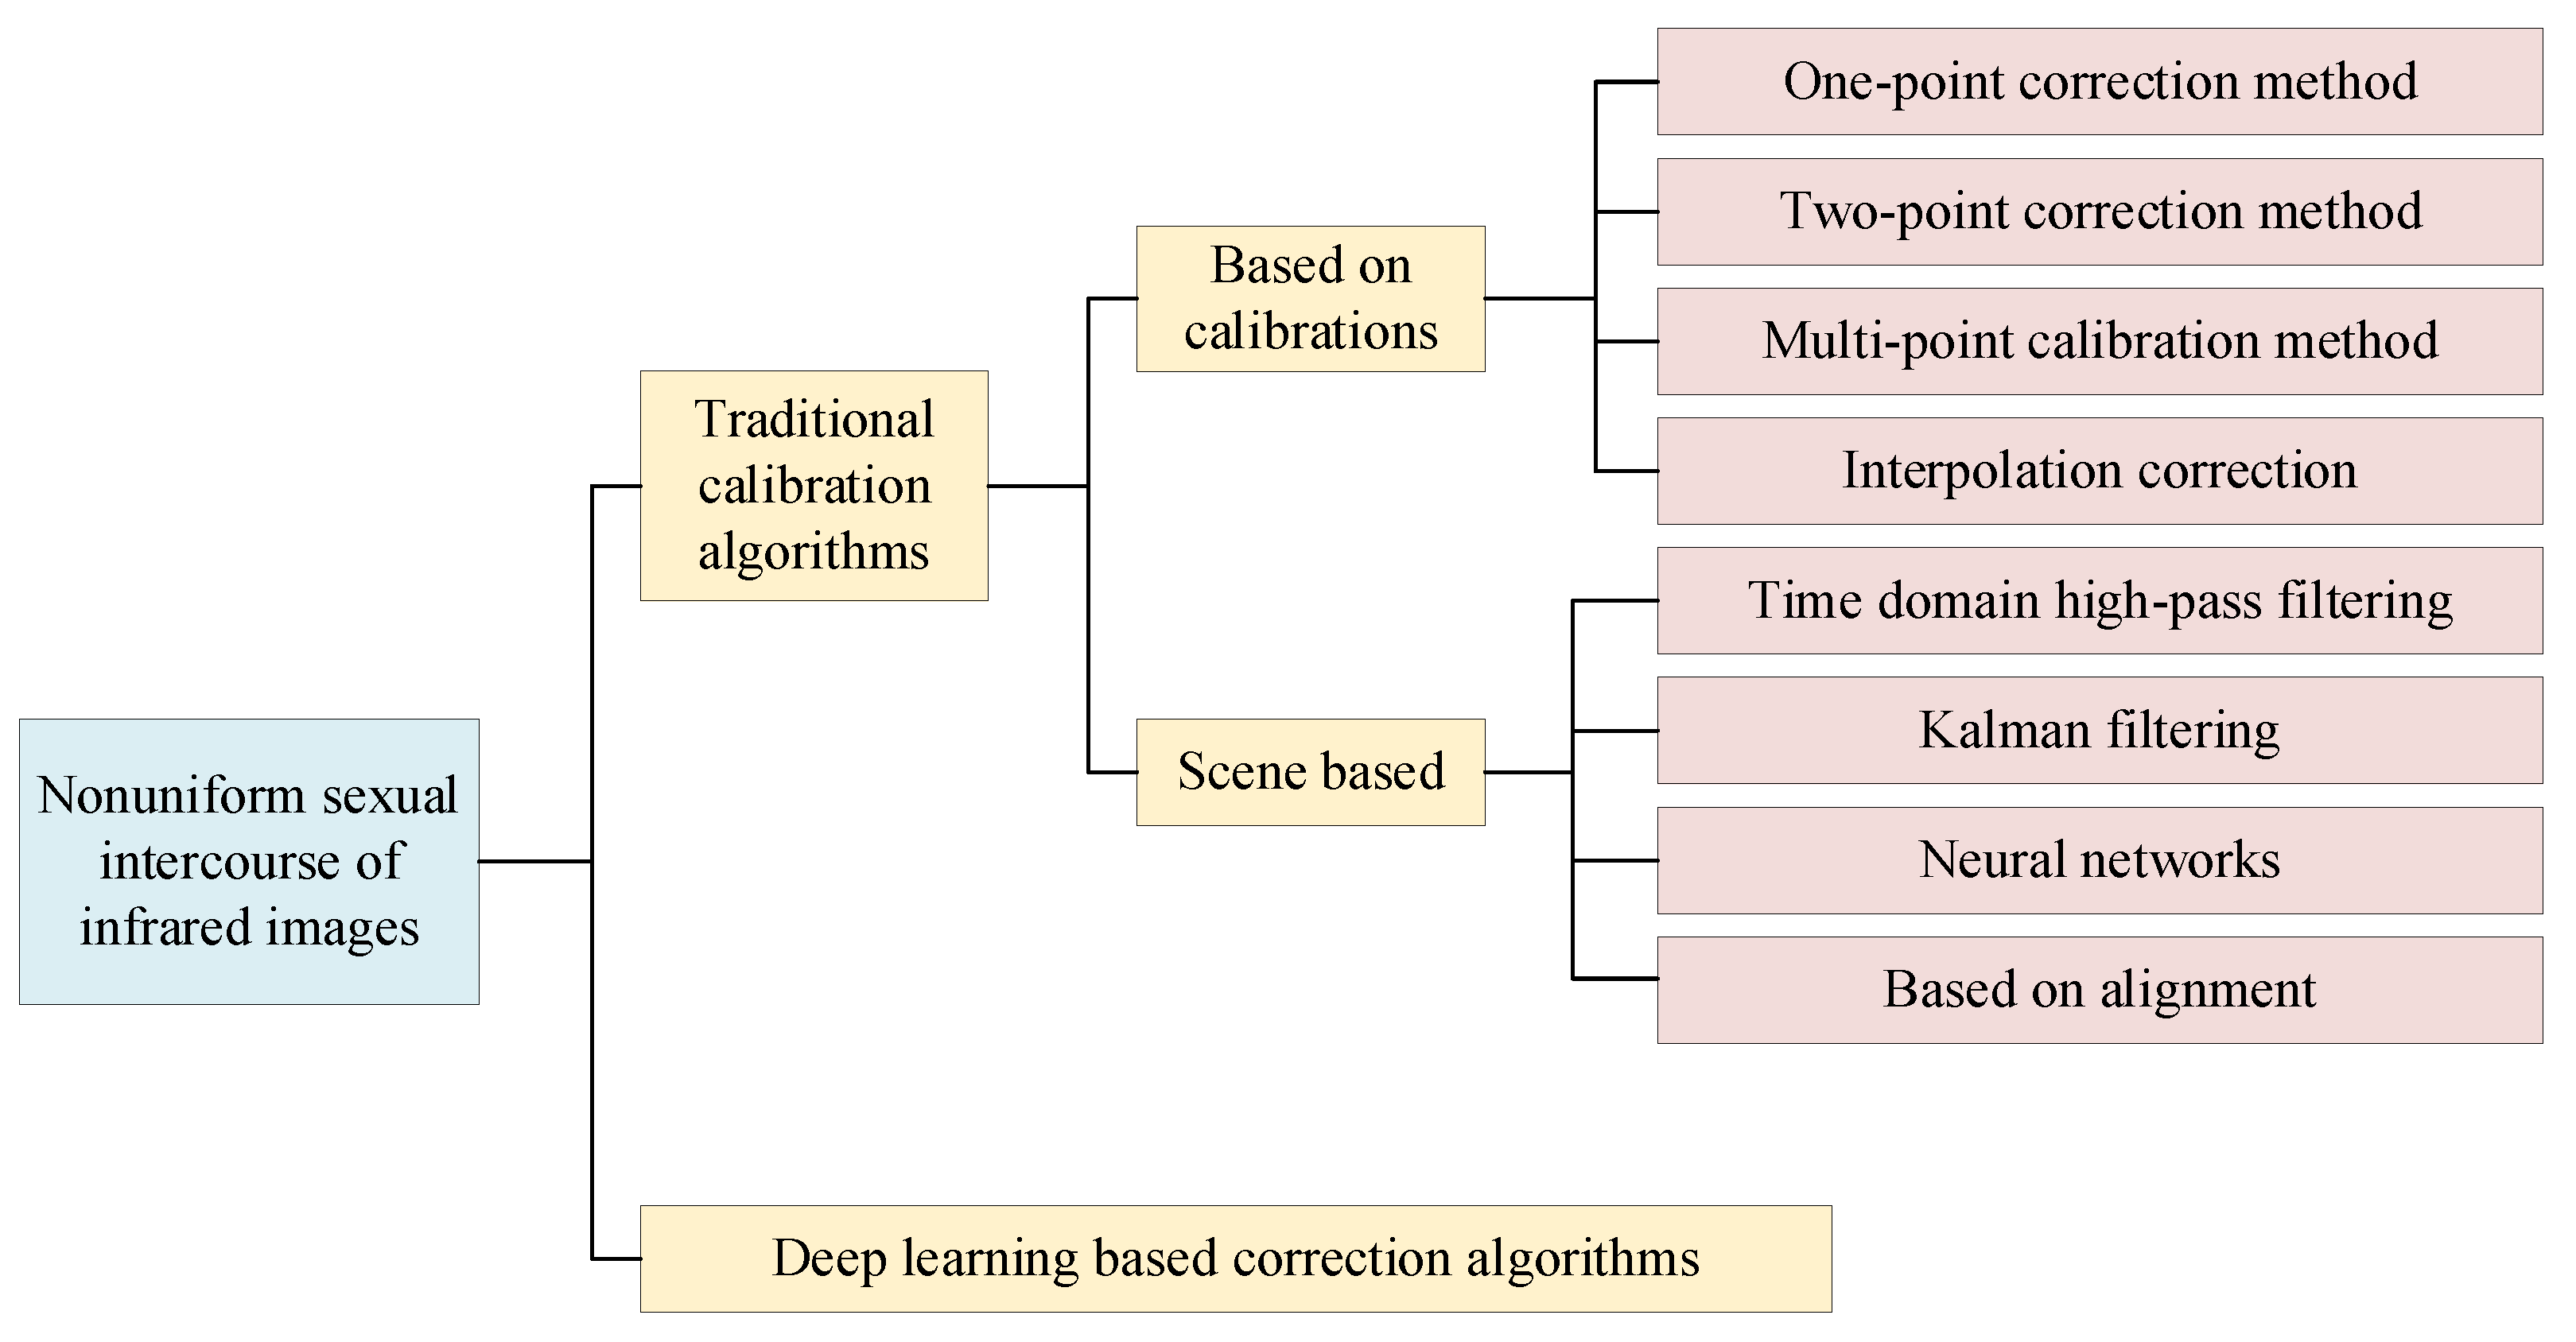
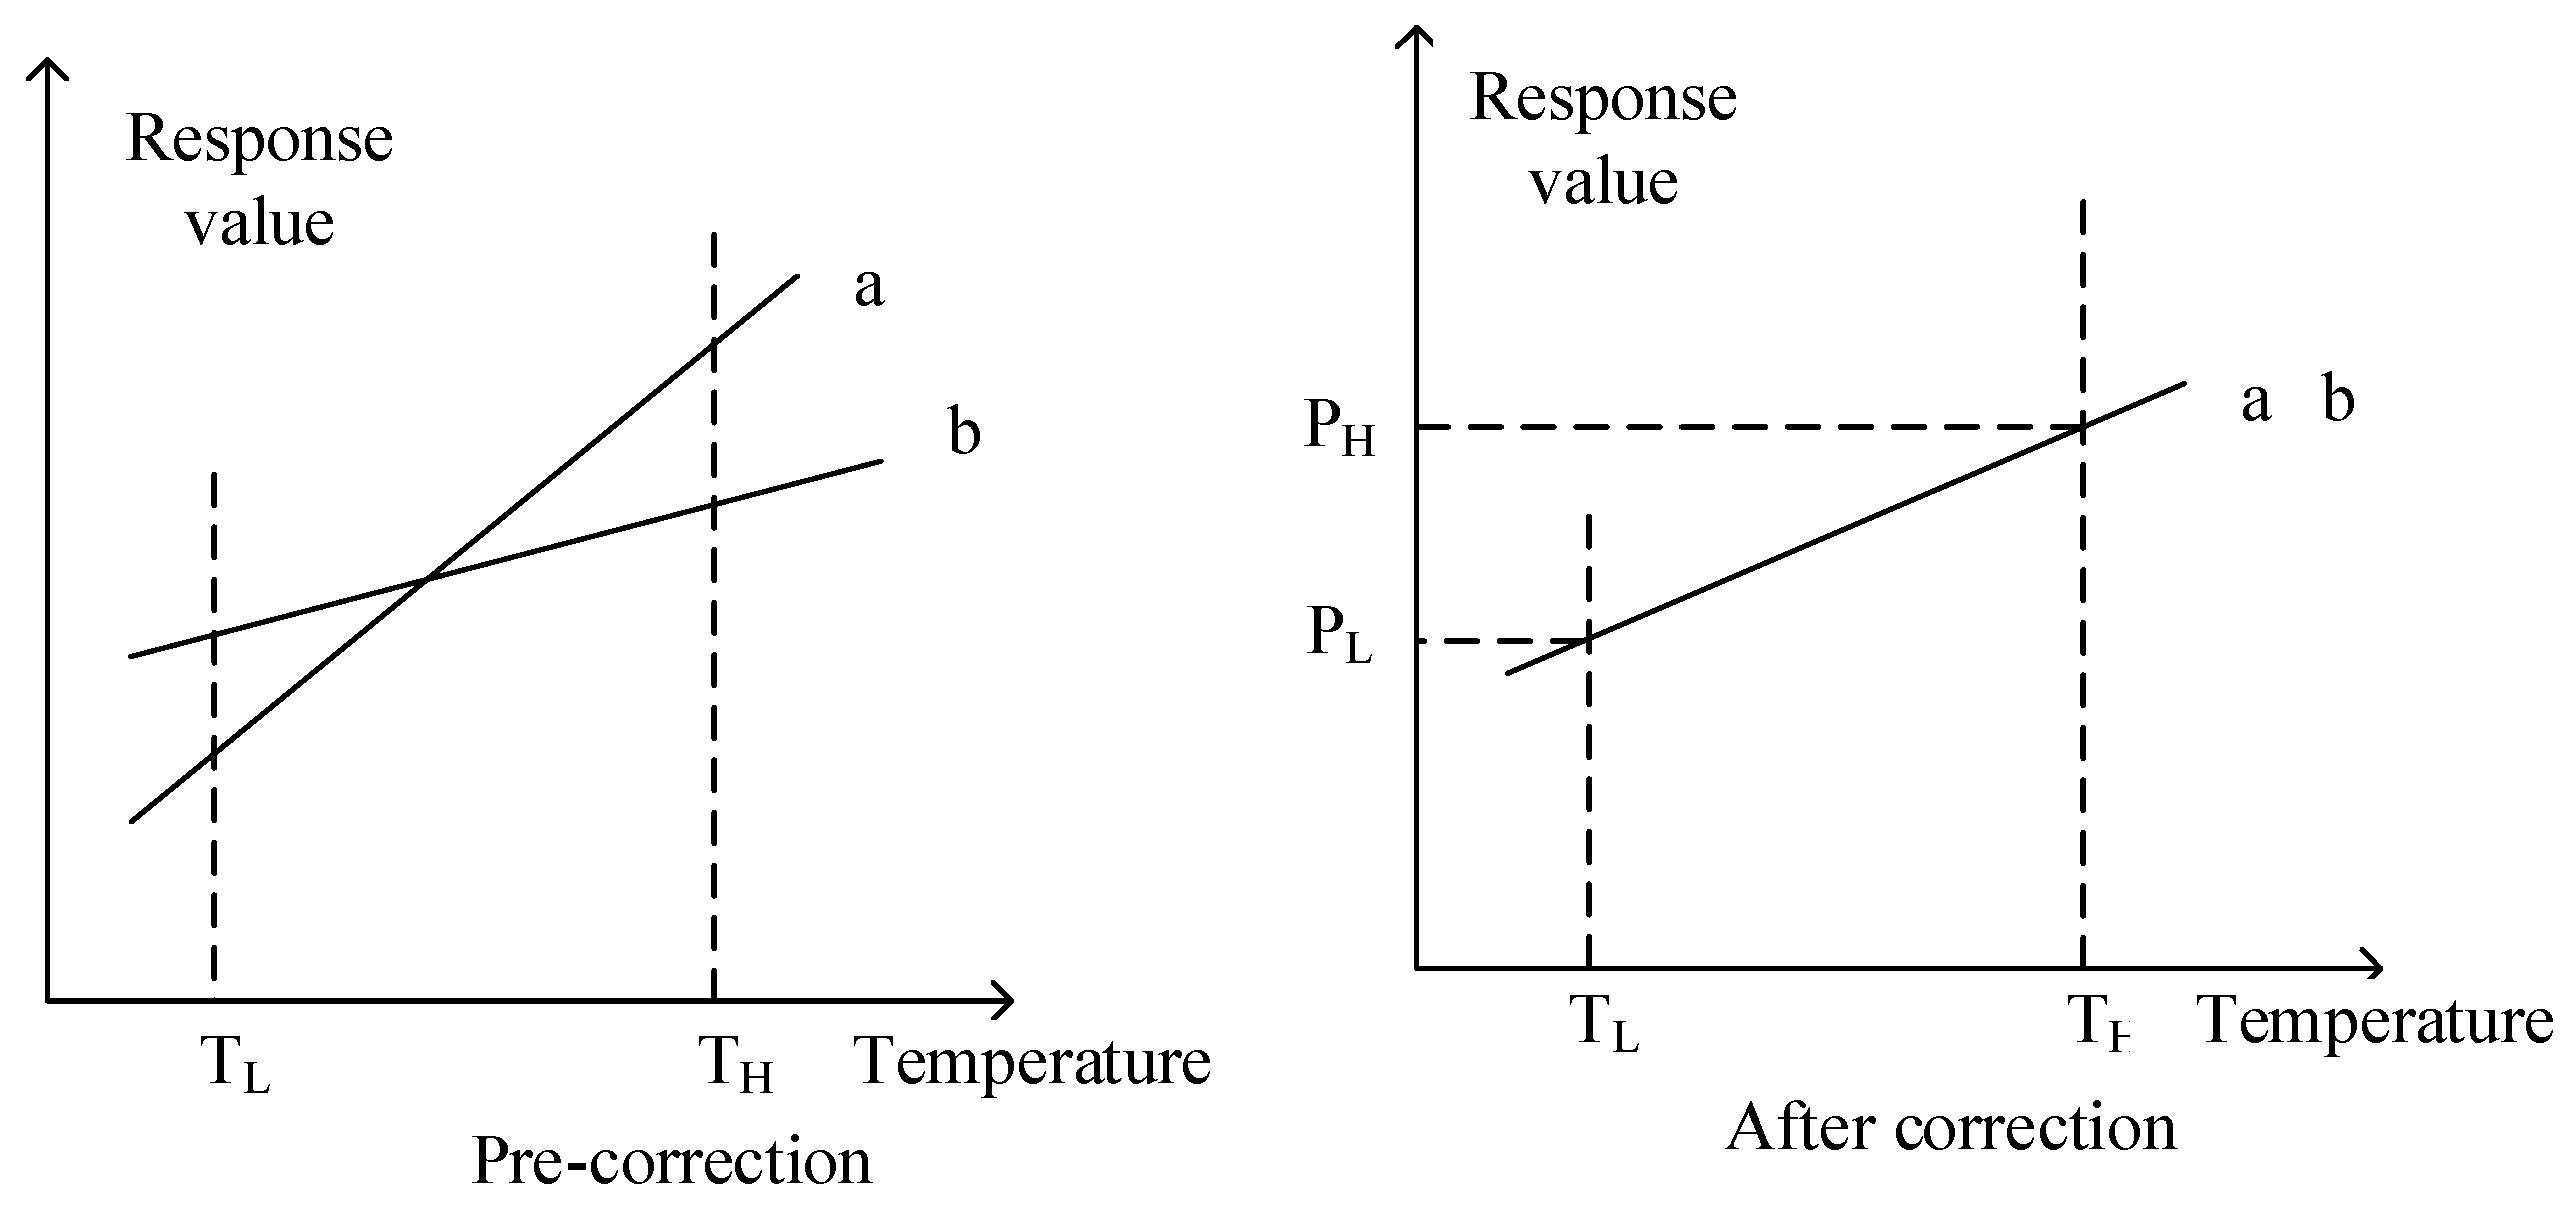
3.1.1. Non-Uniformity Correction for Infrared Images

Under uniform blackbody radiation, the percentage between the standard deviation of response values of all effective pixels of infrared focal plane detector and the mean value of response is as shown in Formula 3.1 [16].
N U = 1 V a v g 1 M × N ( d + h ) i = 1 M j = 1 N ( V i j V a v g ) 2 V a v g = 1 M × N ( d + h ) i = 1 M j = 1 N V i j
Equation (1) is the definition of nonuniformity correction. It has good applicability. In the equation, M and N are the row height and column height of the infrared focal plane detector array, respectively; Vij is the response output voltage of pixels in row i and column j of the infrared focal plane detector; Vavg is the invalid detection element of the output voltage of the infrared detector. d and h are the number of dead and overheated probes in the array process, respectively. It is generally considered that the infrared focal plane detector is a dead phase element when the response rate is less than 0.1 times the average pixel response rate. The noise voltage is greater than ten times the average noise voltage. It is an overheated pixel. In general, Vavg is used as an index to evaluate and compare the nonuniformity of the infrared focal plane [17].
The nonuniformity of infrared images is related to the manufacturing materials, technology, working state of devices, external input, the influence of the optical system, and so on. The nonuniformity of infrared images is related to the manufacturing materials, technology, working state of devices, external input, the influence of optical systems, and so on. Therefore, the nonuniformity correction of image processing can achieve a more direct effect. The traditional infrared image nonuniformity correction methods commonly used are calibration-based correction and scene-based correction algorithms. Calibration methods based on calibration class include one-point correction method, two-point correction method [18], multi-point correction method, and interpolation correction method. The correction methods based on scene class include time-domain high pass filtering method, neural network method, Kalman filtering method, and registration-based method, as shown in Figure 4.
Sribner et al. [19] proposed a scene-based nonuniformity correction method, which is realized by an algorithm based on time high pass filter and an algorithm based on an artificial neural network. This algorithm can effectively eliminate spatial noise and is more efficient than traditional algorithms. Qian et al. [20] proposed a new algorithm based on spatial low pass and spatiotemporal high pass. By eliminating the high spatial frequency part of nonuniformity and retaining the low spatial frequency part of nonuniformity, the convergence speed is improved, but ghosts can easily to appear in the scene. Therefore, Harris et al. [21] developed a constant statistical algorithm, which can eliminate most of the ghosting phenomenon that plagues the nonuniformity correction algorithm and improve the overall accuracy of image correction. Torres et al. [22] developed a scene-based adaptive nonuniformity correction method, which mainly improves the nonuniformity correction effect of infrared images by estimating the detection parameters. Jiang et al. [23] proposed a new nonuniformity correction algorithm based on scene matching. By matching two adjacent pictures reflecting the same scene, the nonuniformity correction and adaptation to the drift of nonuniformity with the ambient temperature change are realized. Bai [24] proposed a nonuniformity correction method based on calibration data. Using the neural network principle work, a correction model integrating the integration time term is constructed. The model is trained with the blackbody gray image and the corresponding integration time as the input, the gray mean value of the blackbody image as the expected value. The obtained correction network can effectively adapt to the nonuniformity caused by the change of integration time. Yang [25] proposed an improved strip noise removal algorithm. Combining spatial domain and transform domain combined with wavelet transform and moving window matching algorithm, the accuracy of image nonuniformity correction is improved. Huang et al. [26] proposed an algorithm for selecting the calibration point of the multipoint method. By taking the residual as the judgment condition for selecting the calibration point, the calibration point on the focal plane response curve can be adaptively determined, so that the correction accuracy of the multipoint method has been significantly improved. Wang et al. [27] proposed a nonuniformity correction method with variable integration time using pixel-level radiation self-correction technology. By establishing the radiation response equation for each pixel in the infrared detector, the radiation flux map of the scene is estimated, and the radiation flux map is corrected by using the linear correction model to realize the nonuniformity correction under any integration time.
  • Nonuniformity correction of infrared image based on two-point calibration [28]
When the gain of the infrared focal plane detector and the component of the DC bias are inconsistent, multiplication and additive noise are generated. When performing two-point correction, it is generally believed that each cell of the detector is linear and the thermal response rate is stable. The infrared thermal imaging system is in an environment where the ambient temperature changes little, and the external incident infrared energy is within the calibration temperature range. If the 1/f noise is very small or even negligible, under this condition, the output expression of the pixel response of the focal plane detector is:
x i j ( ϕ ) = u i j ϕ + v i j
In Equation (2), it refers to the gain coefficient of the pixel and the DC bias coefficient of the pixel, both of which are called stable thermal response rates. In this expression, as long as the input infrared radiation intensity remains unchanged, the response output of the detector pixel remains unchanged. Figure 5 is the schematic diagram of the two-point temperature correction. Where, b is the output of the standard pixel, a on the left is the output of the uncorrected pixel, and a on the right is the output of the corrected pixel, PL and PL are the output values of detector pixels under the uniform radiation of low-temperature TL and high-temperature TH blackbody.
After correction, the original output value of each pixel will be multiplied by the gain coefficient and the offset coefficient, respectively. The correction process is shown in Equation (3), and the corrected output expression is shown in Equation (4).
P H = G i j · x i j ( ϕ H ) + O i j P L = G i j · x i j ( ϕ L ) + O i j
y i j ( ϕ ) = G i j · x i j ( ϕ ) + O i j
Gij and Oij are the gain coefficient and bias coefficient obtained after two-point correction respectively, and the expressions of bias coefficient Gij and gain coefficient Oij are shown in Equation (5).
G i j = P H P L x i j ( ϕ H ) x i j ( ϕ L ) O i j = p H x i j ( ϕ L ) P L x i j ( ϕ H ) x i j ( ϕ L ) x i j ( ϕ H )
The two-point correction method is completed by Equations (3) and (4). The two-point correction method considers the non-uniformity correction of gain and offset, so most infrared systems use the continuous point correction method. However, the two-point calibration is applicable within the calibrated temperature range. If it exceeds this range, the nonuniformity of the infrared image will be displayed on the infrared image [29].
2.
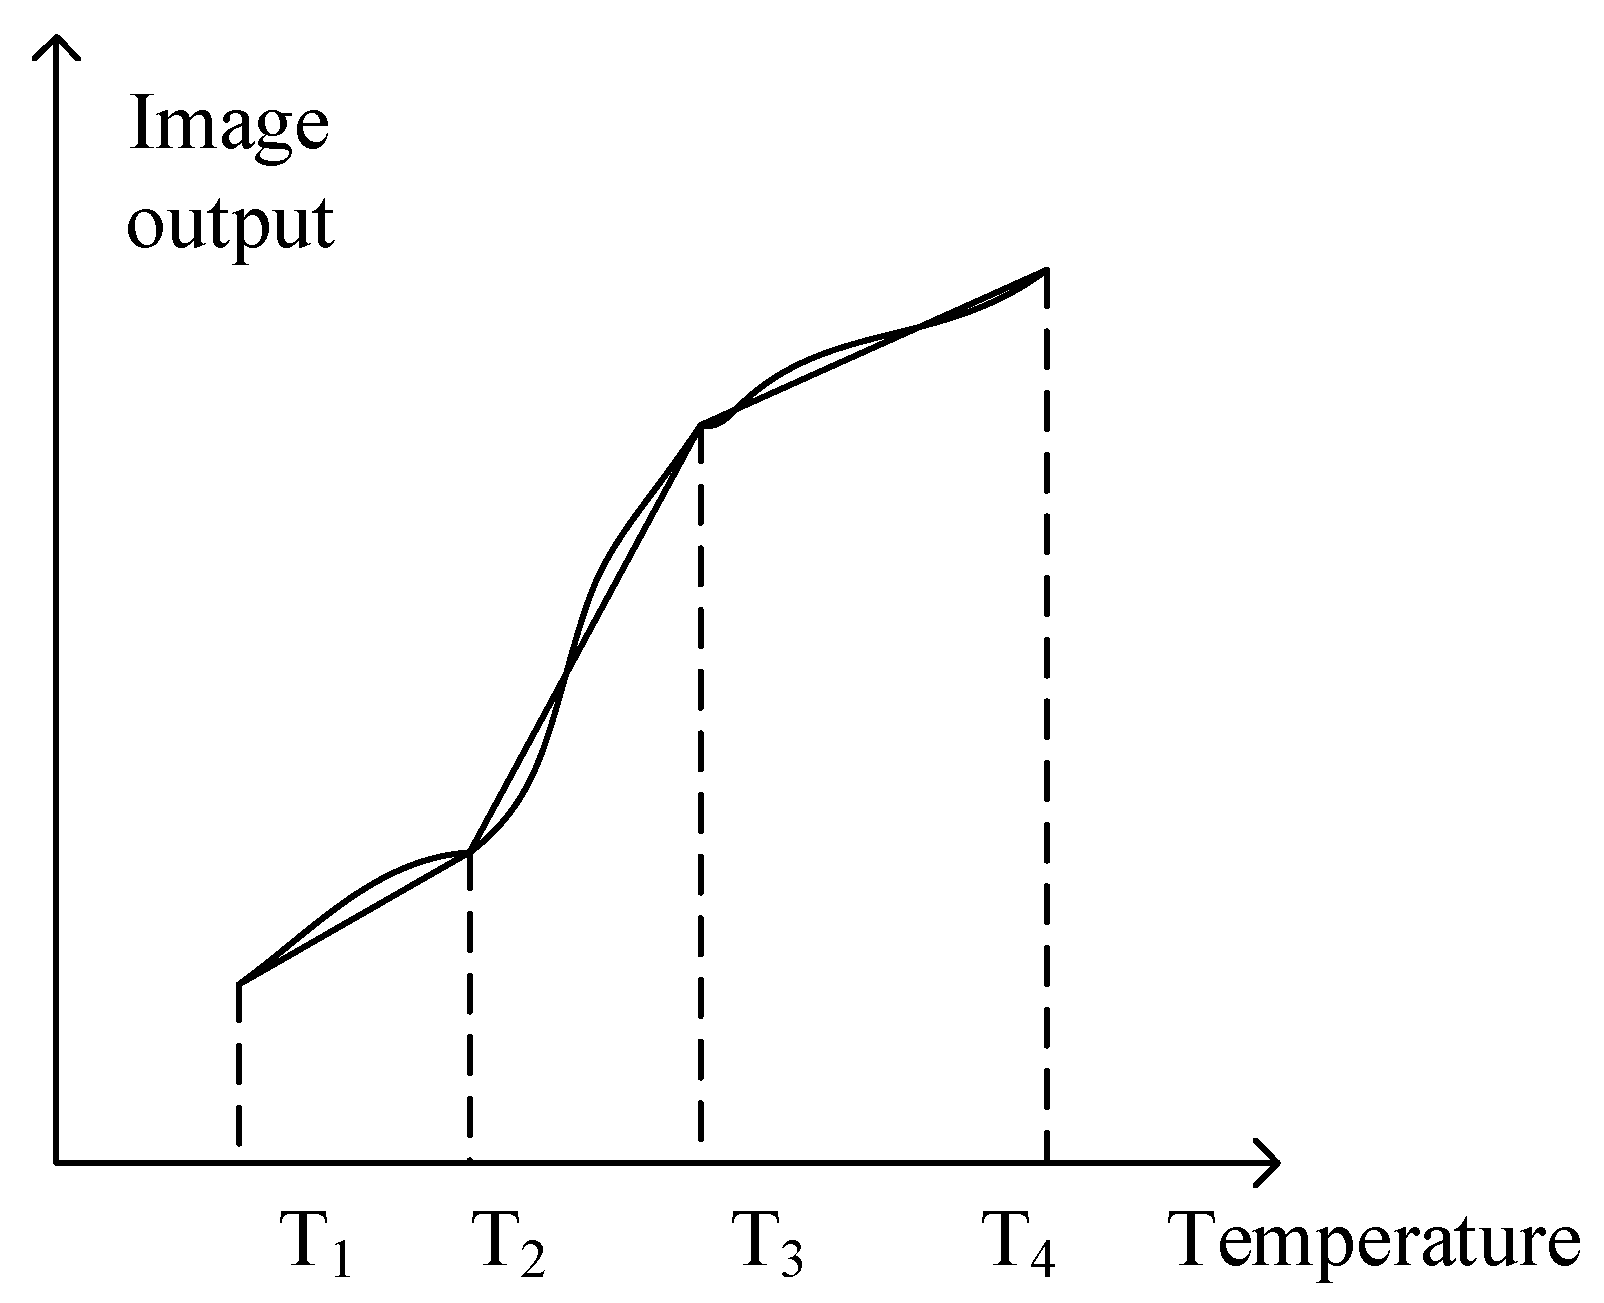
Nonuniformity correction of infrared image based on multi-point calibration [28]
In practical applications, especially at high and low temperatures, the response elements of infrared focal plane detectors are generally nonlinear, and the two-point correction method will inevitably introduce errors. Therefore, multipoint calibration can be used for correction. Multipoint calibration adopts multiple different temperature points, and two-point calibration between each temperature point is used for multi-segment linear simulation. Multipoint temperature calibration reflects the real situation of the nonlinear response of the focal plane detector. The principle of multipoint temperature correction is shown in Figure 6.
According to the expression of pixel output of two-point calibration, the mathematical expression of the corresponding output of each detection element under the radiation of uniform blackbody with different intensities is shown in Equation (6).
y i j ( ϕ 1 ) = G i j · x i j ( ϕ 1 ) + o i j y i j ( ϕ 2 ) = G i j · x i j ( ϕ 2 ) + o i j . y i j ( ϕ k ) = G i j · x i j ( ϕ k ) + o i j
The maximum value is taken, and then the two-point calibration method is used for derivation in sections to obtain the correction formula in the antecedent interval of k − 1 section for multi-point calibration correction, as shown in Equation (7).
y n ( ϕ ) = y n ( ϕ m + 1 ) y n ( ϕ m ) y i j ( ϕ m + 1 ) y i j ( ϕ m ) y i j ( ϕ ) + y i j ( ϕ m + 1 ) y n ( ϕ m ) y i j ( ϕ m ) y n ( ϕ m + 1 ) y i j ( ϕ m + 1 ) y i j ( ϕ m )
In Equation (7), ϕ ϕ m , ϕ m + 1 , m 1 , k 1 . At this time, the correction coefficient equation is shown in Equation (8).
G i j = y n ( ϕ m + 1 ) y n ( ϕ m ) y i j ( ϕ m + 1 ) y i j ( ϕ m ) O i j = y i j ( ϕ m + 1 ) y n ( ϕ m ) y i j ( ϕ m ) y n ( ϕ m + 1 ) y i j ( ϕ m + 1 ) y i j ( ϕ m )
Then,
Y i j ( ϕ ) = G i j ( ϕ m ) y i j ( ϕ ) + O i j ( ϕ m )
Equation (9) is a general formula for multipoint correction. From the actual effect, the effect of multipoint correction is much better than that of two-point correction. The more calibration points selected, the smaller the correction deviation and the stronger the temperature adaptability.
3.
Nonuniformity correction of infrared image based on BP neural network
The infrared image nonuniformity correction based on neural network does not need calibration, and BP neural network is still the most widely used and mature one. It is a minimum mapping network and adopts the learning method of minimum mean square error. BP neural network is actually an error back propagation algorithm. Its basic principle is that each neuron is connected to a detection unit, and then its information is imported into the hidden layer for calculation. The calculated value output is given to the output layer. After the error is obtained by comparing the expected value of the neuron with the output value, the error beyond the set range is back propagated according to the error range, that is, the weight is modified. Through reverse learning, the weight coefficient is modified until the error is less than the set threshold.

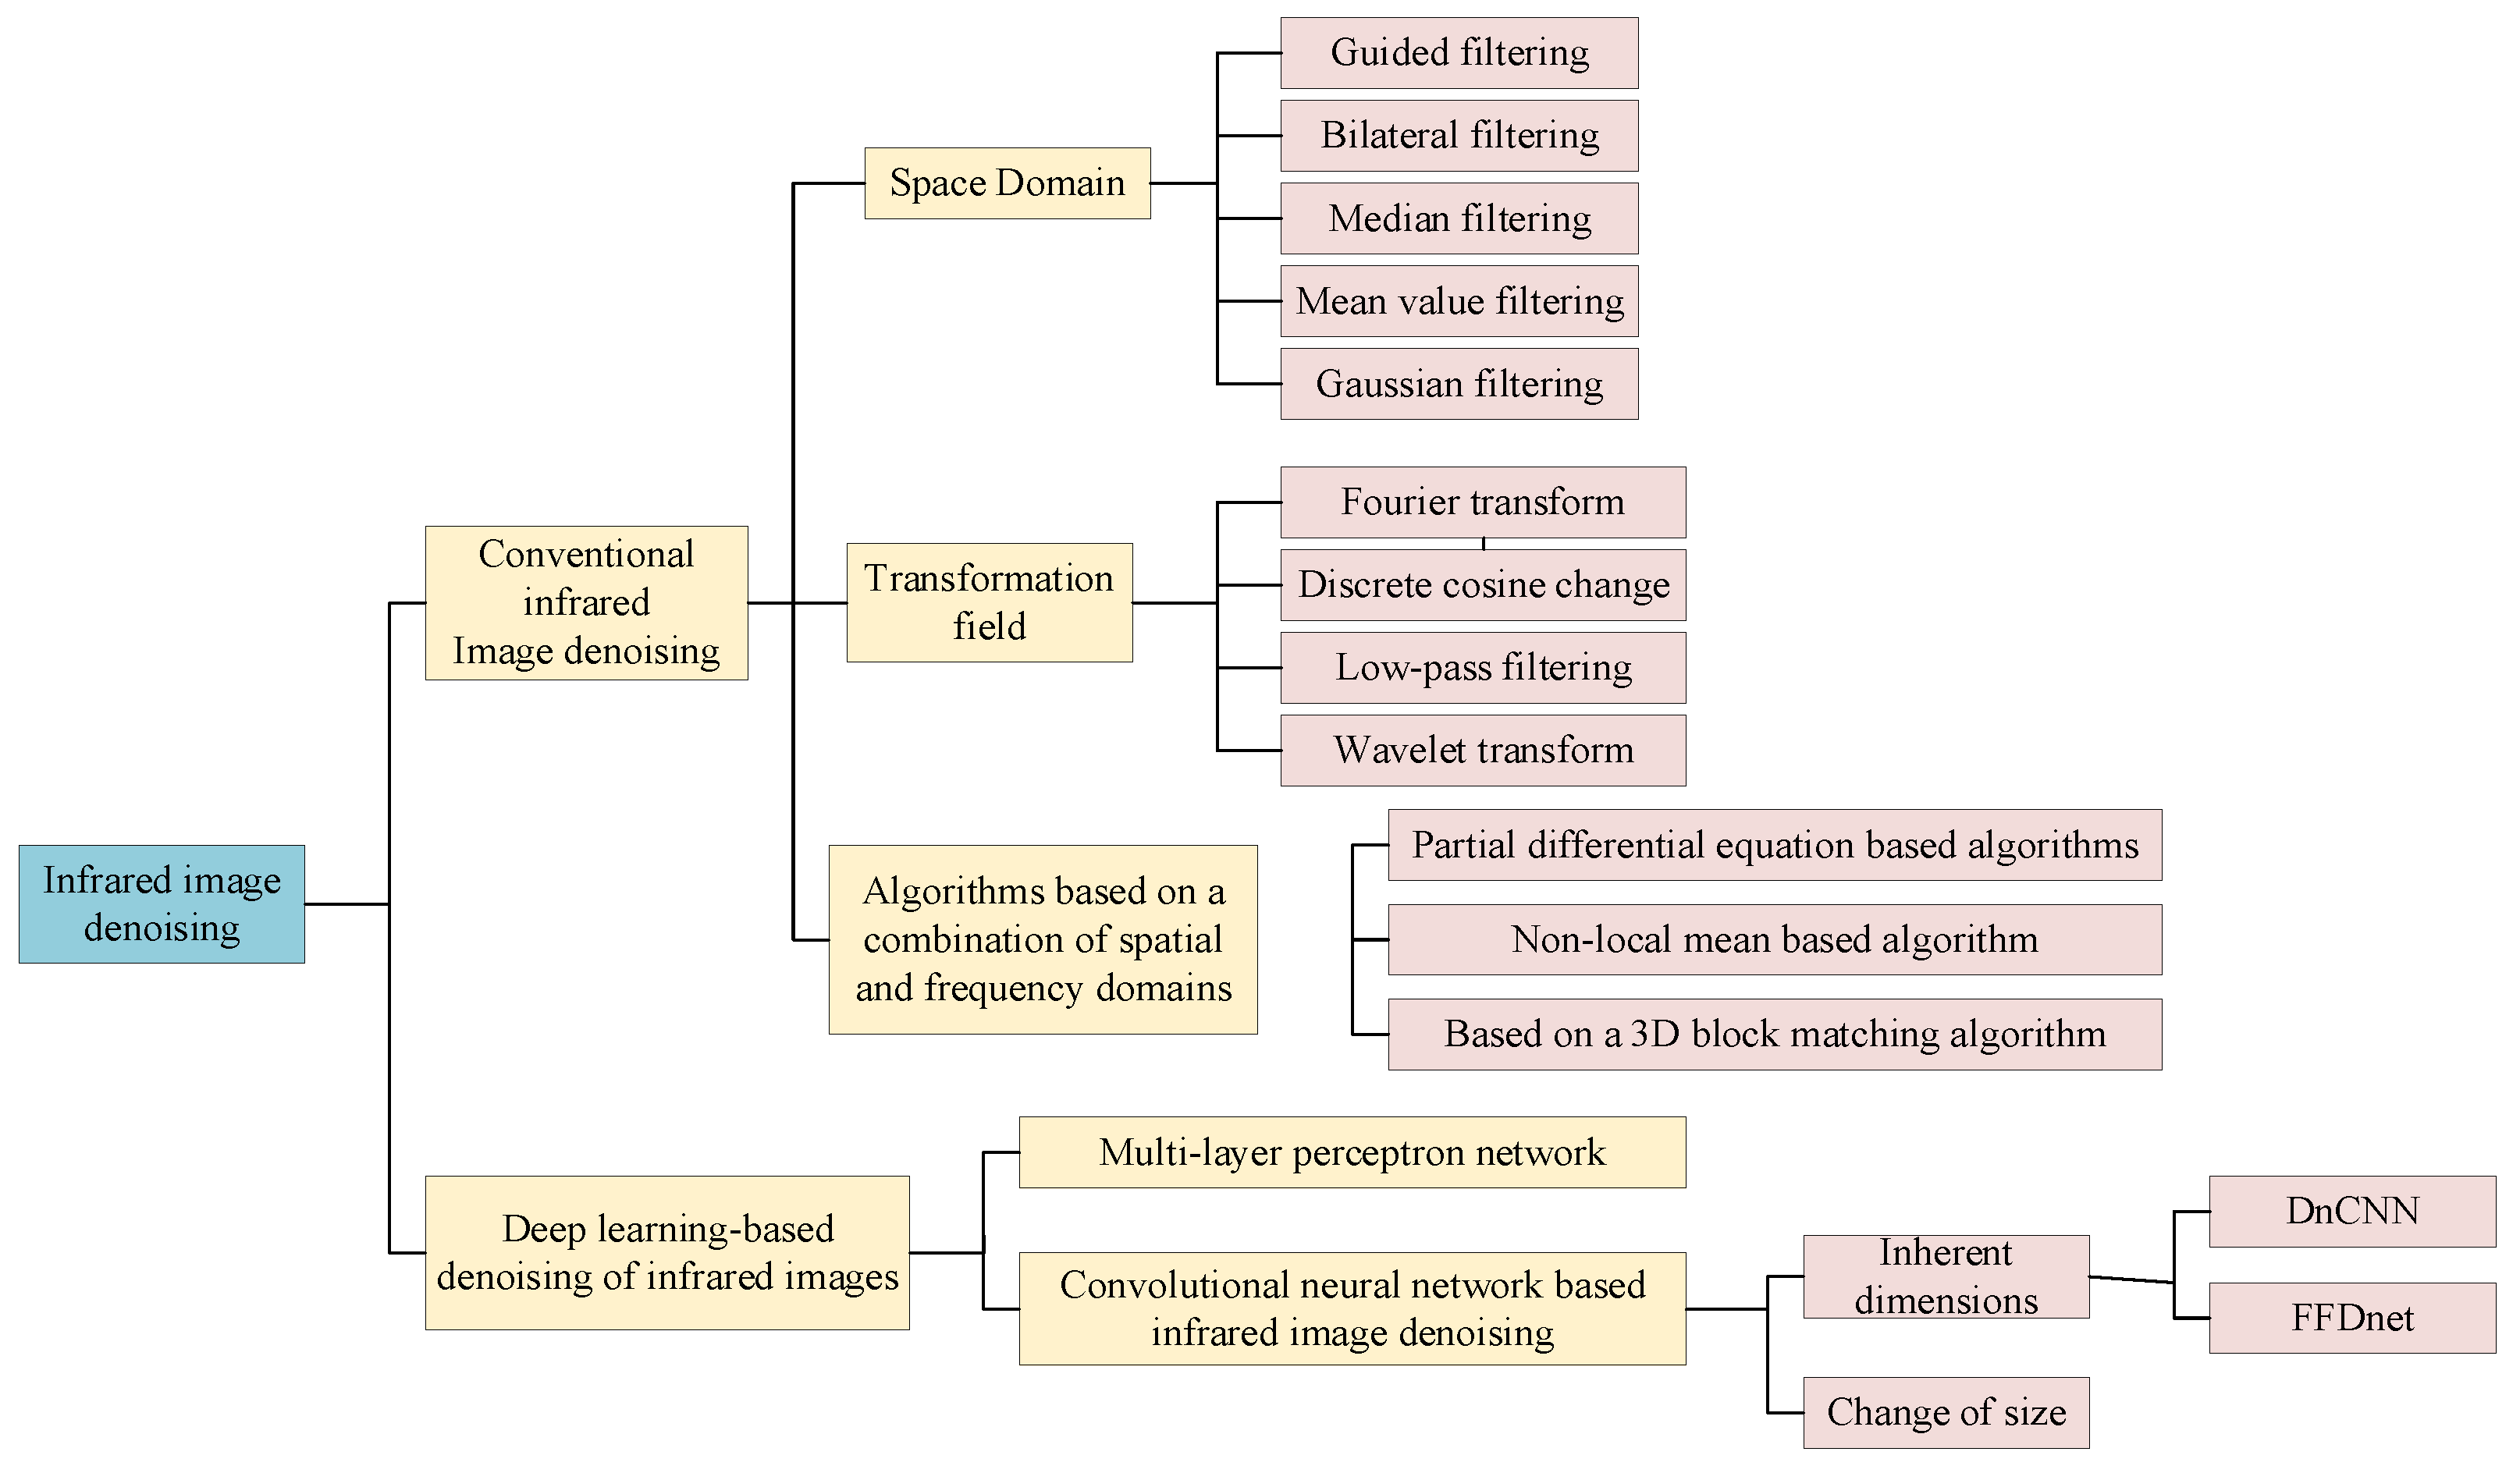
3.1.2. Infrared Image Denoising

Due to the influence of detector material, processing method, and external environment, the infrared image has serious noise, which affects the quality of the infrared image. Therefore, infrared images need to be denoised to improve the visual quality of infrared images. At present, the traditional research of infrared image denoising mainly focuses on spatial domain and transform domain. The specific algorithm research is shown in Figure 7.
Donoho et al. [30] proposed a curve estimation method based on N noise data, which minimizes the error of the loss function by shifting the empirical wavelet coefficients by one amount to the origin. Mihcak et al. [31] proposed a spatial adaptive statistical model of wavelet image coefficients for infrared image denoising. The denoising effect is achieved by applying the approximate minimum mean square error estimation process to recover the noisy wavelet image coefficients. Zhang et al. [32] proposed an improved mean filtering algorithm based on adaptive center weighting. The mean filtering result is used to estimate the variance of Gaussian noise in mixed noise. The estimated results are used to adjust the filter coefficients. The algorithm has good robustness. However, this algorithm’s protection of infrared image edge information is limited. It is easy to cause edge blur. Therefore, Zhang et al. [33] proposed an infrared image denoising method based on orthogonal wavelet transform. While infrared denoising, this method effectively retains the detailed information of the infrared image and improves the accuracy of image denoising; Buades et al. [34] proposed a classical non-local spatial domain denoising method. By applying the spatial geometric features of the image, find some representative features of the long edge on the image, and protect them during denoising. The edge texture of the denoised image remains clear. However, this method needs to traverse the image many times, resulting in a large amount of calculation. Dabov et al. [35] proposed the classical 3D block matching and 3D filtering (BM3D) denoising method combining spatial domain and transform domain, which is realized through three consecutive steps: group 3D transformation, transformation spectrum contraction, and anti 3D transformation. The algorithm has achieved the most advanced denoising performance in terms of peak signal-to-noise ratio and subjective visual quality, but the algorithm is complex and difficult to implement in practice. Chen et al. [36] proposed a wavelet infrared image denoising algorithm based on information redundancy. Wavelet coefficients with similar redundant information are obtained by different down sampling methods in discrete wavelet changes. The wavelet coefficients are nonlinearly transformed by noise estimation to suppress high-frequency noise and retain details. The transformed wavelet coefficients are used to reconstruct multiple images. The multiple images with similar redundant information are weighted to further remove the high-frequency noise and obtain the final denoised image. The algorithm has good robustness. Gao [37] proposed an infrared image denoising method based on guided filtering and three-dimensional block matching, using the quadratic joint filtering strategy, the excellent performance of dm3d denoising is maintained. The signal-to-noise ratio and contrast of the image are improved. Divakar et al. [38] proposed a new convolutional neural network architecture for blind image denoising. Using the multi-scale feature extraction layer to reduce the influence of noise, the feature map adopts the three-step training method. It uses antagonistic training to improve the final performance of the model. The proposed model shows competitive denoising performance. Zhang et al. [39] proposed a new image denoising method based on a deep convolution neural network. The potential clear image can be realized by separating the noisy image from the polluted image. The gradient clipping scheme is adopted in the training stage to prevent the gradient explosion and make the network converge quickly. The algorithm has good denoising performance. Yang et al. [40] improved the propagation filter algorithm, added an oblique path judgment algorithm, and made the detected infrared edge complete. The accuracy of image denoising is improved. Xu et al. [41] proposed an improved compressed sensing infrared image denoising algorithm. Rough denoising of the infrared image using median filter, the sparse transform of compressed sensing, and observation matrix are used for fine denoising. Make the observation value retain the important information of the original signal, and finally get the denoised image through the reconstruction algorithm, the visual effect of the image obtained by this algorithm is close to the original image. It has good denoising performance in the actual scene.
  • Infrared image denoising based on depth learning [41]
In recent years, infrared image denoising based on depth learning has become a more promising denoising method, and gradually become the mainstream. Infrared image denoising based on deep learning is mainly divided into multilayer perceptron network model and infrared image denoising based on convolution neural network. The latter is based on infrared image denoising including fixed scale and transform scale. Mao et al. [42] proposed an encoding and decoding network for image denoising. Through multi-layer convolution and deconvolution operation, the end-to-end mapping between images is realized. In this method, the convolution and anti-convolution layers are symmetrically connected by the jumping layer to solve the problem of gradient disappearance. In 2017, DnCNN, one of the best denoising algorithms based on deep learning, was proposed. DnCNN draws lessons from the residual learning method in ResNet. Different from ResNet, DnCNN does not add a connection and activation every two layers of convolution but changes the output of the network to the residual image of dry image and reconstructed image. According to the theory in ResNet, when the residual is 0, the stacking layers are equivalent to identity mapping, which is very easy to train and optimize. Therefore, the residual image as the output of the network is very suitable for image reconstruction. Batch standardization is also used in DnCNN. Adding batch standardization before activating the function to reduce the shift of internal covariates can bring faster speed and better performance to the training and make the network have less impact on the initialization variables. In the second year after DnCNN was published, Zhang et al. [43] proposed FFDnet, which provides a fast denoising solution. In addition to natural image denoising, the denoising algorithm based on depth learning is also applied to other image denoising. Liu et al. [44] combined convolutional neural network and automatic encoder, proposed DeCS-net suitable for hyperspectral image denoising, which has good robustness in denoising effect. Zhang et al. [45] proposed a MCN network suitable for speckle noise removal of synthetic aperture radar image by combining wavelet transform and multi-level convolution connection. The network is designed through interpretability. Nonlinear filter operator, reliability matrix, and high-dimensional feature transformation function are introduced into the traditional consistency a priori. A new adaptive consistency a priori (ACP) is proposed, introducing the ACP term into the maximum a posteriori framework. This method is further used in network design to form a novel end-to-end trainable and interpretable deep denoising network called DeamNet.

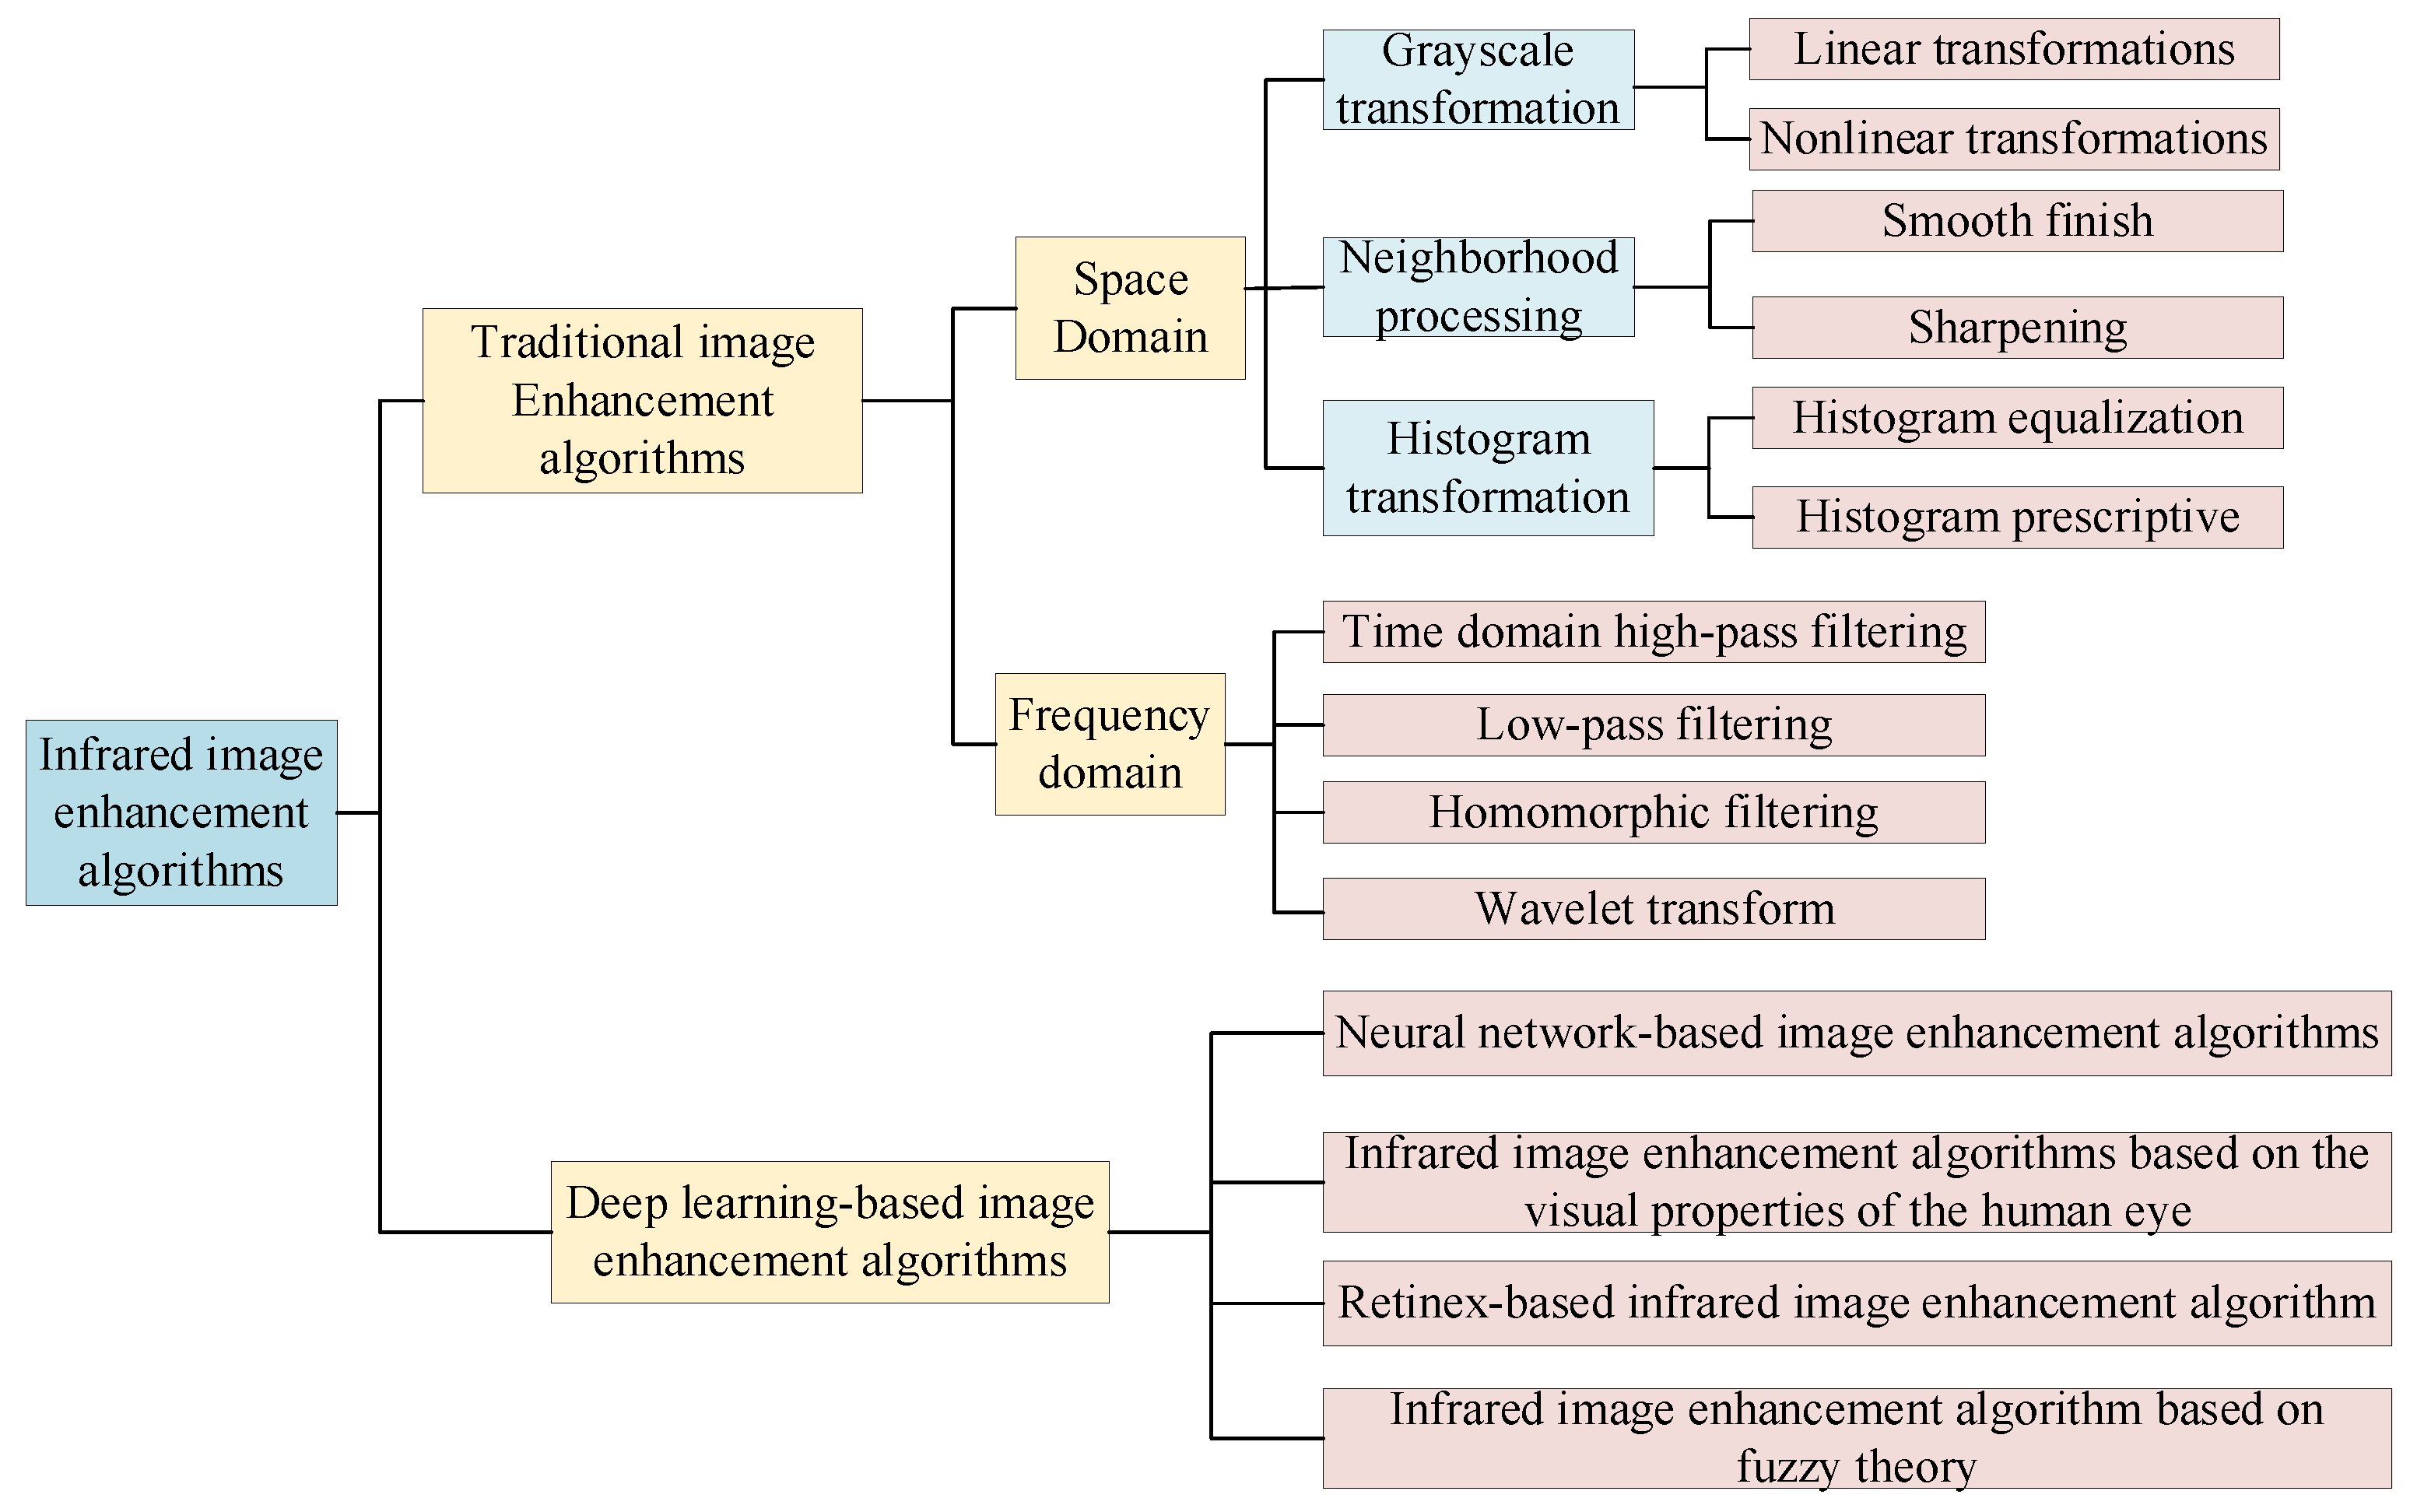
3.1.3. Infrared Image Enhancement

Infrared image enhancement is also an important part of infrared image processing. It works mainly by enhancing the useful information in the image, suppressing useless information, and thus enhancing the area of interest for visual observation of the human eye. Infrared image enhancement algorithms can be roughly divided into traditional algorithms and algorithms based on deep learning. Traditional algorithms are based on spatial domain and frequency domain. In recent years, algorithms based on deep learning have become the mainstream. Deep learning algorithms mainly include infrared image enhancement algorithms based on convolutional neural networks and human visual characteristics. The spatial domain enhancement method is based on the image pixel itself. Its typical algorithms mainly include histogram equalization, linear transformation, spatial filtering, and Retinex enhancement. The specific algorithm research is shown in Figure 8.
ROSA et al. [46] proposed a new automatic image enhancement technology driven by an evolutionary optimization process. Through a new objective enhancement standard, they try to find the best image according to their respective standards. They use an evolutionary algorithm as the global search strategy to obtain the best enhancement effect. This method has good advantages. Wang et al. [47] proposed an improved adaptive infrared image enhancement algorithm based on guided filtering. The initial input image is smoothed by guided filtering to obtain the basic image and detailed image information. The processed basic image and detail image are fused to obtain the output image. The algorithm not only highlights the image detail information but also reduces the influence of detail layer noise on the output image and achieves the effect of the adaptive scene. Yu et al. [48] proposed an infrared image enhancement method based on the combination of wavelet multi-resolution analysis method and image enhancement algorithm. The targeted enhancement of different high-frequency details of infrared images and using the algorithm to integrate the visual characteristics of human eyes not only enhances the details of the image but also enhances the contrast of the image. Dai et al. [49] proposed an infrared image enhancement algorithm based on human visual characteristics. By adopting the model in line with human visual perception characteristics, and according to the fact that human vision is more sensitive in the image change area than in the smooth area, the power transformation method is used to enhance the high-frequency and low-frequency components the image respectively. The algorithm improves the image contrast and the visual effect of infrared images. Jia et al. [50] proposed a nonlinear transformation method based on human visual characteristics. Using the resolvable gray function of the human eye and the nonlinear transformation function based on human vision, the nonlinear transformation model of the human eye is established, which can map the limited infrared image information to the gray distribution area conducive to human eye observation. This method effectively solves the problems of low contrast and blurred details of infrared images.
In the field of image enhancement technology, Company FILIR of the United States proposed the digital detail enhancement technology, which has been successfully applied to the image enhancement processing technology of infrared thermal imager and achieved good results, but its core technology has not been disclosed yet. This technology effectively compresses the dynamic range of the infrared image, preserves the information of weak and small targets in the scene, improves the ability of the human eye to obtain effective information in the scene, and becomes one of the most effective methods for new infrared image enhancement.
The histogram equalization algorithm uses the whole frame information of the infrared image to change the contrast of the image, and then uniformizes the overall grayscale distribution of the image by compressing the gray level with less pixel level and enlarging the larger gray value at the pixel level, so as to improve the overall contrast of the image. The specific process is to normalize the gray value of the infrared image, each specific image has its discrete expression, and then calculate the gray degree of the output and input image according to the conversion relationship expression before and after image equalization and the probability expression of output and input. According to the requirement that the output probability density is constant during histogram equalization, the transformation of histogram can be obtained. Finally, according to the new gray value, the sum of the probability that the value is less than or equal to a certain gray value is multiplied by 255 [16]. However, histogram equalization also has its corresponding shortcomings. After histogram equalization, the image noise is also strengthened, so some weak targets will be lost. Based on the shortcomings of histogram equalization, later scholars proposed many improved algorithms, such as dual platform histogram equalization, contrast-constrained adaptive histogram equalization, and so on. These methods design corresponding algorithms to improve the shortcomings of histogram equalization, reduce the noise in the image, and improve the overall contrast of the infrared image. The enhancement algorithm of adaptive piecewise linear transformation of infrared image is to obtain the target of infrared image through the analysis of the principle of gray-scale linear transformation, which is often concentrated in the narrow area of the whole dynamic image range. Piecewise linear transformation is to widen the narrow target distribution area to enhance the contrast between the target and the background, and then highlight the target in the region of interest of human vision from the infrared image. This method can enhance the contrast of infrared images and enhance the detail edge of infrared images.
According to the enhancement algorithm [51] based on Retinex, the surface color of the object perceived by people has a great correlation with the reflectivity of the object surface. According to this theory, color is usually not affected by illumination changes, and is only related to the reflective properties of the visual system on the surface of objects. According to the Retinex theory, the image brightness I is composed of the reflectance R and the incidence l of the measured object, and its calculation formula is shown in Equation (10).
I ( x , y ) = R ( x , y ) × L ( x , y )
In Equation (10), x and y are coordinates. The properties of reflective objects are independent of light intensity. Retinex algorithm flow: Gaussian filtering, logarithm and opposition number map, and stretching image algorithm [52].
The image enhancement algorithm of Fourier transform first uses the low-pass filtering method to suppress the high-frequency components of the image, let the low-frequency components pass through, remove the high-frequency noise, and complete the smoothing of the image. Then, through the high-pass filtering, the high-frequency part of the image is obtained, which realizes the sharpening of the image, and then highlights the contour features and details of the image. The homomorphic filter compresses the brightness range of the image and enhances the image contrast, so as to adjust the gray range of the image, eliminate the problem of uneven illumination on the image, and enhance the image details in the dark area [28].
The infrared image enhancement algorithm based on wavelet transform not only enhances the image details, but also suppresses the image noise. In this method, the detailed features of different resolutions in the original image are separated with different scales by wavelet transform, and then the wavelet components of different scales are transformed by nonlinear transform function to enhance the detail features of different resolutions in the original image. Wavelet analysis for image enhancement is to decompose an image into components with different sizes, positions, and directions. Before the inverse transform, the coefficients of some components in different positions and directions can be changed according to the needs of the image enhancement process itself, so that some interested components can be amplified and some unnecessary components can be reduced. The main information of the decomposed image is represented by the low-frequency part, and the detail part is represented by the high-frequency part. Through the transformation of high-frequency components, the purpose of image enhancement is achieved. Because the absolute value of the coefficients corresponding to the edge detail information in the wavelet domain is large, the nonlinear transform function is used to transform the wavelet coefficients to enhance the high-frequency detail information of the image and suppress the noise amplification. In the process of processing, single threshold enhancement algorithm, double threshold enhancement algorithm, and adaptive enhancement algorithm can be used for wavelet coefficients to realize image detail enhancement.

3.2. Detection and Compensation of Blind Elements of Thermal Imaging Camera

There are some blind elements in the infrared focal plane array. The existence of blind pixels will lead to a large number of bright or dark spots on the infrared image. Blind pixels include overheated pixels and dead pixels. Therefore, it is necessary to process the blind elements of the infrared focal plane array. The processing of the blind elements includes the detection and compensation of the blind elements. Blind elements must be detected and located when they are compensated. If the blind element detection method is used improperly, there will be over-detection and missed detection. Over-detection means that normal pixels are detected as blind pixels, which increases the workload of blind pixel compensation. Missed detection means that blind pixels are detected as normal pixels, resulting in residual speckle noise on the infrared image.

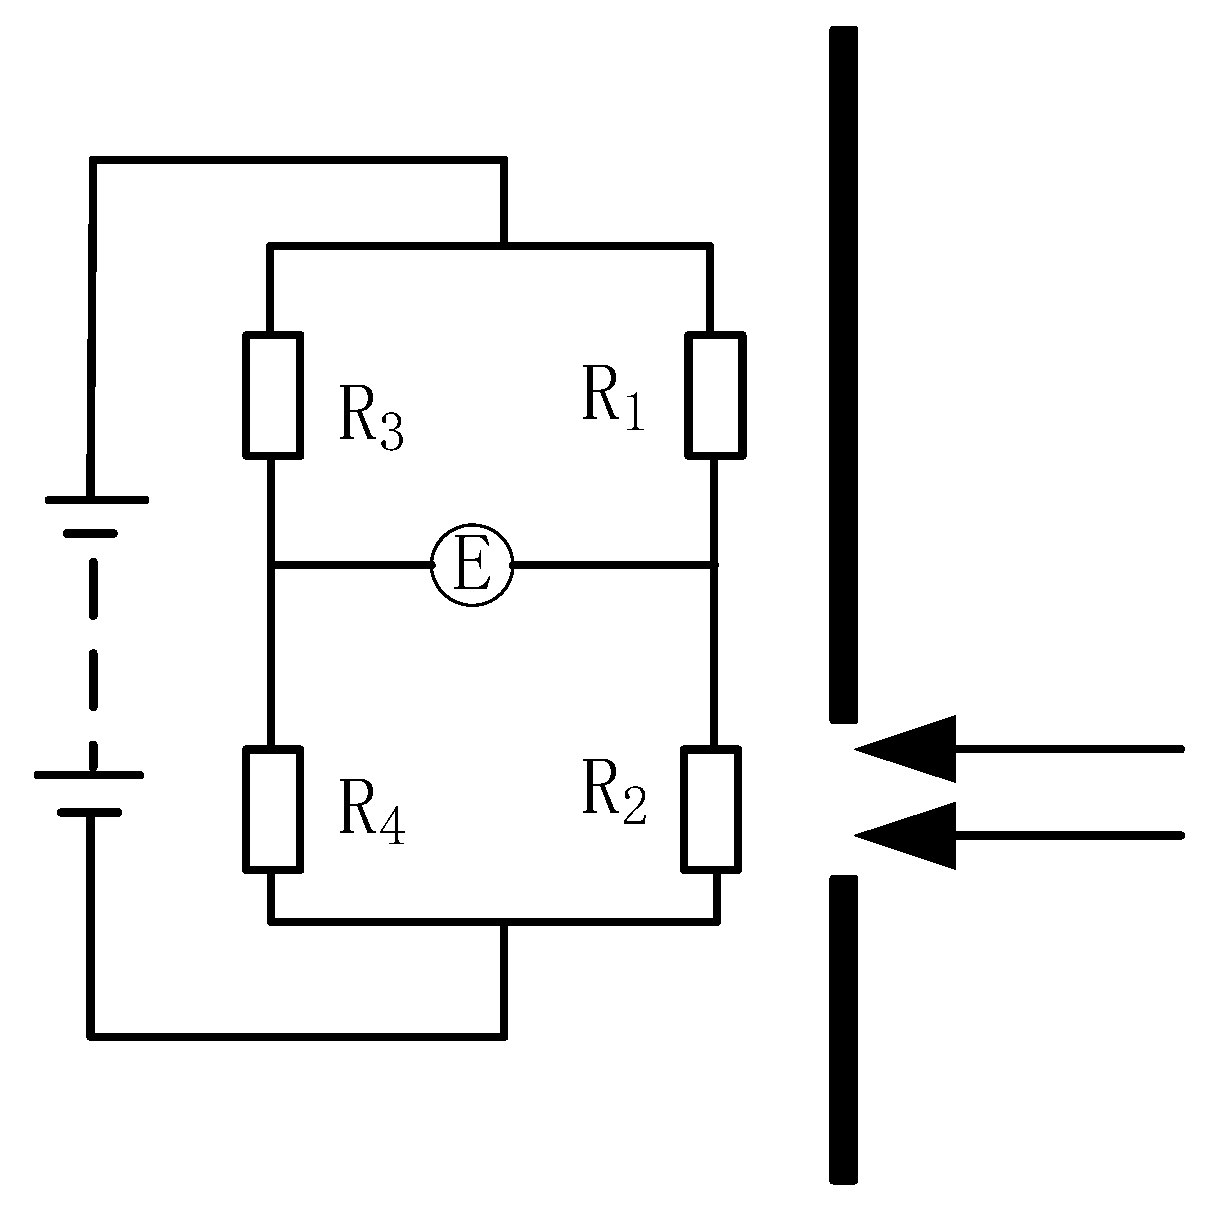
3.2.1. Blind Element Detection

The goal of blind element detection is to accurately detect the blind elements in the focal plane array, so as to avoid missed detection and over-detection. At present, there are many blind pixel detection algorithms based on sliding window, response characteristics, moving scene, and integral time adjustment, but the premise of blind pixel detection is to know the response rate of each pixel. Among them, the detection algorithm based on sliding window takes the pixel to be detected as a (2n + 1) (2n + 1) window, and the response rate of each pixel in the window is replaced by its pixel gray value and recorded as B, then the maximum and minimum values of all pixels in the window are discovered and recorded as Bmax and Bmin. Remove the maximum and minimum values to calculate their average value, and then compare their percentage, that is, Δ = B max B ¯ B ¯ or Δ = B ¯ B min B ¯ . When Δ ≥ 10%, the pixel is considered as a blind element [44]. Blind pixel detection based on response characteristics is judged by the response temperature curves of overheated pixels, dead pixels, and normal pixels. With the height of temperature, the response curves of dead pixels and overheated pixels will hardly change and remain at a high or low level. However, the response characteristic curve of normal pixels shows a pattern with the increase of temperature. Therefore, the blind element can be detected according to the response curve in low temperature and high temperature environment. The blind element detection algorithm based on moving scene is similar to the blind element detection based on window. The difference is that the window size is n × n, and the judgment basis is Δ ≥ 0.1 that the pixel is blind. Based on the time adjustment integration of the blind element detection algorithm, and then by adjusting the integration time from long to short to obtain the response output value of the infrared focal plane at different times, the difference is used in the output value of each detector to detect the blind element.

3.2.2. Blind Element Compensation

Blind element compensation is to use the correlation between two pixels, and then effectively replace it with the effective cell value around the blind element and the previous frame blind element pixel value. Meta compensation algorithms mainly include domain substitution method, space-time correlation compensation method, and so on. Neighborhood substitution is the use of the average of the effective cell values around the blind element, and then the pixel value of the blind element is replaced. This method has a good compensation effect for isolated blind pixels, but the compensation effect is significantly worse for large blind pixel images. The spatiotemporal correlation compensation method is actually an improvement of domain substitution. The algorithm considers the temporal correlation and spatial correlation between pixels. Time correlation is mainly based on the cell value after the compensation of the previous frame, and then as the calculation factor of the current cell compensation frame. Therefore, we should first determine the correlation value, then calculate its correlation degree, and finally calculate the compensation value.

3.3. Infrared Thermal Imaging Temperature Measurement Technology

Previously, infrared thermal imaging techniques were only used for low to medium temperature measurements in wind tunnel experiments [53]. Based on Planck’s formula and Wien’s displacement law, Princeton University in the United States derives the expression of the best measurement band and measured temperature, and analyzes the influence of measurement method, emissivity, atmospheric transmission on temperature measurement. In the past, the United States placed a blackbody-like mask around the measurement device, and at the same time placed a cone-shaped water cooling cover between the measured object and the lens so as to establish a model of the infrared thermal imaging camera to measure the temperature of non-metallic objects, and then derived the temperature measurement equation. In the same year, they built a similar model of measuring the temperature of metal objects with an infrared thermal imaging camera, and thus obtained the temperature measurement equation [54]. Yang et al. obtained the influence on the temperature measurement error of infrared thermal imager by considering the emissivity, absorptivity, background, and external temperature of blackbody surface [55,56,57,58]. Pokorni [59] proposed a general mathematical model for surface temperature measurement based on infrared radiation, derived and analyzed a measurement error function, provided analytical results, and determined measurement conditions to improve measurement accuracy. Xu et al. [60] proposed a blast furnace temperature field detection method based on infrared image processing, established the temperature field distribution model through infrared image processing, combined with cross temperature measurement for temperature calibration, and realized the online monitoring of blast furnace temperature field distribution. Fu et al. [61] used infrared thermal imaging technology to detect the temperature distribution image of inertia friction welding workpiece surface and its time course in real-time. By using computer infrared thermal imaging image processing technology, they obtained the comprehensive image information of the temperature distribution field on the outer circumference of inertia friction joint surface and the surface of welding heat affected zone. From this solution, the welding heat cycle of the outer circle center point of the friction welding surface, the surface temperature field of the surface of the welding heat affected zone, and some laws of the dynamic change of the isothermal line are calculated. In order to accurately set emissivity and reduce temperature measurement error, SR-5000 intelligent infrared spectroradiometer, standard blackbody, and temperature measuring thermal imager are also used to calibrate the integral emissivity of the welded material. At the same time, the maximum temperature value of the welded specimen surface under different emissivity was also determined by test, and the influence of emissivity calibration value on the temperature measurement result was discussed. Cai et al. [62] proposed a blackbody free infrared thermal imager’s temperature measurement calibration and temperature compensation technology. By deriving the principle of infrared temperature measurement, the prior relationship between the target temperature and radiation is obtained by multi-blackbody calibration. Aiming at the temperature drift caused by the internal structure of the detector, the real temperature compensation is realized by nonlinear modeling by Newton cooling law. Infrared thermal imaging technology is used to measure the surface temperature of hollow glass window unit [63]. In addition, many scholars at home and abroad have also conducted relevant research on infrared thermal imaging temperature measurement [64,65,66,67,68,69].

3.3.1. Principle of Temperature Measurement

Thermal imaging camera temperature measurement is based on the energy received by the object to generate a signal to determine the temperature. The energy radiation that a thermal imaging camera can receive includes object radiation energy, atmospheric radiation energy, and ambient reflected radiation energy. Infrared thermal imaging temperature measurement follows the Stephen–Boltzmann law, which gives the relationship between the temperature of matter and the radiant energy, as shown in Equation (11) [70].
E = ε σ T 4
In Formula (11), E is the radiation power of the object; σ is emissivity of material; ε is the Stephen–Boltzmann constant; T is the absolute temperature of the object. The radiant energy will have corresponding calculation formula according to different sources. The energy of the radiation will have a corresponding calculation formula according to the different sources, according to the calculated radiation signal, the corresponding temperature will correspond to the calibration curve, and then the temperature will be displayed on the display device, so as to complete the temperature measurement of the thermal imaging camera.

3.3.2. Calibration of Infrared Thermal Imager [13]

A black body, also known as an absolute black body, is an ideal object, a standard object that has always been used to study thermal radiation. A black body is capable of absorbing electromagnetic waves of any band, which has neither reflection nor transmission. According to Kirchhoff’s law of radiation, the emission coefficient and absorption coefficient of any wavelength of an electromagnetic wave in the thermal equilibrium state are 1 and the transmission coefficient is 0. In general, the bold body can be interpreted from the following three levels:
  • Theoretically, a black body is able to completely absorb electromagnetic waves of various wavelengths of radiation, there is no reflection and transmission, and its absorption ratio is 1;
  • Structurally, radiation in an isothermal cavity with a small hole is black-body radiation. When the radiated electromagnetic wave is incident from the pore, various reflections occur in the cavity, and each reflected radiation will be absorbed part of the energy, and finally only a very small amount of energy escapes from the pore.
  • From the application point of view, if a small hole is opened in the closed isothermal airborne, it can realistically simulate black-body radiation, which is called a black-body furnace. At a certain temperature, the black body is the object with the greatest ability to radiate, so it is also called a complete radiator [16].
After using the infrared thermal imager for a period of time, it is necessary to calibrate the relationship between the temperature signal of the measured object and the electrical signal generated by the thermal imager so as to ensure that the error of the infrared thermal imager meets the requirements of accuracy. The calibration of the infrared thermal imager needs to be carried out indoors, and the indoor temperature is required to be (23 ± 5) °C, the humidity is not greater than 85% RH, and there is no strong environmental radiation indoors.
During the calibration of infrared thermal imager, it is necessary to calibrate multiple black bodies with known temperature in the room. The specific calibration process is to align the thermal imager with each black body. At this time, each black body generates an energy radiation signal. The infrared thermal imager corresponds this signal to its temperature. Multiple black bodies generate multiple signals and all of them correspond to their temperature to form a curve. This curve is a calibration curve. The infrared thermal imager saves this curve in the memory. During the temperature measurement of the infrared thermal imager, when the infrared detector receives the radiation signal, the calibration curve will convert the signal into the corresponding temperature.

3.4. Infrared Thermal Imaging Target Detection and Tracking

The target detection of infrared thermal imager is mainly to detect people and vehicles. Mainly through preprocessing the obtained image, the target information is obtained and then the target trajectory tracking is realized [71]. Because the technology does not change with the surrounding lighting conditions, it can provide video images in the day and night, even in the harsh environment such as fog and rain. However, it cannot realize long-distance monitoring, and the monitoring screen can only distinguish whether there are suspicious people entering, but cannot see the face and appearance features clearly.
The infrared thermal imager preprocesses the acquired image. The image preprocessing includes image denoising, enhancement, and nonuniformity correction. Then, the target detection is carried out. The infrared thermal imaging target detection is mainly divided into the traditional detection algorithm and the detection algorithm based on deep learning. The traditional target detection algorithm is mainly divided into three steps: target region frame selection, feature extraction, and classifier classification. That is, first use different scale windows to traverse the entire image, frame the target to be detected, and perform feature extraction [72,73]. The main algorithms of feature extraction are Selective search and Edge Boxes. After feature extraction, you need to classify them using a classifier. The classifier algorithms mainly include Adaboost algorithm and SVM classifier [74,75].
At present, object detection algorithms based on deep learning can be roughly divided into two categories: two-stage detection algorithm and single-stage detection algorithm. The first phase of the former is the division of alternative regions, and the second stage is the determination of possible objectives within alternative regions. The main representative algorithms of this type of method are regional convolutional neural network, fast-CNN, and faster-CNN. The one-stage detection algorithm is an algorithm that combines region division and target judgment. The main representative algorithms of this method are SSD and YOLO algorithms. In an object detection algorithm based on deep convolutional neural network, which can automatically obtain infrared image features in the process of training data, the underlying convolution generally acquires image position information, and the high-level convolution obtains target semantic information, which is more efficient than traditional target detection. Redmon et al. [76] proposed that target detection is regarded as a regression problem, which can be reduced to the problem of selecting detection frame and judging the category of detection objects. The whole target’s detection, classification, and positioning are completed through a single network. This method realizes end-to-end target detection and improves the detection rate, but there will be more positioning errors compared with advanced detection systems. In 2017, the yolov2 algorithm proposed by Redmon et al. [77] added BN operation on each convolution layer, almost replacing Bropout operation, reducing the complexity of the algorithm, and the bounding box applied anchor box to predict, they used 19 convolution layers and five maximum pooling layers as Yolov2 backbone network, and replaced the full connection layer in Yolo with 1 × 1 convolution. In 2018, Redmon et al. [78] proposed the yolov3 algorithm, which has made some changes to the previous algorithm. Referring to FPN, the algorithm adopts three feature maps of different scales for target detection, uses darknet-53 (referring to Res Net design, and the accuracy is equivalent to Res Net-101) as the Yolov2 backbone network, uses a multi-label classifier to replace softmax for classification, improves the loss function of Yolo, and uses binary cross-entropy as the loss function for training, it realizes the prediction of multiple categories for the same bounding box. Bai et al. [79] proposed an improved lightweight detection model MTYolov3. The model constructs a multi-directional feature pyramid network instead of the simple cascade, fully completes the extraction and fusion of multi-layer semantic information and uses deep separable convolution instead of standard convolution, which effectively reduces the network complexity and improves the real-time performance of detection. Feng et al. [80] proposed a real-time dense small target detection algorithm for UAV based on yolov5. By combining spatial attention (SAM) and channel attention (CAM), the connection structure of CAM and SAM is changed to improve the feature extraction ability of dense small targets in complex background. In 2020, Bochkovskiy et al. [81] proposed that Yolov4 uses CSPDarknet53 as the backbone network, selects the super optimal parameters by introducing mosaic data enhancement method and GA algorithm, and uses PANet network instead of FPN to improve the detection effect of small target detection objects. The detection accuracy of Yolov4 on the COCO dataset reaches 43.5%. Shi et al. [82] proposed an improved Yolov4 infrared pedestrian detection algorithm to optimize the network structure of Yolov4. Using deformation convolution as the core component, the deformation feature extraction module is constructed to improve the effectiveness of target feature extraction. The feature extraction network module is optimized for deformation convolution. Lan et al. [83] proposed the SSD300 network model based on ResNet50 feature extraction, added the attention mechanism CBAM module and feature fusion FPN module, and used the soft NMS strategy to select the final prediction frame more effective detection of aircraft targets in remote sensing images. Zhu et al. [84] proposed an improved lightweight mask detection algorithm based on Yolov4 tiny. After the backbone network of Yolov4 tiny, the spatial pyramid pooling structure is introduced to pool and fuse the input feature layer at multiple scales and greatly enhance the receptive field of the network. Combined with the path aggregation network, the feature layers of different scales are fused and enhanced repeatedly in two paths to improving the expression ability of the feature layer to the target. The label smoothing strategy is used to optimize the network loss function to suppress the overfitting problem in network training. The algorithm has good detection accuracy on mask targets and face targets. Ding et al. [85] proposed the projection annotation method for infrared thermal wave detection. The infrared thermal imager obtains the infrared image sequence of the sample excited by flash lamp pulse. It is processed by the pulse phase algorithm optimized by time sampling to enhance the detection effect of defects. The defect location is extracted by the automatic threshold, and the extraction results are projected onto the sample surface by the projector.

4. Multi/Hyperspectral Thermal Infrared Remote Sensing

Spectral imaging techniques can be divided into different types according to different aspects. According to the number of bands and spectral resolution categories, it can be divided into: multispectral imaging technology with only a few bands in the visible-near-infrared range; hyperspectral imaging technology with hundreds of bands in the visible-near-infrared range; and hyperspectral imaging with thousands of bands in the visible-near-infrared range [86].

Multi/Hyperspectral Thermal Infrared Remote Sensing Technology

Multispectral remote sensing technology is a remote sensing technology that divides the electromagnetic waves of ground objects into several narrow spectral segments, and obtains different bands of information of the same target at the same time through photography or scanning; Hyperspectral remote sensing technology integrates image technology and spectral technology in one, imaging the spatial characteristics of the target at the same time, each space cell through the dispersion to form dozens or even hundreds of narrow bands for continuous spectral coverage. The image obtained contains space, radiation, and spectral triple information. This section focuses on hyperspectral remote sensing techniques.
Hyperspectral images are carefully segmented in the spectral dimension, not only the traditional differences of black, white, red, green, and blue, but also N channels in the spectral dimension. Therefore, the data obtained by the hyperspectral imager are a data cube, which not only has the information of the image, but also can be expanded in the spectral dimension, so that not only the spectral data of each point on the image can be obtained, but also the image information of any one spectrum segment. Hyperspectral infrared imaging systems use area array infrared detectors. Among them, the area array length cells were used for single-band wide-format scanning imaging, while the area array width is the direction of the subdivision spectral channel. Based on the optical spectroscopic prism or grating, the detector is fixed through the spectral band through the spectral segment, and the ground target is detected by the mobile scanning of the platform, forming a hyperspectral three-dimensional imaging.
Hyperspectral infrared remote sensing technology mainly includes hyperspectral image classification and feature recognition technology and hyperspectral data processing technology. The data characteristics of the “map and spectrum integration” of the hyperspectral instrument enable it to measure the fine spectral characteristics of the features, which puts forward higher requirements for hyperspectral data processing and analysis, such as data dimensionality reduction, atmospheric correction, and other methods [87]. Common data dimensionality reduction methods are convolution operations and minimum noise component transformations [88]. Atmospheric correction technology is the basis for hyperspectral remote sensing to directly identify mine pollution information. In addition, removing the effects of atmospheric water vapor absorption is also a highlight of hyperspectral remote sensing techniques such as the ATREM model and the ACON model [89]. FLAASH uses the MODERAN 4+ radiative transport model, which corrects for cascading effects due to diffuse reflection, includes classification maps of cirrus and opaque clouds, and can also adjust for spectral smoothing due to artificial inhibition with high spectral reduction accuracy [90]. Xiong et al. [91] proposed a high-order neural network classification algorithm for hyperspectral remote sensing image classification, which uses nonlinear curves as a discriminant function, and repeatedly trains high-order neural networks, which better improves the accuracy of hyperspectral remote sensing images, but when the number of features of the network is larger, its detection accuracy will also decrease. Cui et al. [92] used the improved normalized emissivity method, ratio algorithm, and the combination of maximum-minimum emissivity difference to apply the emissivity inversion of the high spectral data of the thermal engine in the spectral image, and the experiment showed that the emissivity spectrum of the inversion matched well with the measured spectrum of the field. Rutkowski et al. [93] performed two kinds of spectral data analysis on the data collected by the same gas leakage target by using the imaging Fourier transform spectrometer data analysis program, which experimentally showed that the program combined with the multifunctional toolbox can better achieve gas detection and identification. Huo et al. [94] used the method of temperature emissivity separation based on spectral smoothness to obtain accurate spectral emissivity, and by obtaining hyperspectral TIR data and extracting the temperature and emissivity of wheat plants, the spectral emissivity was evaluated by detecting the ability and potential of water stress, which had good robustness. Wang et al. [95] used the “downstream afterglow index” constraint to separate the temperature and emissivity of the spectrum, and the experiment showed that this method can accurately and quickly separate the temperature and emissivity of the spectrum. Kirkland et al. [96] adopted a space-enhanced broadband array spectrometer system for the low spectral signal-to-noise ratio, and experimentally showed that the system can improve the ability of hyperspectral thermo-infrared scanners to detect and identify spectral fine substances. Martind et al. [97] used data processing technology to improve the signal-to-noise ratio of hyperspectral images for hyperspectral data with low signal-to-noise ratio, and applied a fully automated processing chain to process hyperspectral images, which can better distinguish various rock categories in the image and have better robustness. Martin et al. [98] used hyperspectral thermal infrared imagers to detect emissivity at different scales according to the platform and sensor observation geometry, aiming at the unknown nature of the material surface emissivity spectrum, and the results showed that the hyperspectral infrared imager could obtain an accurate infrared emissivity spectrum, which helped to evaluate the spatial variability of the material surface emissivity spectrum from the ground and airborne platforms. Gerhards et al. [99] used the continuum of hyperspectral data to apply hyperspectral remote sensing techniques primarily to the detection of plant responses to environmental stresses, thus revealing the relationship between spectral features and relevant plant conditions and the challenges faced. Aiming at the problem of separation of surface temperature and emissivity, Wang et al. [100] proposed a new method for atmospheric correction of hyperspectral thermal infrared data inversion based on linear spectral emissivity constraints, and the results showed that the method could achieve better results, with higher accuracy and stronger anti-noise ability. Riley et al. [101] targeted the electromagnetic spectral thermal infrared portion of mineralized alteration minerals with reflective characteristics, using hyperspectral thermal infrared data for mineral mapping, mineral maps using spectral feature fitting algorithms, and using a publicly available mineral spectral library containing signatures. The results show that the mapping results of the formation of altered minerals are similar and complementary to the visible-shortwave infrared hyperspectral mineral mapping results, and the diagenetic minerals associated with the unaltered rocks and the altered minerals associated with different altered phases in the altered rocks are plotted on the spectrum.
Certainly, hyperspectral images also have certain deficiencies, hyperspectral images have rich spectral information of features, but also bring data redundancy, as well as data dimensionality disaster problems, effectively reduce the dimensionality of hyperspectral remote sensing data and select effective bands is the basis for broadening the application field of hyperspectral image data. The improvement of the spectral resolution of hyperspectral images also brings about the problem of reducing the spatial resolution of hyperspectral images, which makes a large number of mixed cells in hyperspectral images, and correctly solves the problem of mixed cells of hyperspectral images as an important part of hyperspectral image processing. Compared with panchromatic images and multispectral images, hyperspectral images are more susceptible to noise interference, and further research is needed to improve the signal-to-noise ratio and quality of hyperspectral images. Spatial and spectral information acquired in the detection, classification, and identification of feature targets in hyperspectral images is underutilized.

5. Application of Sensor Processing Technology

5.1. Application of Infrared Thermal Imaging Processing Technology

Infrared thermal imaging technology is widely used in many fields, including transportation, medical, military, electric power, security, and other fields. Among infrared thermal imaging technology has long been used in the temperature measurement and alarm system of train hot axle box. Now, it is mainly used in the temperature measurement of train wheels and bearings [102]. It also uses infrared thermal imaging technology to measure the temperature of engines and tires [103]. Based on thermal infrared imaging technology, an automobile anti-collision system was established to improve safety performance [104]. In terms of ship transportation, the bridge anti-collision early warning system was established by using infrared detection to give early warning to ships [105]. In terms of air transportation, infrared thermal imaging technology was applied to detect internal defects of the airframe, identify runway foreign bodies, and give early warning, so as to effectively prevent the threat of runway foreign bodies to aviation safety [106].
The combination of infrared thermography, medicine, computers, and other technologies can check the inflammation, pain, and blood circulation of tissues and organs in medical treatment. It can also carry out the auxiliary diagnosis of malignant tumors, the auxiliary diagnosis of metastasis and metastasis trend, understand the overall distribution and intervention scope of tumors, and determine the treatment plan. The infrared thermal imager can automatically analyze the temperature distribution in the region of interest, which is convenient for people to find abnormal conditions during physical examination [107]. The novel coronavirus has strong heat transfer ability. Because of its fast response, non-contact and high accuracy, the infrared thermal imager is used to screen the body temperature of people in intensive places. The relative frequency distribution and cumulative relative frequency distribution of compression surface and side surface can be obtained by continuously measuring the surface temperature of tablets with an infrared camera [108]. Commercial infrared thermography is widely used in medical diagnosis in some countries with developed medical technology. The thermal images measured by the surface temperature profiler can qualitatively diagnose the interior of the lesion, but these images cannot determine the location and size of the internal heat source and cannot accurately locate the location of the heat source, which brings certain limitations to the diagnosis. The infrared signal is converted into electrical signal by infrared detector and thermal imaging signal processing system. The electrical signal is processed by computer and then the thermal image is displayed on the computer screen. Most of the time, some biological heat transfer models are established through the in-depth study of thermal theory to realize the visualization of disease sites. This method has attracted the attention of many scholars [109,110].
Infrared imaging technology is widely used in military reconnaissance, and it is an indispensable technical means of space reconnaissance. During ground reconnaissance, infrared imaging has certain penetration ability, and its ability to identify camouflage is better than that of visible light and has good environmental adaptability. It can also effectively penetrate the camouflage on the surface and inside the forest and can also detect underground and underwater targets. During ocean reconnaissance, this technology can detect and monitor ships on the sea, and track and locate underwater submarines through the temperature difference between their tracks and the surrounding seawater [111,112]. The temperature rise effect of explosives can also be studied by the detection technology of an infrared thermal imager. During the test of temperature rise characteristics of PBX in the fatigue process, it is helpful to understand the safety factor that explosive generates heat accumulation due to microstructure defects and evolves into deflagration or explosion [113]. The missile early warning satellite uses infrared technology for early warning and assessment of missile trajectory and load [114]. Night vision technology combined with infrared technology can improve the night combat capability.
Infrared thermal imagers are widely used in the field of electric power due to its high temperature measurement accuracy, wide temperature measurement range, non-contact temperature measurement, far away from equipment, strong security, and other advantages. During the operation of power transmission equipment, due to the influence of operating environment and other factors, equipment failure will occur, which will affect the normal operation of the entire power transmission system, so it is necessary to implement effective condition-based maintenance for power transmission equipment. Infrared thermal imaging technology has obvious advantages in condition-based maintenance of power transmission equipment, which can find equipment failure and fault location in a timely manner, and provide safety guarantee for the operation of power transmission equipment [115,116]. Because infrared thermal imaging can reflect the nonlinear mapping relationship between temperature and gray value in the infrared image, it can effectively locate and identify the suspected overheating fault of electrical equipment [117]. The infrared thermal imager can detect and diagnose the electrical equipment in the line, detect the equipment defects in advance and deal with them in time, so as to provide a good basis for equipment maintenance, implement the maintenance plan, and gradually realize the equipment status prediction [118]. At the same time, the infrared thermal imager can quickly and in real time monitor and diagnose most of the overheating faults of power equipment by non-contact means, so as to prevent the damage of power equipment and the large-scale power failure of power grid caused by the damage of these equipment. Infrared radiation has strong penetrability. During live detection, due to the high voltage, the detection personnel cannot touch the transformer closely, so it is difficult to find the partial discharge of the transformer. However, through infrared thermal imaging, not only the power wavelength range can be accurately calculated, but also the type of radiation wavelength can be well judged. Many scholars at home and abroad have studied the application of infrared thermal imager in the field of inspection and maintenance [119,120,121,122,123,124,125]. Infrared thermal imaging technology has been widely used in high-voltage transmission equipment, providing a safe, convenient, and efficient diagnosis method for transmission line maintenance, transforming the fault treatment of equipment maintenance management means into timely defect elimination, and greatly improving the stability of power supply [126].
Infrared thermal imaging has the advantages of non-contact, accuracy, and strong penetration ability, so it can find trapped people and hidden fire sources in layers of smoke and building obstacles, so as to accurately rescue the accused and extinguish the fire sources [127,128]. In addition, infrared thermography technology can also detect forest fires. As early as the 1860s, the United States launched research on forest fire infrared detection. Now, it has developed to directly share the detected infrared images with satellites and platforms to quickly determine the forest fire risk. China began to apply infrared thermal imaging technology to forest fire detection in the 1970s. Now, China’s forest fire detection combines infrared technology with Beidou satellite navigation and establishes a forest fire detection system for rapid information transmission through the calculation of relevant elements. With the social progress and technological development, infrared thermal imaging technology plays a greater role in safety, fire prevention, and disaster elimination [129,130]. At the same time, when studying the influence of epoxy resin coating and uncoated reinforcement corrosion on the thermal behavior of reinforced concrete, infrared thermal imager monitors the thermal response of concrete surface [131]. In the public security department, the thermal imager can be used for security surveillance, search for criminal evidence, and so on [28]. With the development of thermal imaging technology and people’s in-depth understanding of thermal imagers, more new application fields will be developed.

5.2. Application of Multi/Hyperspectral Remote Sensing Technology

Multi/hyperspectral remote sensing technology is used in many fields. Hyperspectral remote sensing overcomes the limitations of traditional single-band and multispectral remote sensing in terms of number of bands, band range, fine information expression, etc., provides remote sensing information with narrower band ranges and a number of bands, can subdivide and identify features from spectral space, and is most widely used in geological survey, agriculture, vegetation remote sensing, marine remote sensing, environmental monitoring, and other aspects. The initial application of hyperspectral remote sensing technology is that in geology, alteration zones are an important basis for prospecting. Airborne thermal infrared hyperspectral imaging has great potential for characterizing buried objects, which use target acquisition mode to record continuous maps of the same ground area. The linear solution mixed of the spectral emissivity data obtained after testing and mineral mapping can be performed [132]. Hyperspectral infrared data can be used for comparison of inversion of surface emissivity [133], detection of coal combustion dynamics and coal fire propagation direction [134], detection of spatiotemporal distribution of surface soil moisture [135], and estimation of surface temperature [136]. In addition, the remote LWIR can detect the emissivity of the surface material, which can be obtained by the radiance measured by the sensor. As a result, LWIR hyperspectral imaging sensors provide valuable information for numerous military, scientific, and commercial applications [137]. Hyperspectral remote sensing technology can also distinguish plant species based on plant-specific reflectivity. Comparing the retrieved emissivity spectrum with the laboratory reference spectrum and then using a random classifier for species identification, studies have shown that the thermal infrared imaging spectrum allows for rapid and spatial measurement of spectral plant emissivity with an accuracy comparable to laboratory measurements, and provides complementary information for plant species identification [138].

6. Conclusions

This review mainly introduces the working principle of infrared thermal imager and the development status and application of processing technology, and briefly introduces the development status and application of multi/hyperspectral infrared remote sensing technology. Infrared imaging can not only detect objects in a completely dark environment, but also penetrate smoke and dust, greatly expanding the range of human perception. Infrared imagers detect objects in a passive manner and are more discreet than active imaging methods such as lasers. Therefore, infrared imaging having good concealment, strong anti-interference, strong target recognition ability, all weather work, and other characteristics, and with the cost and price of infrared imaging products gradually reduced, its application in the civilian field continues to expand. From the perspective of market size, the global civil infrared market in 2020 is quite large, mainly because of the global demand for infrared temperature measurement products under the impact of the new crown epidemic, and this short-term demand is not sustainable. However, in the long run, the scale of the civil infrared market will continue to grow rapidly.
Advanced driver assistance systems use a variety of sensors and cameras installed in the vehicle to collect information related to driving inside and outside the vehicle, and use the information collected to support the driver’s driving behavior in a direct or indirect way. However, with the gradual increase in the popularity of autonomous driving, it is necessary to rely on more on-board camera equipment, of which infrared thermal imaging equipment is an indispensable part of the future of on-board camera and detection equipment. At present, the role of infrared in assisting driving in the automotive field is still at a low level, but with the continuous development of technologies such as automatic driving, the future application space is vast, and the potential is large.

Author Contributions

Conceptualization, F.H. and M.Z.; methodology, M.Z.; investigation, Y.Z. (Yong Zhou) and J.W.; resources, Y.Z. (Yan Zhang) and M.Z.; writing—original draft preparation, M.Z.; writing—review and editing, B.L.; funding acquisition, J.W. All authors have read and agreed to the published version of the manuscript.

Funding

This research was funded in part by the National Natural Science Foundation of China, grant number 52002224, in part by the National Natural Science Foundation of Jiangsu Province, grant number BK20200226, in part by the Program of Science and Technology of Suzhou, grant number SYG202033, and in part by the Key Research and Development Program of Shandong Province, grant number 2020CXG010118.

Institutional Review Board Statement

Not applicable.

Informed Consent Statement

Not applicable.

Data Availability Statement

Not applicable.

Conflicts of Interest

The authors declare no conflict of interest.

References

  1. Ma, T. Analysis of the principle and application of infrared thermal imager. In Proceedings of the 14th Ningxia Young Scientists Forum on Petrochemical Topics, Ningxia, China, 24 July 2018; pp. 323–325, 329. [Google Scholar]
  2. Li, S.Q.; Gong, Y.; Yang, Z.H.; Chen, J.P. Properties and thermal effects of sodium under infrared thermal imager. Chem. Teach. 2022, 2, 74–77. [Google Scholar]
  3. Huang, J.Q.; Wang, H.; Han, J.; Liu, X.H. Research on the application of hyperspectral remote sensing technology in the geological field–Comment on Modeling and application of hyperspectral remote sensing geological process. Nonferr. Met. Eng. 2022, 12, 145. [Google Scholar]
  4. Wang, Y.L. Analysis of agricultural low altitude hyperspectral remote sensing technology based on rotorcraft. Nanfang Agric. Mach. 2022, 53, 81–83. [Google Scholar]
  5. Zhao, G.P.; Wu, J.; Chen, J.Y.; Xu, F.R.; Li, X.W. Analysis of the application of hyperspectral remote sensing technology in the research of medicinal plants. Chin. J. Exp. Formul. 2022, 15, 1–10. [Google Scholar] [CrossRef]
  6. Xu, D.G.; Xing, X.W.; Li, Y.T.; Wang, C.; Tang, D.; Ye, H.Y. River oil spill monitoring based on UAV hyperspectral remote sensing technology. Pet. Nat. Gas Chem. Ind. 2019, 48, 93–97, 104. [Google Scholar]
  7. Li, Y.H.; Li, H.K.; Xu, F. Research progress of hyperspectral remote sensing monitoring of mine environmental pollution. Nonferr. Met. Sci. Eng. 2022, 13, 108–114. [Google Scholar] [CrossRef]
  8. Chen, Y.Y. Study on the application effect of breast cancer examination based on infrared thermal imager. Infrared 2021, 42, 43–49. [Google Scholar]
  9. Bian, Z.Y. Research on the application of infrared imaging method to detect the defects of exterior walls of residential buildings. Sichuan Cem. 2021, 7, 99–100, 136. [Google Scholar]
  10. Li, X.J.; Tu, W.W.; Sun, G.C.; Li, W.S.; Li, X.G. Analysis of components of grid connected photovoltaic power station detected by infrared thermal imager. China Insp. Test. 2022, 30, 17–20. [Google Scholar] [CrossRef]
  11. Sun, G.X.; Liu, J.; Zhang, L.T. Application prospect of thermal imager in aviation line maintenance. In Proceedings of the Symposium on Aviation Equipment Maintenance Technology and Application, Shandong, China, 7 June 2015; pp. 251–255. [Google Scholar]
  12. Lv, N.H. Application of infrared thermal imager in whole process monitoring. China Traffic Inf. Ind. 2009, 5, 85–86. [Google Scholar]
  13. Yang, L. Principles and Techniques of Infrared Thermography Temperature Measurement; Science Press: Beijing, China, 2012. [Google Scholar]
  14. Minkina, W.; Dudzik, S. Infrared Thermography: Errors and Uncertainties; Wiley: New York, NY, USA, 2009. [Google Scholar]
  15. Li, J.; Song, G.; Dong, S.; Chen, W.L.; Wang, H.C. Research progress and trends of uncooled infrared focal plane detectors. Infrared 2020, 41, 1–14, 24. [Google Scholar]
  16. Dai, S.S. Infrared Focal Plane Array Imaging and Its Non-Uniformity Correction Technique; Science Press: Beijing, China, 2015. [Google Scholar]
  17. Xing, S.X. Infrared Thermal Imaging and Signal Processing; National Defense Industry Press: Beijing, China, 2011. [Google Scholar]
  18. Chen, R.; Tan, X. Study on non-uniformity correction of infrared image. Infrared Technol. 2002, 24, 1–3. [Google Scholar]
  19. Scribner, D.A.; Sarkady, K.A.; Caulfield, J.T. Nonuniformity correction for staring IR focal plane arrays using scene-based techniques. Infrared Detect. Focal Plane Arrays Int. Soc. Opt. Photonics 1990, 1308, 224–233. [Google Scholar]
  20. Qian, W.; Qian, C.; Gu, G. Space low-pass and temporal high-pass nonuniformity correction algorithm. Opt. Rev. 2010, 17, 24–29. [Google Scholar] [CrossRef]
  21. Harris, J.G.; Chiang, Y.M. Nonuniformity correction of infrared image sequences using the constant-statistics constraint. IEEE Trans. Process. 1999, 8, 1148–1151. [Google Scholar] [CrossRef] [PubMed]
  22. Torres, F.; Torres, S.N.; Martín, C.S. A recursive least square adaptive filter for nonuniformity correction of infrared image sequences. In Proceedings of the Iberoamerican Congress on Pattern Recognition, Havana, Cuba, 15–18 November 2005; pp. 540–546. [Google Scholar]
  23. Jiang, G.; Jia, J.; Liu, S. Nonuniformity correction of infrared image based on scene matching. Multispectral and Hyperspectral Image Acquisition and Processing. Int. Soc. Opt. Photonics 2001, 4548, 280–283. [Google Scholar]
  24. Bai, L. Research on Non-Uniformity Correction Method of Infrared Images with Adaptation to Integration Time Adjustment; University of Chinese Academy of Sciences (Institute of Optoelectronics Technology, Chinese Academy of Sciences): Beijing, China, 2020. [Google Scholar] [CrossRef]
  25. Yang, Z.W. Research on Non-Uniformity Correction Technology of Hyperspectral Remote Sensing Images Based on CMOS Sensors; University of Chinese Academy of Sciences (Changchun Institute of Optical Precision Machinery and Physics, Chinese Academy of Sciences): Beijing, China, 2020. [Google Scholar] [CrossRef]
  26. Huang, Y.; Zhang, B.H.; Wu, J.; Ji, L.; Wu, X.D.; Yu, S.K. Adaptive multipoint calibration non-uniformity correction algorithm. Infrared Technol. 2020, 42, 637–643. [Google Scholar] [CrossRef]
  27. Wang, J.; Hong, W.Q.; Ge, P.; Wang, X.D.; Pan, C. An improved method for non-uniformity correction of infrared images based on pixel-level radiometric self-calibration. Infrared Technol. 2021, 43, 246–250. [Google Scholar]
  28. Chen, Q.; Sui, X.B. Infrared Image Processing Theory and Technology; Electronic Industry Press: Beijing, China, 2018. [Google Scholar]
  29. Wen, G.J.; Wang, H.M.; Zhong, C.; Shang, Z.M. A preferential method for parameterized correction of infrared nonuniformity based on image entropy. Space Return Remote Sens. 2021, 42, 91–98. [Google Scholar]
  30. Donoho, D.L.; Johnstone, I.M.; Kerkyacharian, G. Universal Near Minimaxity of Wavelet Shrinkage; Springer: New York, NY, USA, 1997. [Google Scholar]
  31. Mihcak, M.K.; Kozintsev, I.; Ramchandran, K. Low-complexity image denoising based on statistical modeling of wavelet coefficients. IEEE Signal Process. Lett. 1999, 6, 300–303. [Google Scholar] [CrossRef]
  32. Zhang, Y.; Wang, X.Q.; Peng, Y.N. Improved mean filtering algorithm with adaptive central weighting. J. Tsinghua Univ. Nat. Sci. Ed. 1999, 39, 3. [Google Scholar]
  33. Zhang, C.J.; Fu, M.Y.; Jin, M. Infrared image denoising method based on discrete orthogonal wavelet transform. Infrared Laser Eng. 2003, 32, 6. [Google Scholar]
  34. Buades, A.; Coll, B.; Morel, J.M. A non-local algorithm for image denoising. In Proceedings of the Computer Vision and Pattern Recognition, San Diego, CA, USA, 20–25 June 2005. [Google Scholar]
  35. Dabov, K.; Foi, A.; Katkovnik, V. Image Denoising by Sparse 3-D Transform-Domain Collaborative Filtering. IEEE Trans. Image Process. 2007, 16, 2080–2095. [Google Scholar] [CrossRef] [PubMed]
  36. Chen, S.; Li, Y.J.; Di, C. An Infrared Image Denoising Algorithm Based on Wavelet Information Redundancy. Chinese Patent CN103400358A, 20 November 2013. [Google Scholar]
  37. Dai, Y.; Zhu, D.; Wu, D.H. Shock search particle swarm optimization algorithm based on kernel matrix synergistic evolution. J. Chongqing Univ. Posts Telecommun. (Nat. Sci. Ed.) 2016, 28, 247–253. [Google Scholar]
  38. Divakar, N.; Babu, R.V. Image Denoising via CNNs: An Adversarial Approach. In Proceedings of the Computer Vision & Pattern Recognition Workshops, Honolulu, HI, USA, 21–26 July 2017; pp. 1076–1083. [Google Scholar]
  39. Zhang, F.; Cai, N.; Wu, J. Image denoising method based on a deep convolution neural network. IET Image Process. 2018, 12, 485–493. [Google Scholar] [CrossRef]
  40. Liu, X. Research on Infrared Image Denoising Algorithm; Xi’an University of Electronic Science and Technology: Xi’an, China, 2019. [Google Scholar] [CrossRef]
  41. Xu, J.W.; Han, J.; Ding, L.H. Improved compressed-aware infrared image denoising algorithm. Electron. Meas. Technol. 2021, 44, 107–111. [Google Scholar] [CrossRef]
  42. Mao, X.J.; Shen, C.; Yang, Y.B. Image Restoration Using Very Deep Convolutional Encoder-Decoder Networks with Symmetric Skip Connections. arXiv 2016, arXiv:1603.09056. [Google Scholar]
  43. Zhang, K.; Zuo, W.; Chen, Y. Beyond a Gaussian Denoiser: Residual Learning of Deep CNN for Image Denoising. IEEE Trans. Image Process. 2017, 26, 3142–3155. [Google Scholar] [CrossRef]
  44. Liu, C.; Shang, C.; Qin, A. A Multi-Scale Image Denoising Algorithm Based on Inflated Residual Convolutional Networks; Springer: Singapore, 2019. [Google Scholar]
  45. Lin, H.W.; Chen, J.R.; Niu, Y.Z. A multi-stage image denoising method based on recurrent neural networks. Small Microcomput. Syst. 2022, 13, 1–9. Available online: http://kns.cnki.net/kcms/detail/21.1106.TP.20210818.1138.040.html (accessed on 6 July 2022).
  46. Munteanu, C.; Rosa, A. Gray-scale image enhancement as an automatic process driven by evolution. IEEE Trans. Syst. Man Cybern. Part B (Cybern.) 2004, 34, 1292–1298. [Google Scholar] [CrossRef] [PubMed]
  47. Wang, Z.J.; Luo, Y.Y.; Jiang, S.Z.; Xiong, N.F.; Wan, L.T. An improved algorithm for adaptive infrared image enhancement based on guided filtering. Spectrosc. Spectr. Anal. 2020, 40, 5. [Google Scholar]
  48. Yu, T.H.; Dai, J.M. A new technique for infrared image enhancement combining the visual properties of human eyes. Infrared Laser Eng. 2008, 37, 16–19. [Google Scholar]
  49. Dai, S.S.; Xu, H.; Liu, Q. Infrared image enhancement algorithm based on the visual characteristics of human eyes. Semicond. Optoelectron. 2016, 1, 4. [Google Scholar]
  50. Jia, Q.; Lu, X.L.; Wu, C. Research on infrared image enhancement based on the visual characteristics of human eyes. Infrared Technol. 2010, 32, 5. [Google Scholar]
  51. Zhai, H.X.; He, J.Q.; Wang, Z.J.; Jing, J.B.; Chen, W.Z. Improved Retinex and Multi-Image Fusion Algorithm for Low Illumination Image Enhancement. Infrared Technol. 2021, 43, 987–993. [Google Scholar]
  52. Xie, F.Y.; Tang, M.; Zhang, R. A review of Retinex-based image enhancement methods. Data Acquis. Process. 2019, 34, 1–11. [Google Scholar] [CrossRef]
  53. Boyd, L. Analysis of infrared thermography data for icing applications. In Proceedings of the 29th Aerospace Sciences Meeting, Reno, NV, USA, 7–10 January 1991. [Google Scholar]
  54. Yang, L. Infrared thermography temperature calculation and error analysis. Infrared Technol. 1999, 21, 5. [Google Scholar]
  55. Yang, L.; Kou, W.; Liu, H.K. Measurement of surface emissivity by thermal imaging cameras and error analysis. Laser Infrared 2002, 32, 3. [Google Scholar]
  56. Kou, W.; Yang, L. Analysis of the influencing factors of errors in thermal measurements. Infrared Technol. 2001, 23, 32–34. [Google Scholar]
  57. Liu, H.K.; Yang, L. Influence of solar radiation on the temperature measurement error of infrared thermal imaging cameras. Infrared Technol. 2002, 24, 34–37. [Google Scholar]
  58. Zhang, J.; Yang, L.; Liu, H.K. Influence of high ambient temperature objects on the temperature measurement error of thermal imaging cameras. Infrared Technol. 2005, 27, 419–422. [Google Scholar]
  59. Pokorni, S. Error Analysis of Surface Temperature Measurement by Infrared Sensor. Int. J. Infrared Millim. Waves 2004, 25, 1523–1533. [Google Scholar] [CrossRef]
  60. Xu, Y.H.; Wu, M.; Cao, W.H.; Ning, Z.Y. Infrared image recognition detection method for blast furnace temperature field and its application. Control Eng. 2005, 12, 354–356. [Google Scholar]
  61. Fu, L.; Wang, Z.P.; Liu, X.W.; Du, S.G. Infrared thermographic detection of surface temperature distribution in the inertial friction welding zone. J. Weld. 1999, S1, 48–53. [Google Scholar]
  62. Cai, L.J.; Zhou, K.L.; Shen, G.Z. High-precision temperature calibration technology for infrared thermal imaging cameras. Infrared Laser Eng. 2021, 50, 8. [Google Scholar]
  63. Elmahdy, A.H.; Devine, F. Laboratory Infrared Thermography Technique for Window Surface Temperature Measurements. Ashrae Trans. 2005, 111, 561–571. [Google Scholar]
  64. Inagaki, T.; Okamoto, Y. Surface temperature measurement near ambient conditions using infrared radiometers with different detection wavelength bands by applying a grey- body approximation: Estimation of radiative properties for non-metal surfaces-ScienceDirect. NDT E Int. 1996, 29, 363–369. [Google Scholar] [CrossRef]
  65. Inagaki, T.; Okamoto, Y. Surface Temperature Measurement Using Infrared Radiometer by Applying a Pseudo-Gray-Body Approximation: Estimation of Radiative Property for Metal Surface. ASME J. Heat Transf. 1996, 118, 73–78. [Google Scholar] [CrossRef]
  66. Gaussorgues, G. Infrared Thermography; Springer: Dordrecht, The Netherlands, 1994. [Google Scholar]
  67. Okamoto, Y.; Inagaki, T.; Sekiya, M. Surface Temperature Measurement Using Infrared Radiometer. 1st Report. Radiosity Coefficient and Radiation Temperature. Trans. Jpn. Soc. Mech. Eng. 1993, 59, 3932–3937. [Google Scholar] [CrossRef] [Green Version]
  68. Du, Y.X.; Hu, Z.Q.; Ge, Y.H. Effect of distance on infrared temperature measurement with different intensity heat sources and compensation. Infrared Technol. 2019, 41, 6. [Google Scholar]
  69. Zhang, Z.Q.; Wang, P.; Zhao, S.J. Analysis of the influence of target distance and angle on the temperature measurement accuracy of infrared thermal imager. J. Tianjin Univ. Nat. Sci. Eng. Technol. Ed. 2021, 54, 8. [Google Scholar]
  70. Chen, P.F.; Hu, Y.B. Improving the measurement accuracy of infrared pyrometer. Petrochem. Appl. 2006, 2, 45–47. [Google Scholar]
  71. Zhang, R. Deep Learning-Based Infrared Target Detection and Recognition; University of Chinese Academy of Sciences (Institute of Optoelectronics Technology, Chinese Academy of Sciences): Beijing, China, 2021. [Google Scholar] [CrossRef]
  72. Uijlings, J.R.R.; Sande, K.; Gevers, T. Selective Search for Object Recognition. Int. J. Comput. Vis. 2013, 104, 154–171. [Google Scholar] [CrossRef]
  73. Zitnick, C.L.; Dollár, P. Edge boxes: Locating object proposals from edges. In European Conference on Computer Vision; Springer: Cham, Switzerland, 2014; pp. 391–405. [Google Scholar]
  74. Freund, Y.; Schapire, R.E. A decision-theoretic generalization of on-line learning and an application to boosting. J. Comput. Syst. Sci. 1997, 55, 119–139. [Google Scholar] [CrossRef]
  75. Nilsson, R.; Pena, J.M.; Björkegren, J. Evaluating feature selection for SVMs in high dimensions. In Proceedings of the European Conference on Machine Learning, Berlin, Germany, 18–22 September 2006; pp. 719–726. [Google Scholar]
  76. Redmon, J.; Divvala, S.; Girshick, R. You only look once: Unified, real-time object detection. In Proceedings of the IEEE Conference on Computer Vision and Pattern Recognition, Las Vegas, NV, USA, 27–30 June 2016; pp. 779–788. [Google Scholar]
  77. Redmon, J.; Farhadi, A. YOLO9000: Better, Faster, Stronger. In Proceedings of the IEEE Conference on Computer Vision & Pattern Recognition, Honolulu, HI, USA, 21–26 July 2017; pp. 6517–6525. [Google Scholar]
  78. Redmon, J.; Farhadi, A. Yolov3: An incremental improvement. arXiv 2018, arXiv:1804.02767. [Google Scholar]
  79. Bai, C.; Wang, Y.J.; Yang, Y.; Djukanovic, M. Lightweight target detection algorithm based on multi-way feature pyramid. Liq. Cryst. Disp. 2021, 36, 1516–1524. [Google Scholar] [CrossRef]
  80. Feng, Z.Q.; Xie, Z.J.; Bao, Z.W.; Chen, K.W. Real time dense small target detection algorithm for UAV Based on improved yolov5. Acta Aeronaut. Sin. 2022, 1–15. Available online: http://kns.cnki.net/kcms/detail/11.1929.V.20220509.2316.010.html (accessed on 16 June 2022).
  81. Bochkovskiy, A.; Wang, C.Y.; Liao, H.Y.M. Yolov4: Optimal speed and accuracy of object detection. arXiv 2020, arXiv:2004.10934. [Google Scholar]
  82. Shi, J.T.; Zhang, G.Q.; Tao, J.; Wu, L.H. Improved pedestrian detection algorithm for YOLOv4 infrared images. Intell. Comput. Appl. 2021, 11, 31–34 + 41. [Google Scholar]
  83. Lan, X.; Guo, Z.H.; Li, C.G. Aircraft target detection based on attention and feature fusion for optical remote sensing images. Liq. Cryst. Disp. 2021, 36, 1506–1515. [Google Scholar] [CrossRef]
  84. Zhu, J.; Wang, J.; Wang, Z.; Wang, B. An improved lightweight mask detection algorithm based on YOLOv4-tiny. Liq. Cryst. Disp. 2021, 36, 1525–1534. [Google Scholar] [CrossRef]
  85. Ding, C.; Jin, K.; Wang, S.X.; Mu, Q.Q.; Xuan, L.; Li, D.Y. Image processing and projection annotation techniques for infrared thermal wave detection of composite materials. Liq. Cryst. Disp. 2021, 36, 1545–1553. [Google Scholar] [CrossRef]
  86. Li, Z.Z.; Wang, D.M.; Liu, D.C. Progress in hyperspectral remote sensing technology and resource exploration and application. Earth Sci. J. China Univ. Geosci. 2015, 40, 1287–1294. [Google Scholar]
  87. Chen, W.T.; Zhang, Z.; Wang, Y.X. Research Progress on Mine Development and Remote Sensing Detection of Mine Environment. Remote Sens. Land Resour. 2009, 2, 1–8. [Google Scholar]
  88. Kruse, F.A. The Effects of Spatial Resolution, Spectral Resolution, and SNR on Geologic Mapping Using Hyperspectral Data, Northern Grapevine Mountains, Nevada. Fac. Publ. 2000, 10, 127601156. [Google Scholar]
  89. Tong, Q.X. The present and future of hyperspectral remote sensing. J. Remote Sens. 2003, 7, 1–12. [Google Scholar]
  90. FLAASH Module User’s Guide. Research Systems, Znc, 24 July 2005.
  91. Xiong, Z.; Tong, Q.X.; Zhang, L.F. A High-Order Neural Network Algorithm for Hyperspectral Remote Sensing Image Classification. Chin. J. Image Graph. 2000, 5, 20–25. [Google Scholar]
  92. Zhang, S.M.; Jing, F. Temperature and emissivity separation and mineral mapping based on airborne TASI hyperspectral thermal infrared data. Int. J. Appl. Earth Obs. Geoinf. 2015, 40, 19–28. [Google Scholar] [CrossRef]
  93. Rutkowski, P.; Kastek, M. Detection of the Chemical Agents Based on Hyperspectral Data Analysis. Meas. Autom. Monit. 2019, 1, 65. [Google Scholar]
  94. Huo, H.Y.; Li, Z.L.; Xing, Z.F. Temperature/emissivity separation using hyperspectral thermal infrared imagery and its potential for detecting the water content of plants. Int. J. Remote Sens. 2018, 40, 1672–1692. [Google Scholar] [CrossRef]
  95. Wang, X.H.; Tang, B.H.; Zhao, L.L.; Zhang, R.H. A New Method for Temperature/Emissivity Separation from Hyperspectral Thermal Infrared Data. In Proceedings of the IEEE International Geoscience & Remote Sensing Symposium, Cape Town, South Africa, 12–17 July 2009. [Google Scholar]
  96. Kirkland, L.; Herr, K.; Keim, E. First use of an airborne thermal infrared hyperspectral scanner for compositional mapping. Remote Sens. Environ. 2002, 80, 447–459. [Google Scholar] [CrossRef] [Green Version]
  97. Black, M.; Riley, T.R. Automated lithological mapping using airborne hyperspectral thermal infrared data: A case study from Anchorage Island, Antarctica. Remote Sens. Environ. 2016, 176, 225–241. [Google Scholar] [CrossRef]
  98. Martin, S.; Gilles, R.; Philippe, L. A Hyperspectral Thermal Infrared Imaging Instrument for Natural Resources Applications. Remote Sens. 2012, 4, 3995–4009. [Google Scholar]
  99. Gerhards, M.; Schlerf, M.; Mallick, K. Challenges and future perspectives of multi-/Hyperspectral thermal infrared remote sensing for crop water-stress detection: A review. Remote Sens. 2019, 11, 1240. [Google Scholar] [CrossRef]
  100. Wang, N.; Wu, H. Temperature and Emissivity Retrievals From Hyperspectral Thermal Infrared Data Using Linear Spectral Emissivity Constraint. IEEE Trans. Geosci. Remote Sens. 2011, 49, 1291–1303. [Google Scholar] [CrossRef]
  101. Riley, D.N.; Hecker, C.A. Mineral Mapping with Airborne Hyperspectral Thermal Infrared Remote Sensing at Cuprite, Nevada, USA. In Thermal Infrared Remote Sensing; Springer: Dordrecht, The Netherlands, 2013. [Google Scholar]
  102. Wang, Z. Overview of the application of infrared thermometry in China. Laser Infrared 1990, 20, 32–37. [Google Scholar]
  103. Lv, S.G.; Yang, L.; Yang, Q. Research on the applications of infrared technique in the diagnosis and prediction of diesel engine exhaust fault. J. Therm. Sci. Engl. 2011, 20, 189–194. [Google Scholar] [CrossRef]
  104. Li, D.G. Infrared technology in automotive applications. Infrared 2011, 32, 40–45. [Google Scholar]
  105. Ren, H.; Wang, Y.; Xiao, G. Design and experimental study of an active early warning system for bridge anti-ship installations. Laser Infrared 2013, 43, 66–70. [Google Scholar]
  106. Li, Y.; Xiao, G. Design and study of a foreign body detection system for airport runways. Laser Infrared 2011, 41, 7. [Google Scholar]
  107. Lahiri, B.B.; Bagavathiappan, S.; Jayakumar, T. Medical applications of infrared thermography: A review. Infrared Phys. Technol. 2012, 55, 221–235. [Google Scholar] [CrossRef] [PubMed]
  108. Otsuka, M.; Funakubo, F.; Suzuki, T. Real-time monitoring of tablet surface temperature during high-speed tableting by infrared thermal imaging. J. Drug Deliv. Sci. Technol. 2021, 68, 102736. [Google Scholar] [CrossRef]
  109. Magalhaes, C.; Vardasca, R.; Mendes, J. Recent use of medical infrared thermography in skin neoplasms. Ski. Res. Technol. 2018, 24, 587–591. [Google Scholar] [CrossRef] [PubMed]
  110. Hu, W.; Yu, B.; Luo, J. Hybrid refractive/diffractive optical system design for light and compact uncooled longwave infrared imager. In Proceedings of the 6th International Symposium on Advanced Optical Manufacturing and Testing Technologies (AOMATT 2012), Xiamen, China, 26–29 April 2012. [Google Scholar] [CrossRef]
  111. Ding, R.L.; Han, C.Z.; Xie, B.R.; Wang, Y.; Zhang, Z. Infrared remote sensing image ship target detection. Infrared Technol. 2019, 41, 127–133. [Google Scholar]
  112. Li, J.D. Satellite Remote Sensing Technology (Upper Book); Beijing University of Technology Press: Beijing, China, 2018. [Google Scholar]
  113. Zheng, X.; Li, J.M.; Lan, L.G.; Zhou, H.P.; Zhu, F.Y. Experimental study of infrared thermal imaging during compression fatigue of PBX. J. Pyrotech. 2009, 32, 18–20 + 36. [Google Scholar]
  114. Liu, W.; Niu, Y.F.; Xiao, L.L.; Wang, Y.B. Development of infrared focal plane arrays and satellite-based infrared imaging systems. Infrared 2021, 42, 15–24. [Google Scholar]
  115. Pu, E.P.; Tang, S.L. Application of infrared thermal imaging technology in power system fault diagnosis. Power Technol. 2009, 31, 50–56. [Google Scholar] [CrossRef]
  116. Zhu, G. Exploration of the application of infrared thermal imaging technology in the condition maintenance of power transmission equipment. Enterp. Technol. Dev. 2015, 34, 41–42. [Google Scholar]
  117. Li, B.S.; Xu, X.T.; Cui, K.B. Application of Infrared Imaging Technology in Fault Diagnosis of Electrical Equipment. Zhejiang Electr. Power 2014, 401–403, 974–977. [Google Scholar] [CrossRef]
  118. Zhang, D.; Guo, J.; Yin, G.H. Infrared Thermal Imager In the Distribution Line Fault Diagnosis Application. Equip. Manuf. Technol. 2012, 3, 1–10. [Google Scholar]
  119. Zhou, R.; Su, H.; Wen, Z. Experimental Study on Leakage Detection of Grassed Earth Dam by Passive Infrared Thermography. ScienceDirect, 4 July 2021. [Google Scholar]
  120. Huda, A.; Taib, S. Application of infrared thermography for predictive/preventive maintenance of thermal defects in electrical equipment. Appl. Therm. Eng. 2013, 61, 220–227. [Google Scholar] [CrossRef]
  121. Guo, L.; Xiaoying, M.A.; Shen, J. Application of Infrared Thermal Imager in Electrical Equipment for the Glass Industry. Glass Enamel 2019, 47, 12–16. [Google Scholar]
  122. Mariprasath, T.; Kirubakaran, V. A real time study on condition monitoring of distribution transformer using thermal imager. Infrared Phys. Technol. 2018, 90, 78–86. [Google Scholar] [CrossRef]
  123. Geoffrey, O.A. Defect Detection on Electrical Power Equipment Using Thermal Imaging Technology. Master’s Thesis, Universiti Malaysia Pahang, Pekan District, Malaysia, 2013. [Google Scholar]
  124. Niu, H.; Wang, Y.P.; Zhang, D. Application of infrared thermal imaging technology in 500kV substation energized detec-tion. Power Saf. Technol. 2019, 21, 46–48. [Google Scholar]
  125. Chen, C.; Wang, Y.Y.; Liang, C.; Xu, J.Y.; Wang, X.J.; He, T.L. Application of infrared thermal imaging technology in power plant transformer operation and maintenance. Sci. Technol. Innov. 2020, 8, 26–27. [Google Scholar]
  126. Chen, K.X. Infrared thermal imaging technology applied to the diagnosis of defects in high-voltage transmission equipment. Electron. World 2013, 6, 44–45. [Google Scholar]
  127. Roberts, C.C., Jr. The application of infrared thermography in fire and explosion investigation. Proc. SPIE 1988, 934, 2–9. [Google Scholar]
  128. Cao, N.Y. Application of Image Recognition Technology in Large Space Building Fire Detection; Anhui University of Technology: Hefei, China, 2008. [Google Scholar]
  129. Melendez, J.; Castro, A.J.; Lopez, F. Forest fire studies by medium infrared and thermal infrared thermography. Proc. SPIE 2001, 4360, 161–168. [Google Scholar]
  130. Chen, H.G.; Wang, W.Y.; Xu, A.H. Construction and application of fire reconnaissance and information transmission system for forest aerial firefighting. For. Fire Prev. 2013, 6, 52–54. [Google Scholar]
  131. Goffin, B.; Banthia, N.; Yonemitsu, N. Use of infrared thermal imaging to detect corrosion of epoxy coated and uncoated rebar in concrete. Constr. Build. Mater. 2020, 263, 120162. [Google Scholar] [CrossRef]
  132. Gagnon, M.A.; Lagueux, P.; Gagnon, J.P. Airborne Thermal Infrared Hyperspectral Imaging of Buried Objects. In Proceedings of the SPIE Defense & Security, Baltimore, MD, USA, 14 May 2015. [Google Scholar]
  133. Sobrino, J.A.; Raissouni, N.; Li, Z.L. A Comparative Study of Land Surface Emissivity Retrieval from NOAA Data. Remote Sens. Environ. 2001, 75, 256–266. [Google Scholar] [CrossRef]
  134. Huo, H.Y.; Jiang, X.G.; Song, X.F. Detection of Coal Fire Dynamics and Propagation Direction from Multi-Temporal Nighttime Landsat SWIR and TIR Data: A Case Study on the Rujigou Coalfield, Northwest (NW) China. Remote Sens. 2014, 6, 1234–1259. [Google Scholar] [CrossRef]
  135. Abstract Advances in Research Products from Combined CALIPSO-CloudSat Observations within the A-Train Aerosol and Elevated Cloud Optical Depth Direct Retrieval over Ocean. In Proceedings of the 17th Conference on Air Sea Interaction, New York, NY, USA, 26–27 September 2010.
  136. Li, Z.L.; Tang, B.H.; Wu, H. Satellite-Derived Land Surface Temperature: Current Status and Perspectives. Remote Sens. Environ. 2013, 131, 14–37. [Google Scholar] [CrossRef]
  137. Manolakis, D.; Pieper, M.; Truslow, E. Longwave infrared hyperspectral imaging: Principles, progress, and challenges. IEEE Geosci. Remote Sens. Mag. 2019, 7, 72–100. [Google Scholar] [CrossRef]
  138. Rock, G. Plant species discrimination using emissive thermal infrared imaging spectroscopy. Int. J. Appl. Earth Obs. Geoinf. 2016, 53, 16–26. [Google Scholar] [CrossRef]
Figure 1. Components of a thermal imaging camera.
Sustainability 14 11161 g001
Figure 2. Focal plane thermal imaging principle [14].
Sustainability 14 11161 g002
Figure 3. Principle of operation of an uncooled thermal imaging camera [2].
Sustainability 14 11161 g003
Figure 4. Study of nonuniformity correction algorithms for infrared images.
Sustainability 14 11161 g004
Figure 5. Schematic diagram of the two-point temperature calibration.
Sustainability 14 11161 g005
Figure 6. Diagram of multi-point temperature calibration.
Sustainability 14 11161 g006
Figure 7. Research on infrared image denoising algorithms.
Sustainability 14 11161 g007
Figure 8. Infrared image enhancement algorithms.
Sustainability 14 11161 g008
Publisher’s Note: MDPI stays neutral with regard to jurisdictional claims in published maps and institutional affiliations.

