Article

Optimization of a Renewable Energy Source-Based Virtual Power Plant for Electrical Energy Management in an Unbalanced Distribution Network

1
Department of Electrical and Electronics Engineering, Easwari Engineering College, Chennai 600089, India
2
Department of Electrical and Electronics Engineering, K.S.R. College of Engineering, Tiruhengode 637215, India
*
Author to whom correspondence should be addressed.
Sustainability 2022, 14(18), 11129; https://doi.org/10.3390/su141811129
Submission received: 2 June 2022 / Revised: 11 August 2022 / Accepted: 16 August 2022 / Published: 6 September 2022

Abstract

:
The virtual power plant (VPP) is a developing concept in the modern engineering field. This paper presents a local search optimization (LSO) algorithm-based virtual power plant for energy management in a distribution network. The proposed LSO algorithm is used for the optimal selection and location of the distributed energy resources (DER), the optimal regulation of load, and the optimal usage of energy storage systems in a VPP. DERs are a renewable energy sources (RES) that consist of solar PV and a wind energy source. DERs face the challenge of energy losses, voltage variations, and revenue losses in the utilization network. These problems are solved by the proposed VPP concept by reducing the acquiring of energy from the power sector. An LSO-based virtual power plant is modeled in MATLB PSCAD and verified using the IEEE-9 bus system. The results show that 81% of the purchased energy from the utility grid was reduced by the optimal placement of the DER and 86% of acquired energy from utility grid was reduced by the optimal location of the DER and optimal load control in the VPP.

1. Introduction

Electrical energy consumption has increased year by year and renewable energy source installation, such as solar PV power and wind power, has also increased around the world. In the year of 2019, 581 GW capacity of solar photovoltaic energy was installed, with 15% of the annual growth rate, and 651 GW capacity of wind energy was installed, with 10% of the annual growth rate [1]. RES installations have increased due to a lack of non-conventional energy sources, low efficiency, environmental pollution, and the cost of power generation. These issues are solved by the integration of a distributed generator such as a virtual power plant. VPP is able to regulate the load and integrate the renewable energy source through smart communication technology [2].
VPP is defined by different authors in various ways. In [3], VPP is defined as an aggregation of various types of distributed energy resources that may be operated at different points of voltage in a network. In [4,5], VPP is called a collection of different technologies, with various operating systems and availability, which may connect to different system of a network. VPP is described as a multi-technology, multi-site heterogeneous entity. The purpose of a virtual power plant is to monitor and control the load based on the availability of power in DER at a precise time [6]. VPP is a developing concept in the power system engineering field for improving the quality of power [7]. A VPP acts as a single power plant, in spite of various conventional and non-conventional energy sources, to achieve the load demand on the distribution side. A VPP is also used to solve energy management issues in the power sector [8,9].
The VPP concept improves the certainties of DG generation and voltage profile, reduces the losses, and increases the revenue profit [10]. A VPP also reduces the pollution in the environment through the use of the green energy of renewable energy sources [11]. A VPP is microgrid island [12], and an energy storage system is a key part of the VPP [13]. From the given definitions, a VPP is an integration of various renewable energy sources with a controllable energy storage system and load. VPPs act as independent power plants to achieve a better energy management system. A VPP is a two way communication system; it starts with DGs and ends at the load, based on demand [14]. Renewable energy-based DGs produce the output power, with variations and fluctuations. Power variations are compensated by optimal applications of the energy storage system [15]. Vehicle to grid technology is used in the VPP to overcome the issues of RES-based DGs [16]. The various algorithms [17,18,19] are used to increase the profit of the VPP and are verified by the IEEE bus system, with consideration of real-time data.
Combined scheduling of DR and DER are proposed in the work of [20] for demand and reservation. The energy cost of VPP is not considered in [20]. A fuzzy logic based resource dispatch method is discussed in [21] for renewable energy, such as wind energy, and solar PV without DR. Mixed integer nonlinear programming (MINLP) is implemented in [22] for demand side management of residential load, and cost analysis is completed without considering utility benefit. EnergyPLAN software is used for calculating the energy cost of the DR and energy storage in [23]; however, energy variation and other parameters are not considered. The bi-level model of VPP is implemented in [24] for determining the performance analysis of each producer. Various algorithms are used in these studies, in terms of commercial VPP; however, technical parameters are not considered for this approach. The industrial VPP is introduced in [25] for load side management in industry, but peak demand, load sharing, and utility benefits are not within the scope of this research. The present literature survey gives more importance to VPP performance analysis with market aspects. The objectives of this research are limited to the designing of commercial VPP with the cost minimization and technical application of VPP, such as voltage profile improvement; peak load reduction and reverse power flow are not considered.
In this paper, a local searching algorithm is proposed for the optimization of the VPP. The main goals of our research are to minimize the purchasing energy from the substation, to reduce the power losses, and improve the quality of power. In this paper, the VPP is modeled for the IEEE-9 bus system, and the DERs of wind and solar photovoltaic energy are used to integrate with the grid. The expected results can be achieved by the optimal allocation of the DER, optimal control of the load and optimal usage of the energy storage element. In this paper, the real-time data of wind and solar energy are considered from the research in [3]. The novel elements of the proposed local search optimization algorithm based-VPP are the fact that the distribution energy resource (DER) location is optimized based on the minimum distance between the source and the load, the controllable loads are identified in each feeder of the IEEE bus system—and the optimal control of the load is based on the availability of the renewable energy source (RES)—and the energy storage systems are optimally used to maximize the participation of the RES in the energy market and to reduce the purchasing energy from the utility grid. The proposed VPP model is simulated in Matlab, and the analysis uses IEEE buses for 24 h. LSO is one of the evolutionary concepts which is used to optimize the load depend upon the energy available of renewable sources. Section 2 explains the basic operations and types of VPP. Section 3 describes the problem statement and the assumption of the proposed VPP model. Section 4 illustrates the modeling of VPP regarding a utility grid, wind turbine, solar PV, and load. Section 5 discusses the results of the analysis of Matlab model.

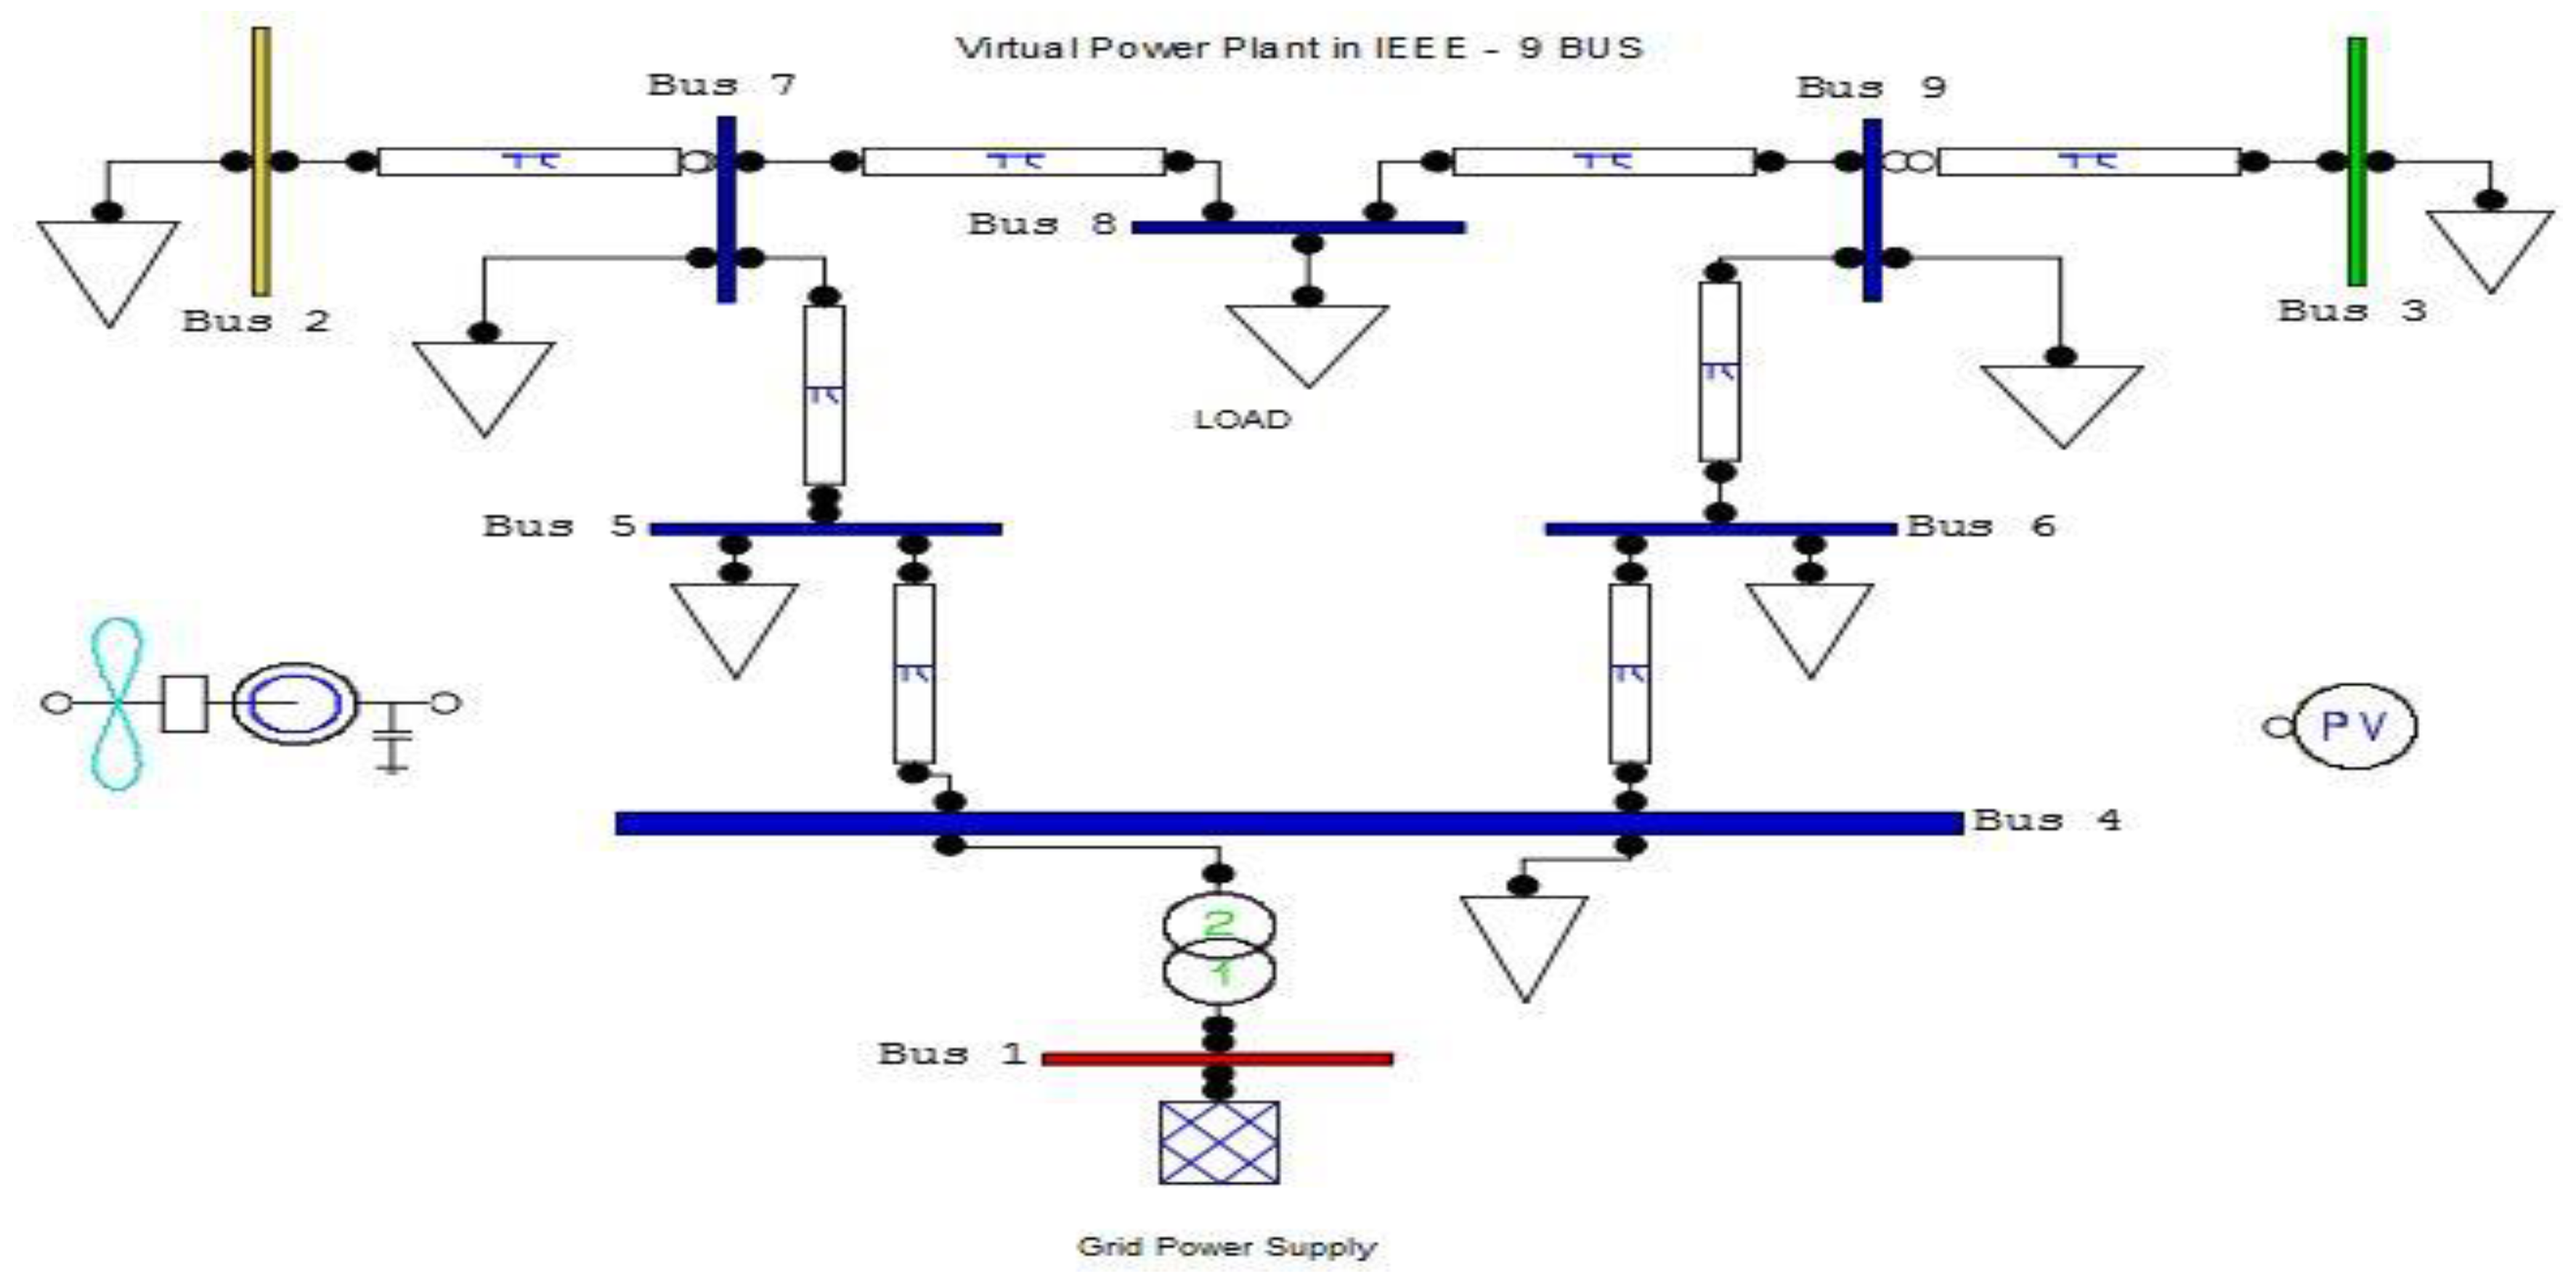
2. Virtual Power Plant

The basic structure of a virtual power plant is shown in Figure 1. Virtual power plants can be classified into a source virtual power plant and a load virtual power plant, based on the operation and structure. A source virtual power plant consists of various renewable energy sources, a utility grid, and an energy element system. Source virtual power plants mainly collect the past and present details of energy resources. In a wind power plant, the wind speed and height are considered to forecast the present energy generated from the wind turbine. In a solar photovoltaic system, solar irradiation and temperature are considered to find the present energy produced from solar panels. Current details of wind and solar power can be forecasted by comparisons with the previous year history. A load virtual power plant consists of various types of loads, such as industrial load, domestic load, commercial load and electric vehicle load. Source virtual power plants and load virtual power plants are monitored and controlled by a central virtual power plant. The central virtual power plant is the heart of the system. It collects the information regarding the actual and required power demand from the source virtual power plant and the load virtual power plant. The central virtual power has a bilateral connection for sending the power from the source to the load and receiving the feedback information from the load to the source. Therefore, the central virtual power plant is mainly used for monitoring and controlling the available load and the power in the SVPP. The central virtual power plant receive their information from the SVPP and the LVPP each and every hour. The main purpose of the central virtual power plant is to meet the power demand of the load using renewable energy sources and attempting to reduce the energy purchasing from the utility grid. If electrical energy from the renewable energy source is meeting the power demand of load and excess energy is available, the renewable energy source is connected to the energy storage element.
The energy storage element charges during the minimum loading condition. If the power demand of the load is unable to be met by the renewable energy sources at particular time, the energy storage element can discharge and provide power to the load. In some conditions, renewable energy sources can generate a maximum amount of energy compared to the power demand of load. Therefore, excess power can be provided to the utility of grid. In the LVPP, a variable load can be identified and controlled based on the importance and requirements of the load. Thus, a variable load may be controlled at a particular time in order to reduce the power consumption.
A virtual power plant can also be classified into a technical virtual power plant and a commercial virtual power plant. A technical virtual power plant contains all the technical information of the DER and the load, including the power demand, availability of power, purchased power from grid, and power losses. A commercial virtual power plant contains details regarding energy purchasing from the grid, energy purchasing from the DER, and reduced cost due to the integration of renewable energy sources.

3. Problem Statement

3.1. Input

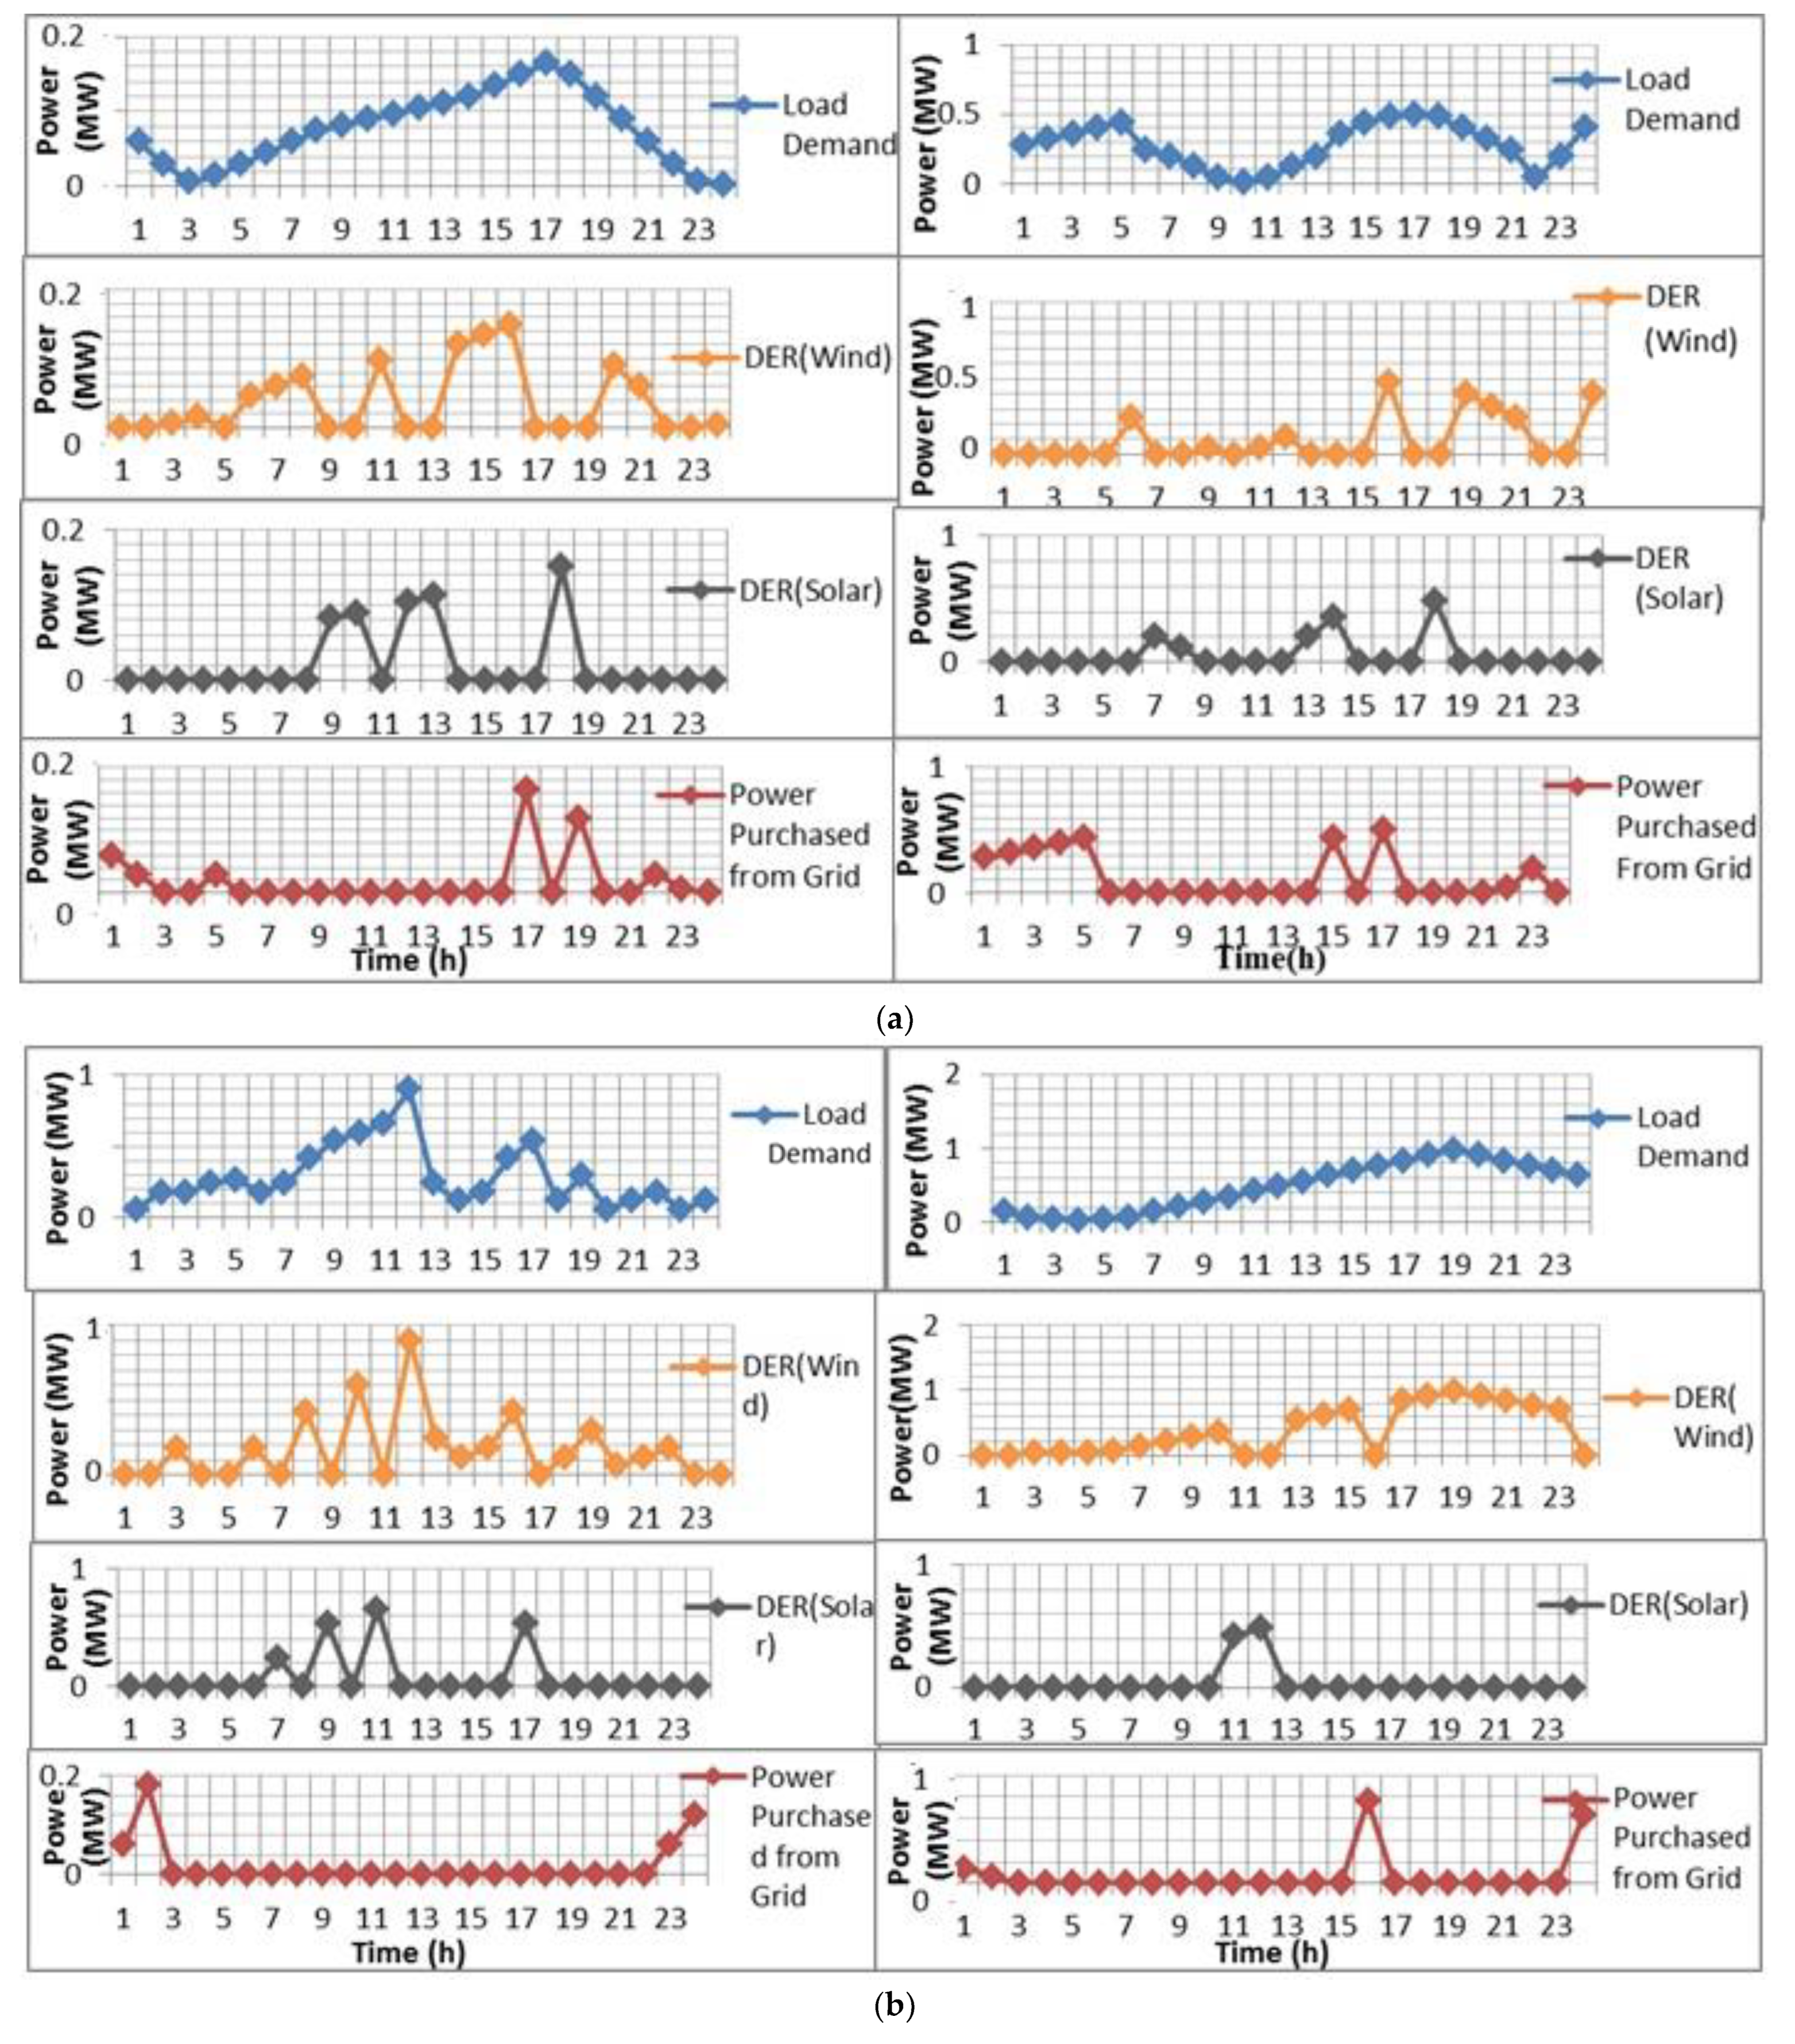
  • Wind and solar energy have been considered as the input for VPP modeling.
  • Observed load variations in every bus was recorded once per hour, and the total power consumption of the overall load was measured for one day.

3.2. Problem Statement

  • The maximum amount of energy was purchased from the utility grid for the distribution network.
  • Power losses may be increases based on the load variation.
  • Not all of the renewable energy sources are able to participate in the energy market.

3.3. Solution

The above problems can be solved by using the following steps:
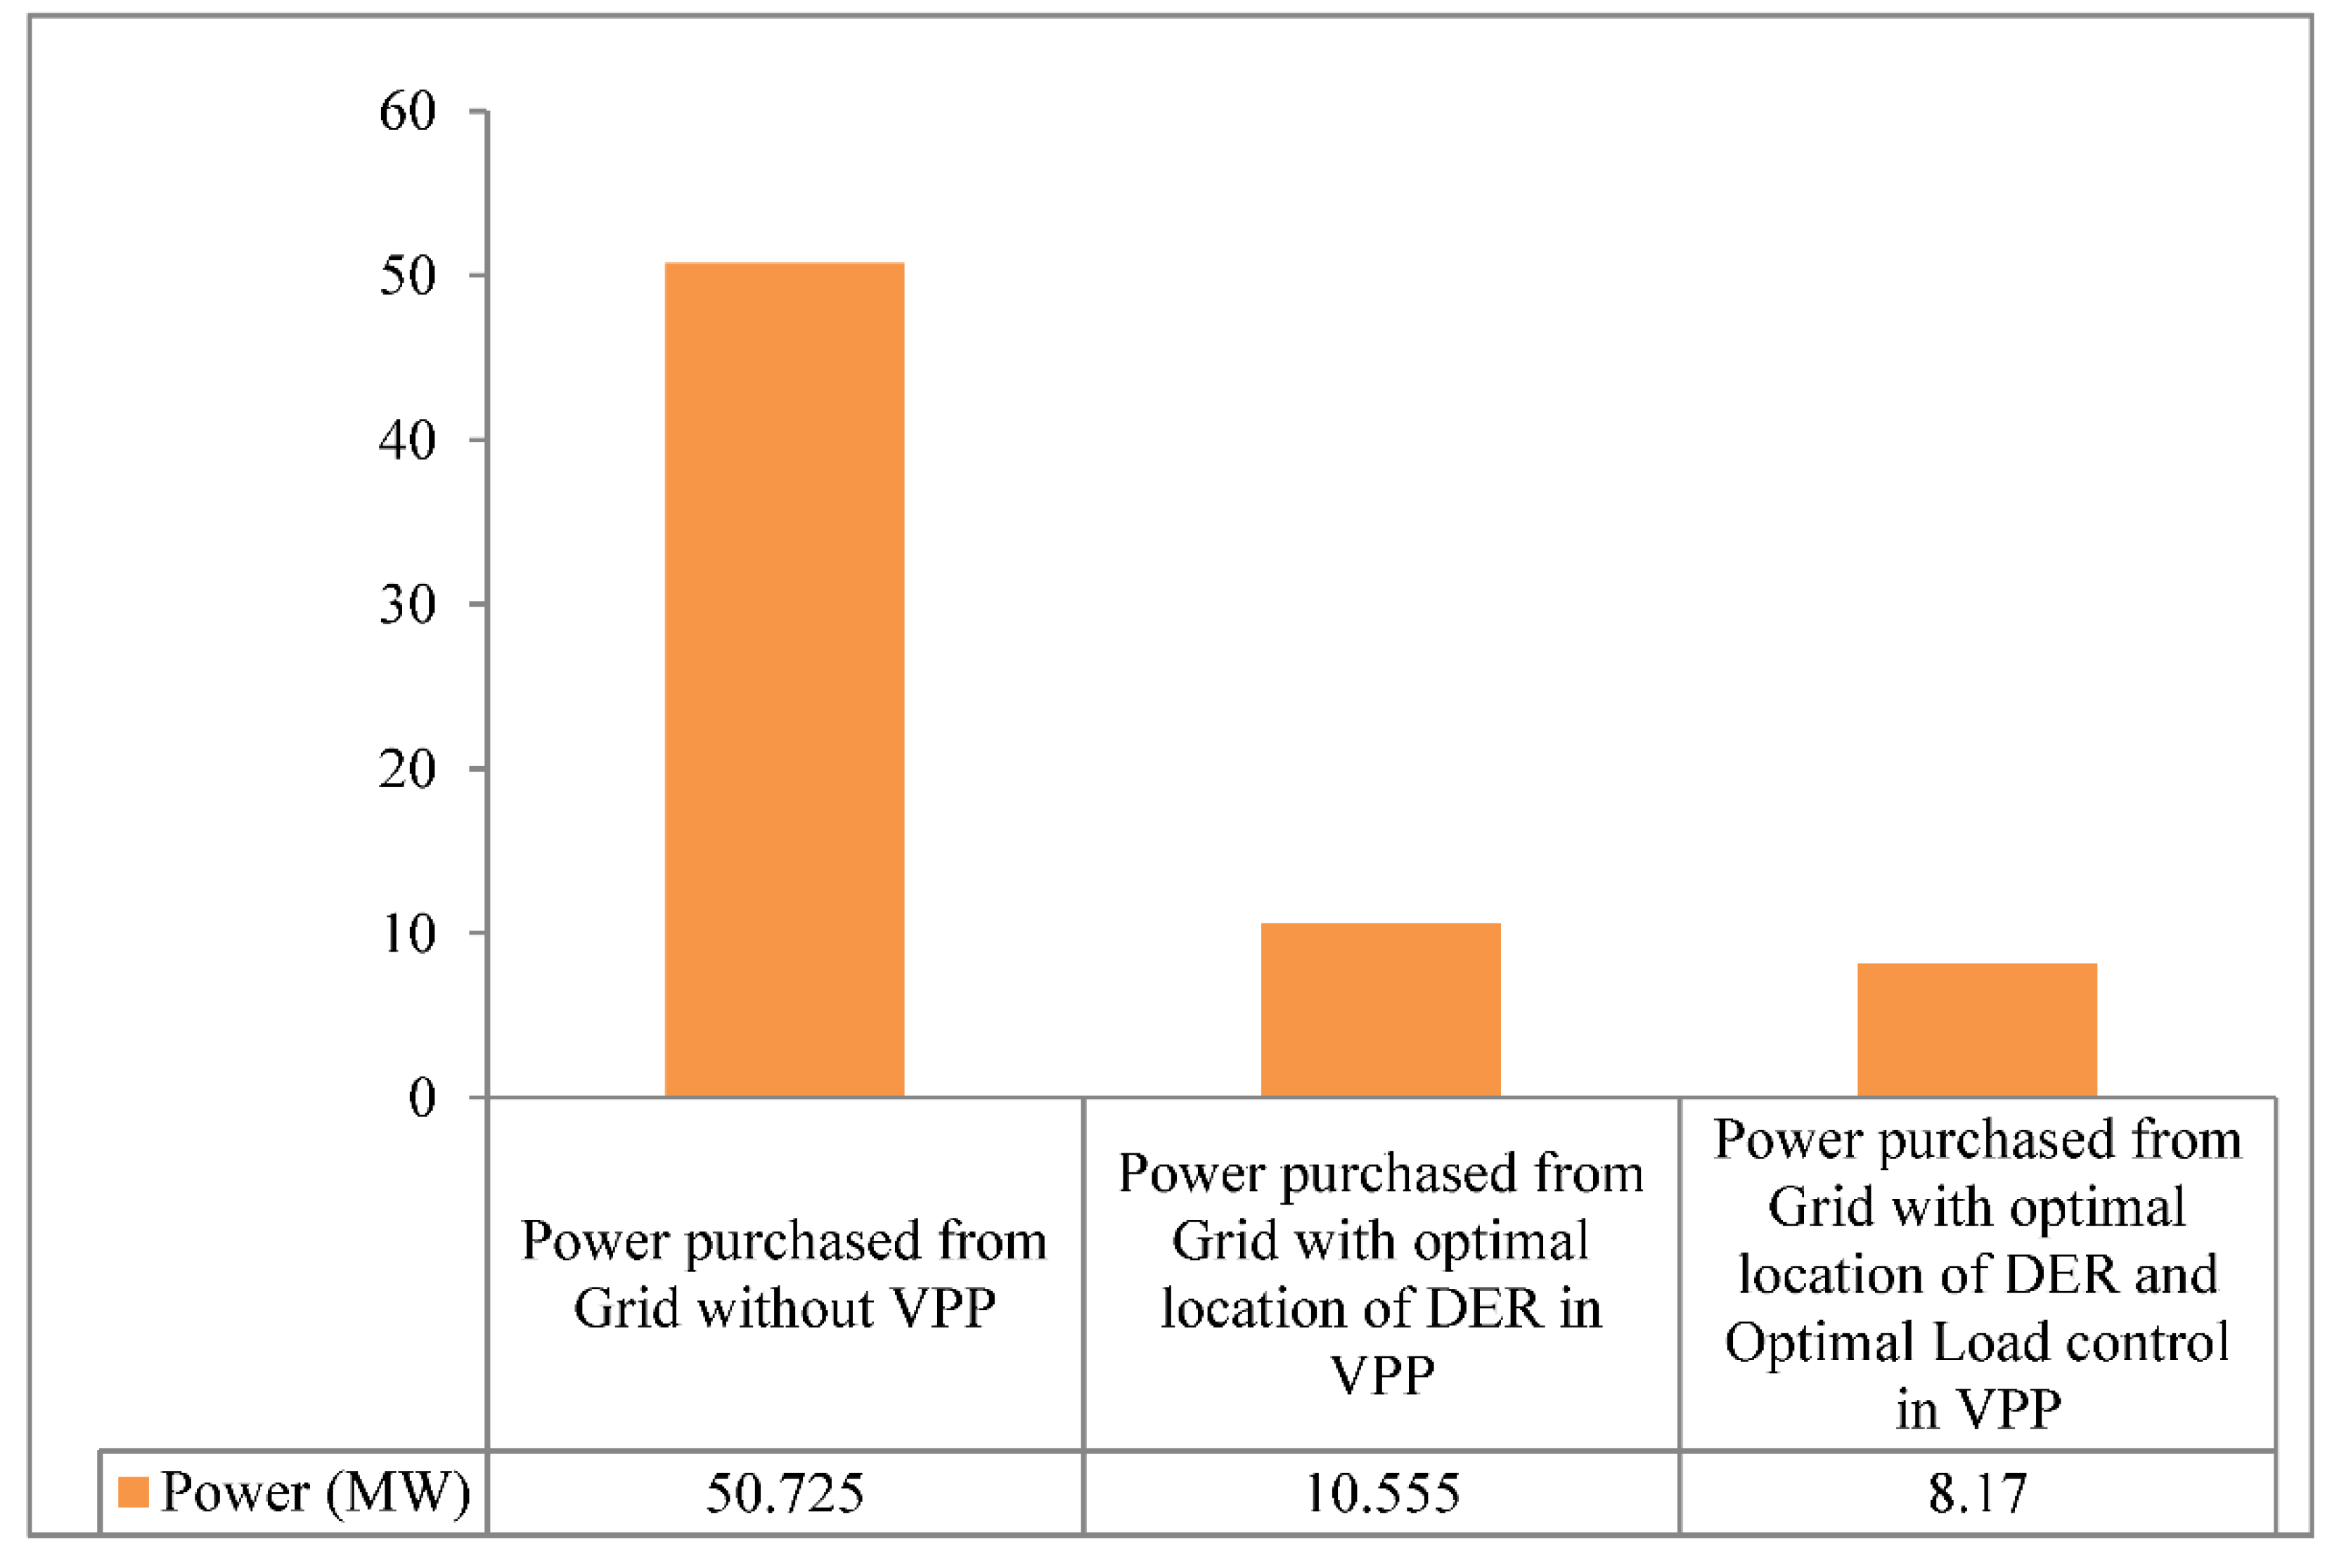
  • Optimal selection and placement of DER: In this process, the DER is optimally selected and allocated to the distribution side for reducing the amount of energy purchased from the grid.
  • Optimal control of load: Variable load can be identified and optimally controlled based on the power availability of the DER at any given time. Power losses may be reduced by periodically controlling the load.
  • Optimal Usage of Energy storage element: The storage system may be optimally used in the proposed VPP. Batteries are charged during off-peak load conditions and discharged during peak load conditions. In this case all type of renewable energy sources can participate in the energy trading market.

3.4. Consideration

The purchasing energy from the grid is calculated for 24 h, and the load demand may be varied at any hour of the day. Power losses may be considered based on the transmission and distribution network.
PGrid = ∑24 h=1 PLoad(h) + PLosses
The DER can be considered as the wind turbine and the solar PV module. The total power of the DER consists of the power generation from the wind and the power generation from solar panels.
PDER = PWind + PSolar
PWind = ∑24 h=1 PWind (h)
PSolar = ∑24 h=1 PSolar (h)
where,
  • PGrid → purchasing power from grid for 24 h in MW.
  • PLoad → power requirement of load for 24 h in MW.
  • PLosses → power losses for 24 h in MW.
  • PWind → generating power from wind in MW.
  • PSolar → generating power from solar PV system in MW.
  • PESS → charging/discharging power from energy storage system in MW.
The total load demand can be calculated from various loads such as the commercial load, domestic load, and industrial load. The energy storage system may be considered as charging and discharging the power based on the load demand and the power availability in the DER.
PESS = PDER − PLoad

3.5. Assumptions

  • Real power was considered for the modeling and analyzing of the proposed VPP, and reactive power consumption, power factor, and voltage stability are not considered.
  • Electrical energy was measured in watts per hour.
  • Loads are classified into fixed and controllable loads. In this paper, the controllable load can be identified and optimally controlled.
  • Transmission and distribution losses are neglected for analyzing purposes.
  • The performance of the DER, power consumptions in the load, and all the modeling and calculations are performed using a 24 h time period.

4. Modeling of VPP Components

In this section, the power generation of various DERs and the power demand of the load have observed and modeled for 24 h, and modeling results are analyzed using the output waveform. The power generation of wind and solar PV are considered to model the VPP.

4.1. Modeling of VPP

Modeling of the virtual power plant consists of modeling a wind turbine, modeling a solar PV system, modeling an energy storage system, and modeling the load and the controlling algorithm. In the VPP model, the control algorithm may be used for balancing the load requirement with the power produced from the renewable energy sources, improving the efficiency of the system.

4.2. Modeling of the Wind Turbine

In the wind turbine, the wind energy of an area can be converted into electrical energy. The energy of wind can be expressed as,
Ewind = 1/2 m air v2
The power generated by a wind turbine is dependent upon the volume of air that passes over a particular area, and it can be measured as,
Pwind = 1/2 ρairA v3
where,
  • ρ air → density of air in an area
  • v → speed of wind (Km/h)
  • m → height of wind turbine
  • A → area of wind turbine
Air density is directly proportional to the time and altitude of an area, and it is based on the pressure and temperature. Under general conditions, 1.255 Kg/m3 is the typical air density from ground level, and it is mostly used for the height of the turbine. Figure 2 shows the power generation of a wind turbine for 24 h, and Table 1 shows the characteristics of the wind turbine.

4.3. Modeling of Solar PV

A solar PV system is used to converts solar energy into electrical energy. The mathematical model of a solar PV system is shown in equation 8. The power generated from a solar cell can be globally expressed.
Psolar = A * η * H * PR
where,
  • Psolar → power from solar PV system (W)
  • A → area of the solar panel (m2)
  • η → efficiency of the solar panel (%)
  • H → solar radiation observed by the panel
  • PR → co-efficient losses of the solar PV system (from 0.5 to 0.9)
The output current of the solar PV system is dependent upon the photon current, and it can be determined by solar isolation. The solar panel output is measured by irradiance and temperature. Figure 2b shows the power generation of a solar PV system for 24 h, and Table 2 shows the characteristics of the solar panel.

4.4. Modeling of Energy Storage System

An electrical energy storage system consists of an electrochemical cell that converts chemical energy into electrical energy. In a modeling of energy element system, the charging and discharging of power depends on the power demand of the load. The battery is charged when the power demand is met by the power available from the DER, and the battery is discharged when the power demand is unable to meet the power available from the DER.
PESS,charging = PDER − PLoad
PESS,discharging = PLoad − PDER

4.5. Modeling of Load

The VPP was modeled using the IEEE-9 bus system in Matlab/PSCAD, as shown in Figure 3, and the load flow analysis is provided in Table 2. In the modeling of the load, bus 1 is connected to the utility grid and buses 2 to 8 are connected to a separate load system. The IEEE-9 bus system has 8 loads, and it is purchasing 50.725 MW of energy from the utility grid. Figure 4 shows the purchased power from the grid of each load per a day without the use of a VPP. Load number 5 has a maximum consumption of 11.57 MW of power per day, and load number 1 has a minimum consumption of 1.82 MW of power per day. In the modeled load system, an average of 6.3 MW of power was consumed per day. The power consumption of each bus system was modeled, and the characteristics are shown in Figure 4.

5. Local Search Algorithm

The local search algorithm is a searching algorithm which is used to find the suitable DER for the load. In the proposed method, the LSO algorithm is used to select and find the location of the DER based on the load requirement. The selection and location of the DER is based on the past history of the wind and solar power plant. The present requirement has been forecasted based on the past history. The LSO is step-by-step procedure, and it provides the best solution for maximizing and minimizing the concept in a virtual power plant. A genetic algorithm is used in the LSO for finding the optimization solution in the proposed VPP. The LSO applied in the VPP is used to minimize the purchasing energy from the grid by optimally selecting and locating the DER, optimally controlling the load, and optimally using the energy storage system. The step-by-step procedure for the local search optimization algorithm flow chart is shown in Figure 4. Purchasing power from utility grid for IEEE 9 bus in 24 h as shown in Figure 5. Load demand of IEEE bus number 2, 3, 4, 5, 6, 7 and 8 are represented in Figure 6.

5.1. Optimal Selection and Location of DER

In this process, based on the minimum load requirement of the DER, power may be selected and placed on the distribution side. The wind and solar power considered in the DER and the location of wind and solar power can be found by using the optimization techniques. DER selection is based on the load demand at the time of distribution. Initially, the process starts at any hour. Calculating the power demand of each load is based in terms of watts per hour, and calculating the power availability of the DER is based on the generated power from the wind turbine and the solar PV system.
P D e m a n d = h = 1 l = 1 h = 24 l = 8 P ( l , h ) [ P ( 1 , 1 )   P ( 1 , 2 )   * * * *   P ( 1 , 24 ) P ( 2 , 1 )   P ( 2 , 2 )   * * * *   P ( 2 , 24 ) P ( 3 , 1 )   P ( 3 , 2 )   * * * *   P ( 3 , 24 ) * * * * * * * * * * * * * * * * * * * * * * * * * * * * * * * P ( 7 , 1 )   P ( 7 , 2 )   * * * *   P ( 7 , 24 ) P ( 8 , 1 )   P ( 8 , 2 )   * * * *   P ( 8 , 24 ) ]
PDER = PWind + PSolar
PWind = ∑24h=1 PWind (h)
PSolar = ∑24h=1 PSolar (h)
In the LSO, Equation (11) regarding the power demand in the load is compared with Equation (15) regarding the power availability of the DER at every hour. Distribution Energy resource power is considered as the summation of solar and wind power in Equation (12).Power generating from wind and solar for 24 h are modeled in Equations (13) and (14) respectively.
PDemand = = PDER
If the condition of Equation (16) was satisfied, the desired the outcome is that the DER generated more power compare to the load demand. Next, start the process to find the location of the DER, and individual load can be identified in Equation (14); it is compared with the generated power from the wind turbine and the solar PV module at every hour in Equation (17).
Pload = ∑24h=1 Pload(h)
P load =   = P Wind & P load =   = P Solar }

5.2. Optimal Control of Load

Load scheduling is one of the essential concepts in the energy management system. In proposed system, the load scheduling concept is applied to the VPP based on the availability of power in the DER and the unbalance condition of the load. In this process, the maximum load at every hour can be identified by the high power demand, which is not met by the DER power. The LSO is updated for finding the maximum load at every hour and is completed by comparing itself, as shown in Equation (18).
L Control = L Max & L Max = ( L 1 L 2 L 3 L 4 L 5 L 6 L 7 L 8 ) }
The LSO algorithm is used to optimize the load control based on the maximum power consumption and the unbalanced load at every hour.

5.3. Optimal Usage of The Energy Storage System

The energy storage system can be operated in two mode of operations: the charging system and discharging system. In the charging system, the DER power of wind and solar power can be compared with the individual load and the identified charging power of the energy storage system. The charging power of the energy storage system is described in Equation (19). In the discharging system in Equation (20), the power demand of the load is maximized, and the power generated by the DER is unable to meet this demand. The discharging power of the energy storage system can be optimized in order to meet the power demand of the load. The minimum and suitable power consumption load may be optimized and connected with the energy storage system.
PESS,charging, = [∑24h=1 PSolar (h) + ∑24h=1 PWind (h)] − ∑24h=1 Pload (h)
PESS,discharging, = ∑24h=1 Pload(h) − [∑24h=1 PSolar (h) + ∑24h=1 PWind (h)]

6. Results and Discussion

The optimal location and distribution of the DER-wind and DER-solar power to the load system is shown in Figure 7. The proposed GA-based local search optimization algorithm may be used to find the optimal location for DER distribution for 24 h. Under optimal distribution, the DER was connected with the load based on the time (hour) per analysis. In proposed VPP model, there is no load connected with bus1, and other seven buses from 2 to 9 were connected with the load. The DER was optimally distributed and connected with the buses, as per the LSO algorithm. DER-wind may be optimally selected and connected with bus number 5 for maximum power consumption and partially connected with bus numbers 2, 3, 4, 6, 7, 8, and 9.
DER-wind may generate 30.275 MW of power per day, which can be optimally distributed to the load. Bus number 5 is optimized and connected with the wind turbine, and it consumes the maximum power of 9.016 MW per day. The minimum power of 0.85 MW was generated from wind to bus number 2. DER solar produces 10.42 MW of power per day, and it is optimized by the LSO algorithm. The optimized solar PV system was connected to bus number 4, and it gives 1.98 MW of maximum power to the same bus system and a minimum power of 0.45 MW, which is sent to bus number 6. In a 24 h analysis of the IEEE-9 bus system, the wind power was distributed to the buses 115 times, the solar power system was connected with the buses 36 times, and grid power was only distributed to buses after optimization of the DER location 41 times. Figure 8 shows the load demand of the buses for 24 h, the optimal distribution of DER wind, the optimal distribution of DER solar, and power purchased from the grid in buses 2–9. In this analysis, the power demand of every bus was calculated and modeled, and the wind turbine and solar PV system were optimally connected with the buses to reduce purchasing energy from the grid. Table 3 shows that the wind turbine and solar system were optimally distributed to the buses, and it shows that the allocated power from wind and solar energy reduced the power purchased from the grid for each bus.
The described IEEE-9 bus system purchased 50.725 MW of power from the utility grid without the implementation of the VPP. In proposed design, DER-wind, producing the power of 30.1 MW, and DER-solar, generated 11.5 MW of power for 24 h after optimization of the VPP, and only 10.55 MW of power was purchased from the grid. In comparison with the conventional method of purchased power, which was 40.7 MW, the amount of power purchased from the grid was significantly reduced in regards to the IEEE-9 bus system. Optimal load control in IEEE-9bus system for 24 h as list out in Table 4. In the optimal load control scheme, the unbalanced and maximum power demand of the load was identified using the searching algorithm, and it is optimally reduced based on the time analysis. The power demand of every bus was observed, and this method compares with others for finding the maximum load per hour. A time-hour calculation was used to identify the maximum load, which can be controlled by the VPP for every hour. In this way, 2.385 MW of power was reduced from the power demand of the load, and only 8.17 MW of power was purchased from grid. The described optimization methods of DER location and load control are combined together and applied to the proposed VPP. The proposed VPP with the 9-bus system only purchased 10.55 MW of power from grid by applying the optimal location of the DER alone and 2.385 MW of power was reduced from the demand by optimally controlling the load. The combination of the above two controlling optimizations reduced the amount of purchased power by 8.17 MW from the utility grid. Figure 9 shows the purchased power of the grid with and without the optimization techniques.

7. Conclusions

This research is mainly focused on distributing the electrical energy in effective ways through the optimal contribution of DER by using the scheduling and coordination capabilities of the VPP. An RES-based virtual power plant is simulated, and its daily energy cost is computed in MATLAB PSCAD. The proposed VPP is an energy management system distribution network, and the issues of imbalance are solved by the optimal placement of DERs. The proposed VPP is modeled using solar PV, wind turbines, an energy storage system, and controllable loads, and the test results are verified. The virtual power plant model is implemented in the IEEE-9 bus test system, and the power demand of each load is analyzed. The location and placement of the DER-wind and DER-solar devices is optimized using a local search optimization algorithm. In the test feeder, the peak load is identified, and it is optimized using the LSO algorithm. The local search optimization algorithm-based VPP is used to improve the voltage profile, power flow direction, and utilization profit in order to reduce the purchasing energy from the utility grid. In the proposed method, 81% of the purchased power was reduced from the grid by the optimization of the DER location and purchased power of 86% was reduced from grid by controlling the loads.

Author Contributions

Conceptualization, T.K. and K.L.; methodology, T.K.; software, T.K.; validation, T.K. and K.L.; formal analysis, T.K.; investigation, T.K.; resources, T.K.; data curation, T.K.; writing—original draft preparation, T.K.; writing—review and editing, T.K.; visualization, T.K.; supervision, K.L.; project administration, K.L. All authors have read and agreed to the published version of the manuscript.

Funding

This research received no external funding.

Institutional Review Board Statement

Not applicable.

Informed Consent Statement

Informed consent was obtained from all subjects involved in the study.

Data Availability Statement

Not applicable.

Conflicts of Interest

The authors declare no conflict of interest.

References

  1. Jua, L.; Tana, Q.; Lub, Y.; Tana, Z.; Zhanga, Y.; Tana, Q. A CVaRrobust-based multi objective optimization model and three-stage solution algorithm for a virtual power plant considering uncertainties and carbon emission allowances. Electr. Power Energy Syst. 2019, 107, 628–643. [Google Scholar] [CrossRef]
  2. Xiao, J.; Kong, X.; Jin, Q.; You, H.; Cui, K.; Zhang, Y. Demand—response virtual power plant optimization scheduling method based on competitive bidding equilibrium. Energy Procedia 2018, 152, 1158–1163. [Google Scholar] [CrossRef]
  3. Othmana, M.M.; Hegazyb, Y.G.; Abdelaziza, A.Y. Electrical energy management in unbalanced distribution networks using virtual power plant concept. Electr. Power Syst. Res. 2017, 145, 157–165. [Google Scholar] [CrossRef]
  4. Gozel, T.; Hocaoglu, M.H. An analytical method for the sizing and siting of distributed generators in radial systems. Elect. Power Syst. Res. 2009, 6, 912–918. [Google Scholar] [CrossRef]
  5. Hung, D.Q.; Mithulananthan, N.; Bansal, R.C. Analytical expressions for DG allocation in primary distribution networks. IEEE Trans. Energy Convers. 2010, 3, 814–820. [Google Scholar] [CrossRef]
  6. Hung, D.Q.; Mithulananthan, N. Multiple distributed generators placement in primary distribution networks for loss reduction. IEEE Trans. Ind. Electron. 2013, 4, 1700–1708. [Google Scholar] [CrossRef]
  7. Jabr, R.A.; Pal, B.C. Ordinal optimization approach for locating and sizing of distributed generation. IET Gener. Transm. Distrib. 2009, 8, 713–723. [Google Scholar] [CrossRef]
  8. Atwa, Y.M.; El-Saadany, E.F.; Salama, M.M.A.; Seethapathy, R. Optimal renewable resources mix for distribution system energy loss minimization. IEEE Trans. Power Syst. 2010, 1, 360–370. [Google Scholar] [CrossRef]
  9. Atwa, Y.M.; El-Saadany, E.F. Probabilistic approach for optimal allocation of wind-based distributed generation in distribution systems. IET Renew. Power Gener. 2011, 1, 79–88. [Google Scholar] [CrossRef]
  10. Liua, Y.; Lia, M.; Liana, H.; Tanga, X.; Liua, C.; Jiangb, C. Optimal dispatch of virtual power plant using interval and deterministic combined optimization. Electr. Power Energy Syst. 2018, 102, 235–244. [Google Scholar] [CrossRef]
  11. Songyuan, Y.; Fang, F.; Liu, Y.; Liu, J. Uncertainties of virtual power plant: Problems and countermeasures. Appl. Energy 2019, 239, 454–470. [Google Scholar]
  12. Kasaei, M.J.; Gandomkar, M.; Nikoukar, J. Optimal operational scheduling of renewable energy sources using teaching-learning based optimization algorithm by virtual power plant. J. Energy Resour. Technol. 2017, 139, 062003. [Google Scholar] [CrossRef]
  13. Kim, S.; Kwon, W.; Kim, H.; Jung, K.; Kim, G.; Shim, T.; Lee, D. Ofer curve generation for the energy storage system as a member of the virtual power plant in the day-ahead market. J. Electr. Eng. Technol. 2019, 14, 2277–2287. [Google Scholar] [CrossRef]
  14. Kasaei, M.J.; Gandomkar, M.; Nikoukar, J. Optimal management of renewable energy sources by virtual power plant. Renew. Energy 2017, 114, 1180–1188. [Google Scholar] [CrossRef]
  15. Zhou, B.; Zhang, K.; Chan, K.W.; Li, C.; Xi, L.; Siqi, B.; Gao, X. Optimal coordination of electric vehicles for virtual power plants with dynamic communication spectrum allocation. IEEE Trans. Ind. Inf. 2020, 17, 450–462. [Google Scholar] [CrossRef]
  16. Gough, R.; Dickerson, C.; Rowley, P.; Walsh, C. Vehicle-to-grid feasibility: A techno-economic analysis of EV-based energy storage. Appl. Energy 2017, 192, 12–23. [Google Scholar] [CrossRef]
  17. Shabanzadeh, M.; Haghifam, M. A medium-term coalition-forming model of heterogeneous DERs for a commercial virtual power plant. Appl. Energy 2016, 169, 663–681. [Google Scholar] [CrossRef]
  18. Dabbagh, S.R.; Sheikh-el-eslami, M.K. Risk-based proft allocation to DERs integrated with a virtual power plant using cooperative Game theory. Electr. Power Syst. Res. 2014, 121, 368–378. [Google Scholar] [CrossRef]
  19. Hassanzadehfard, H.; Jalilian, A. Optimal sizing and siting of renewable energy resources in distribution systems considering time varying electrical/heating/cooling loads using PSO algorithm. Int. J. Green Energy 2018, 15, 113–128. [Google Scholar] [CrossRef]
  20. Faria, P.; Soares, T.; Vale, Z.; Morais, H. Distributed generation and demand response dispatch for a virtual power player energy and reserve provision. Renew. Energy 2014, 66, 686–695. [Google Scholar] [CrossRef]
  21. Perera, A.T.D.; Nik, V.M.; Mauree, D.; Scartezzini, J.L. Electrical hubs: An effective way to integrate non-dispatchable renewable energy sources with minimum impact to the grid. Appl. Energy 2017, 190, 232–248. [Google Scholar] [CrossRef]
  22. Setlhaolo, D.; Xia, X. Combined residential demand side management strategies with coordination and economic analysis. Int. J. Electr. Power Energy Syst. 2016, 79, 150–160. [Google Scholar] [CrossRef]
  23. Tahir, M.F.; Member, S.; Haoyong, I.C. Optimizing size of variable renewable energy sources by incorporating energy storage and demand response. IEEE Access 2019, 7, 103115–103126. [Google Scholar] [CrossRef]
  24. Shafekhani, M.; Badri, A.; Shafe-khah, M.; Catalão, J.P.S. Strategic bidding of virtual power plant in energy markets: A bi-level multi-objective approach. Int. J. Electr. Power Energy Syst. 2019, 113, 208–219. [Google Scholar] [CrossRef]
  25. Hooshmand, R.; Nosratabadi, S.M.; Gholipour, E. Abstract: The Virtual Power Plants containing Distributed Energy Resources Are Classifed into Two Main; Elsevier: Amsterdam, The Netherlands, 2018. [Google Scholar]
Figure 1. Structure of a virtual power plant.
Sustainability 14 11129 g001
Figure 2. (a) Generating power from wind turbine for 24 h; (b) generating power from solar PV for 24 h.
Sustainability 14 11129 g002
Figure 3. IEEE 9 bus test system using the virtual power plant.
Sustainability 14 11129 g003
Figure 4. Flow chart of the local search optimization algorithm.
Sustainability 14 11129 g004
Figure 5. Power purchasing from the grid in the IEEE-9 bus system.
Sustainability 14 11129 g005
Figure 6. Load curve for each load bus in the IEEE 9 bus test system.
Sustainability 14 11129 g006
Figure 7. Optimal distribution of DER-wind and DER-solar PV to the IEEE-9 bus system.
Sustainability 14 11129 g007
Figure 8. (a) Load demand, optimal distribution of DER-wind and DER-solar PV, and power purchased from the grid for bus 2 and bus 3. (b) Load demand, optimal distribution of DER-wind and DER-solar PV, and power purchased from grid for bus 4 and bus 5. (c) Load demand, optimal distribution of DER-wind and DER-solar PV, and power purchased from grid for bus 6 and bus 7. (d) Load demand, optimal distribution of DER-wind and DER-solar PV, and power purchased from grid for bus 8 and bus 9.
Sustainability 14 11129 g008aSustainability 14 11129 g008b
Figure 9. Power purchased from the grid, with and without optimization techniques.
Sustainability 14 11129 g009
Table 1. Characteristics of wind turbine.
Type Description1 Speed Generator, Water Cooled
Rated power1650 kW
Rated current1740 A
Max power1815 kW
Max current1914 A
No load current I0430 A
Number of poles6
Synchronous rotation speed1200 rpm
Rotation speed at rated power1214 rpm
Voltage3 × 600 V
Frequency F50 Hz
Table 2. Characteristics of the solar panel.
ParameterValue
Maximum power180 (W)
Open circuit voltage30 (V)
Maximum voltage23.7 (V)
Maximum current7.6 (A)
Temperature coefficient for voltage−104 mV/°C
Temperature coefficient for current+0.053%/°C
Number of cells and connections48 in series
Table 3. Optimal distribution of wind and solar power to the IEEE-9 bus system.
Bus No.Wind Power (MW)Solar Power (MW)Power Purchased from Grid (MW)Reduced Power (MW)
20.85650.540.4411.3965
32.281.3682.983.648
44.021.980.936
59.0160.911.619.926
63.04850.4550.7843.5035
76.872.4720.69.342
82.361.320.343.68
Table 4. Optimal load control in IEEE-9bus system.
Time (h)Controlled LoadPower Purchased from Grid (MW)Reduced Power (MW)
140.640.06
220.570.03
330.130.36
440.40.24
520.890.03
6*********
7*********
8*********
9*********
10*********
11*********
1220.2950.105
13*********
1480.020.08
1580.430.12
1660.850.35
1720.8350.165
1890.010.39
1920.680.12
2080.160.04
2120.140.06
2220.070.03
2320.560.06
2441.490.12
*** denotes the uncontrolled loads at the time of 6, 7, 8, 9, 10, 11 and 13 h.
Publisher’s Note: MDPI stays neutral with regard to jurisdictional claims in published maps and institutional affiliations.

