Article

The Digital Economy Empowers the Sustainable Development of China’s Agriculture-Related Industries

College of Economics and Management, Northeast Forestry University, Harbin 150040, China
*
Author to whom correspondence should be addressed.
Sustainability 2022, 14(17), 10967; https://doi.org/10.3390/su141710967
Submission received: 26 July 2022 / Revised: 19 August 2022 / Accepted: 31 August 2022 / Published: 2 September 2022
(This article belongs to the Special Issue Digital Marketing for Sustainable Development)

Abstract

:
Firstly, based on the data of China’s noncompetitive input–output tables from 2002 to 2017, this paper comprehensively grasps the integration trend of China’s agriculture-related industries and digital economy industries by constructing integration contribution and interaction indicators. Secondly, the correlation between the two industries is analyzed more intuitively with the help of the APL (Average Propagation Length) model. Finally, it analyzes the coordination of the digital economy industry and the transformation of the agriculture industry with the help of the grey correlation method. The results show that the digital economy industries contribute the most in absolute terms, compared to other industries, to the agro-processing industry and have the highest degree of integration and interaction with the agricultural product transportation and marketing industry. In terms of the breakdown of the digital economy industries, digital product manufacturing is weakly linked to agriculture-related industries, but the coordination among the transformation and upgrading of agriculture is gradually improving. Compared to digital product manufacturing, the digital technology application industry has a higher direct contribution to the agriculture-related industry. After 2012, the overall driving and pulling effect on the agriculture-related industry is basically the same, and the coordination with agricultural transformation and upgrading is optimal. The contribution of the digital factor-driven industry to agriculture-related industries experienced an explosive period after 2012, with the highest overall contribution and strongest industrial linkage between the two, while coordination with the transformation and upgrading of agriculture decreases. Therefore, in combination with the No. 1 document of the Central Government in 2022, which specifically calls for the implementation of the “digital business to promote agriculture” project and the promotion of e-commerce in the countryside, this paper puts forward suggestions to give full play to the role of digital technology in the sustainable development of agriculture-related industries.

1. Introduction

In recent years, with the rapid development of a new generation of information and communication technologies, the wave of the digital economy has swept through all corners of society. The digital economy plays an important role in the transformation and sustainable development of agriculture-related industries. International scholars have studied the transformation power of digitalization in agricultural production systems, value chains and food systems [1,2,3]. The Chinese government has always attached importance to the digital development of agriculture-related industries. The Outline of the Fourteenth Five-Year Plan of the National Economic and Social Development of the People’s Republic of China and Vision 2035 clearly states that the deep integration of digital economy industries and traditional industries should be realized, and the transformation and upgrading of data-enabled traditional industries and the collaborative transformation of the whole industrial chain should be promoted, and the development of smart agriculture should be accelerated. The No. 1 document of the Central Government in 2022 [4] specifically calls for the promotion of the integration of information technology with agricultural machinery and agronomy and the development of smart agriculture. Moreover, this document proposes, for the first time, the implementation of the “digital business to promote agriculture” project and the promotion of e-commerce in the countryside. This objective reflects the new phase that involves focusing on the task of enhancing the digitalization of the agricultural sector and using digital technology to bring about a new situation in industrial development. At present, China’s development is still in an important strategic opportunity period, and the promotion of the digital transformation of agriculture related industries is a strategic choice in line with the deep integration of one, two, and three industries in rural areas and is also a way through which to achieve the sustainable development of agriculture-related industries.
In the 1990s, Don Tapscott proposed the concept of the digital economy, which at that time revolved mainly around information and communication technology and individual industries with a high degree of digitization [5]. Subsequently, after nearly three decades of development, the connotation of the digital economy has been enriched, and the China Information and Communication Research Institute and G20 Summit have defined the digital economy. The digital economy industries in this paper focus on the industry with digital industrialization as the core content in the digital economy. It is an industry to realize the application of data and digital technology [6]. According to the China Internet Network Information Center, by the end of 2021, the number of Chinese Internet users reached 1.032 billion, and the Internet penetration rate reached 73.0%, ushering in an era of a booming digital economy. Before 2016, the hot topic among domestic scholars was informatization, and the term commonly used in government manuscripts was information economy. Considering the possible ambiguity between the concept of the information economy and that of the digital economy, commonly used in most developed countries, the concept of the digital economy gradually changed in 2016, so the related literature in the earlier period generally focused on agricultural informatization and studied the application and development of information technology in agriculture [7]. The application of information technology in Chinese agriculture can be traced back to the 1970s. This technology mainly assisted in quantitative processing, such as agricultural data accounting and standardized processing, such as information recording and classification. From the 1970s and 1980s to the present, new agricultural technologies, such as 3S technology, agricultural resource management technology, agricultural production management technology and multimedia have been gradually integrated into some areas in China [8]. In 2015, the State Council [9] proposed an action plan for “Internet Plus”, focusing on promoting the research and development of new-generation information technologies, such as the internet, big data, cloud computing and the Internet of Things. With the implementation of the “Internet +” action, the agricultural e-commerce service industry has entered into a period of rapid development, and the inclusive agricultural financial service platform has enriched and improved the new agricultural socialized service system [10,11]. According to Niu [12], a new generation of information technology will enable the further development of agriculture-related industries; agricultural production, circulation and consumption links can all be integrated by internet technology. In addition to the integration of all segments, the new generation of information technology based on the internet has also changed the traditional business model and industrial chain system of agriculture [13,14,15].
Foreign researchers have also carried out a series of studies on the digital economy and agriculture-related industries. Relevant international studies believed that the output of the digital economy is more environmentally friendly and can effectively reduce agricultural environmental emissions [16]; a 2021 report from the World Bank [17] concluded that digital agriculture revolutions will significantly reduce transaction costs and information asymmetries that confound agrifood systems; Torky et al. [18] pointed out the combination of the Internet of Things and the blockchain will allow farmers to add more control in supply-chains networks; Parker et al. [19] believed that e-commerce technology provided a convenient and online market environment and channels for agricultural product marketing services, and realized the effective connection between farmers and the market; Tian et al. [20] believed that digital technique exerts its regional economic growth effect through agricultural structure upgrading factors. In addition, Martens et al. [21] expressed their conviction that digital transformation will improve the sustainable performance of the agricultural sector while making it more resilient. In China, Liang [22] proposed a permeable integration development approach that relies on information technology to penetrate and diffuse into the agricultural field and then cause changes in agricultural production and management methods, with the typical business model being information agriculture. Moreover, Li et al. [23] revealed the inner mechanism of the Internet in promoting the integration of agricultural industries and pointed out that the current integration faces difficulties, such as a poor foundation and a high entry threshold. Liang et al. [24] analyzed the path of using digital technology to transform agriculture and comprehensively explained the impact of agricultural industry integration on the industrial structure. Only Ye Yun et al. [25] focused on the measurement of the level of integration between the information technology industry and rural primary, secondary and tertiary industries. This finding shows that there are still imperfections in the existing relevant studies. First, the existing input–output method equates imported products with domestic products, thus biasing the results, and there is still room for improvement in the measurement method. Second, there is a large difference between the connotation of the traditional IT industry and the digital economy industry, which can lead to confusion. Third, some research analyses use static data, and their results have limited referenceability. Fourth, there are few quantitative measurements of the integration and development of China’s agriculture-related industries and digital economy industries and their associated effects. In view of this, the current study measures the integration and development of China’s agriculture-related industries with digital economy industries based on China’s noncompetitive input–output tables from 2002 to 2017 and provides a more intuitive analysis of the before-and-after correlation between these industries by constructing an APL model in the form of graphs and charts. Finally, we propose suggestions for the transformation and upgrading of agriculture through the digital economy industry with digital technology as the core. According to the above research structure, this article can measure the integration degree of China’s agriculture-related industry and digital economy industry. On the one hand, it can grasp the digitization process of each link of the agricultural industry as a whole, and on the other hand, it can reveal the key problems faced by the digital transformation of the agricultural industry. In theory, this paper further complements the integration relationship between the digital economy industry and agricultural related industries. In terms of practical contribution, this paper mainly improves the measurement method of the input–output table and quantitatively measures the integration level between industries.

2. Materials and Methods

2.1. Definition of the Digital Economy Industries and Related Data

The main source of data in this paper is the input–output table of China in 2002, 2007, 2012 and 2017 prepared by the National Bureau of statistics [26]. Since the newly published “China input-output table 2018” is the first compilation work based on the input–output survey data from 2017 and combined with the economic census data, to avoid data duplication and ensure the consistency of data statistical caliber, the data selected in this paper are from the 2017 “China input–output table”. Since 2017, China’s industrial structure has remained stable as a whole, and the input–output survey data in 2017 are still of reference significance. At the same time, with reference to the statistical classification of the digital economy and its core industries (2021), the industrial sectors in the input–output table of each year and the sectors corresponding to the digital economy industries are extracted and merged into four categories of core industries in the digital economy (Table 1). In addition, because only part of the wholesale and retail industry and monetary and financial industry in the input–output table belong to the digital economy, this paper uses the “digital economy adjustment coefficient” method proposed by Xu and Zhang for reference and splits it based on the proportion of the operating income of Internet wholesale and retail in the operating income of wholesale and retail industry [27]. The split method of the monetary and financial industry is the same as above. In particular, some industrial sectors in the digital product service industry and digital factor-driven industry have little relevance to agriculture-related industries, so they are not extracted in this paper.
Further, according to the Department classification and interpretation of the input–output table of each year, the corresponding industrial departments that meet the standards of agriculture-related industries are merged into the preproduction service links, production links, processing and manufacturing links, and transportation and marketing service links of agriculture-related industries (Table 2). Among them, the transportation and marketing service links of agricultural industries are integrated and converted according to the method used by Geng [28].

2.2. Methodology

2.2.1. Preparation of Noncompetitive Input–Output Tables

Shen argues that the Leontief inverse matrix B = (I − A) − 1 obtained from the competitive input–output table ignores the case of imported products as intermediate inputs and exaggerates the direct and indirect consumption of domestic sectors by not distinguishing the intermediate flows of domestic products from those of foreign products [29]. Accordingly, the column sums of the Leontief inverse matrix of the competitive input–output table as the impacts of each sector are also exaggerated. Therefore, this paper adopts a “proportional split” approach, i.e., splitting the intermediate flows into domestic and imported flows according to the ratio of total output X i to total imports M i for each sector. The simplified table of noncompetitive inputs and outputs is shown in Table 3.
In the noncompetitive input–output table, the domestic product model:
j = 1 n x i j d + Y i d = X i i = 1 , 2 , 3 , n  
The direct consumption coefficient of domestic products is a i j d = x i j d / X j ,   j = 1 , 2 , 3 , n . Substitute into (1) to obtain:
j = 1 n a i j d X j + Y i d = X i i = 1 , 2 , 3 , n
Writing in matrix form as A d X + Y d = X , we can obtain:
X = I A d 1 Y d
A d in the formula is the direct consumption coefficient matrix of domestic products, ( I A d ) 1 is the complete demand matrix.

2.2.2. Interindustry Measurement Index Construction

Input–output tables can reflect the inputs of other sectors as intermediate goods in the production of a particular sector. This study draws on the method used by Peng and Wu to construct a measurement system for interindustry integration and selects two indicators to measure the degree of integration contribution and interaction [30,31]. The measurement formula is as follows:
(1)
Integration contribution
Direct contribution: the direct contribution of digital economy industries to agro-related industries ( A j ).
The direct contribution rate of the digital economy industry is the degree to which this industry is invested in the production of agriculture related industries. Among the agricultural products involved in a unit, m types of digital economy industries are used as intermediate inputs, which account for the direct proportion of the total input of n sectors of agriculture-related industries. The calculation formula is as follows:
A d = x i j d / X j   i = 1 ,   , m ; j = 1 , 2 , , n
Indirect contribution: indirect contribution of digital economy industries to agro-related industries ( B j ).
The direct contribution margin A j of digital economy industries to agriculture-related industries reflects the direct consumption of products of other industry sectors by one industry sector in the production process and does not examine other types of indirect consumption. Therefore, considering the impact of other types of indirect consumption, this work uses the complete consumption matrix B as a measure of the indirect contribution rate, calculated as follows:
B d = I A d 1 I  
(2)
Integration of interactivity: improved influence and inductance coefficients
The influence coefficient refers to the degree of influence of a department producing a unit of the final product on other departments. The higher the influence coefficient is, the greater the pulling effect of the department’s production on other departments. The inductance coefficient refers to the degree of demand pressure (induction) received by a department when all other departments increase their final product by one unit. The specific calculation formula is as follows:
P j = i = 1 n b i j / ( 1 n j = 1 n i = 1 n b i j )   i , j = 1 , 2 , , n  
Q i = j = 1 n b i j / ( 1 n j = 1 n i = 1 n b i j )   i , j = 1 , 2 , , n
  P j   is the influence coefficient, Q i is the inductance coefficient.
In this paper, referring to the research methods of Liu, using column-wise analysis, the complete allocated coefficient g i j obtained from the Ghosh model is used to replace the complete consumed coefficient b i j with ambiguous economic implications of the row-wise summation results [32]. The Leontief inverse matrix ( I A d ) 1 = B d of the noncompetitive input–output table is used to replace the Leontief inverse matrix B, with the same being true for the complete distribution coefficient matrix. Moreover, the traditional average weighting coefficient 1 / n is replaced with the value-added weight   λ i j   for each digital economy sector to make the results more accurate and objective. The specific calculation formula is as follows:
  P j = i = 1 n b i j d / ( 1 λ j j = 1 n i = 1 n b i j d )   i , j = 1 , 2 , , n  
  Q i = j = 1 n g i j d / ( 1 λ i j = 1 n i = 1 n g i j d )   i , j = 1 , 2 , , n
P j   is the influence coefficient, Q i is the inductance coefficient.

2.2.3. APL Model

The improved coefficient of influence and inductance models capture the degree of association between industries but do not reveal the steps through which this association is achieved. For this reason, this paper addresses this issue by introducing the APL model proposed by Dutch input–output scientist Erik Dietzenbacher in 2005. The APL model reflects the average rounds of the impact of a sector change on the total output of all sectors [33]. Depending on the influencing factors, this model is specifically divided into the forward APL coefficient and the backward APL coefficient, which represent the average economic distance of forward push and the average economic distance of backward pull, respectively; the APL values calculated from both perspectives are equal and can be collectively referred to as “APL”. The specific calculation formula is as follows:
The   forward   APL :   V i j = v i j = h i j d g i j d ,   i j h i j d g i j d 1 ,   i = j
g i j d is the element in the Ghosh inverse matrix G of the noncompetitive input–output table, h i j d is an element in H = G G I .
The   backward   APL :   U i j = u i j = h i j d l i j d ,   i j h i j d l i j d 1 ,   i = j  
l i j d is the element in the inverse Leontief moment L of the noncompetitive input–output table, h i j d is an element in H = H H I .

2.2.4. Grey Correlation Model

The grey correlation model is used mainly to analyze the degree of coordination of the relationships among variables in a system. The method requires a small sample size and has a high degree of applicability. The basic solution steps are as follows:
  • Step 1: Select the reference sequence Y = Y 1 , Y 2 , , Y t , Comparison sequence G i = G i 1 , G i 2 , , G i t , where t = 1,2, …, m; i = 1,2, …, n.
  • Step 2: The variable is dimensionlessized. In this paper, the initial value method is used, where the value of each variable is divided by the initial value to obtain the dimensionless processed reference sequence Y and comparison sequence G i .
  • Step 3: Solve the two pole maximum and minimum difference.
    Difference sequence: Δ i t = Y t G i t , M A X = M A X M A X Δ i t ; m i n = M I N M I N Δ i t .
  • Step 4: Calculate the correlation coefficient:
    ξ i t = m i n + ρ M A X Δ i t + ρ M A X   t = 1 , 2 , , m ; i = 1 , 2 , , n
    ρ   is the resolution coefficient, usually taken as 0.5.
  • Step 5: Calculate the correlation degree between each comparison sequence and the reference sequence:
    r i = 1 m t = 1 m ξ i t   t = 1 , 2 , , m ; i = 1 , 2 , , n  

3. Results and Discussion

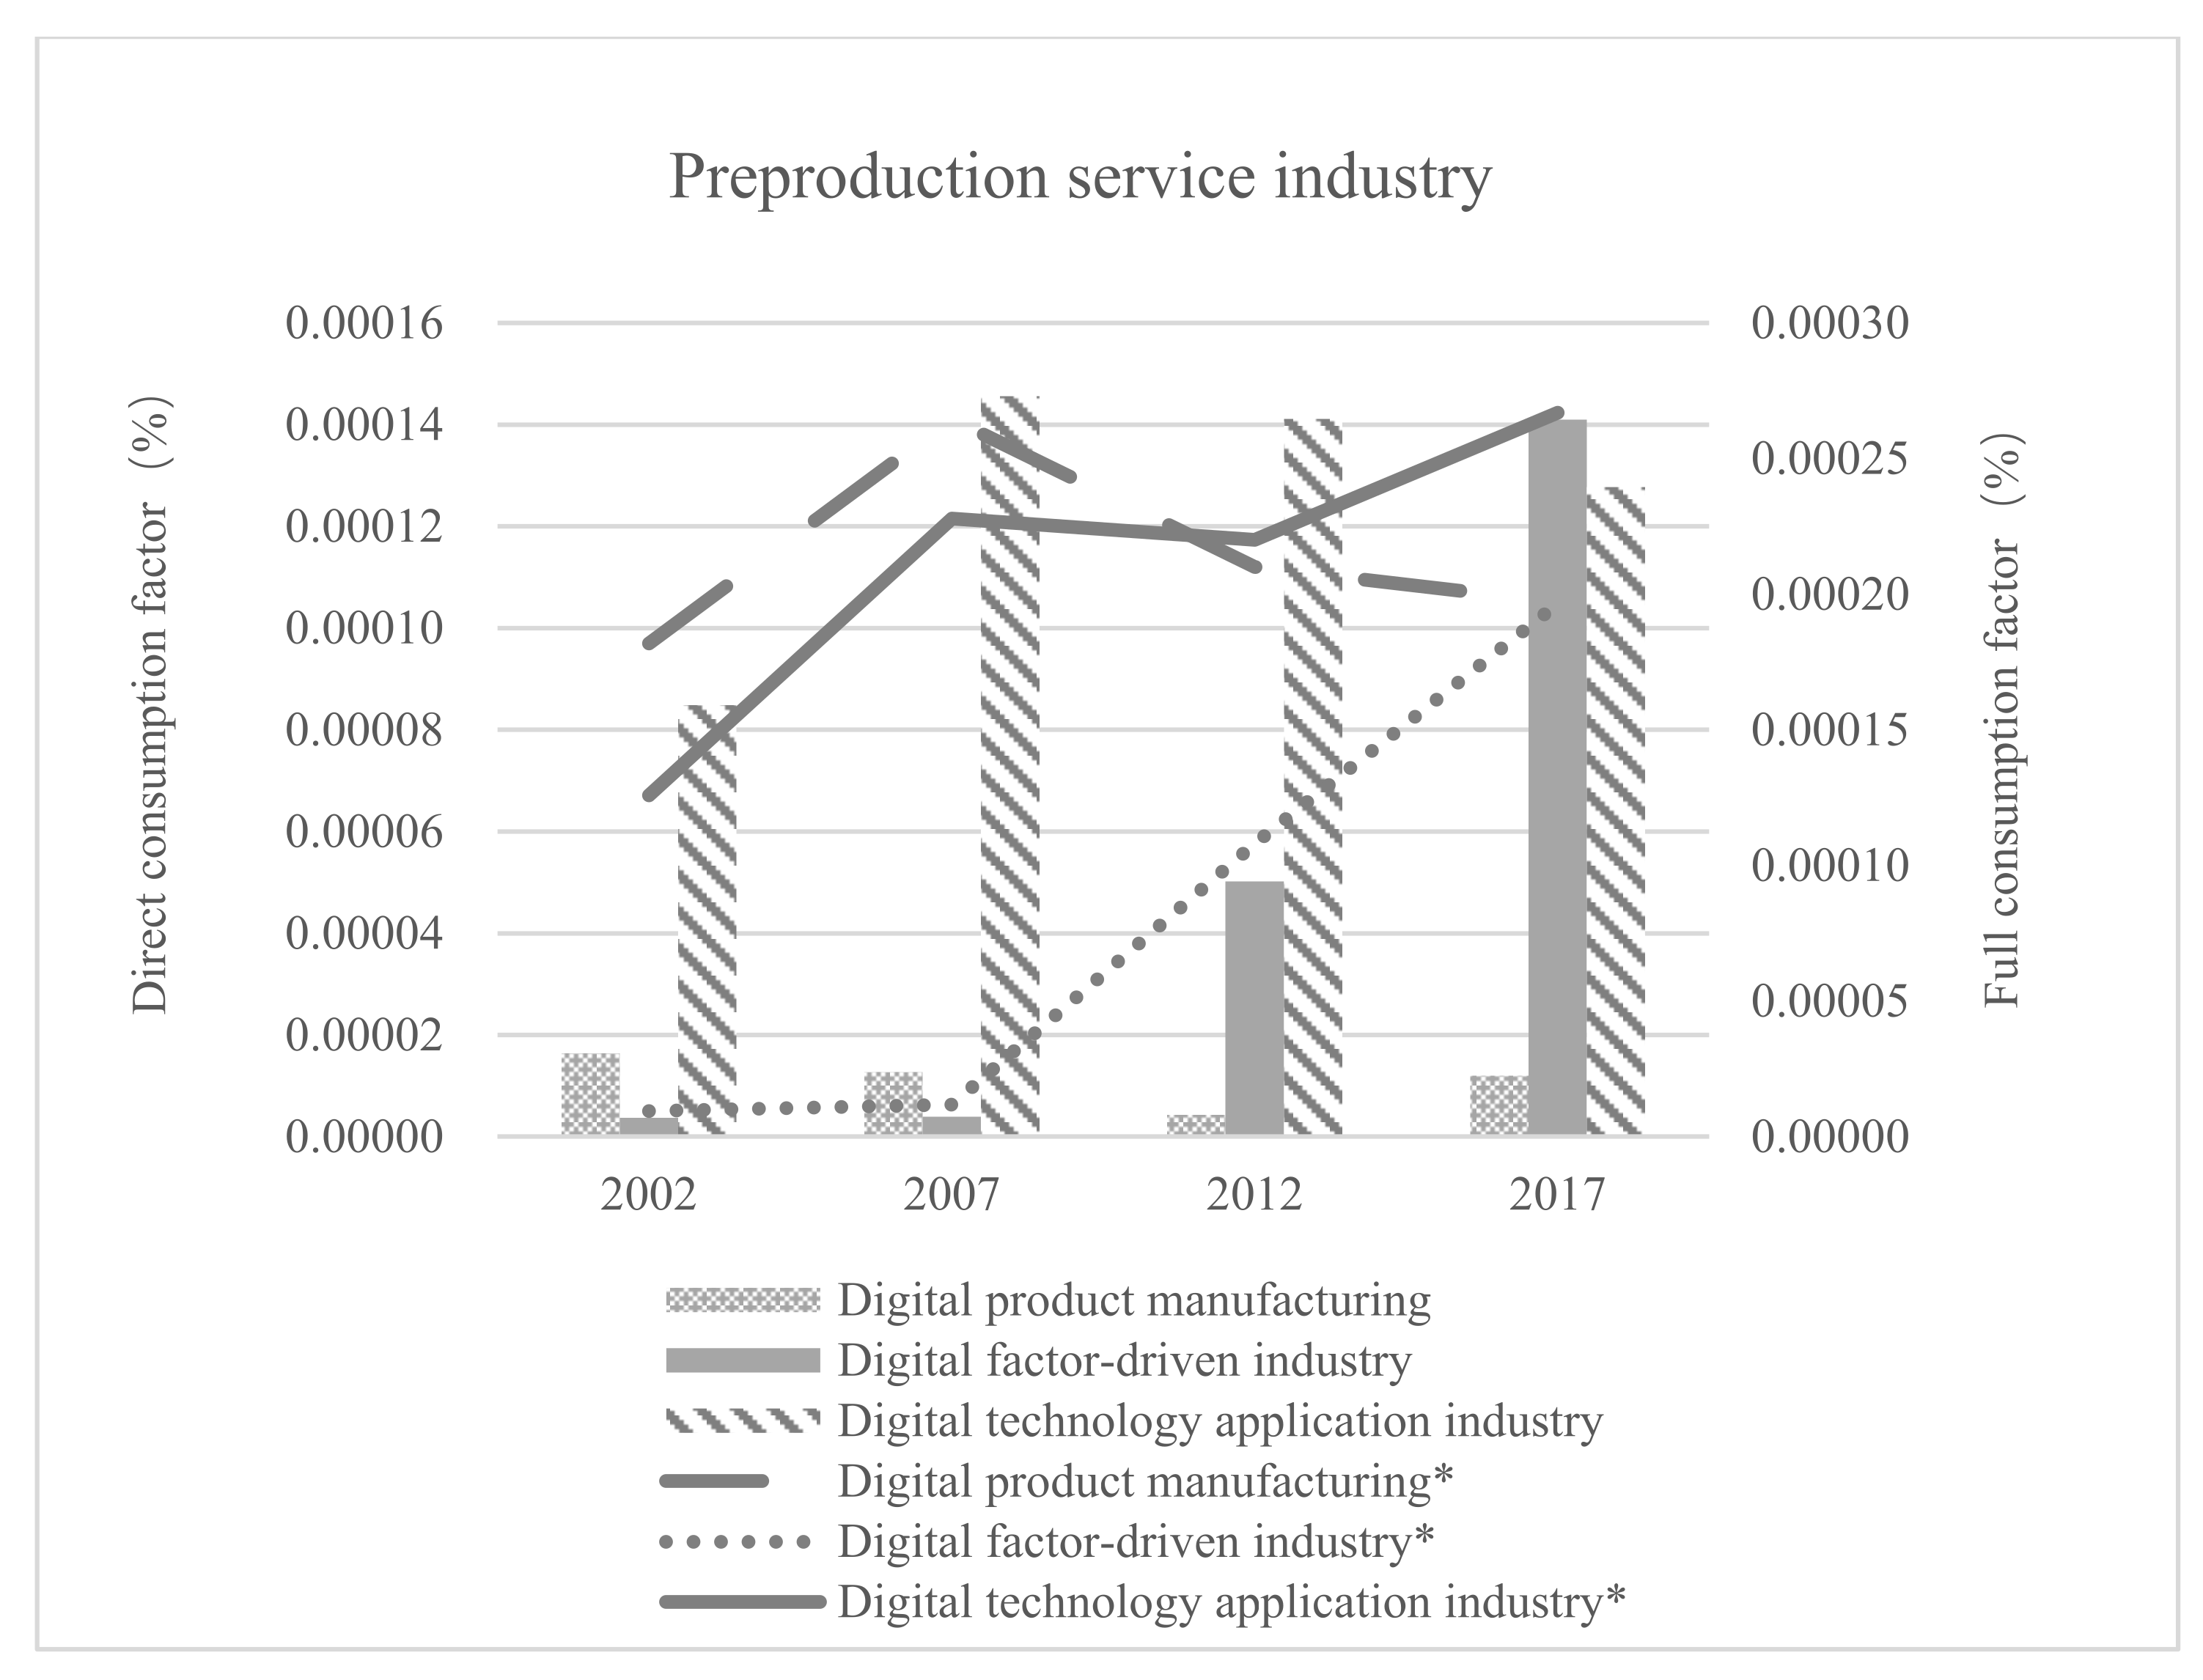
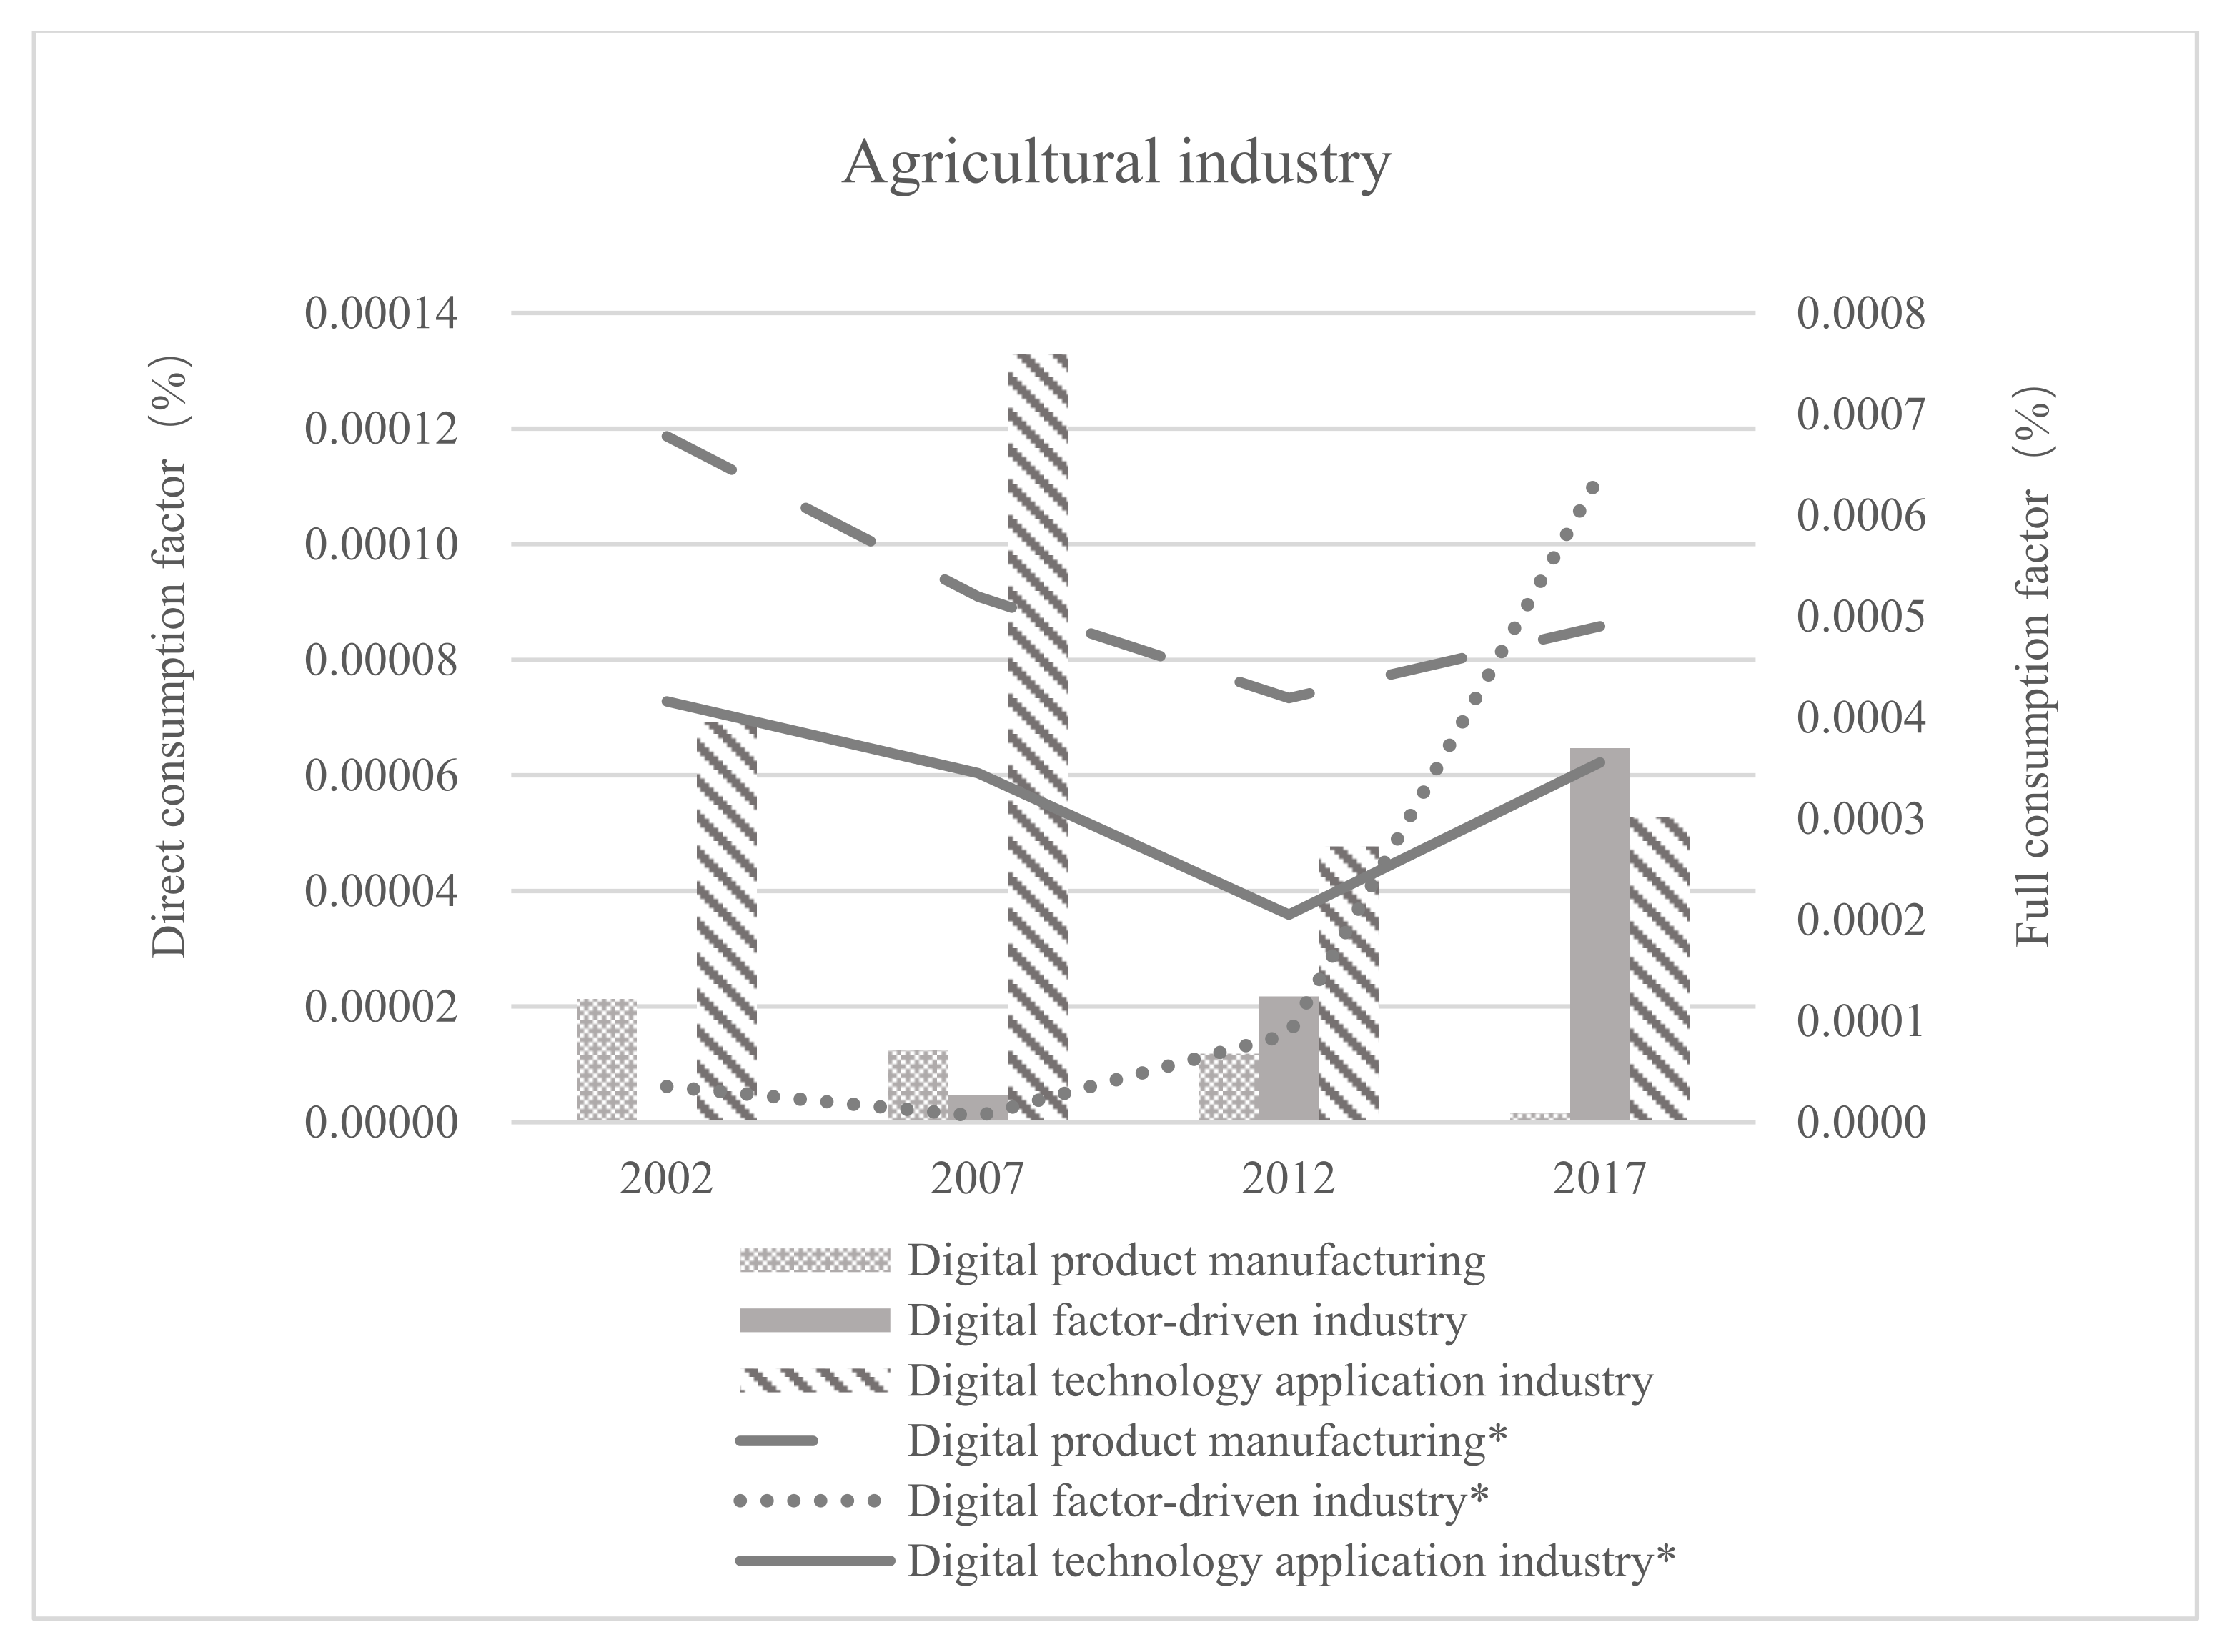
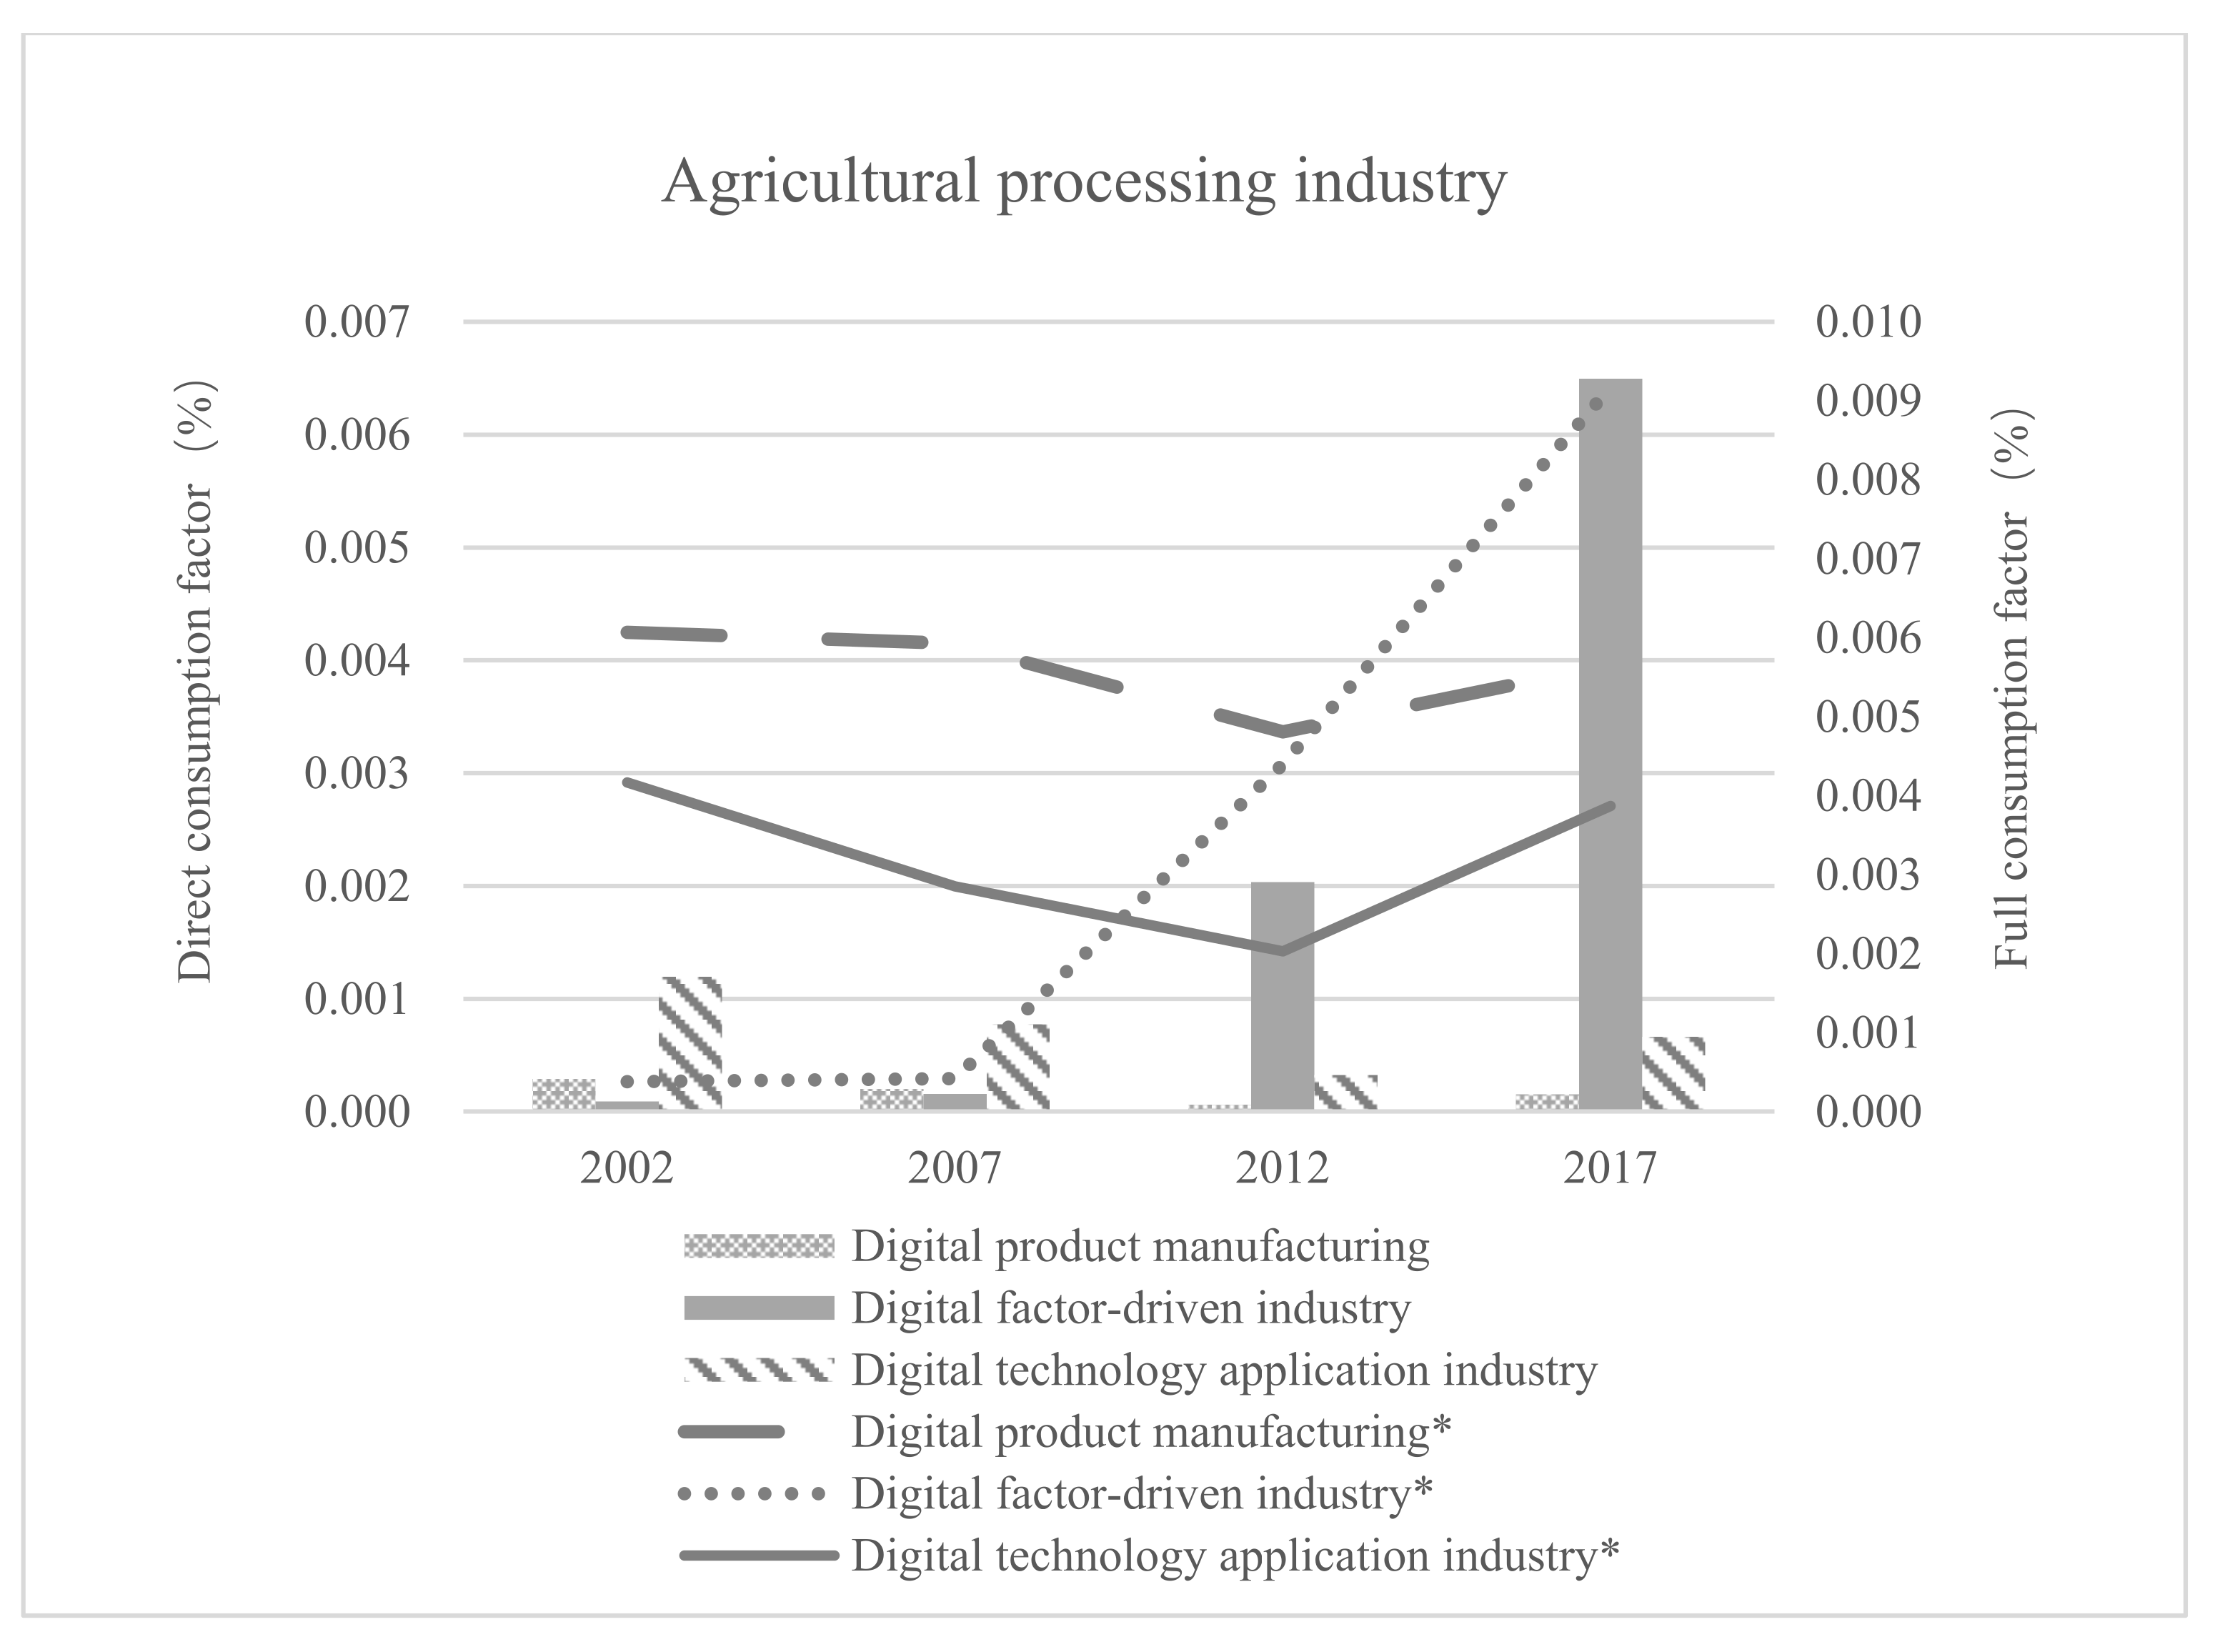
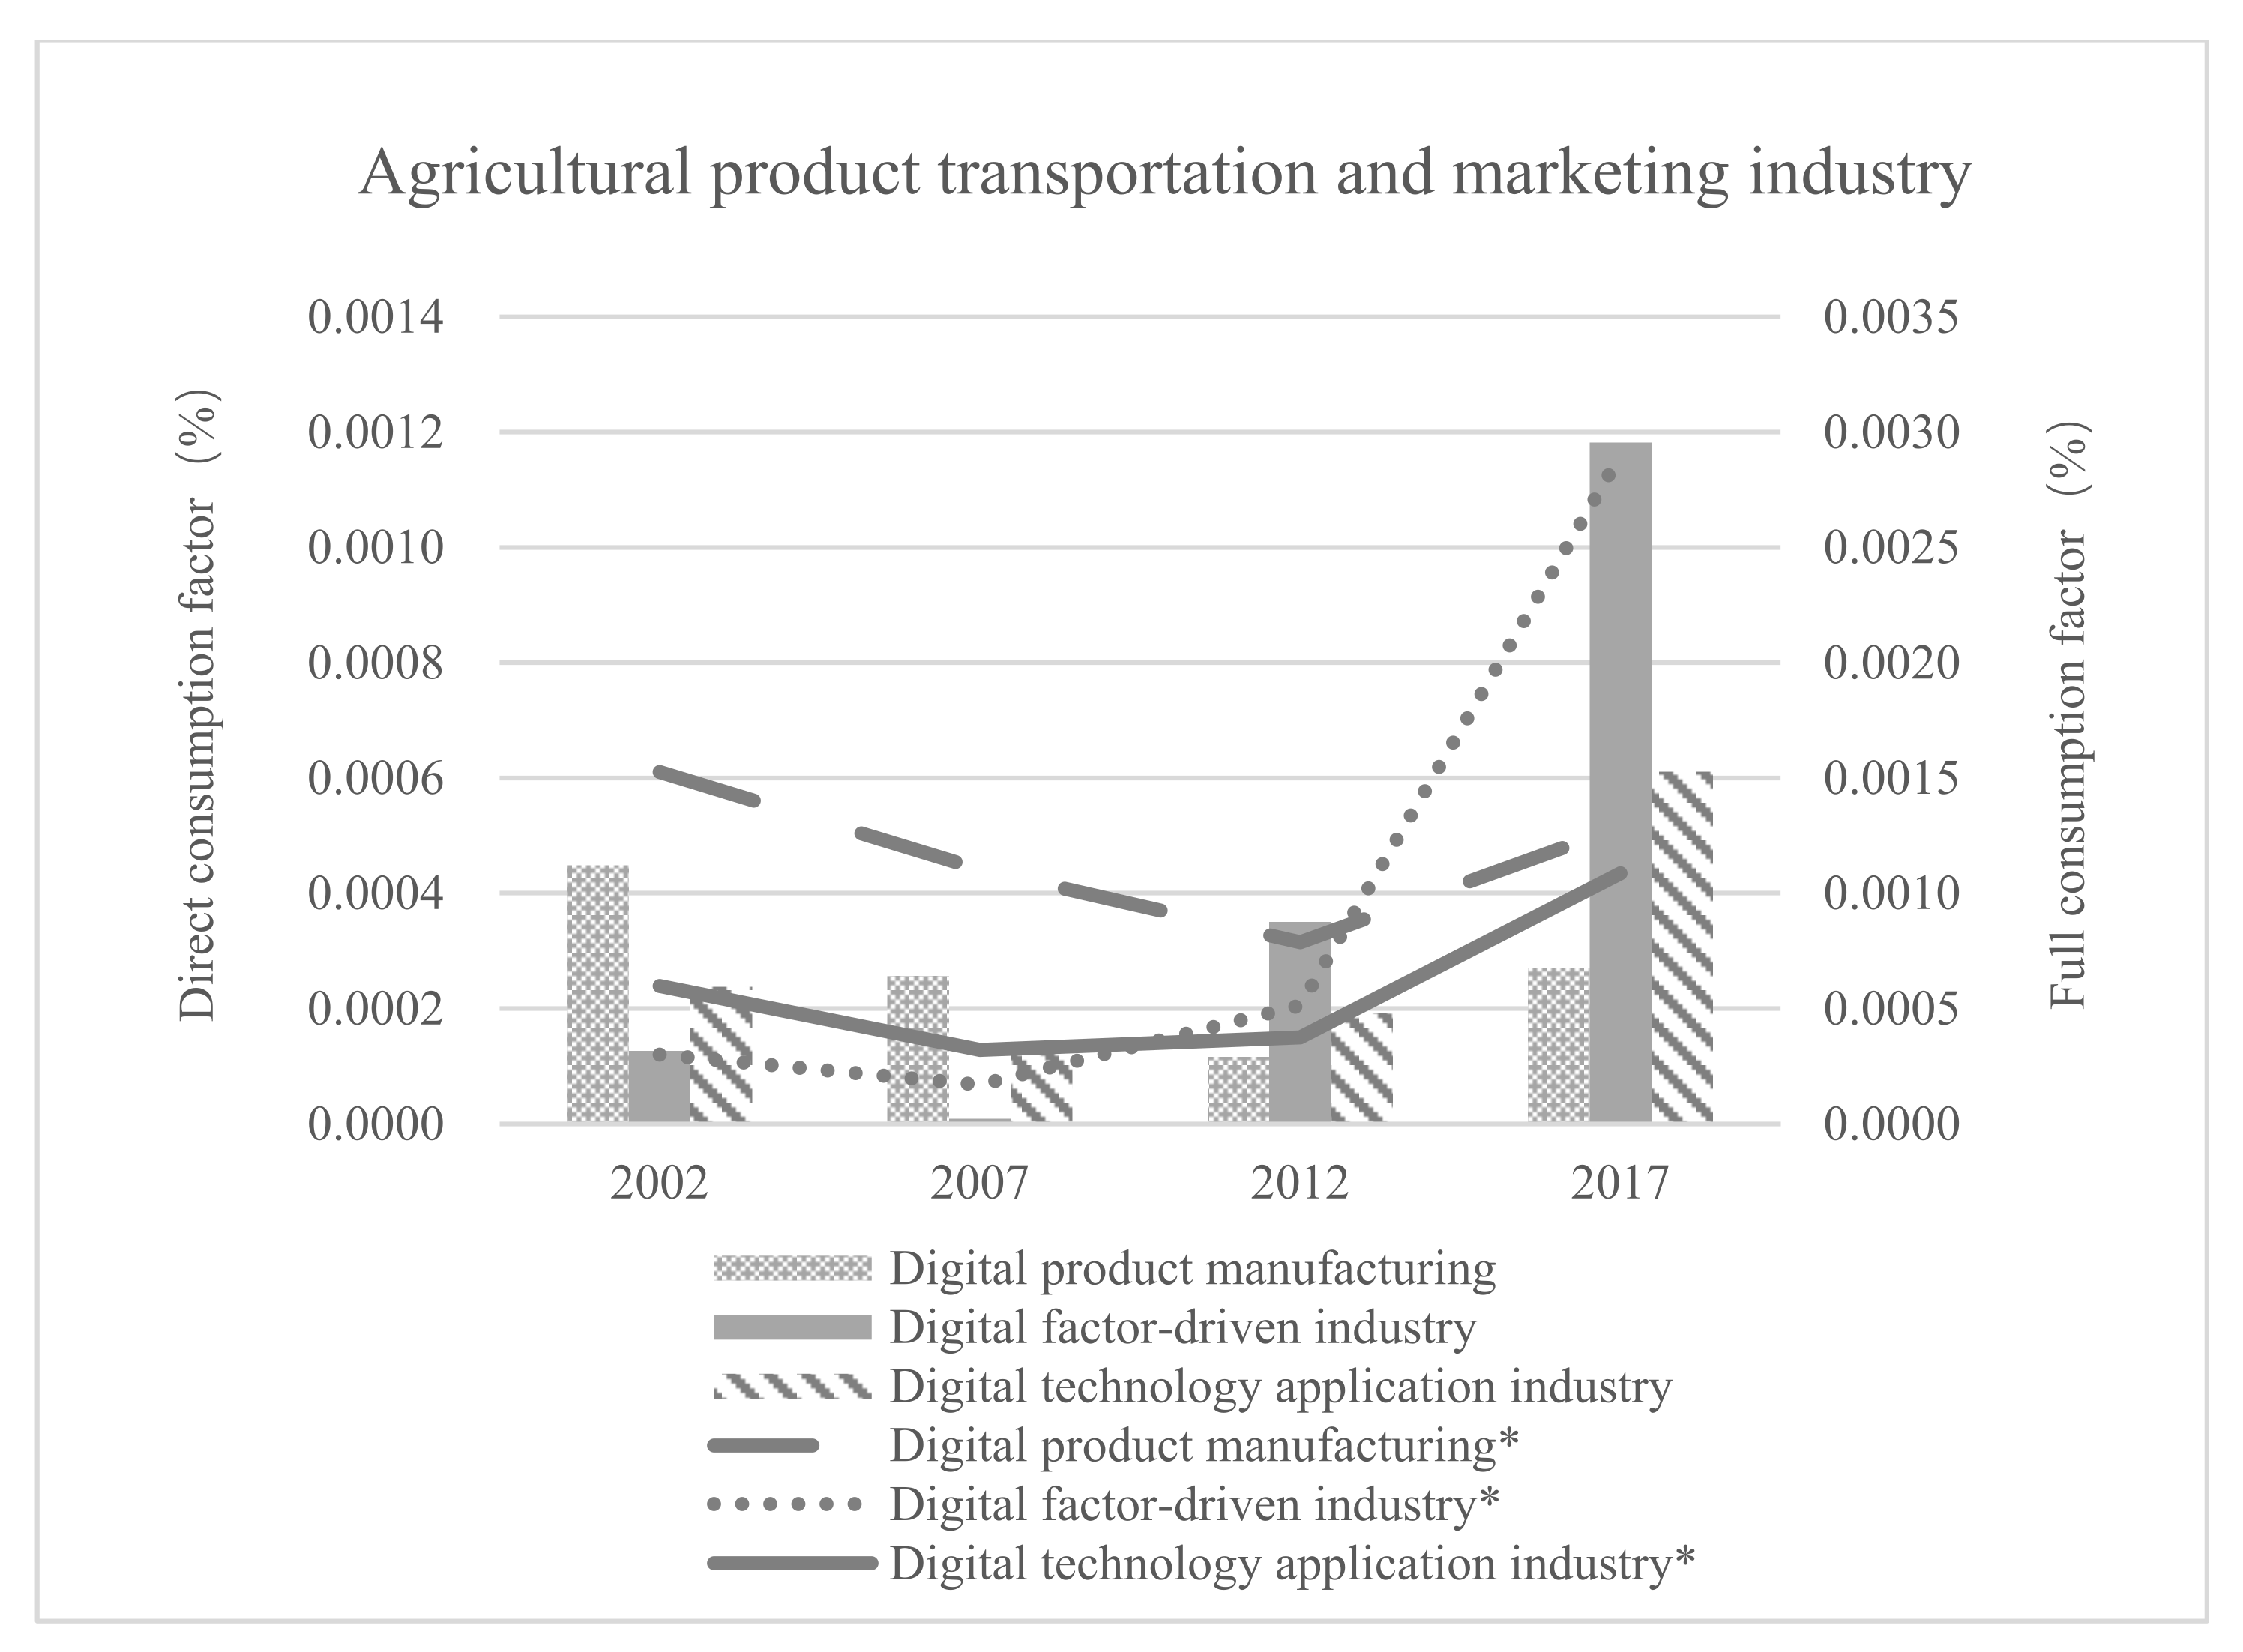
3.1. Contribution of Digital Economy Industries to the Integration of Agro-Related Industries

Based on China’s input–output tables in 2002, 2007, 2012 and 2017, the contribution of the integration of digital economy industries and agriculture-related industries is measured (Figure 1, Figure 2, Figure 3 and Figure 4). Among the above factors, digital product manufacturing, digital factor-driven industry, and digital technology application industry represent direct contributions, while digital product manufacturing*, digital factor-driven industry*, and digital technology application industry* represent indirect contributions. Figure 1, Figure 2, Figure 3 and Figure 4 show that the direct contribution of digital product manufacturing to agriculture-related industries is small overall and that the overall trend is decreasing from 2002 to 2017. Moreover, the direct contribution to the preproduction service industry and the agriculture industry is always less than 0.00002, while concerning the direct contribution to the agricultural processing industry, is always less than 0.001. The direct contribution to the agricultural product transportation and marketing industry is always less than 0.0004, while the indirect contribution of digital product manufacturing to agriculture-related industries is higher overall, with the highest indirect contribution of digital product manufacturing occurring before 2012. This finding is closely related to the nature of the digital product manufacturing industry. As a basic manufacturing industry, the digital product manufacturing industry provides hardware and equipment support for the digital technology application industry and digital factor-driven industry, so its indirect contribution to the agriculture-related industry is greater, while its direct contribution is smaller. The direct contribution of the digital technology application industry to agriculture-related industries is overall high and tends to be stable; its indirect contribution to the agriculture industry, agricultural processing industry and agricultural products transportation and marketing industry is moderate and tends to be stable overall, while the indirect contribution to the preproduction service industry is on the rise year by year, increasing by approximately 50% from 2002 to 2017. The direct contribution of the digital factor-driven industry to agriculture-related industries is the smallest before 2007, growing faster after 2007, surpassing the direct contribution of the digital technology application industry to agriculture-related industries in 2012. The indirect contribution is the smallest before 2007, increasing rapidly after 2007, with the highest indirect contribution to the agriculture industry, agricultural processing and agricultural transport and marketing industry, except for the preproduction service industry, by 2017.
Combined with the analysis in Figure 1, Figure 2, Figure 3 and Figure 4, it can be seen that the digital economy industry has the highest direct and indirect contribution to the agricultural processing industry in absolute terms, followed by the agricultural product transportation and marketing industry and, finally, the preproduction service industry and the agriculture industry. This finding is closely related to the fact that the agricultural processing industry has internal financial, human resources and technical support and a favorable external policy environment.

3.2. Degree of Interaction between the Integration of Digital Economy Industries and Agro-Related Industries

The degree of integration and interaction between digital economy industries and agriculture-related industries is measured based on two indicators: the improved influence coefficient and the inductance coefficient of digital economy industries on agriculture-related industries. From 2002 to 2017, the indicators of integration and interaction between digital economy industries and agriculture-related industries in China are shown in Table 4.

3.2.1. Improved Influence Coefficient

The influence coefficient indicates how much output volume is required from the agro-related industry sector when the digital economy sector increases by one unit of end use, reflecting the backward correlation between the digital economy industry and agro-related industry. The higher the value is, the more significant the pull of that digital economy sector on the agro-related industry sector.
According to Table 4, the influence coefficient of the digital factor-driven industry on all agriculture-related industries in 2002 is >1.0; the agricultural product transportation and marketing industry are the largest, at 2.0059; the digital product manufacturing in the various segments of agriculture-related industries is relatively small, generally, approximately 1.0; the digital technology application industry on the agricultural processing industry is 1.2576 and on the preproduction service industry, agricultural industry, and agricultural product transportation and marketing industry is <1.0. In terms of digital factor-driven industries, people’s material living standards have greatly improved since the 21st century, and mass media, such as radio and television, provide farmers with agricultural and commercial information related to the production, operation and marketing of agricultural products, breaking through the barriers to the circulation of agricultural products that used to rely only on interpersonal communication [34]. In terms of the digital technology application industry, agricultural enterprises, such as the agricultural processing industry have the strength to create their own scientific research institutions, which can integrate research, trial production and the production of science and technology according to the needs of industrial development; use high and new technology to further process agricultural products; improve the value added of agricultural products and realize the close integration of scientific research and production [35]. Furthermore, the driving effect of digital product manufacturing on agriculture-related industries is at an average level.
In 2007, the coefficient of influence of the digital factor-driven industry on the preproduction service industry increased by 0.6. With the implementation of the “Village to Village” project, the use of agricultural radio and television to train farmers in science and technology aspects has further improved farmers’ farming techniques and experience. The coefficient of influence of other digital economy industries on agriculture-related industries has not changed significantly compared to that in 2002 and is generally stable.
The coefficient of influence of the digital factor-driven industry on the preproduction service industry increased further to 2.4214 in 2012, while that on other segments of the agriculture-related industry decreased compared to that in 2007. On the one hand, through the “household access” and “village access” projects, the population coverage of radio and television in rural areas has increased significantly, which has a strong pulling effect on the preproduction service industry. On the other hand, rural e-commerce has not yet experienced an explosion, and the driving effect of digital factor-driven industry on other agriculture-related industries is limited. The pulling force of digital product manufacturing on various segments of agriculture-related industries remains basically unchanged, and the influence coefficient of the digital technology application industry on various segments of agriculture-related industries is slightly lower. Therefore, the driving force needs to be further improved.
In 2017, the coefficient of influence of digital factor-driven industries on the agricultural industry and the agricultural processing industry remains at <1.0, but the coefficients of influence on the preproduction service industry and agricultural product transportation and marketing industry increased significantly, reaching 3.1636 and 2.2859, respectively; the coefficient of influence of digital product manufacturing on all segments of agriculture-related industries decreased to <1.0; except for the preproduction service industry, the coefficient of influence of the digital technology application industry on all segments of agriculture-related industries exceeds 1.0. In terms of digital factor-driven industries, on the one hand, although digital finance has been developed in China for nearly a decade, due to the consideration of information security for small farmers and agricultural enterprises, digital finance has higher digitalization costs in the process of promoting the integration of agriculture-related industries, thus reducing its level of support for the integration of the agricultural industry and agricultural processing industries [36]. On the other hand, e-commerce trading platforms for agricultural products, live e-commerce and other new and efficient agricultural product circulation systems have created an enormous driving force for the agricultural and agricultural product sales chain, with the National Bureau of Statistics showing that by the end of 2021, the national online retail sales of agricultural products reached 422.1 billion yuan. In terms of the digital technology application industry, the influence of the digital technology application industry on various segments of the agriculture-related industry has steadily increased compared to 2012. On the one hand, the government-led agricultural information network system has covered the whole country through years of efforts and has become more closely linked to all segments of the agriculture-related industry in the backward direction. On the other hand, along with the widespread application and diffusion of information integration and remote-control internet technologies in agricultural production, new technologies, such as the Internet of Things, cloud computing and big data have improved labor productivity, resource utilization and land output rates and realized intelligent production.

3.2.2. Improved Inductance Coefficient

The inductance coefficient indicates the amount of output required from the digital economy sector to increase end use by one unit in each sector of the agro-related industry, reflecting the forward correlation between the digital economy sector and the agro-related industry. The higher the value is, the more significant the contribution of the digital economy sector to the agro-related industry.
In 2002, the inductance coefficients of the digital factor-driven industry for the preproduction service industry, agricultural industry, and agricultural product processing were all <0.5, while the inductance coefficient for the agricultural product transportation and marketing industry was 1.2376; the inductance coefficients of the digital technology application industry for the preproduction service industry, agricultural industry, agricultural processing industry, and agricultural product transportation and marketing industry are the largest, at 2.6773, 2.5176, 2.4827, and 1.3022, respectively. For the digital factor-driven industry, since the 1990s, the domestic supply of major agricultural products has entered a comprehensive growth stage with the continuous input of production materials and the continuous progress of science and technology, and efficient access to information on market demand has become one of the prerequisites for the development of China’s agricultural production during the transitional period of supply and demand. In this phase, the need for stable, efficient and fast information channels has led to the promotion of mass media, such as radio and television, in the marketing of agricultural products. As China is a large agricultural country and due to limited land resources and potential for further fertilizer application, regarding the digital technology application industry, the Ministry of Agriculture led the construction of the “Golden Agricultural Project” in 1994 to explore the use of new technologies to build agricultural databases, irrigate farmland with precision, apply fertilizer scientifically and increase the added value of agricultural products. At this stage, the digital product manufacturing industry played a weak role in promoting various segments of the agriculture-related industry.
Compared with 2002, the inductance coefficient of the digital factor-driven industry to the agricultural processing industry increased faster, to 1.3371 in 2007, while the inductance coefficient for the agricultural transportation and marketing industry decreased slightly. As the agricultural processing industry is characterized by strong economies of scale and high capital thresholds, which inevitably lead it to actively seek new financing methods in the face of strong financing demand, the forward linkage between the digital factor-driven industry and the agricultural processing industry has become stronger [37]. Furthermore, the coefficients of digital product manufacturing and digital technology application industries on the inductance of agriculture-related industries as a whole slightly decreased and changed less.
In 2012, the coefficient of inductivity of digital factor-driven industries in the agricultural industry, agricultural processing industry and agricultural products transportation and marketing industry increased by two to four times, reaching 1.5047, 2.1121 and 4.5110, respectively. The information asymmetry between farmers and consumers in the traditional agricultural marketing model and the many links and high costs in the circulation of agricultural products have created an urgent need for the establishment of new marketing channels for agricultural products to change the pattern of benefit distribution, and e-commerce platforms have played a key role in promoting the integration and development of various segments of agriculture-related industries with digital factor-driven industries through the optimization of marketing channels. The inductance coefficient of the digital technology application industry to all segments of the agriculture-related industry has declined and is not sufficient; the inductance coefficient of the digital product manufacturing industry to all segments of the agriculture-related industry is <1.0.
In 2017, the inductance coefficients of the digital factor-driven industry in the preproduction service industry, the agricultural industry, agricultural processing industry and agricultural product transportation and marketing industry once again increased significantly, to 2.4996, 3.0816, 3.6043 and 4.8335, respectively; the inductance coefficients of the digital technology application industry in all segments of the agriculture-related industry generally rebounded compared to those in 2012, remaining at 1.2 on average. Moreover, the inductance coefficients of the digital product manufacturing industry on all segments of the agriculture-related industry were all less than 1.0. In terms of the digital factor-driven industry, as people’s living standards improve, consumption models that cater to diversified, fragmented and personalized needs are constantly being introduced, and large e-commerce and express delivery enterprises, such as Alibaba, Jingdong and Suning, choose to target rural markets. The digital factor-driven industry has a strong sensitivity to the agriculture-related industry. For the digital technology application industry, the production factor constraints that support the continuous increase in agricultural production and quality have further tightened, with the high cost of agricultural production and environmental issues becoming increasingly prominent, while the goal of China’s economic development has shifted from the pursuit of high speed to the pursuit of high quality [38].

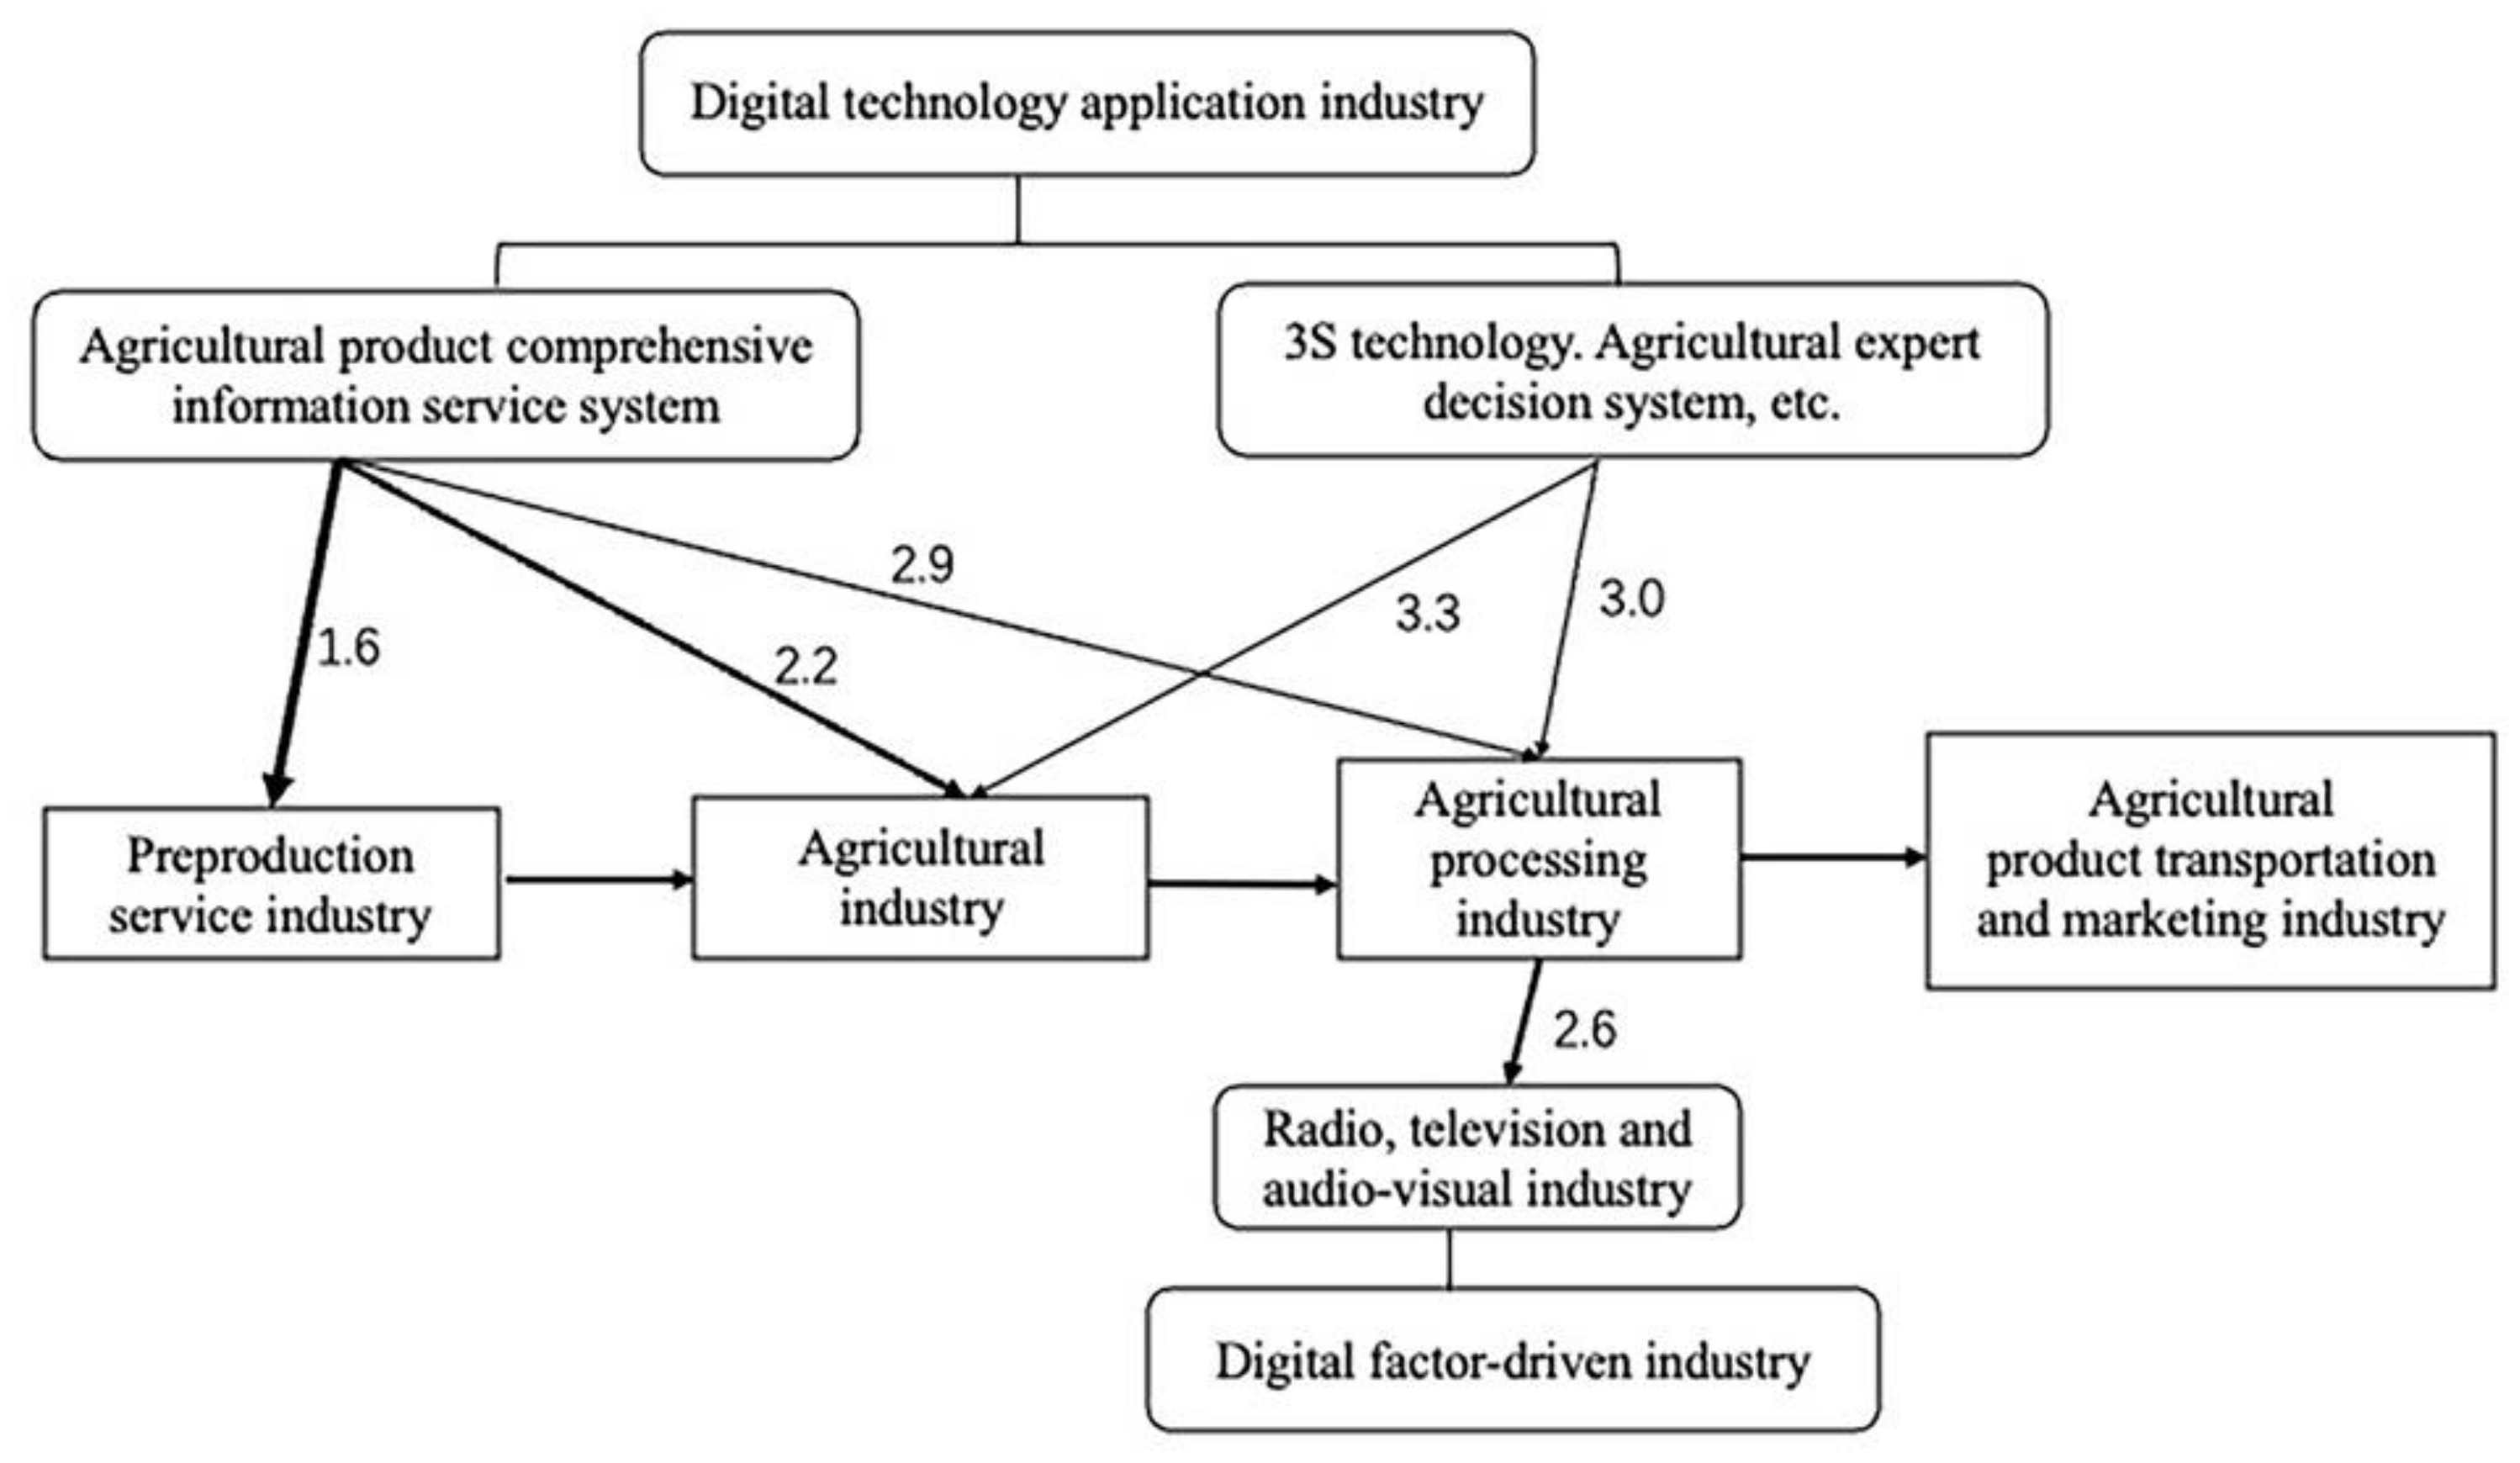
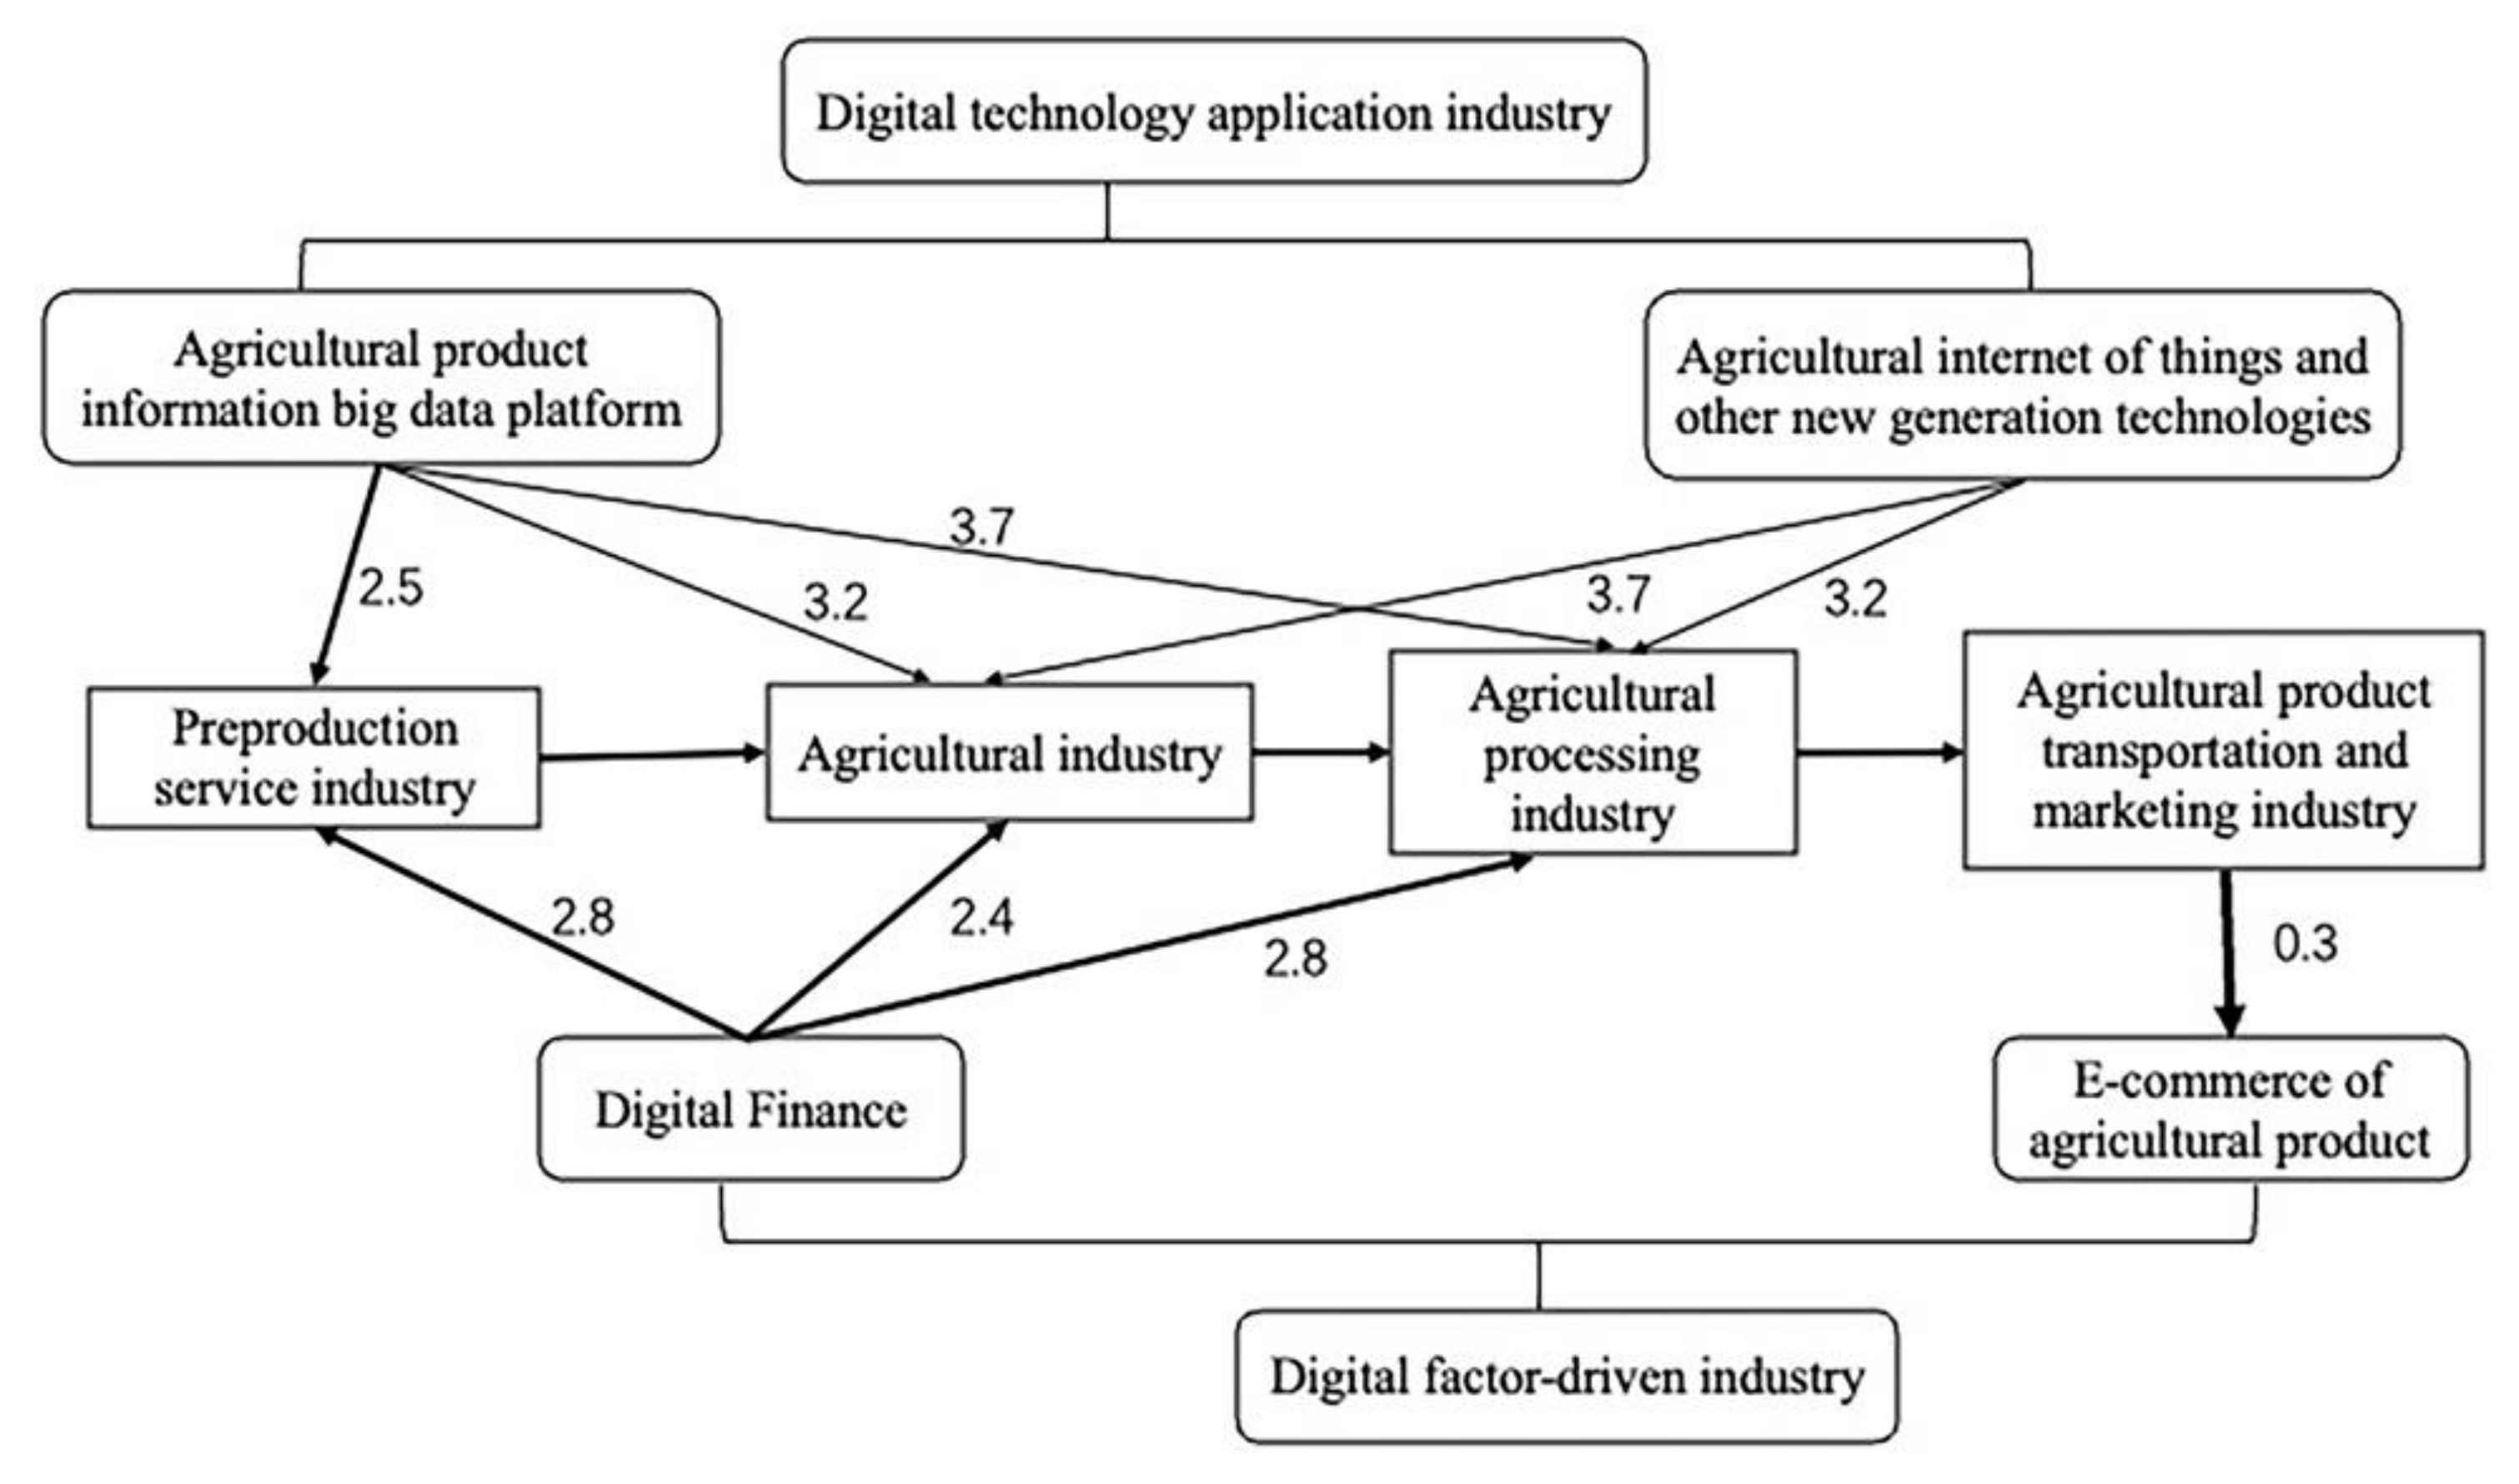
3.3. Analysis of Economic Distance between the Digital Economy Industries and the Agriculture-Related Industries

The above has analyzed the influence coefficient and inductance coefficient of the digital economy industry on agriculture-related industries but has not calculated the economic distance between the two. The economic distance between the digital economy industry and agriculture-related industries can be expressed by the APL coefficient. Therefore, this section plans to draw an industrial chain map of the integration of digital economy industry and agriculture-related industries to more intuitively show the integration and changes of digital economy industry and agriculture-related industries. The influence coefficient and inductance coefficient structure of the digital economy industry on agriculture-related industries in 2007 and 2002 are similar, and there are also similar situations in 2012 and 2017. Therefore, this section uses the input–output table data of 2007 and 2017 to draw. In order to eliminate the two industries with a particularly small degree of correlation, this paper uses the methods of Erik and Romero for reference and introduces the F = f i j = 1 2 L I + G I formula [39]. The greater the f i j value, the closer the economic connection between the two industries. The specific results are shown in Table 5 and Table 6.
Set the threshold to 0.0036 (this value is set according to the needs of the study), according to Table 5 and Table 6, in 2007, the digital technology application industry has a strong forward correlation with the preproduction service industry and agriculture industry; the backward correlation between digital factor-driven industry and agricultural processing industry is obvious; the digital product manufacturing is not closely related to agriculture-related industries. In 2017, the digital technology application industry and the digital factor-driven industry are closely related to the preproduction service industry, agriculture industry and agricultural processing industry, and the digital factor-driven industry was strongly related to the agricultural product transportation and marketing industry. Referring to the method of Chen and Li, the original APL coefficient matrix is further sparse, and the upstream, middle and downstream industries are determined by the adjusted APL coefficient matrix [40]. Finally, this paper draws the industrial chain diagram of the integration of the digital economy industry and agriculture-related industry in 2007 and 2017. The number on the connecting line in the figure is the calculated APL coefficient value. The larger the coefficient value, the thinner the connection between the two industries, the more intermediate sectors, and the farther the economic distance. It is represented by a thinner connecting line, and vice versa. The industrial chain diagram is shown in Figure 5 and Figure 6 below.
It can be seen from Figure 5 that in 2007, the upstream industries related to agriculture included the digital technology application industry represented by agricultural products integrated information service systems and 3S technology; the downstream industries included the digital factor-driven industry represented by radio and television audio and video. The APL coefficients of the agricultural products integrated information service system and the preproduction service industry, agriculture industry, and agricultural processing industry are 1.6, 2.2, and 2.9, respectively. That is, the average economic distance of the agricultural products integrated information service system to the forward promotion of the above agricultural industries is 1.6, 2.2 and 2.9, indicating that they are closely related to each other economically, especially with agricultural pre-production forecasting and decision-making; 3S technology, agricultural expert decision-making system, etc., indirectly affect agriculture industry, and the agricultural processing industry and the APL coefficients are 3.7 and 3.2 respectively. In addition, the APL coefficient between the radio and television audio-visual industry and the agricultural processing industry is 2.6, that is, the average economic distance of the backward pull of the radio and television audio-visual industry to the agricultural processing industry is 2.6, which shows that the radio and television audio-visual industry is located in the downstream of the agricultural processing industry.
As shown in Figure 6, there are a number of changes in the upstream industries involved in the agriculture industry in 2017 compared to 2007. The digital technology application industry was the main industry to undergo technological iteration within the industry, with the rise of new generation information technology industries, such as the Internet of Things and big data. Big data platforms for agricultural product information and the Internet of Agricultural Things act indirectly in the preproduction service industry, agricultural industry, and the agricultural processing industry, with average APL values of 3.1 and 3.4, respectively, which indicates that the intermediate link between the new-generation information technology industry and agriculture-related industry has increased compared that between the traditional information technology industry and agriculture-related industry. In addition, the APL values of the newly added digital finance industry and the preproduction service industry, agricultural industry, and agricultural processing industry are 2.8, 2.4 and 2.8, respectively. The quickness and decentralization characteristics of digital finance can meet the needs of multilevel customer groups, such as small and microenterprises and ordinary scattered individual farmers; the head enterprises of the digital economy join hands with the government and financial institutions to target farmers at the county level and below, helping financial institutions sink their business and provide farmers with services including credit, insurance and payment services. Among downstream industries, the radio, television and audio-visual industries no longer existed in the agriculture-related industry chain in 2017 due to their weakened association with agriculture-related industries and were replaced by booming agricultural product e-commerce. The APL value between agricultural product e-commerce and agricultural product transportation and marketing industry is 0.3, and the average economic distance of backward demand pull from agro-commerce to agro-distribution services is 0.3, with extremely strong economic ties and few intermediate links between the two. From the traditional B2C (business-to-consumer), O2O (online/offline collaboration) and C2C (consumer-to-consumer) models to the emerging C2B (consumer-to-business buying model and live streaming) model, the linkage between agricultural product e-commerce and agricultural product transportation and marketing industry has become increasingly diverse. In summary, after nearly a decade of development, the industries in the chain of integration between the digital economy industry and agriculture-related industries have become more complex and diverse, and new business models are constantly being derived.

3.4. Grey Correlation Model

At the same time, the integrated development of the digital economy industry and agriculture-related industries is also promoting the transformation and upgrading of agriculture. Agricultural producer services, which directly or assist in completing all aspects of agricultural operations, are an important path for agricultural transformation and upgrading. Jiang proposed that agricultural producer services can deepen the industrial division of labor and promote the improvement of industrial production efficiency; it can also decompose, reconstruct and optimize the industrial chain and value chain to promote the growth of new business forms [41]. Therefore, in order to analyze the coordination between the contribution of the digital economy industry to agricultural transformation and the change of agricultural industrial structure, the proportion of the added value of the preproduction service industry and agricultural product transportation and marketing industry in the added value of agricultural related industries in the input–output table of each year is selected as a reference sequence to reflect the change in agricultural industrial structure, The proportion of the contribution of the digital economy industry to the preproduction service industry and the agricultural product transportation and marketing industry in the total contribution of the digital economy industry to all agricultural industries in each year is selected as the comparison sequence, and the calculation results are shown in Table 7.
In Table 7, Y is the reference sequence, that is, the proportion of the added value of the preproduction service industry and the agricultural product transportation and marketing industry in the added value of agricultural related industries in each year. X1 to X3 are comparison sequences, in which the indirect contribution (X1) corresponds to the contribution of digital product manufacturing to the transformation of agriculture-related industries, and the indirect contribution (X2) corresponds to the contribution of digital technology application industries to the transformation of agriculture-related industries. The indirect contribution (X3) corresponds to the contribution of digital factor-driven industries to the transformation of agriculture-related industries. According to the data in Table 7, the grey correlation between the digital economy industry and agriculture-related industries from 2002 to 2017 is shown in Table 8.
According to Table 8, from 2002–2012, X3 ranked among the top two grey correlations, i.e., the coordination between the contribution of the digital factor-driven industry to the transformation of the agricultural industry and the change in the structure of the agricultural industry was good, while by 2017, the grey correlation between the contribution of the digital factor-driven industry to the transformation of the agricultural industry and the change in the structure of the agricultural industry decreased from 0.933 in 2012 to 0.5682, showing a significant decline in coordination. From the above analysis, we can see that before 2012, the digital factor-driven industry, mainly mass media, such as television, radio and audio-visual media, provided farmers with scientific and cultural training and improved their production capacity, while after 2012, the digital factor-driven industry, represented by e-commerce, developed rapidly. The grey correlation ranking of X2 rose from second place in 2002 to first place in 2007 and remained in first place until 2017. That is, the coordination between the contribution of the digital technology application industry to the transformation of the agricultural industry and the structural change in the agricultural industry is good. The digital technology application industry has played a central role in the transformation of the agricultural industry, for example, by building a rural agricultural credit system through big data, which has reduced transaction costs while promoting the continuous externalization of agricultural production services. From 2002 to 2017, the grey correlation ranking of X1 moved up from the bottom, reflecting the gradual coordination between the contribution of digital product manufacturing to the transformation of the agricultural industry and improvement in the agricultural industrial structure.

3.5. Discussion

In terms of the contribution to the integration of digital economy industries and agriculture-related industries and the interaction between them, although digital product manufacturing is relatively insensitive to changes in agriculture-related industries and has an average pulling effect on agriculture-related industries, its indirect contribution to agriculture-related industries is significantly higher than its direct contribution, indicating that the digital product manufacturing, as a basic manufacturing industry, relies on the construction of digital infrastructure for the research and development of digital technologies and the construction of internet platforms. From 2002 to 2017, the indirect contribution of the digital technology application industry to the preproduction service industry grew by approximately 50%, and the overall contribution to the integration of other agro-related industries was high and tended to be stable. In terms of integration interaction, before 2012, the inductivity coefficient of the digital technology application industry to agriculture-related industries was significantly larger than the influence coefficient, i.e., the digital technology application industry had a greater forward push effect than a backwards pull effect on agriculture-related industries, while after 2012, the inductivity coefficient of the digital technology application industry to agriculture-related industries was basically the same as the influence coefficient, indicating an increase in the pull effect of the digital technology application industry. Digital factor-driven industries show significant fluctuations in their contribution to the integration and interaction of agro-related industries relative to the other two types of digital economy industries. After 2012, the integration contribution to agriculture-related industries showed explosive growth, while before 2012, the influence coefficient of digital factor-driven industries on agriculture-related industries was significantly larger than the inductance coefficient. After 2012, the inductance coefficient of digital factor-driven industries on agriculture-related industries reversed the influence coefficient, in which the inductance coefficient of digital factor-driven industries on agricultural products transportation and marketing industry reached its optimal degree of integration and interaction in 2017. The highest value, 4.835, indicates that the sensitivity of digital factor-driven industries to changes in agriculture-related industries has increased, and it can also be said that the demand of agriculture-related industries for digital factor-driven industries has increased and that digital factor-driven industries have become an increasingly important part of agriculture-related industries. Through empirical analysis, Zhang Y et al. [42] concluded that with the development of digital technology, digital finance will promote the integration of rural industries. The research results of this paper also prove that although the digital factor driven industry represented by digital finance started late in China, it has developed rapidly and is closely connected with various links of agricultural industries, achieving better integration with agricultural industries.
From 2007 to 2017, digital factor-driven industries, represented by internet finance and e-commerce for agricultural products, gradually developed and grew and had closer economic ties with agriculture-related industries, while radio, television and audio-visual industries were gradually eliminated due to loosened economic ties. Cui K et al. [43] believe that the rapid development of rural e-commerce depends on the combination of grass-roots development and government promotion. However, this paper believes that government policies also affect agricultural production and agricultural product processing, but the integration effect of the digital economy industry and the agricultural product transportation and marketing industry is the best. This shows that the rapid development of the digital factor driven industry represented by rural e-commerce mainly depends on the development of the grassroots. Agricultural cooperative organizations and agricultural enterprises continue to explore and choose production and marketing models suitable for self-development.
In terms of the coordination between the digital economy industry and the transformation and upgrading of agriculture, despite the strong development of the digital factor-driven industry in recent years, coordination concerning the transformation and upgrading of the agricultural industry has become poor, which may be related to factors, such as the fact that the laws and regulations of the e-commerce industry are not yet sound, and the driving force for the transformation and upgrading of agriculture needs further improvement. Coordination between the digital technology application industry and agricultural transformation and upgrading has been maintained at a high level, indicating that the digital technology application industry is in a key position in the process of agricultural transformation. Although this paper affirms that digital technology has played a key role in agricultural transformation by measuring the coordination among industries, Wiseman et al. [44] put forward the potential risks that may exist in the application of digital technology to the development of agriculture-related industries from the perspective of law. In addition, the coordination between digital product manufacturing and the transformation of agriculture goes through a process from bad to good, which indicates that there is a lag in the role of digital product manufacturing in agricultural development.

4. Recommendations and Outlook

4.1. Suggestions

Digital product manufacturing is the basis for the integration of agriculture-related industries, promoting the upgrading of digital infrastructure construction in rural areas, enhancing the coverage of 4G and 5G base stations in China’s rural and remote areas, and further expanding the internet penetration rate, and breaking down barriers to their integration and development. The digital factor-driven industry is the driving force behind the development of agro-industries. In this process, the development of digital finance should first be regulated, the corresponding laws and regulations should be optimized, and the legal system related to digital finance should be revised and improved.
The digital technology application industry is key to the transformation of the agricultural industry. Therefore, the government should adopt corresponding incentives and policy subsidies; actively guide and strengthen the cooperation between research institutes and agricultural enterprises; strive to break through key, core and cutting-edge technologies, and realize the transformation of scientific and technological achievements on the ground as early as possible.

4.2. Limitations and Prospects

Limited by the data, this article can only obtain data once every five years. The research results can show the overall situation of industrial integration in China over the past 20 years but cannot be detailed in the comparison of each year. In the future, we will divide the contribution of the digital economy to agriculture-related industries by regions in China and compare the industrial integration of various regions in China through a spatial network model.

Author Contributions

Conceptualization, X.L.; methodology, X.L.; software, X.L.; validation, X.L. and G.T.; formal analysis, X.L.; investigation, X.L.; resources, G.T.; data curation, X.L.; writing—original draft preparation, X.L.; writing—review and editing, G.T.; visualization, X.L.; supervision, G.T.; project administration, G.T.; funding acquisition, G.T. All authors have read and agreed to the published version of the manuscript.

Funding

This research was funded by Heilongjiang Provincial Department of Science and Technology Planning Project, GC14D104.

Institutional Review Board Statement

Not applicable.

Informed Consent Statement

Not applicable.

Data Availability Statement

All related data are within the manuscript.

Conflicts of Interest

The authors declare no conflict of interest.

References

  1. Patrício, D.I.; Rieder, R. Computer vision and artificial intelligence in precision agriculture for grain crops: A systematic review. Comput. Electron. Agr. 2018, 153, 69–81. [Google Scholar] [CrossRef]
  2. Fleming, A.; Jakku, E.; Lim-Camacho, L.; Taylor, B.; Thorburn, P. Is big data for big farming or for everyone? Perceptions in the Australian grains industry. Agron. Sustain. Dev. 2018, 38, 1–10. [Google Scholar] [CrossRef]
  3. Freidberg, S. “Unable to determine”: Limits to metrical governance in agricultural supply chains. Sci. Technol. Hum. Val. 2020, 45, 738–760. [Google Scholar] [CrossRef]
  4. Ministry of Agriculture and Rural Affairs of the People’s Republic of China. The No. 1 Document of the Central Government in 2022. Available online: http://www.moa.gov.cn/govpublic/FZJHS/202203/t20220301_6389886.htm (accessed on 14 August 2022).
  5. Bowman, J.P. The Digital Economy: Promise and Peril in the Age of Networked Intelligence; McGraw-Hill: New York, NY, USA, 1996. [Google Scholar]
  6. Wu, Y.; Wang, T. Research on the Statistical Definition and Industrial Classification of Digital Economy. Stat. Res. 2021, 6, 18–29. [Google Scholar]
  7. Li, C. A preliminary discussion on the connotation of digital economy. E-Government 2017, 9, 84–92. [Google Scholar]
  8. Li, J.; Feng, X.; Guo, M. Analysis and countermeasures for the development of agricultural informatization in China. J. South China Agric. Univ. 2015, 14, 9–19. [Google Scholar]
  9. Central People’s Government of the People’s Republic of China. The State Council Issued the Guiding Opinions on Actively Promoting the “Internet +” Action. Available online: http://www.gov.cn/xinwen/2015-07/04/content_2890205.htm (accessed on 14 August 2022).
  10. Cheng, C.; Ding, D. “Internet + agricultural e-commerce”: Development path of modern agricultural informatization. Inf. Sci. 2016, 34, 49–59. [Google Scholar]
  11. Shi, W.; Cao, C. Research on innovative mechanism and path of “Internet plus agriculture industry chain”. Retical Investig. 2017, 6, 110–114. [Google Scholar]
  12. Niu, Y. Study on the management ecology of high-quality development of agricultural industry chain: Integrated innovation perspective based on “Internet + agricultural industry chain”. Econ. Manag. 2021, 35, 1–10. [Google Scholar]
  13. Liu, L.; Gao, Z. Research on the path of “Internet+” promoting the transformation of agricultural economic development mode - from the perspective of agricultural industrial chain. Word Agric. 2015, 12, 18–23. [Google Scholar]
  14. Wang, S.; Feng, G. Agricultural virtual industry cluster: A new model of agricultural industrial chain integration driven by “Internet+” innovation. Shanghai J. Econ. 2016, 6, 86–92. [Google Scholar]
  15. Fu, H.; Zhao, C.; Cheng, C. Blockchain embedding, constraint breaking and agricultural industrial chain governance. Issues Agric. Econ. 2019, 11, 108–117. [Google Scholar]
  16. Zhang, J.; Lyu, Y.; Li, Y.; Geng, Y. Digital economy: An innovation driving factor for low-carbon development. Environ. Impact Asses. 2022, 96, 106821. [Google Scholar] [CrossRef]
  17. Schroeder, K.; Lampietti, J.; Elabed, G. What’s Cooking: Digital Transformation of the Agrifood System; The World Bank Group: Washington, DC, USA, 2021. [Google Scholar]
  18. Torky, M.; Hassanein, A.E. Integrating blockchain and the internet of things in precision agriculture: Analysis, opportunities, and challenges. Comput. Electron. Agr. 2020, 178, 105476. [Google Scholar] [CrossRef]
  19. Parker, C.; Ramdas, K.; Savva, N. Is it enough? Evidence from a natural experiment in India’s agriculture markets. Manage. Sci. 2016, 62, 2481–2503. [Google Scholar] [CrossRef]
  20. Tian, T.; Li, L.; Wang, J. The Effect and Mechanism of Agricultural Informatization on Economic Development: Based on a Spatial Heterogeneity Perspective. Sustainability 2022, 6, 3165. [Google Scholar] [CrossRef]
  21. Martens, K.; Zscheischler, J. Digital Transformation of the Agricultural Value Chain: Discourses on Opportunities, Challenges and Controversial Perspectives on Governance Approaches. Sustainability 2022, 7, 3905. [Google Scholar] [CrossRef]
  22. Liang, W. The study on the China’s agriculture developing by converging with related industries from the visual angle of industry convergence. Sci. Econ. Soc. 2011, 29, 12–24. [Google Scholar]
  23. Li, J.; Feng, X.; Ma, C.; Guo, M.; Jia, N. Internet plus agriculture: Mechanism, dilemma and policy suggestions with industrial integration perspective. J. Shanxi Agric. Univ. 2018, 17, 53–59. [Google Scholar]
  24. Liang, S.G.; Ma, Z.D. Analysis on the correlation degree, path and effect of agricultural industry convergence. Reform Econ. Syst. 2017, 6, 79–84. [Google Scholar]
  25. Ye, Y.; Wang, F.; Pei, X. Integration of Information Technology Industry and Rural Industry: Drive, Evolution and Level. Agric. Econ. Manag. 2018, 5, 20–29. [Google Scholar]
  26. National Bureau of Statistics. Input-Output Tables of China. Available online: http://www.stats.gov.cn (accessed on 14 August 2022).
  27. Xu, X.; Zhang, M. Research on the scale measurement of China’s digital economy-based on the perspective of international comparison. China Ind. Econ. 2020, 5, 23–41. [Google Scholar]
  28. Geng, X. Compilation and application of input-output table of agriculture related industries. Stat. Decis. 2010, 5, 17–19. [Google Scholar]
  29. Shen, L. Revaluating traditional formula of influence power coefficient. J. Quant. Tech. Econ. 2010, 27, 133–141. [Google Scholar]
  30. Peng, H.; Kuang, X. To what extent does China’s manufacturing and productive services integrate-base on 2010–2014 international input-output analysis and comparison. J. Int. Trade 2019, 10, 100116. [Google Scholar]
  31. Wu, X.; Zhang, K. Research on measuring the integration of digital economy industry and manufacturing industry-based on the perspective of input-output. China Bus. Mark. 2021, 35, 89–98. [Google Scholar]
  32. Liu, Q. Research on the structural analysis method of input-output coefficient. Stat. Res. 2002, 2, 40–42. [Google Scholar]
  33. Bosma, N.S.; Romero Luna, I.; Dietzenbacher, E. Using average propagation lengths to identify production chains in the Andalusian economy. Estud. Econ. Apl. 2005, 23, 405–422. [Google Scholar]
  34. Xu, A. Suggestions on accelerating the informatization of agricultural products circulation. Issues Agric. Econ. 2002, 4, 42–44. [Google Scholar]
  35. Jiang, H. Research on high-tech transformation of traditional agriculture in China. J. Manag. World 1996, 2, 167–175. [Google Scholar]
  36. He, H. Digital finance propelling integrated development of rural industries: Dilemma reflection and road exploration. J. Northwest A F Univ. 2020, 20, 118–125. [Google Scholar]
  37. Jiang, C.; Zhang, X.; Liu, M. Financing situation, sources of funds and policy needs of rural small and medium-sized enterprises. Rural. Econ. 2010, 11, 3–6. [Google Scholar]
  38. Xia, X.; Chen, Z.; Zhang, H.; Zhao, M. Agricultural high-quality development: Digital empowerment and implementation path. Chin. Rural. Econ. 2019, 12, 2–15. [Google Scholar]
  39. Dietzenbacher, E.; Romero, I. Production chains in an interregional framework: Identification by means of average propagation lengths. Int. Reg. Sci. Rev. 2007, 30, 362–383. [Google Scholar] [CrossRef]
  40. Chen, Y.; Li, Y. Changes and optimization of Fujian’s agricultural industry chain. J. Huaqiao Univ. 2021, 1, 76–88. [Google Scholar]
  41. Jiang, C. Scientifically grasp the historical position of the agricultural producer services industries development. J. Nanjing Agric. Univ. 2020, 20, 1–14. [Google Scholar]
  42. Zhang, Y.; Zhou, Y. Digital Financial Inclusion, Traditional Financial Competition, and Rural Industry Integration. J. Agrotech. Econ. 2021, 9, 68–82. [Google Scholar]
  43. Cui, K.; Feng, X. An “Under-upper Coordinated” Development Logic and Tendency of Rural E-business in an Evolutionary Perspective. Chin. Rural. Econ. 2018, 3, 29–44. [Google Scholar]
  44. Wiseman, L.; Sanderson, J.; Zhang, A.; Jakku, E. Farmers and their data: An examination of farmers’ reluctance to share their data through the lens of the laws impacting smart farming. NJAS-Wagening. J. Life Sci. 2019, 90, 100301. [Google Scholar] [CrossRef]
Figure 1. Contribution of the digital economy industry to the preproduction service industry. Note: * represents the indirect contributions of digital economy industries to agriculture-related industries.
Sustainability 14 10967 g001
Figure 2. Contribution of the digital economy industry to the agricultural industry. Note: * represents the indirect contributions of digital economy industries to agriculture-related industries.
Sustainability 14 10967 g002
Figure 3. Contribution of the digital economy industry to the agricultural processing industry. Note: * represents the indirect contributions of digital economy industries to agriculture-related industries.
Sustainability 14 10967 g003
Figure 4. Contribution of the digital economy industry to the agricultural product transportation and marketing industry. Note: * represents the indirect contributions of digital economy industries to agriculture-related industries.
Sustainability 14 10967 g004
Figure 5. Agriculture-related industries chain in 2007.
Sustainability 14 10967 g005
Figure 6. The upgrading of the agriculture-related industries chain in the context of the digital economy in 2017.
Sustainability 14 10967 g006
Table 1. Classification of China’s digital economy and its core industries.
Digital EconomyClassificationInput–Output Table Department Code
2017201220072002
Digital product manufacturingComputer manufacturing390883908608440076
Communication and radar equipment manufacturing390893908708240075
3909039088083
Digital media equipment manufacturing390903908808640079
390913908940077
Electronic components and equipment manufacturing39092390900540078
390933909108740080
Digital product service industryWholesale of
digital products
\\\\
Digital product retail\\\\
Digital product rental\\\\
Digital product repair\\\\
Digital technology application industrySoftware development651246511510761101
Telecommunications, broadcast television and satellite transmission services631216311410560100
63122
Internet related services641236311410560100
Information technology services651256511510661101
Digital elements drive industryInternet wholesale and retail511055110310863102
52106
Internet banking6612666116\\
Digital content and media871448613413188120
Information infrastructure construction\\\\
Digital resources and property rights transactions\\\\
Note: \ indicates unextracted part.
Table 2. Classification of China’s agricultural related industries sectors.
Agricultural-Related IndustryDepartment
Preproduction service industryAgriculture, forestry, animal husbandry and fishery service products
Agricultural industryAgricultural products, forest products, livestock products, fishery products
Agro-processing industryThe grain milling sector and other industrial sectors that are statistically related to the agricultural product processing industry in China
Agricultural product transportation and marketing industryAgricultural products railway freight transportation, warehousing, wholesale and retail, business services, etc.
Table 3. Noncompetitive input–output simplified table.
Intermediate UseEnd UseImportTotal Output
Department1 2…nConsumptionCapitalExitTotal
Intermediate input of domestic products1
2

n
X i j d C i d I N i d E X i d Y i d X i
Intermediate input of imported products1
2

n
X i j m C i m I N i m E X i m Y i m M i
Value addedNj
Total investmentXj
Where x i j d   and x i j m refers to the domestic and foreign intermediate input data of department i to department j. X i , M i and E X i denote total output, imports and exports of sector i, respectively.
Table 4. Influence coefficient and inductance coefficient of digital economy industry on agriculture-related industries.
YearDepartment
Number
Influence
Coefficient
Inductance
Coefficient
YearDepartment
Number
Influence
Coefficient
Inductance
Coefficient
2002Dig1-erev1.00230.23192007Dig1-erev0.90270.1807
Dig2-erev0.93582.6773Dig2-erev0.74812.2552
Dig3-erev1.05970.4764Dig3-erev1.63530.8030
Dig1-duct0.91330.6297Dig1-duct0.91270.3952
Dig2-duct0.99662.5176Dig2-duct0.93172.1139
Dig3-duct1.25430.4992Dig3-duct1.32810.8411
Dig1-cess0.63440.6454Dig1-cess0.74500.3260
Dig2-cess1.25762.4827Dig2-cess1.16981.9060
Dig3-cess1.79080.4902Dig3-cess1.39261.3371
Dig1-ping0.77650.8097Dig1-ping0.62190.7692
Dig2-ping0.65301.3022Dig2-ping0.87211.5801
Dig3-ping2.00591.2376Dig3-ping2.16410.7017
2012Dig1-erev0.93780.54872017Dig1-erev0.66400.2153
Dig2-erev0.41841.7460Dig2-erev0.82061.4631
Dig3-erev2.42140.9747Dig3-erev3.16362.4996
Dig1-duct1.30590.9187Dig1-duct0.88780.3940
Dig2-duct0.87040.8899Dig2-duct1.35411.2762
Dig3-duct0.23431.5047Dig3-duct0.46563.0816
Dig1-cess1.17370.7708Dig1-cess0.82420.3954
Dig2-cess1.03990.8385Dig2-cess1.47601.1018
Dig3-cess0.32912.1121Dig3-cess0.40203.6043
Dig1-ping1.15240.3903Dig1-ping0.67200.3871
Dig2-ping0.58200.3048Dig2-ping1.09710.7101
Dig3-ping1.35444.5110Dig3-ping2.28594.8335
Note: Dig1, Dig2, and Dig3 represent the three digital economic sectors of digital product manufacturing, digital technology application industry, and digital factor-driven industry; erev, duct, cess, and ping, respectively, refer to the preproduction service industry, agriculture industry, agricultural processing industry, agricultural product transportation and marketing industry.
Table 5. Economic connection index between digital economy industry and agriculture-related industries in 2007.
Industrial SectorPreproduction Service IndustryAgricultural
Industry
Agro-Processing IndustryAgricultural Product Transportation and Marketing IndustryDigital Product ManufacturingDigital Technology Application IndustryDigital Factor-Driven Industry
Preproduction
service industry
0.04630.07260.03030.00040.00130.00060.0009
Agricultural industry0.02680.04300.06580.00210.00340.00270.0034
Agro-processing industry0.00410.01270.01990.00080.00310.00360.0036
Agricultural product transportation and marketing industry0.00160.00240.00230.00120.00390.00200.0009
Digital product manufacturing0.00070.00070.00080.00060.04730.01140.0012
Digital technology application industry0.00460.00410.00340.00090.00890.01900.0027
Digital factor-
driven industry
0.00060.00120.00160.00030.00230.00160.0144
Table 6. The economic connection index between digital economy industry and agriculture-related industries in 2017.
Industrial SectorPreproduction Service IndustryAgricultural
Industry
Agro-Processing IndustryAgricultural Product Transportation and Marketing IndustryDigital Product ManufacturingDigital Technology Application IndustryDigital Factor-Driven Industry
Preproduction
service industry
0.09070.09900.03250.00080.00160.00120.0019
Agricultural industry0.03420.07940.06470.00140.00300.00290.0031
Agro-processing industry0.00620.03850.02030.00150.00320.00390.0034
Agricultural product transportation and marketing industry0.00390.04150.00680.00140.00380.00330.0048
Digital product manufacturing0.00230.02330.00330.00180.06310.01250.0019
Digital technology application industry0.00600.04940.00610.00270.01040.04140.0038
Digital factor-
driven industry
0.00850.01040.01480.00130.00630.00450.0068
Table 7. Reference sequences and comparison sequences between digital economy industries and agriculture-related industries from 2002 to 2017.
2002200720122017
Y12.17%13.23%16.53%15.58%
X133.34%22.24%29.39%26.36%
X218.40%16.90%20.29%23.34%
X39.60%8.82%20.6%36.12%
Table 8. Grey correlation between digital economy industries and agriculture-related industries from 2002 to 2017.
YearCompare SequencesGrey Relational DegreeSortYearCompare SequencesGrey Relational DegreeSort
2002X30.990912007X20.94801
X20.86042X30.92062
X10.55993X10.78233
2012X20.944612017X20.81561
X30.93302X10.74002
X10.69493X30.56823
Publisher’s Note: MDPI stays neutral with regard to jurisdictional claims in published maps and institutional affiliations.

