
Assessing Spatial and Temporal Changes of Natural Capital in a Typical Semi-Arid Protected Area Based on an Ecological Footprint Model

 ,
,  ,
,  , and
, and
Abstract
:1. Introduction
2. Materials and Methods
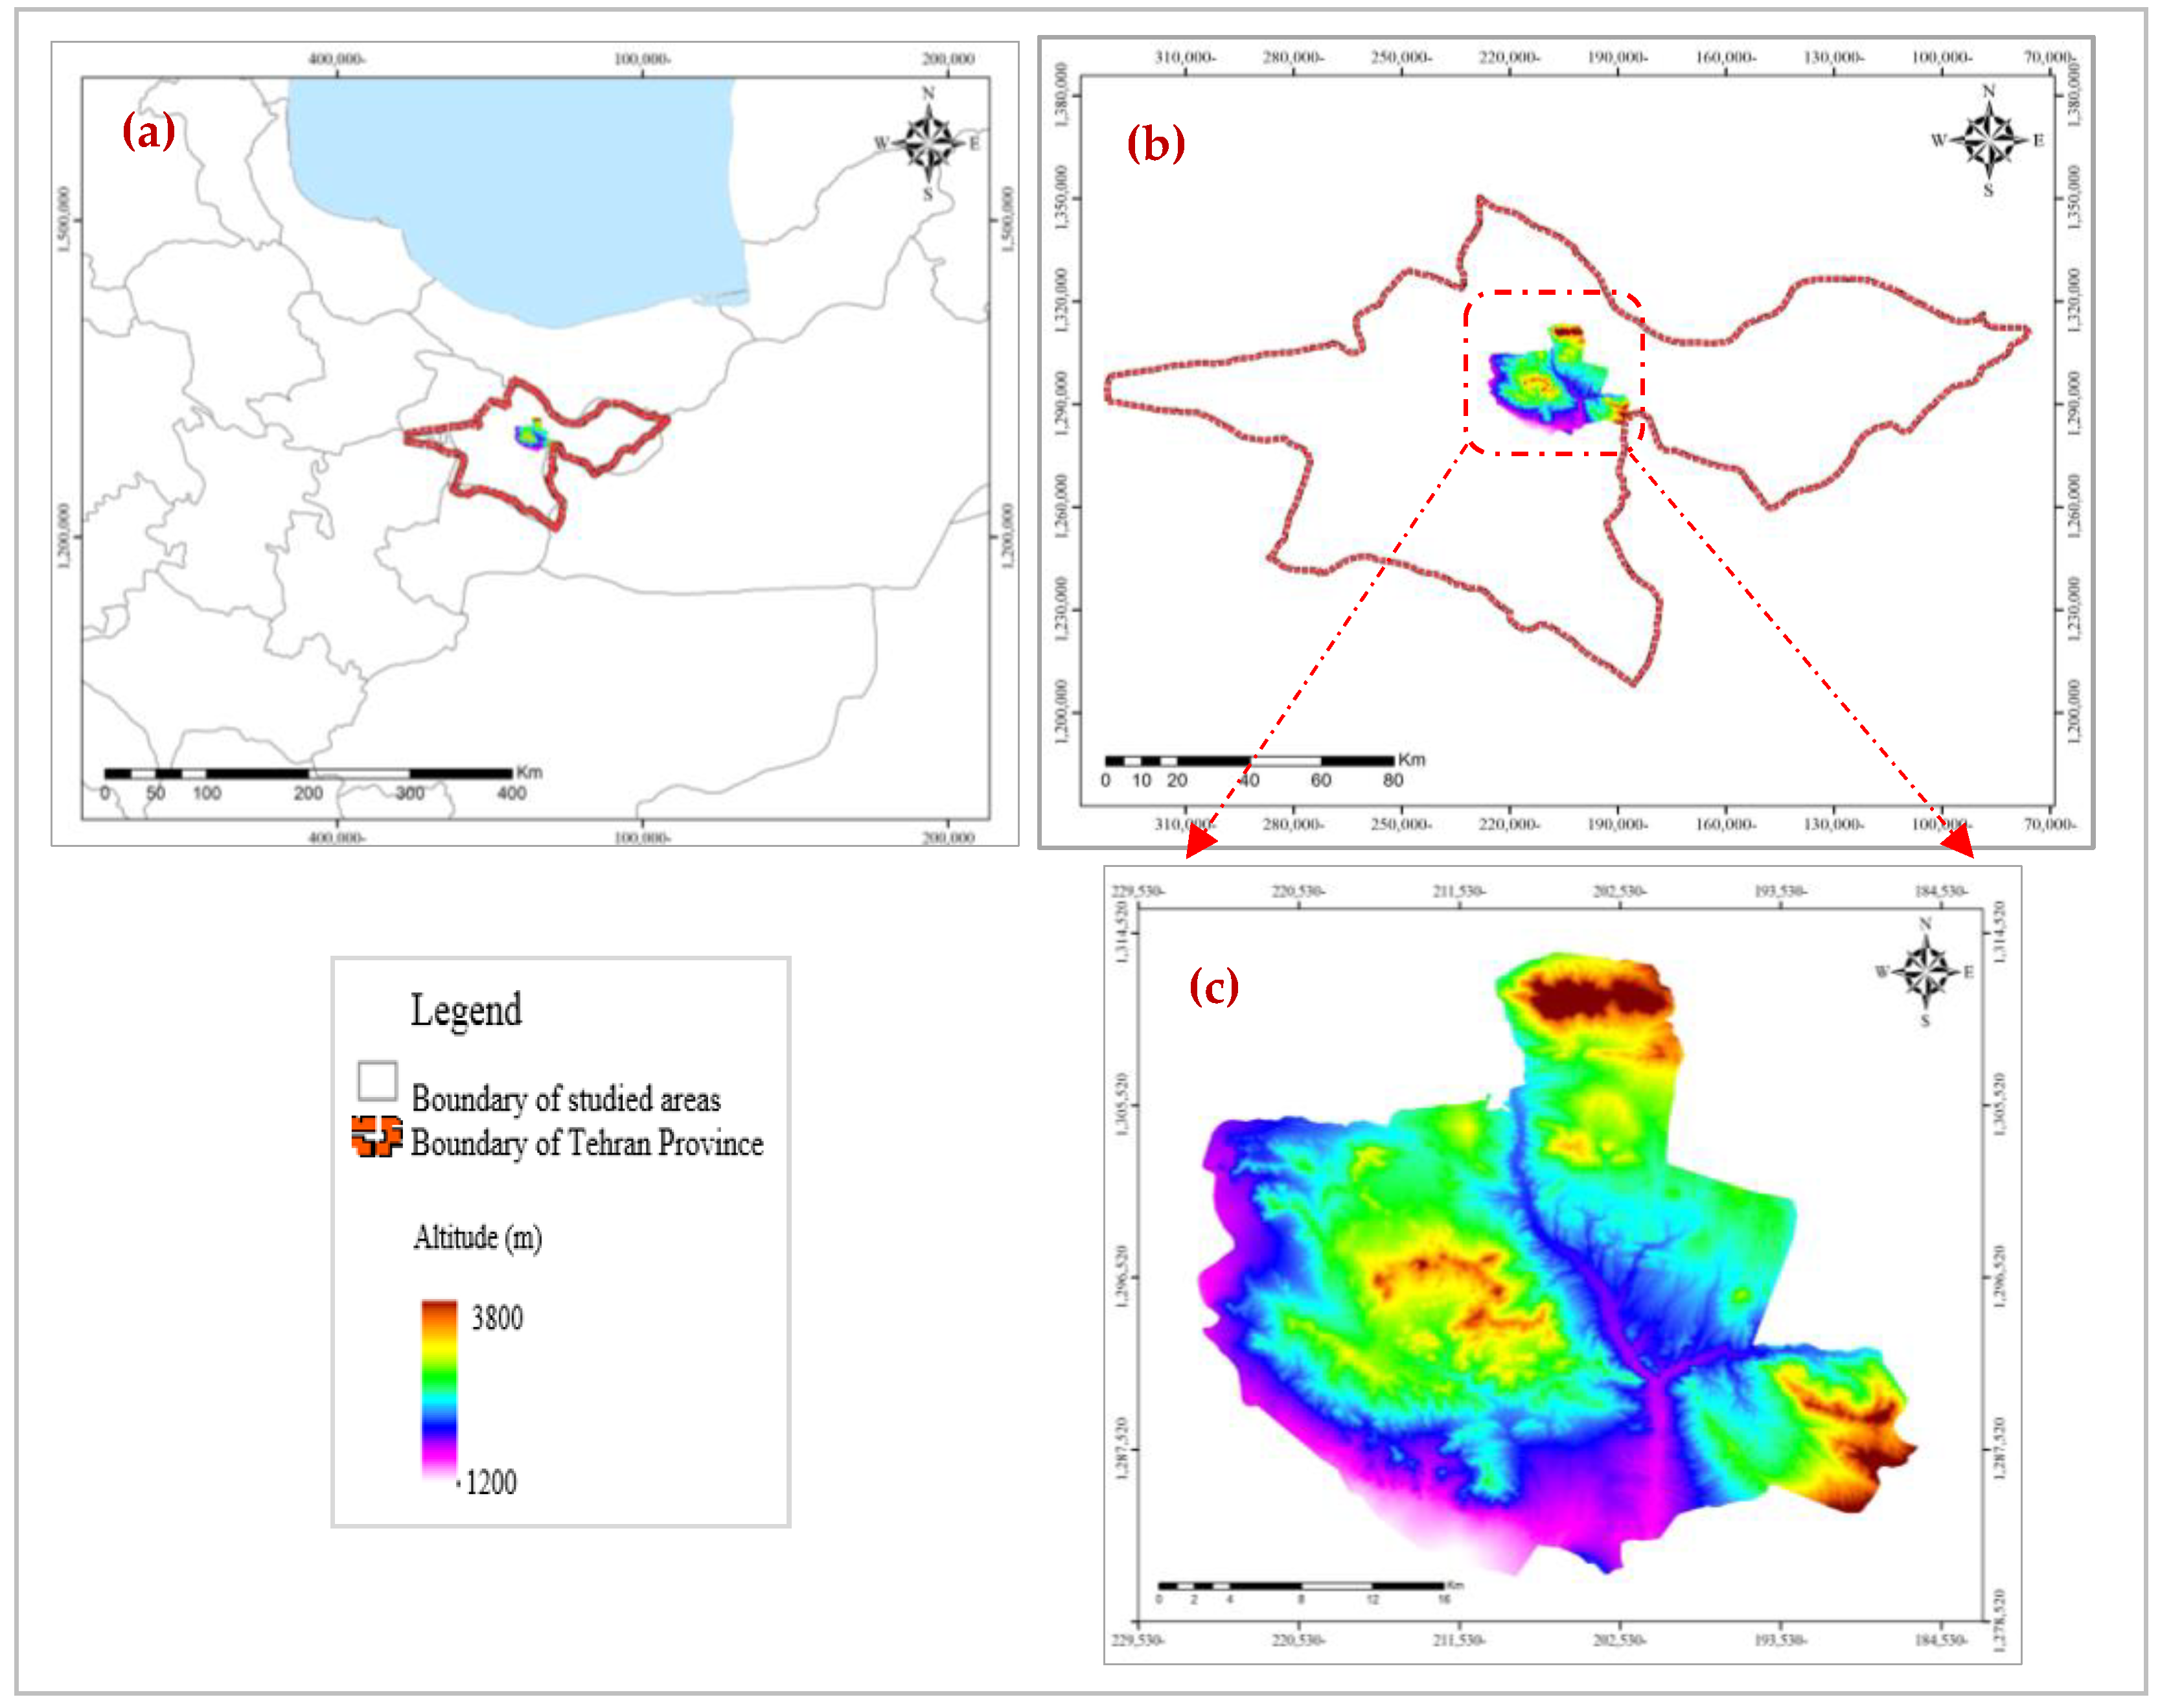
2.1. Study Area
2.2. Methods
2.2.1. EF Model
Measurement Unit
2.2.2. EF Account
2.2.3. Biological Resource Account
2.2.4. Freshwater Account
2.2.5. Energy Consumption Account
2.2.6. Environmental Pollution Account
2.2.7. Ecological Carrying Capacity (ECC)
2.2.8. Value of the EF Account
2.2.9. Value of the ECC
2.2.10. ED Calculation
2.2.11. Determining Ecological Pressure Index (EPI)
2.2.12. Data Collection and Classify Images
3. Results
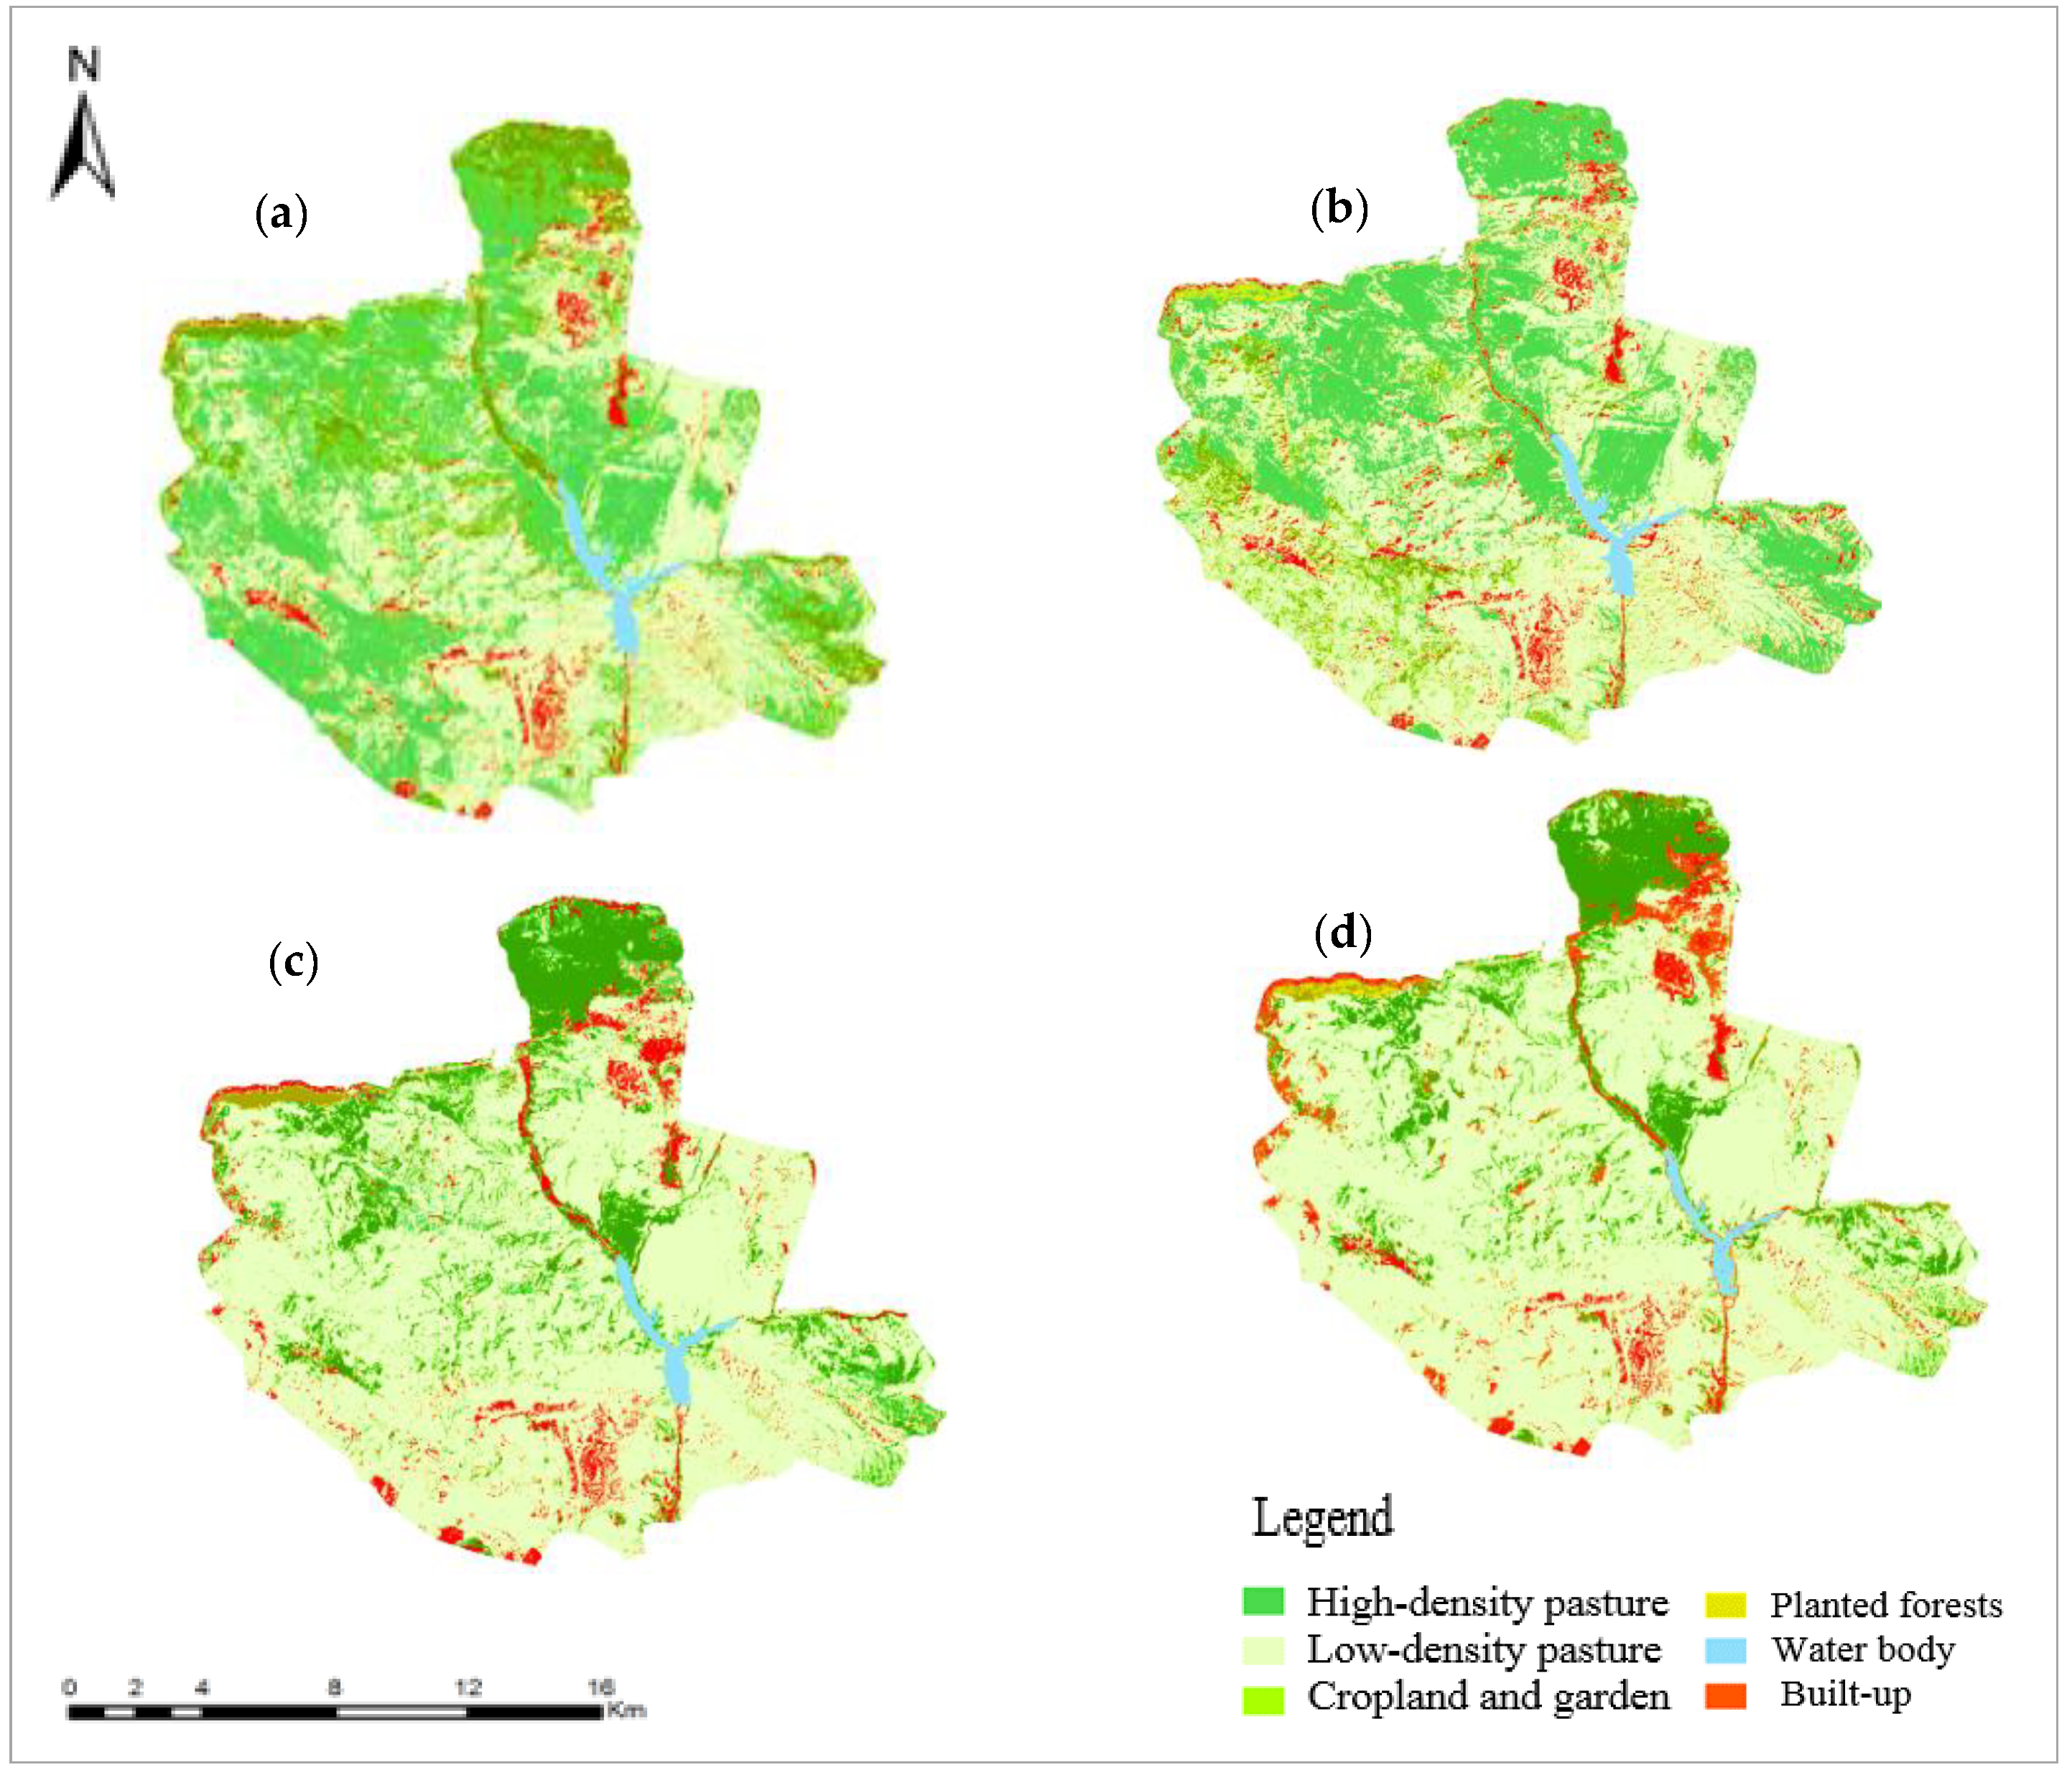
3.1. LULC Changes
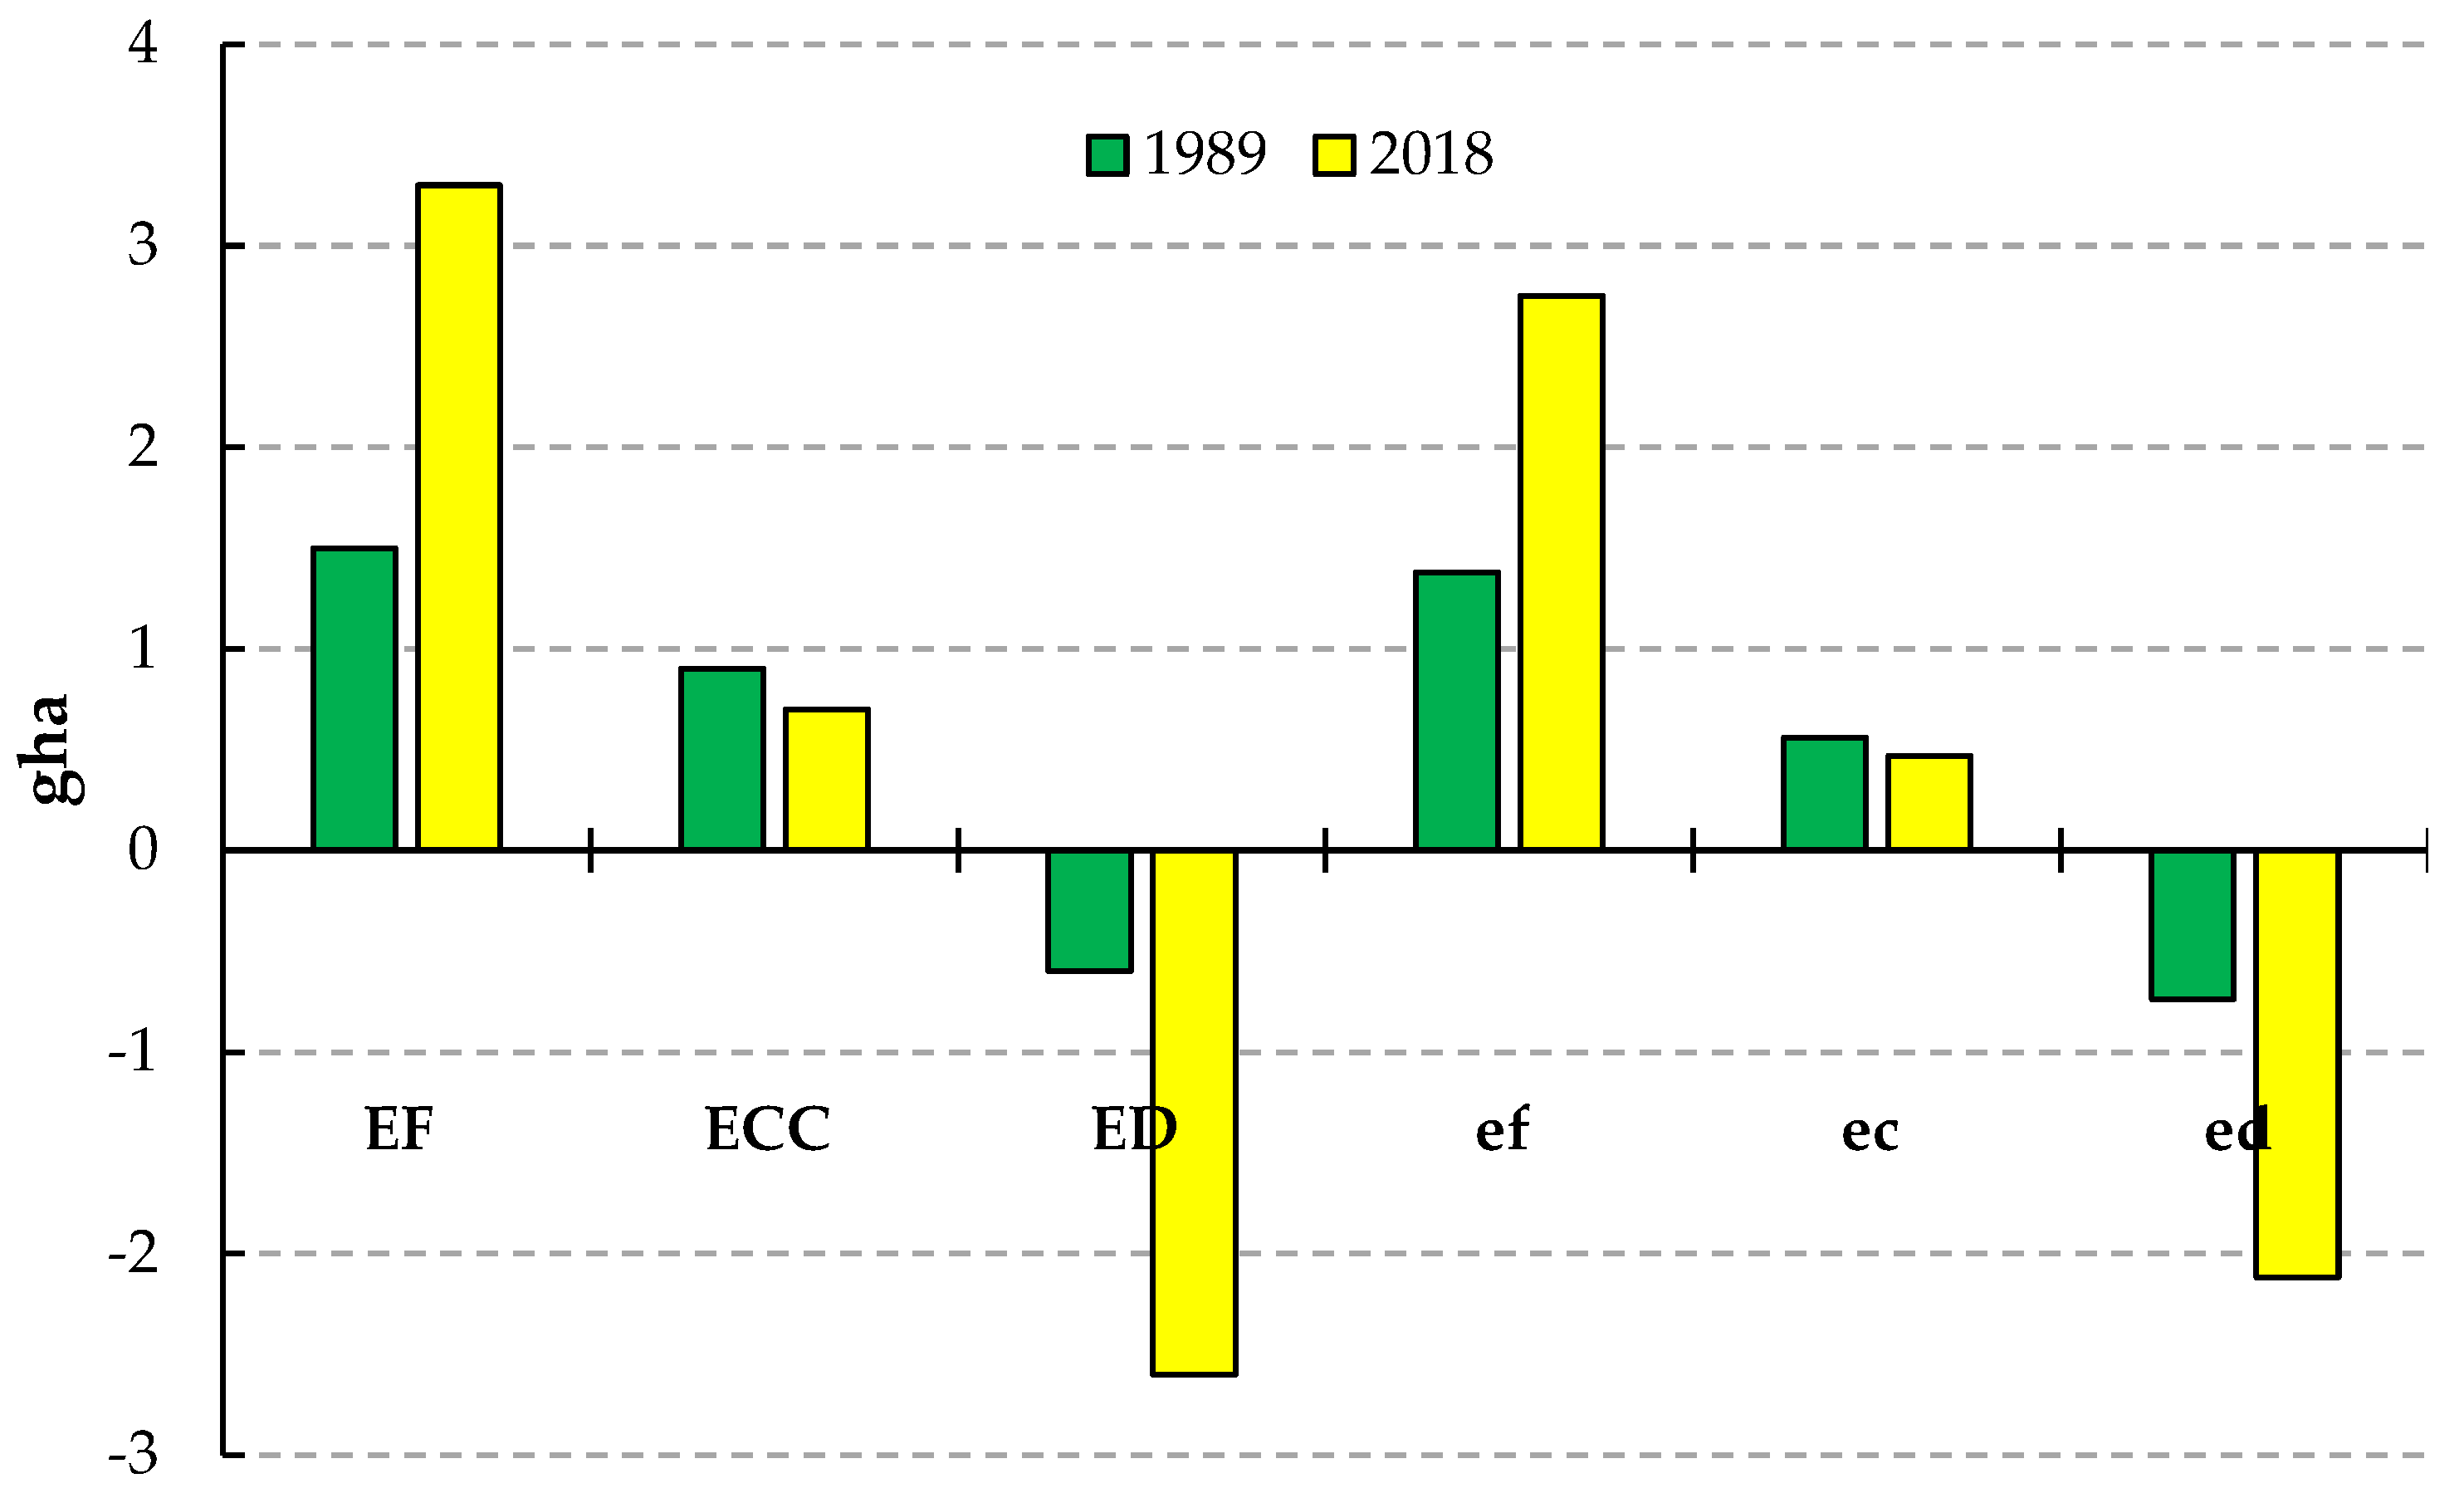
3.2. Dynamic Changes in EF, ECC, and ED Quantities
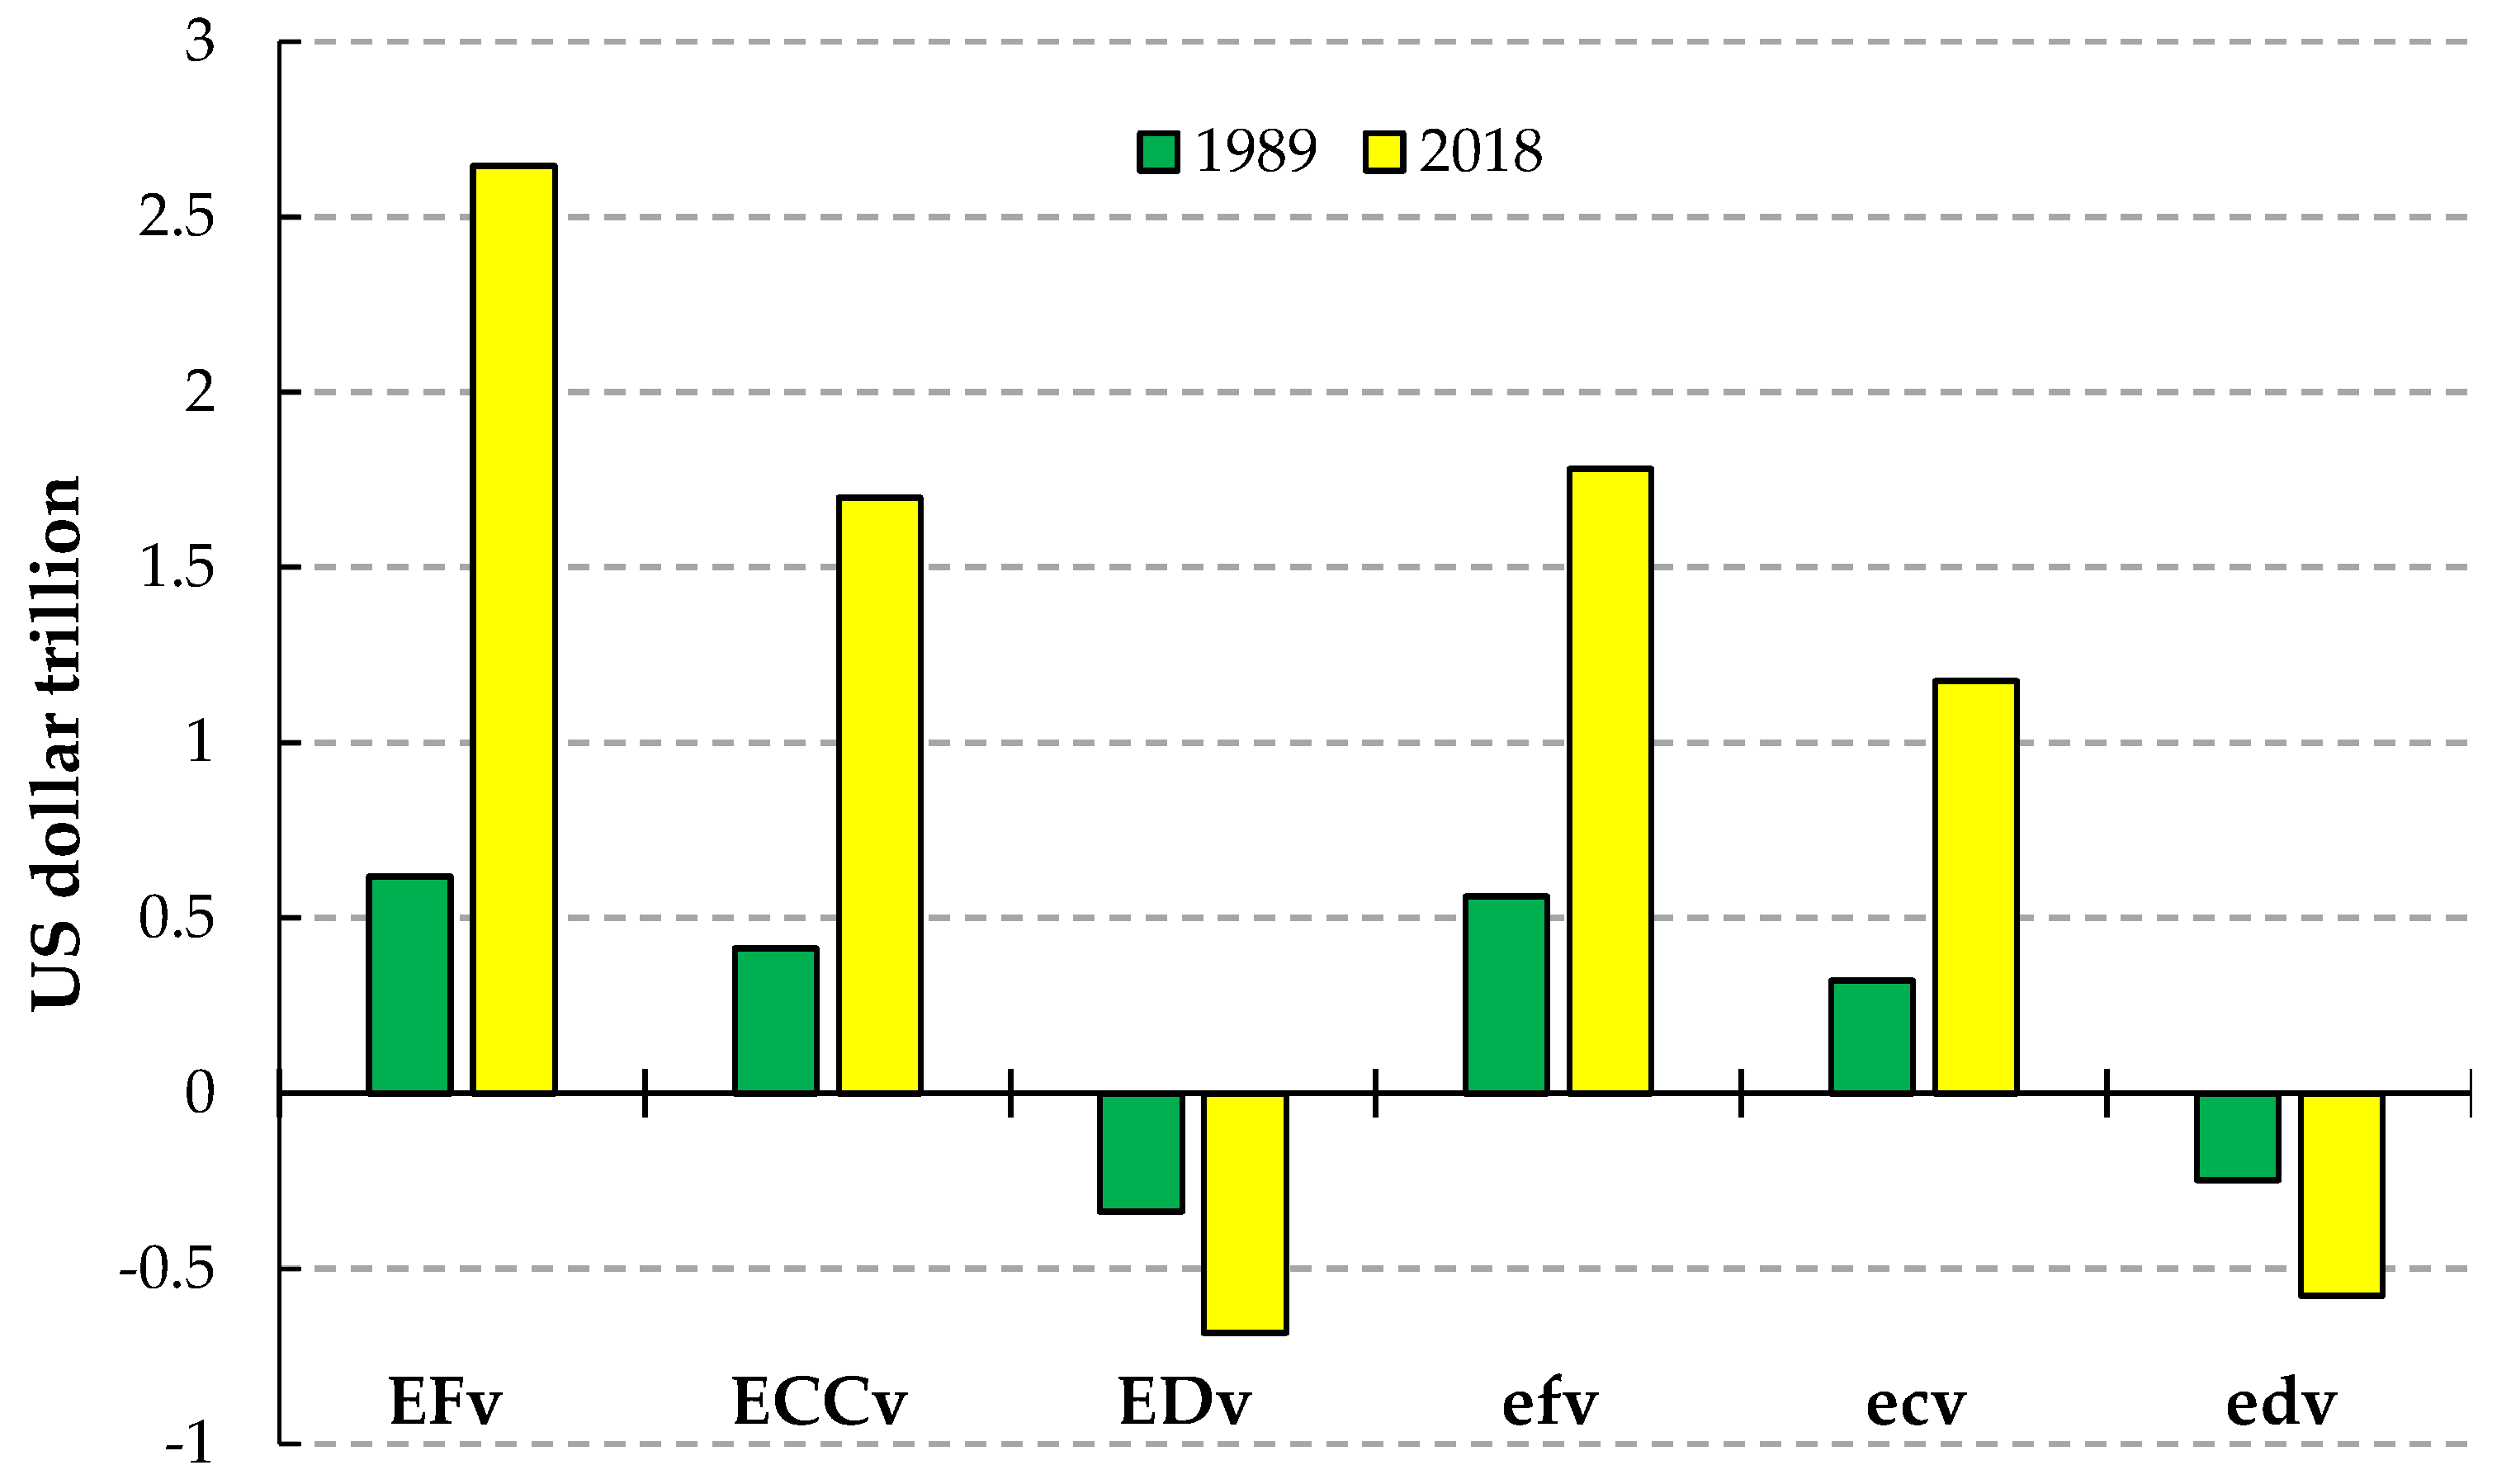
3.2.1. EF, ECC and ED Value Changes (Total and Per-Capita Quantities)
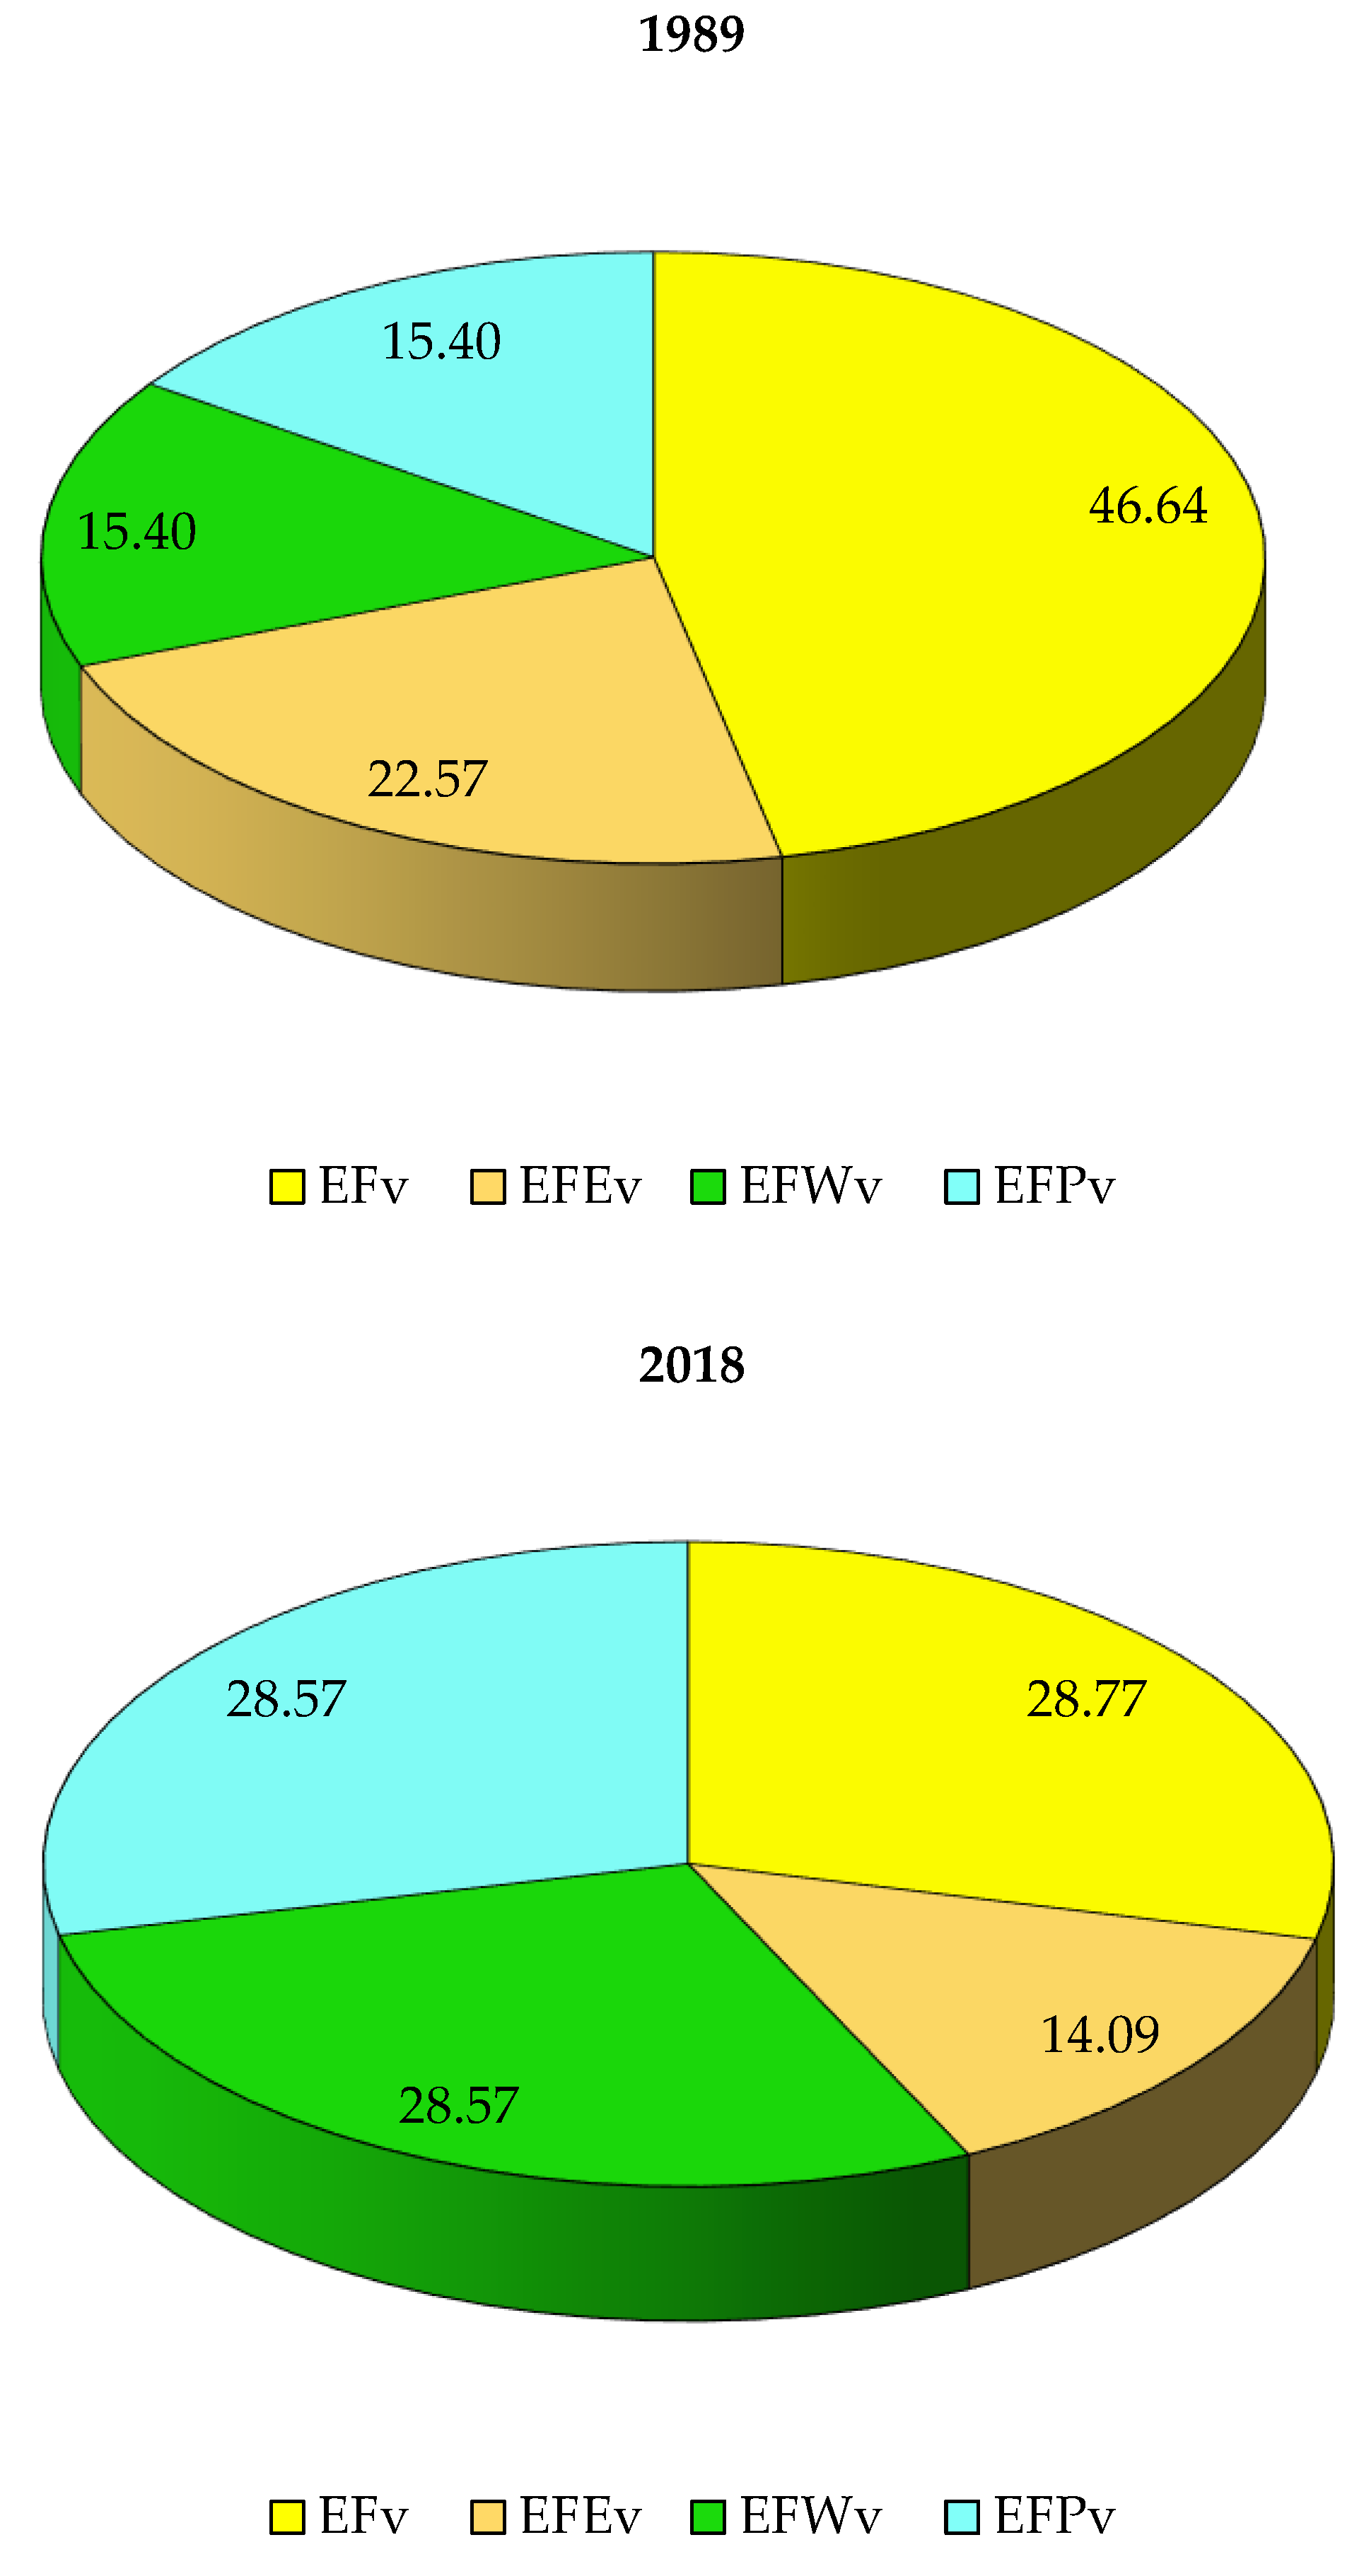
3.2.2. Analysis of the EF Value Quantities
3.3. Examination of the EPI
3.3.1. Investigation of Factors Affecting the EPI
3.3.2. Driving Factor Analysis per Identified Zones
4. Discussion
5. Conclusions
Author Contributions
Funding
Institutional Review Board Statement
Informed Consent Statement
Data Availability Statement
Acknowledgments
Conflicts of Interest
Abbreviations
| GDP | Gross Domestic Product |
| EFB | Bio-ecological footprint |
| BRA | Biological resources account |
| COD | Chemical oxygen demand |
| ECC | Ecological Carrying Capacity |
| ED | Ecological Deficit |
| EFE | Energy ecological footprint |
| EF | Ecological Footprint |
| EPI | Ecological Pressure Index |
| EFW | Freshwater ecological footprint |
| LULC | Land use/land cover |
| NDVI | Normalized Difference Vegetation Index |
| OA | Overall accuracy |
| EFP | Pollution ecological footprint |
| PA | Protected Area |
| RF | Random Forest |
| SDG | Sustainable Development Goal |
| USGS | United States Geological Survey |
References
- Polasky, S.; Daily, G. An Introduction to the Rconomics of Natural Capital. Rev. Environ. Econ. Policy 2021, 15, 87–94. [Google Scholar] [CrossRef]
- Dong, J.; Zhang, Z.; Zhang, H.; Gao, F.; Zhang, W.; Gong, W. Sustainable Utilization and Driving Mechanism of Natural Capital in Ecologically Fragile Areas: A Case Study of Ningxia. China Popul. Resour. Environ. 2021, 2, 162–173. [Google Scholar]
- Costanza, R.; Atkins, P.W.; Hernandez-Blanco, M.; Kubiszewski, I. Common Asset Trusts to Effectively Steward Natural Capital and Ecosystem Services at Multiple Scales. J. Environ. Manag. 2021, 280, 111801. [Google Scholar] [CrossRef] [PubMed]
- Fletcher, R.; Dressler, W.H.; Anderson, Z.R.; Büscher, B. Natural Capital Must be Defended: Green Growth as Neoliberal Biopolitics. J. Peasant Stud. 2019, 46, 1068–1095. [Google Scholar] [CrossRef]
- Sarkodie, S.A. Environmental Performance, Biocapacity, Carbon & Ecological Footprint of Nations: Drivers, Trends and Mitigation Options. Sci. Total Environ. 2021, 751, 141912. [Google Scholar]
- da Silva, M.X.; Paviolo, A.; Tambosi, L.R.; Pardini, R. Effectiveness of Protected Areas for Biodiversity Conservation: Mammal Occupancy Patterns in the Iguaçu National Park, Brazil. J. Nat. Conserv. 2018, 41, 51–62. [Google Scholar] [CrossRef]
- Watson, J.E.; Dudley, N.; Segan, D.B.; Hockings, M. The Performance and Potential of Protected Areas. Nature 2014, 515, 67–73. [Google Scholar] [CrossRef]
- Resende, F.M.; Cimon-Morin, J.; Poulin, M.; Meyer, L.; Joner, D.C.; Loyola, R. The Importance of Protected Areas and Indigenous Lands in Securing Ecosystem Services and Biodiversity in the Cerrado. Ecosyst. Serv. 2021, 49, 101282. [Google Scholar] [CrossRef]
- Sobhani, P.; Esmaeilzadeh, H.; Barghjelveh, S.; Sadeghi, S.M.M.; Marcu, M.V. Habitat Integrity in Protected Areas Threatened by LULC Changes and Fragmentation: A Case Study in Tehran Province, Iran. Land 2021, 11, 6. [Google Scholar] [CrossRef]
- Duro, J.A.; Lauk, C.; Kastner, T.; Erb, K.-H.; Haberl, H. Global Inequalities in Food Consumption, Cropland Demand and Land-Use Efficiency: A Decomposition Analysis. Glob. Environ. Chang. 2020, 64, 102124. [Google Scholar] [CrossRef]
- Mammides, C. A Global Analysis of the Drivers of Human Pressure Within Protected Areas at the National Level. Sustain. Sci. 2020, 15, 1223–1232. [Google Scholar] [CrossRef]
- Rees, W.E. Ecological Footprints and Appropriated Carrying Capacity: What Urban Economics Leaves Out. Environ. Urban. 1992, 4, 121–130. [Google Scholar] [CrossRef]
- Yang, Y.; Hu, D. Natural Capital Utilization Based on a Three-Dimensional Ecological Footprint Model: A Case Study in Northern Shaanxi, China. Ecol. Indic. 2018, 87, 178–188. [Google Scholar] [CrossRef]
- Wackernagel, M.; Rees, W.E. Perceptual and Structural Barriers to Investing in Natural Capital: Economics From an Ecological Footprint Perspective. Ecolog. Econ. 1997, 20, 3–24. [Google Scholar] [CrossRef]
- Ulucak, R.; Khan, S.U.-D. Determinants of the Ecological Footprint: Role of Renewable Energy, Natural Resources, and Urbanization. Sustain. Cities Soc. 2020, 54, 101996. [Google Scholar]
- Van den Bergh, J.C.; Grazi, F. Ecological Footprint Policy? Land Use as an Environmental Indicator. J. Ind. Ecol. 2014, 18, 10–19. [Google Scholar] [CrossRef]
- Li, P.; Zhang, R.; Wei, H.; Xu, L. Assessment of Physical Quantity and Value of Natural Capital in China since the 21st Century Based on a Modified Ecological Footprint Model. Sci. Total Environ. 2022, 806, 150676. [Google Scholar] [CrossRef]
- Zhang, F.; Zhu, F. Exploring the Temporal and Spatial Variability of Water and Land Resources Carrying Capacity Based on Ecological Footprint: A Case Study of the Beijing-Tianjin-Hebei Urban Agglomeration, China. Curr. Res. Environ. Sustain. 2022, 4, 100135. [Google Scholar] [CrossRef]
- Long, X.; Yu, H.; Sun, M.; Wang, X.-C.; Klemeš, J.J.; Xie, W.; Wang, C.; Li, W.; Wang, Y. Sustainability Evaluation Based on the Three-Dimensional Ecological Footprint and Human Development Index: A Case Study on the Four Island Regions in China. J. Environ. Manag. 2020, 265, 110509. [Google Scholar] [CrossRef]
- Wu, F.; Yang, X.; Shen, Z.; Bian, D.; Babuna, P. Exploring Sustainability and Decoupling Effects of Natural Capital Utilization in China: Evidence From a Provincial Three-Dimensional Ecological Footprint. J. Clean. Prod. 2021, 295, 126486. [Google Scholar] [CrossRef]
- Cohen, F.; Hepburn, C.J.; Teytelboym, A. Is Natural Capital Really Substitutable? Annu. Rev. Environ. Resour. 2019, 44, 425–448. [Google Scholar] [CrossRef]
- Galli, A.; Iha, K.; Pires, S.M.; Mancini, M.S.; Alves, A.; Zokai, G.; Lin, D.; Murthy, A.; Wackernagel, M. Assessing the Ecological Footprint and Biocapacity of Portuguese Cities: Critical Results for Environmental Awareness and Local Management. Cities 2020, 96, 102442. [Google Scholar] [CrossRef]
- Deljouei, A.; Abdi, E.; Marcantonio, M.; Majnounian, B.; Amici, V.; Sohrabi, H. The Impact of Forest Roads on Understory Plant Diversity in Temperate Hornbeam-Beech Forests of Northern Iran. Environ. Monito. Assess. 2017, 189, 392. [Google Scholar] [CrossRef] [PubMed]
- Wei, F.; Wang, S.; Fu, B.; Liu, Y. Representation of Biodiversity and Ecosystem Services in East Africa’s Protected Area Network. Ambio 2020, 49, 245–257. [Google Scholar] [CrossRef] [PubMed]
- Karamouz, M.; Teymoori, J.; Olyaei, M.A. A Spatial Non-Stationary Based Site Selection of Artificial Groundwater Recharge: A Case Study for Semi-Arid Regions. Water Resour. Manag. 2021, 35, 963–978. [Google Scholar] [CrossRef]
- Sobhani, P.; Esmaeilzadeh, H.; Sadeghi, S.M.M.; Marcu, M.V.; Wolf, I.D. Evaluating Ecotourism Sustainability Indicators for Protected Areas in Tehran, Iran. Forests 2022, 13, 740. [Google Scholar] [CrossRef]
- Zhao, J.; Ma, C.; Zhao, X.; Wang, X. Spatio-Temporal Dynamic Analysis of Sustainable Development in China Based on the Footprint Family. Int. J. Env. Res. Pub. Health 2018, 15, 246. [Google Scholar] [CrossRef]
- Sadeghi, S.M.M.; Attarod, P.; Pypker, T.G.; Dunkerley, D. Is Canopy Interception Increased in Semiarid Tree Plantations? Evidence from a Field Investigation in Tehran, Iran. Turk. J. Agric. For. 2014, 38, 792–806. [Google Scholar] [CrossRef]
- Nazari, M.; Sadeghi, S.M.M.; Van Stan II, J.T.; Chaichi, M.R. Rainfall Interception and Redistribution by Maize Farmland in Central Iran. J. Hydrol. Reg. Stud. 2020, 27, 100656. [Google Scholar] [CrossRef]
- Heshmatol Vaezin, S.M.; Juybari, M.M.; Daei, A.; Avatefi Hemmat, M.; Shirvany, A.; Tallis, M.J.; Hirabayashi, S.; Moeinaddini, M.; Hamidian, A.H.; Sadeghi, S.M.M.; et al. The Effectiveness of Urban Trees in Reducing Airborne Particulate Matter by Dry Deposition in Tehran, Iran. Environ. Monitor. Assess. 2021, 193, 842. [Google Scholar] [CrossRef]
- Dang, X.; Wu, Y.; Liu, G.; Yang, Q.; Yu, X.; Jia, Y. Spatial-Temporal Changes of Ecological Footprint in the Loess Plateau After Ecological Construction Between 1995 and 2010. Geogr. Res. 2018, 37, 761–771. [Google Scholar]
- Men, B.; Jiang, M. Research on Water Resources Carrying Capacity Based on Ecological Footprint: A Case Study of Beijing. South-North Water Transf. Water Sci. Technol. 2019, 17, 29–36. [Google Scholar]
- Monfreda, C.; Wackernagel, M.; Deumling, D. Establishing National Natural Capital Accounts Based on Detailed Ecological Footprint and Biological Capacity Assessments. Land Use Policy 2004, 21, 231–246. [Google Scholar] [CrossRef]
- Wang, Y.; Huang, X.; Gao, L.; Guo, B.; Ma, K. Preliminary Research on Quantitative Methods of Water Resources Carrying Capacity Based on Water Resources Balance Sheet. Proc. IAHS 2018, 379, 269–277. [Google Scholar] [CrossRef]
- Xie, H.; Chen, X.; Lin, K.; Hu, A. The Ecological Footprint Analysis of Fossil Energy and Electricity. Acta Ecol. Sin. 2008, 28, 1729–1735. [Google Scholar]
- Lee, Y.-J.; Chai, L.; Wu, P.-S. Taiwan’s Ecological Footprint and Overshoot Day. Sci. Rep. 2021, 11, 15068. [Google Scholar] [CrossRef]
- World Commission on Environment and Development. Our Common Future; Oxford University Press: New York, NY, USA, 1987. [Google Scholar]
- Niccolucci, V.; Coscieme, L.; Marchettini, N. Benefit Transfer and the Economic Value of Biocapacity: Introducing the Ecosystem Service Yield Factor. Ecosys. Serv. 2021, 48, 101256. [Google Scholar] [CrossRef]
- Nasiri, V.; Deljouei, A.; Moradi, F.; Sadeghi, S.M.M.; Borz, S.A. Land Use and Land Cover Mapping Using Sentinel-2, Landsat-8 Satellite Images, and Google Earth Engine: A Comparison of Two Composition Methods. Remote Sens. 2022, 14, 1977. [Google Scholar] [CrossRef]
- Esfandeh, S.; Danehkar, A.; Salmanmahiny, A.; Sadeghi, S.M.M.; Marcu, M.V. Climate Change Risk of Urban Growth and Land Use/Land Cover Conversion: An In-Depth Review of the Recent Research in Iran. Sustainability 2021, 14, 338. [Google Scholar] [CrossRef]
- Moradi, F.; Sadeghi, S.M.M.; Heidarlou, H.B.; Deljouei, A.; Boshkar, E.; Borz, S.A. Above-Ground Biomass Estimation in a Mediterranean Sparse Coppice Oak Forest Using Sentinel-2 Data. Ann. For. Res. 2022, 65, 165–182. [Google Scholar]
- Mehta, A.; Sinha, V.K.; Ayachit, G. Land-Use/Land-Cover Study Using Remote Sensing and GIS in an Arid Environment. Bull. Environ. Sci. Res. 2012, 1, 4–8. [Google Scholar]
- Singh, R.P.; Singh, N.; Singh, S.; Mukherjee, S. Normalized Difference Vegetation Index (NDVI) Based Classification to Assess the Change in Land Use/Land Cover (LULC) in Lower Assam, India. Int. J. Adv. Remote Sens. GIS 2016, 5, 1963–1970. [Google Scholar] [CrossRef]
- Ahmed, Z.; Asghar, M.M.; Malik, M.N.; Nawaz, K. Moving Towards a Sustainable Environment: The Dynamic Linkage between Natural Resources, Human Capital, Urbanization, Economic Growth, and Ecological Footprint in China. Resour. Policy 2020, 67, 101677. [Google Scholar] [CrossRef]
- Bi, M.; Xie, G.; Yao, C. Ecological Security Assessment Based on the Renewable Ecological Footprint in the Guangdong-Hong Kong-Macao Greater Bay Area, China. Ecolog. Indic. 2020, 116, 106432. [Google Scholar] [CrossRef]
- Anaya, F.C.; Espírito-Santo, M.M. Protected Areas and Territorial Exclusion of Traditional Communities. Ecol. Soc. 2018, 23, 8. [Google Scholar] [CrossRef]
- Gardner, C.J.; Nicoll, M.E.; Birkinshaw, C.; Harris, A.; Lewis, R.E.; Rakotomalala, D.; Ratsifandrihamanana, A.N. The Rapid Expansion of Madagascar’s Protected Area System. Biol. Conserv. 2018, 220, 29–36. [Google Scholar] [CrossRef]
- Hou, X.; Liu, J.; Zhang, D. Regional Sustainable Development: The Relationship between Natural Capital Utilization and Economic Development. Sustain. Dev. 2019, 27, 183–195. [Google Scholar] [CrossRef]
- Świąder, M.; Szewrański, S.; Kazak, J.K.; Van Hoof, J.; Lin, D.; Wackernagel, M.; Alves, A. Application of Ecological Footprint Accounting as a Part of an Integrated Assessment of Environmental Carrying Capacity: A Case Study of the Footprint of Food of a Large City. Resources 2018, 7, 52. [Google Scholar] [CrossRef] [Green Version]
- Sobhani, P.; Esmaeilzadeh, H.; Sadeghi, S.M.M.; Marcu, M.V. Estimation of Ecotourism Carrying Capacity for Sustainable Development of Protected Areas in Iran. Int. J. Environ. Res. Public Health 2022, 19, 1059. [Google Scholar] [CrossRef]
- Petroni, M.L.; Siqueira-Gay, J.; Gallardo, A.L.C.F. Understanding Land Use Change Impacts on Ecosystem Services within Urban Protected Areas. Landsc. Urban Plan. 2022, 223, 104404. [Google Scholar] [CrossRef]
- Rodríguez-Rodríguez, D.; Martínez-Vega, J. Protected Area Effectiveness Against Land Development in Spain. J. Environ. Manag. 2018, 215, 345–357. [Google Scholar] [CrossRef] [PubMed]
- Świąder, M.; Lin, D.; Szewrański, S.; Kazak, J.K.; Iha, K.; van Hoof, J.; Belčáková, I.; Altiok, S. The Application of Ecological Footprint and Biocapacity for Environmental Carrying Capacity Assessment: A New Approach for European Cities. Environ. Sci. Pol. 2020, 105, 56–74. [Google Scholar] [CrossRef]


| Factors | Indicators |
|---|---|
| Biological account |
|
| Freshwater account |
|
| Energy account |
|
| Pollution account |
|
| Prices of agricultural products |
|
| Prepared LULC Map | Year | |||
|---|---|---|---|---|
| 1989 | 1999 | 2009 | 2018 | |
| Overall accuracy | 0.87 | 0.92 | 0.85 | 0.95 |
| Classes | Year | Variation 1989–2018 | Decreasing/Increasing Trend | ||||||||
|---|---|---|---|---|---|---|---|---|---|---|---|
| 1989 | 1999 | 2009 | 2018 | ||||||||
| Area | |||||||||||
| ha | % | ha | % | ha | % | ha | % | ha | % | ||
| Built-up * | 7842 | 10.48 | 7963 | 10.64 | 8332 | 11.13 | 9023 | 12.06 | 1181 | 1.58 | + |
| Water body | 676 | 0.9 | 681 | 0.91 | 698 | 0.93 | 710 | 0.94 | 34 | 0.04 | + |
| Cropland and garden | 1724 | 2.30 | 1738 | 2.32 | 1744 | 2.33 | 1742 | 2.32 | 18 | 0.02 | + |
| High-density pasture | 29,241 | 39.08 | 29,212 | 39.04 | 29,150 | 38.94 | 28,528 | 38.13 | −713 | −0.95 | − |
| Low-density pasture | 33,574 | 44.87 | 33,474 | 44.74 | 33,193 | 44.36 | 33,122 | 44.27 | −452 | −0.6 | − |
| Planted forests | 1754 | 2.34 | 1743 | 2.33 | 1694 | 2.26 | 1686 | 2.25 | −68 | −0.09 | − |
| Sum total | 74,811 | 100 | 74,811 | 100 | 74,811 | 100 | 74,811 | 100 | --- | --- | − |
| Factors Affecting | Driving Factors | Independent Variable | Value |
|---|---|---|---|
| Natural capital | Per capita ecological carrying capacity (nha) | X1 | 4.18 |
| Resource consumption | Daily energy consumption (10,000 tce) | X2 | 2.67 |
| Daily water consumption (10,000 m3) | X3 | 2.88 | |
| Region size | Resident population (10,000 persons) | X4 | 2.90 |
| Level of built-up areas (km2) | X5 | 4.00 | |
| Economical development | GDP per capita (US dollar) | X6 | 2.84 |
| The added value of the industry (US dollar 100 million) | X7 | 3.35 | |
| Total sales of consumer goods (US dollar 100 million) | X8 | 2.75 | |
| Ecological construction | Artificial afforestation areas (1000 ha) | X9 | 2.90 |
| Recovered areas (1000 ha) | X10 | 3.26 | |
| Scientific advancement | Investment in biodiversity conservation projects and control development activities as a percentage of GDP (%) | X11 | 2.94 |
| Investment in science and research projects as a percentage of GDP (%) | X12 | 3.00 |
| Zone Classes | A | X1 | X2 | X3 | X4 | X5 | X6 | X7 | X8 | X9 | X10 | X11 | X12 | ||
|---|---|---|---|---|---|---|---|---|---|---|---|---|---|---|---|
| Strict nature reserve | 1 | 0.811 | 0.788 | 0.80 | 0.72 | 0.70 | 0.72 | 0.63 | 0.66 | 0.68 | 0.72 | 0.74 | 0.61 | 0.77 | 0.76 |
| Protected zone | 1 | 0.836 | 0.824 | 0.88 | 0.74 | 0.83 | 0.77 | 0.71 | 0.81 | 0.84 | 0.80 | 0.79 | 0.76 | 0.85 | 0.82 |
| Extensive use zone | 2 | 0.896 | 0.904 | 0.96 | 0.95 | 1.06 | 0.95 | 0.92 | 0.88 | 0.90 | 0.96 | 0.97 | 0.82 | 0.94 | 0.98 |
| Intensive use zone | 3 | 0.935 | 0.943 | 1.32 | 1.28 | 1.34 | 1.22 | 1.18 | 1.30 | 1.25 | 1.15 | 1.23 | 1.24 | 1.20 | 1.27 |
| Recovery zone | 4 | 0.920 | 0.936 | 1.03 | 0.96 | 1.05 | 0.90 | 0.88 | 0.94 | 1.06 | 1.08 | 1.12 | 1.10 | 0.92 | 1.01 |
| Special use zone | 3 | 0.901 | 0.887 | 1.06 | 1.05 | 1.02 | 1.08 | 1.11 | 0.92 | 0.94 | 1.02 | 1.04 | 1.01 | 1.08 | 1.07 |
| Buffer zone | 3 | 0.918 | 0.896 | 0.97 | 0.93 | 0.94 | 0.92 | 0.87 | 0.90 | 0.95 | 0.88 | 0.95 | 1.08 | 1.02 | 0.98 |
| Multiple use zone | 4 | 0.945 | 0.956 | 1.23 | 1.18 | 1.26 | 1.11 | 1.15 | 1.06 | 1.05 | 1.20 | 1.04 | 1.13 | 1.08 | 1.22 |
| Common protection zone | 2 | 0.882 | 0.894 | 0.94 | 0.95 | 0.92 | 0.90 | 0.93 | 1.05 | 1.01 | 0.98 | 0.85 | 0.87 | 0.90 | 0.87 |
Publisher’s Note: MDPI stays neutral with regard to jurisdictional claims in published maps and institutional affiliations. |
© 2022 by the authors. Licensee MDPI, Basel, Switzerland. This article is an open access article distributed under the terms and conditions of the Creative Commons Attribution (CC BY) license (https://creativecommons.org/licenses/by/4.0/).
Share and Cite
Sobhani, P.; Esmaeilzadeh, H.; Sadeghi, S.M.M.; Wolf, I.D.; Esmaeilzadeh, Y.; Deljouei, A. Assessing Spatial and Temporal Changes of Natural Capital in a Typical Semi-Arid Protected Area Based on an Ecological Footprint Model. Sustainability 2022, 14, 10956. https://doi.org/10.3390/su141710956
Sobhani P, Esmaeilzadeh H, Sadeghi SMM, Wolf ID, Esmaeilzadeh Y, Deljouei A. Assessing Spatial and Temporal Changes of Natural Capital in a Typical Semi-Arid Protected Area Based on an Ecological Footprint Model. Sustainability. 2022; 14(17):10956. https://doi.org/10.3390/su141710956
Chicago/Turabian StyleSobhani, Parvaneh, Hassan Esmaeilzadeh, Seyed Mohammad Moein Sadeghi, Isabelle D. Wolf, Yaghoub Esmaeilzadeh, and Azade Deljouei. 2022. "Assessing Spatial and Temporal Changes of Natural Capital in a Typical Semi-Arid Protected Area Based on an Ecological Footprint Model" Sustainability 14, no. 17: 10956. https://doi.org/10.3390/su141710956