
Image Information Contribution Evaluation for Plant Diseases Classification via Inter-Class Similarity


Abstract
:1. Introduction
- (1)
- We propose an image information contribution evaluation method, which focuses on the inter-class similarity, defines the images located on the decision boundary between high similarity classes as high contribution images. This can effectively alleviate the problem of inaccurate fine-grained classification of plant disease identification.
- (2)
- We combine the image information contribution evaluation method with the active learning image selection strategy, which can effectively solve the problem of insufficient data for plant disease identification.
- (3)
- We have carried out experiments on plant disease datasets. This method has achieved better experimental results than the traditional active learning methods. It can also achieve better experimental results with fewer data, which can provide guidance for the collection and annotation of plant disease datasets.
2. Materials
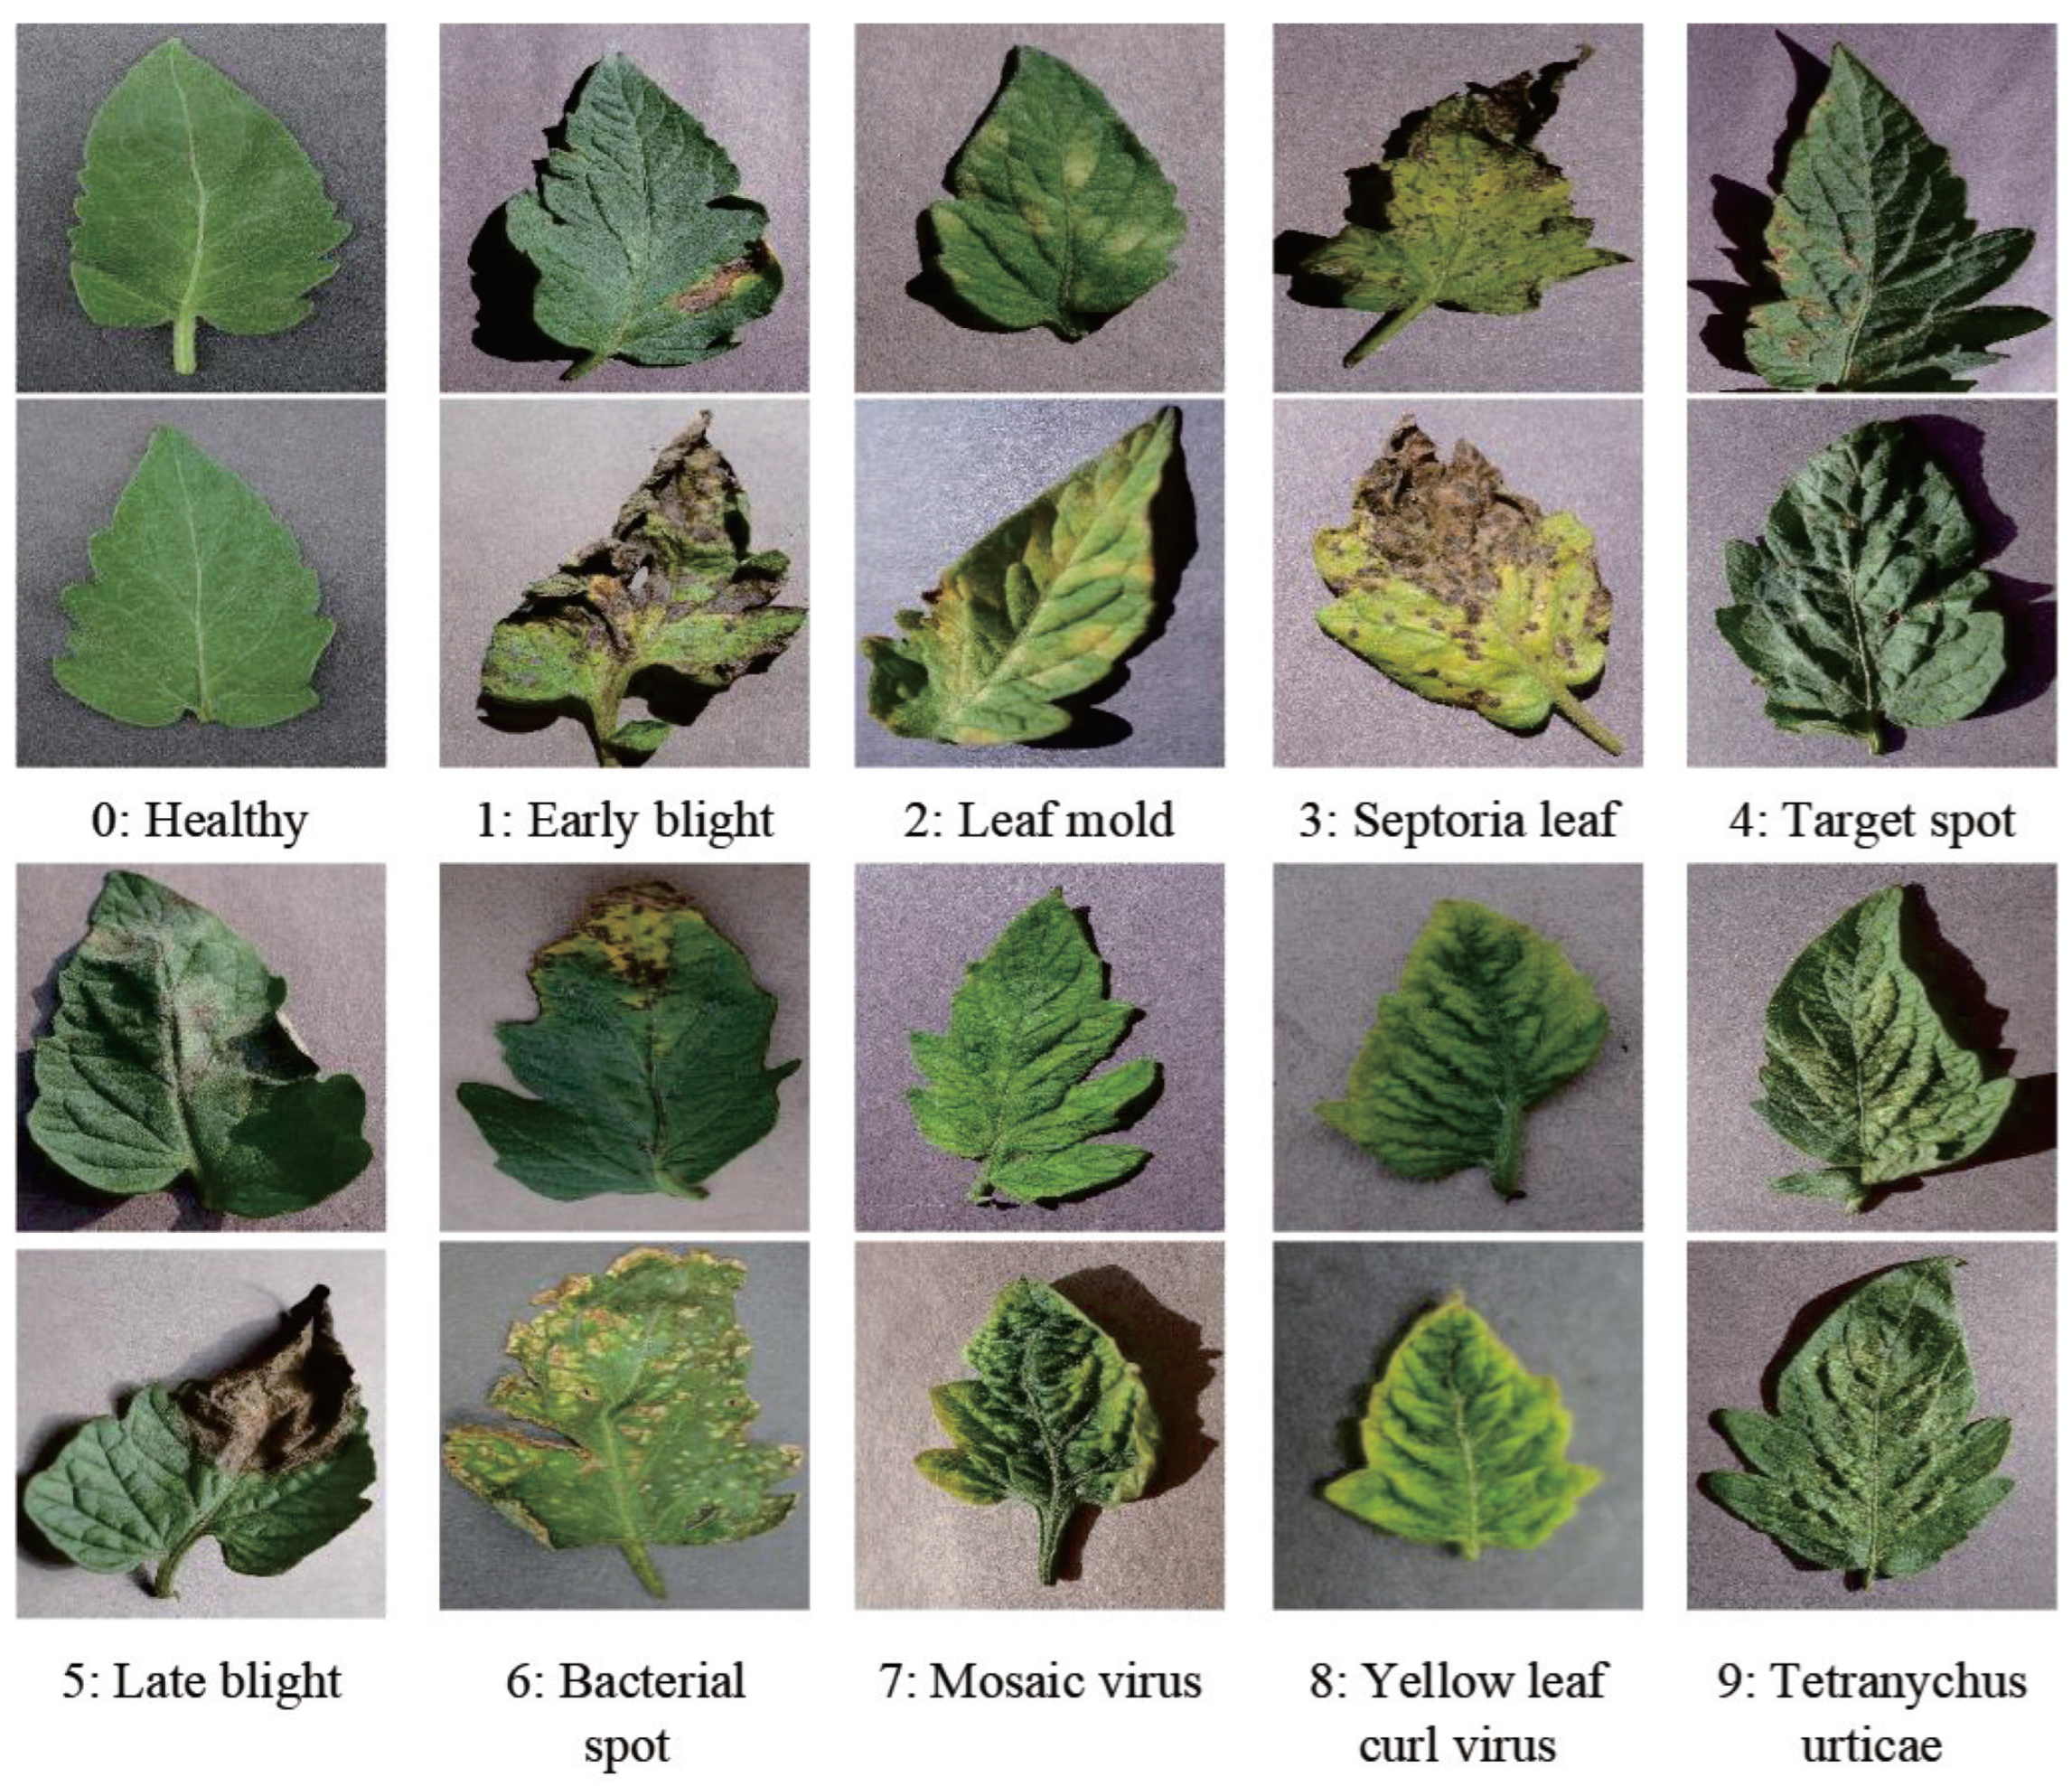
2.1. Dataset
2.2. Dataset Segmentation
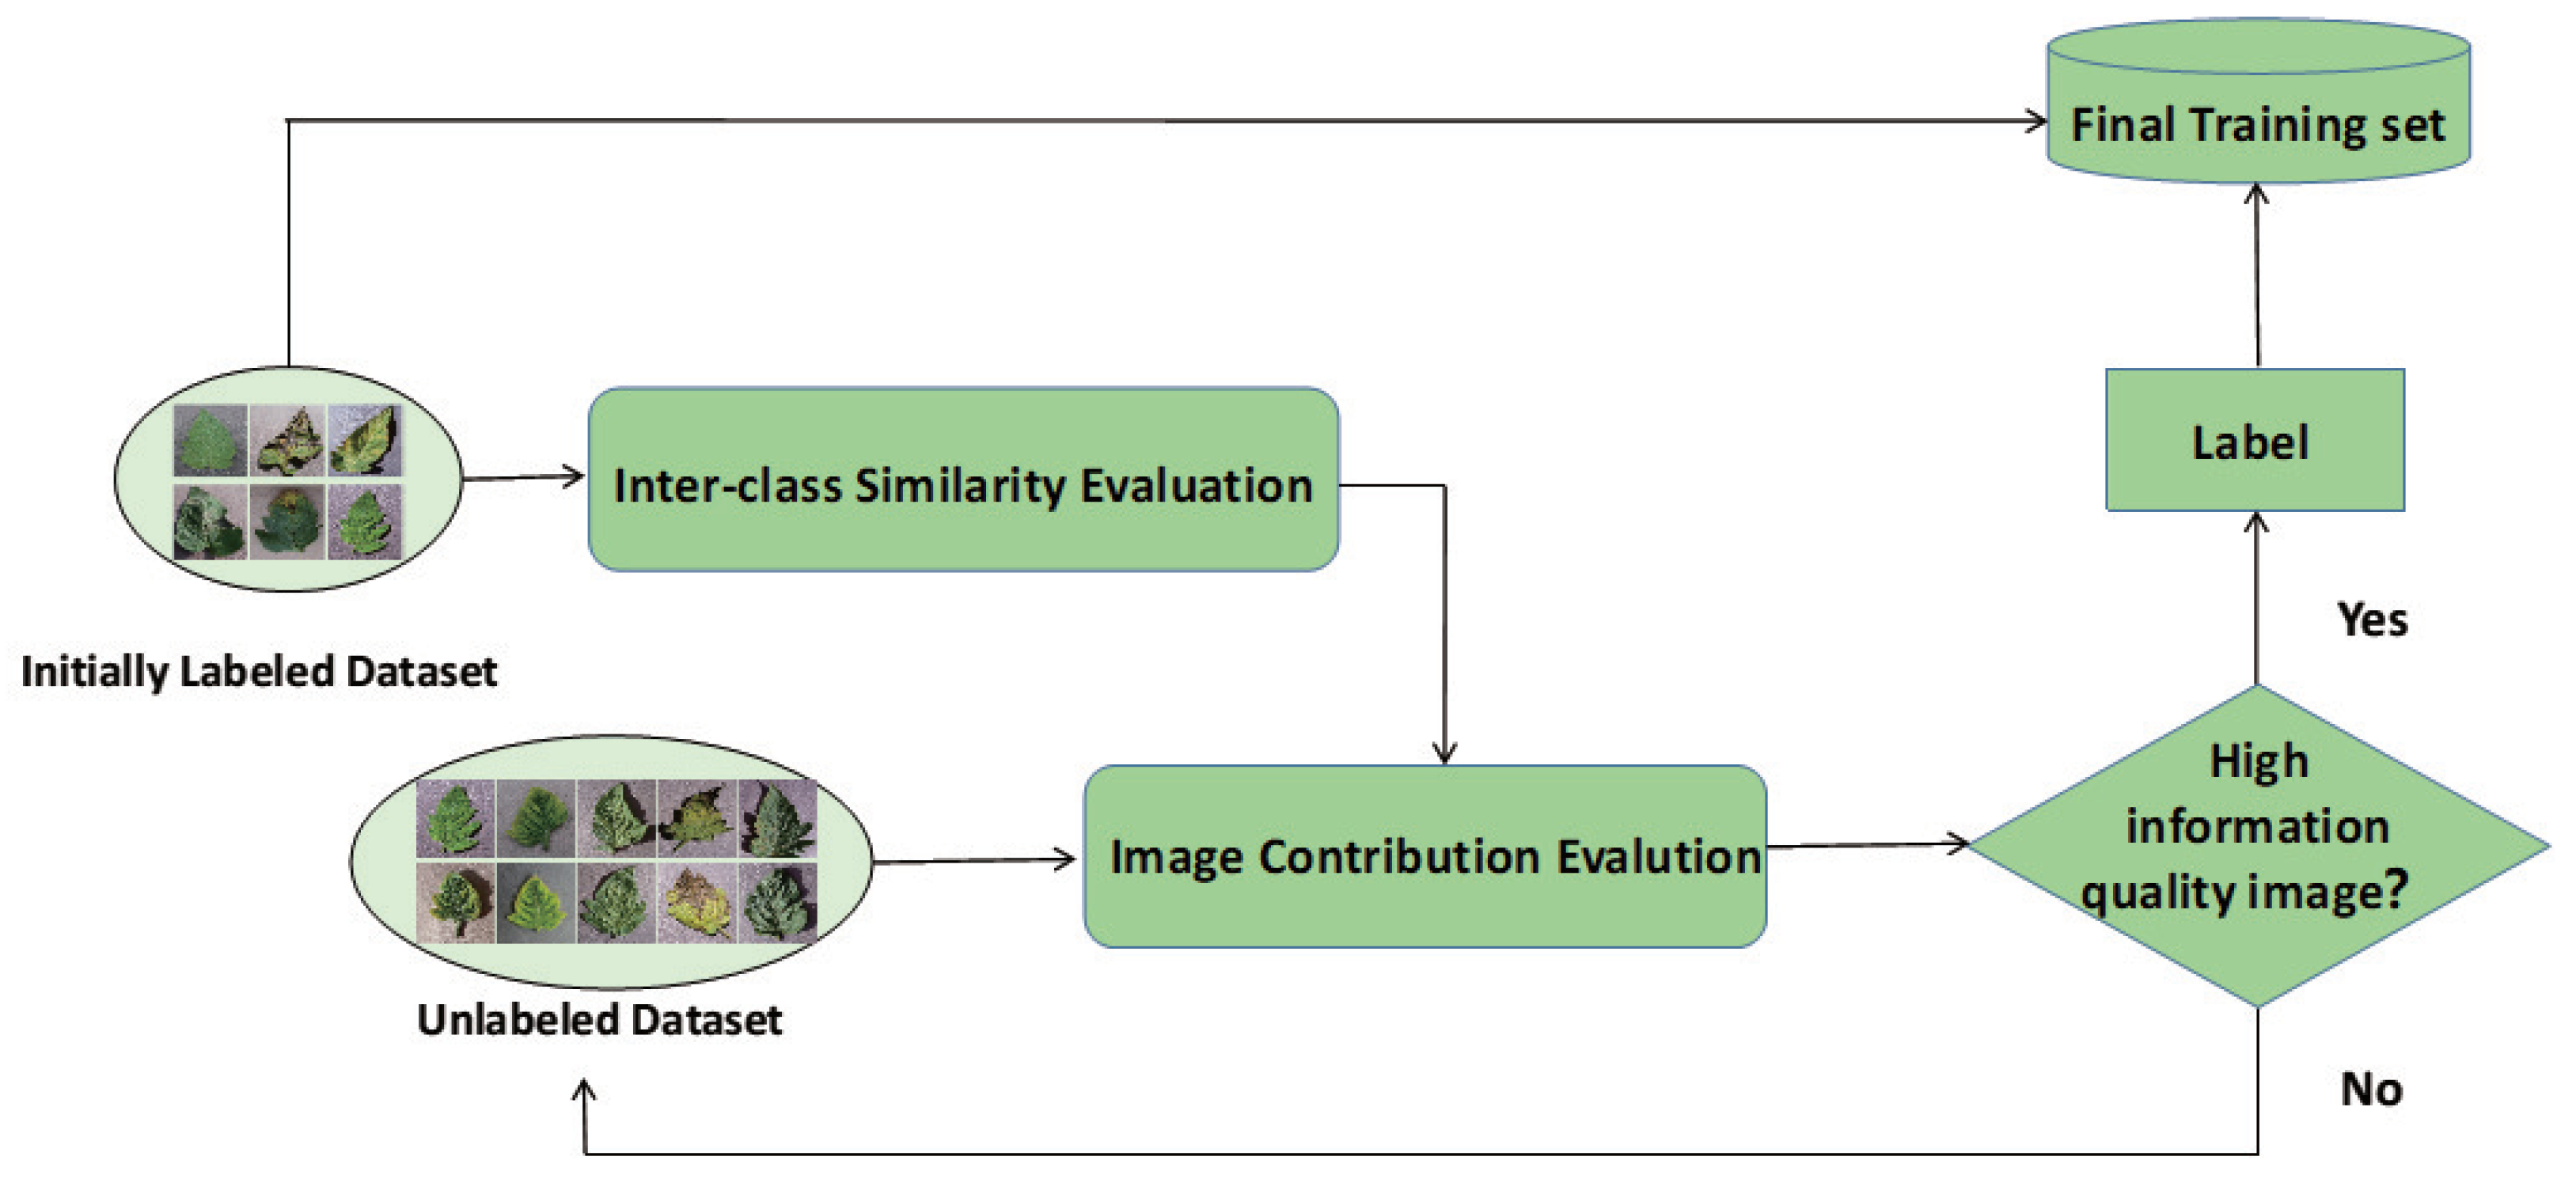
3. The Proposed Method
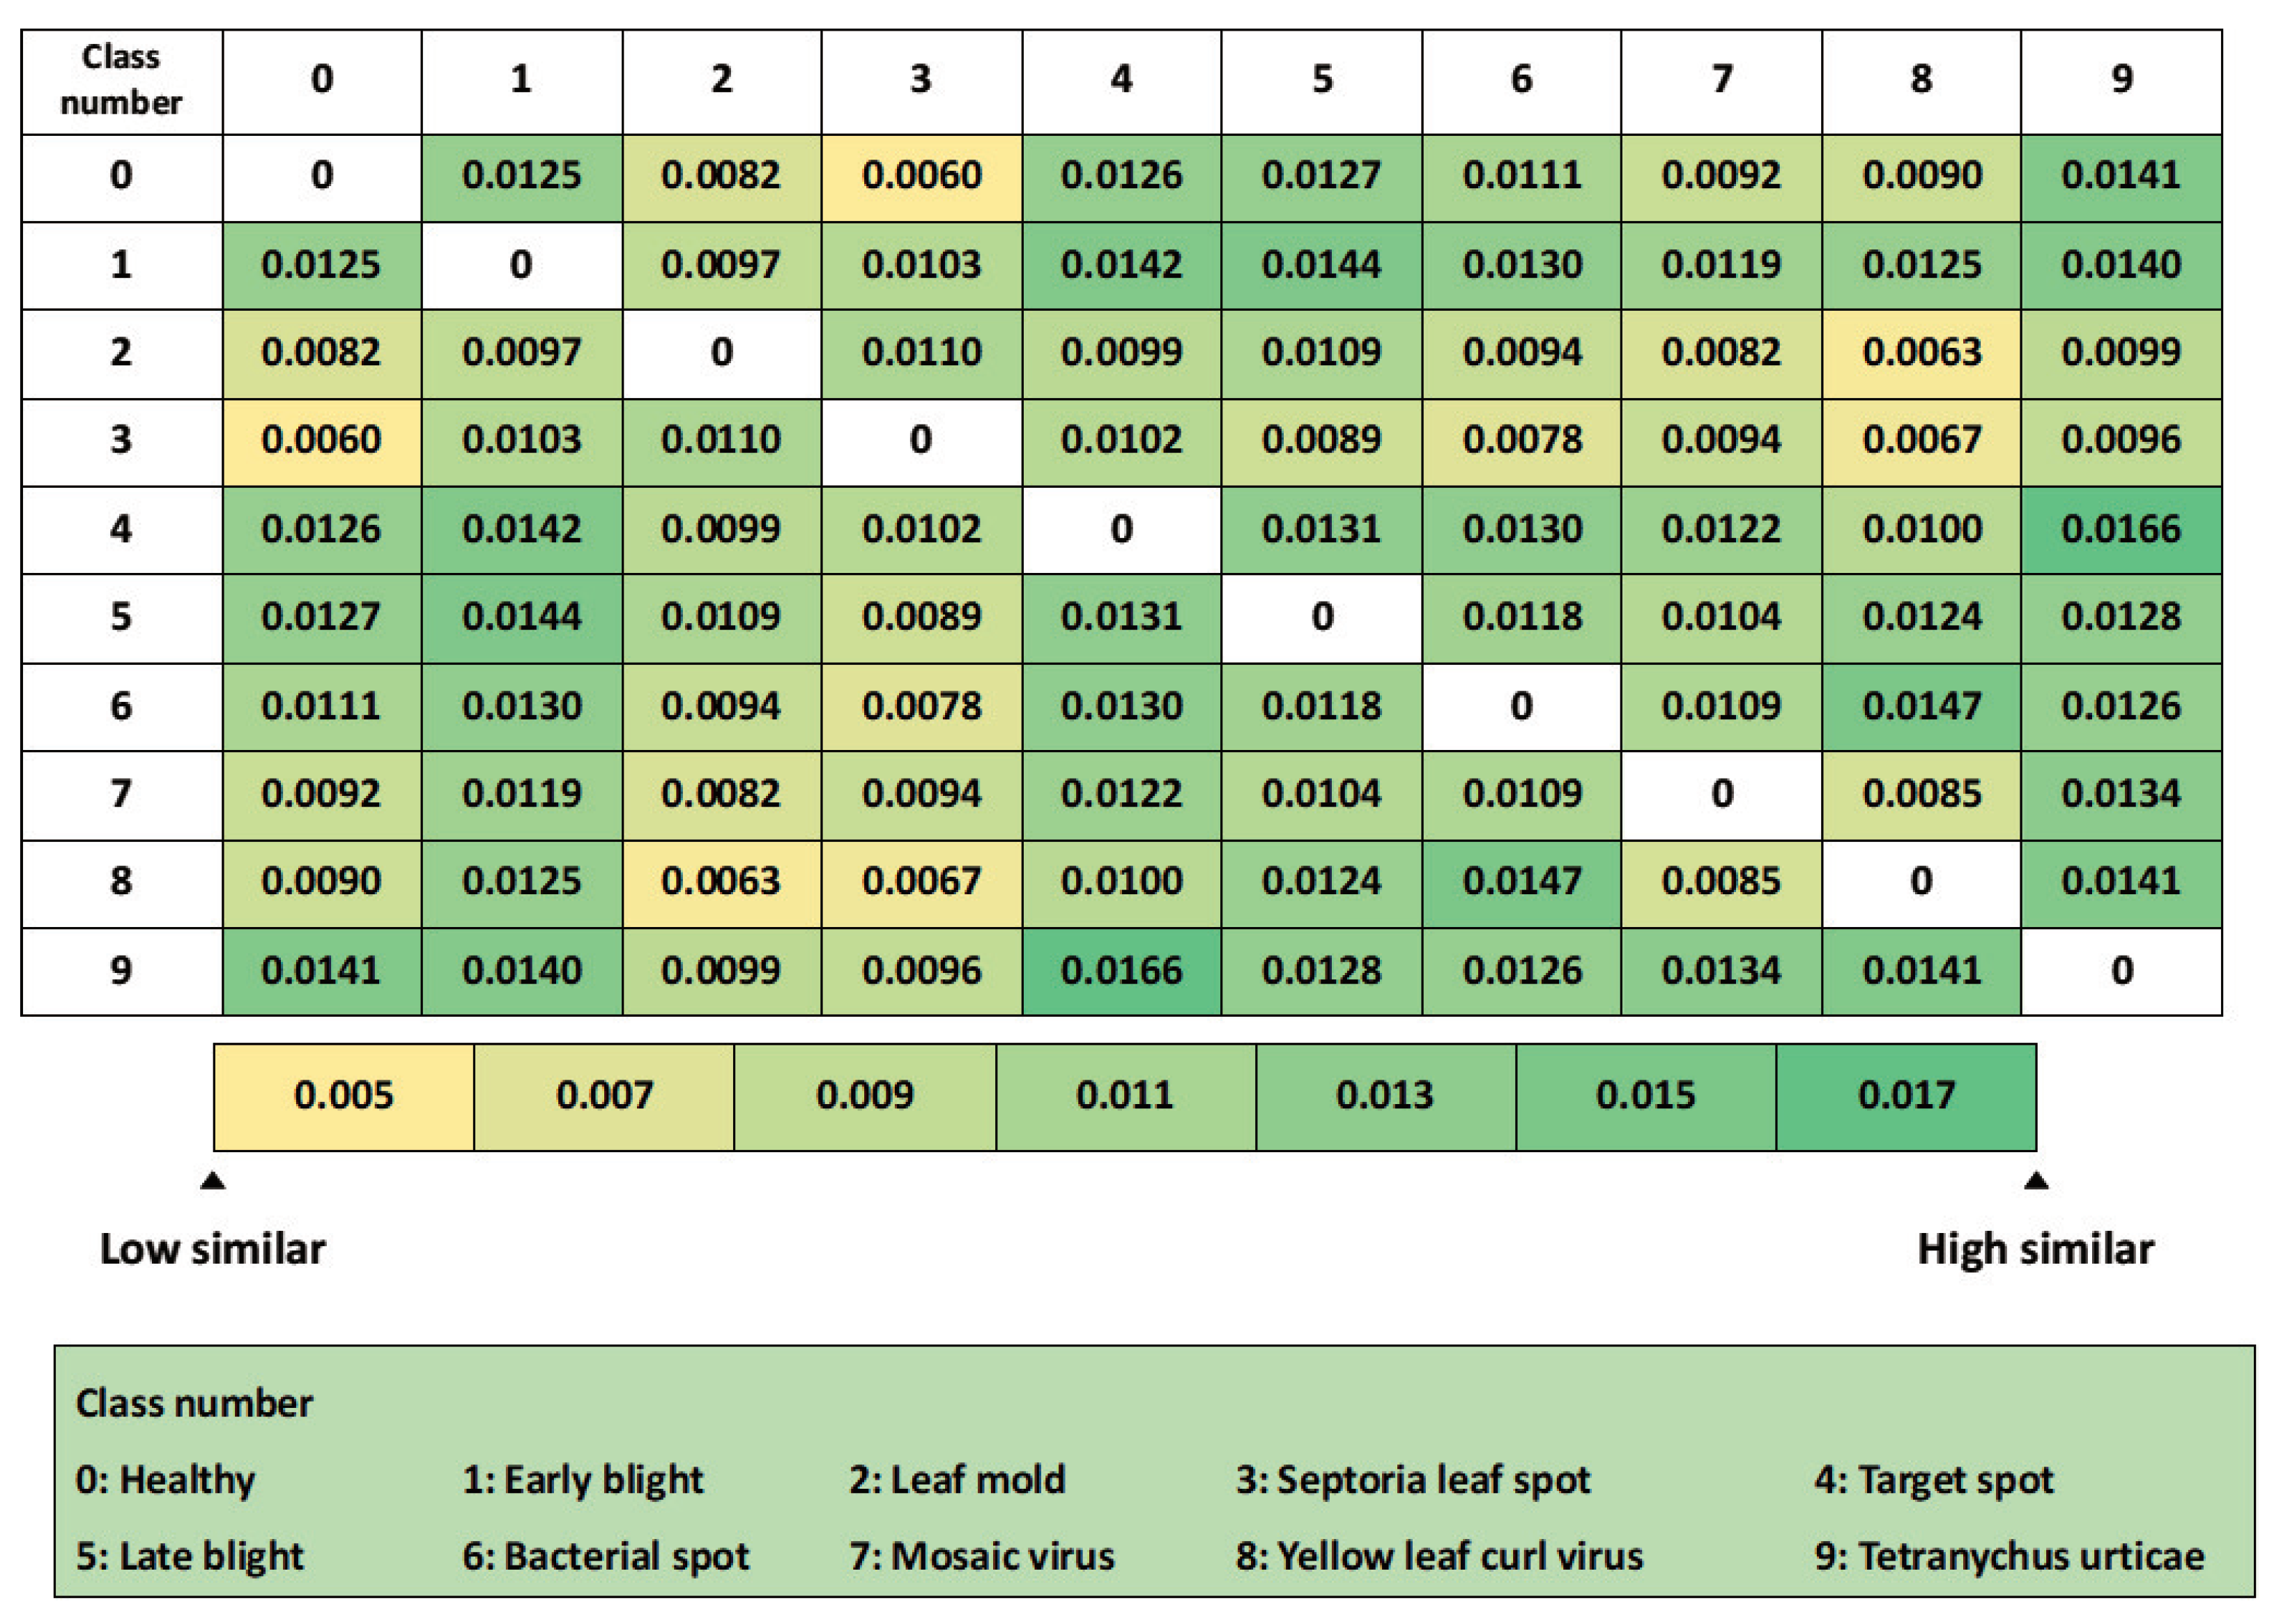
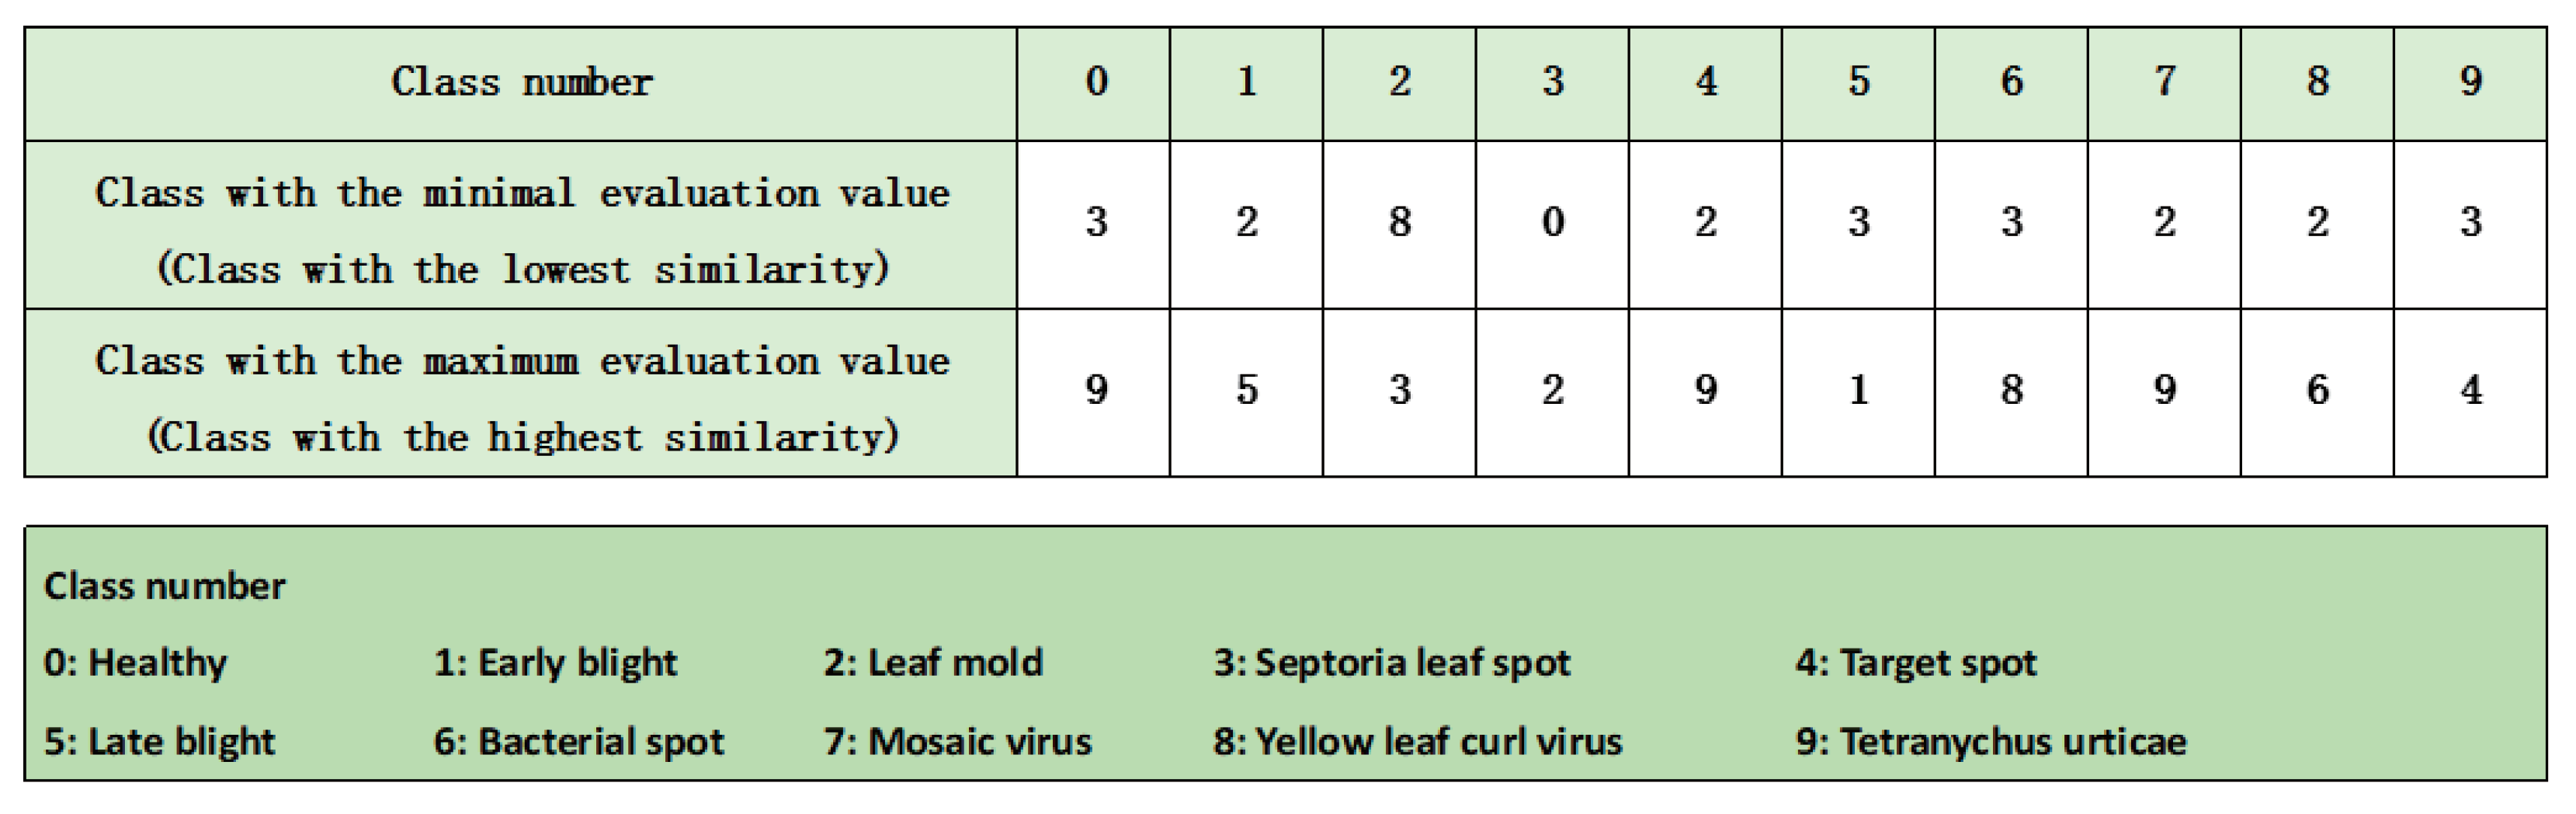
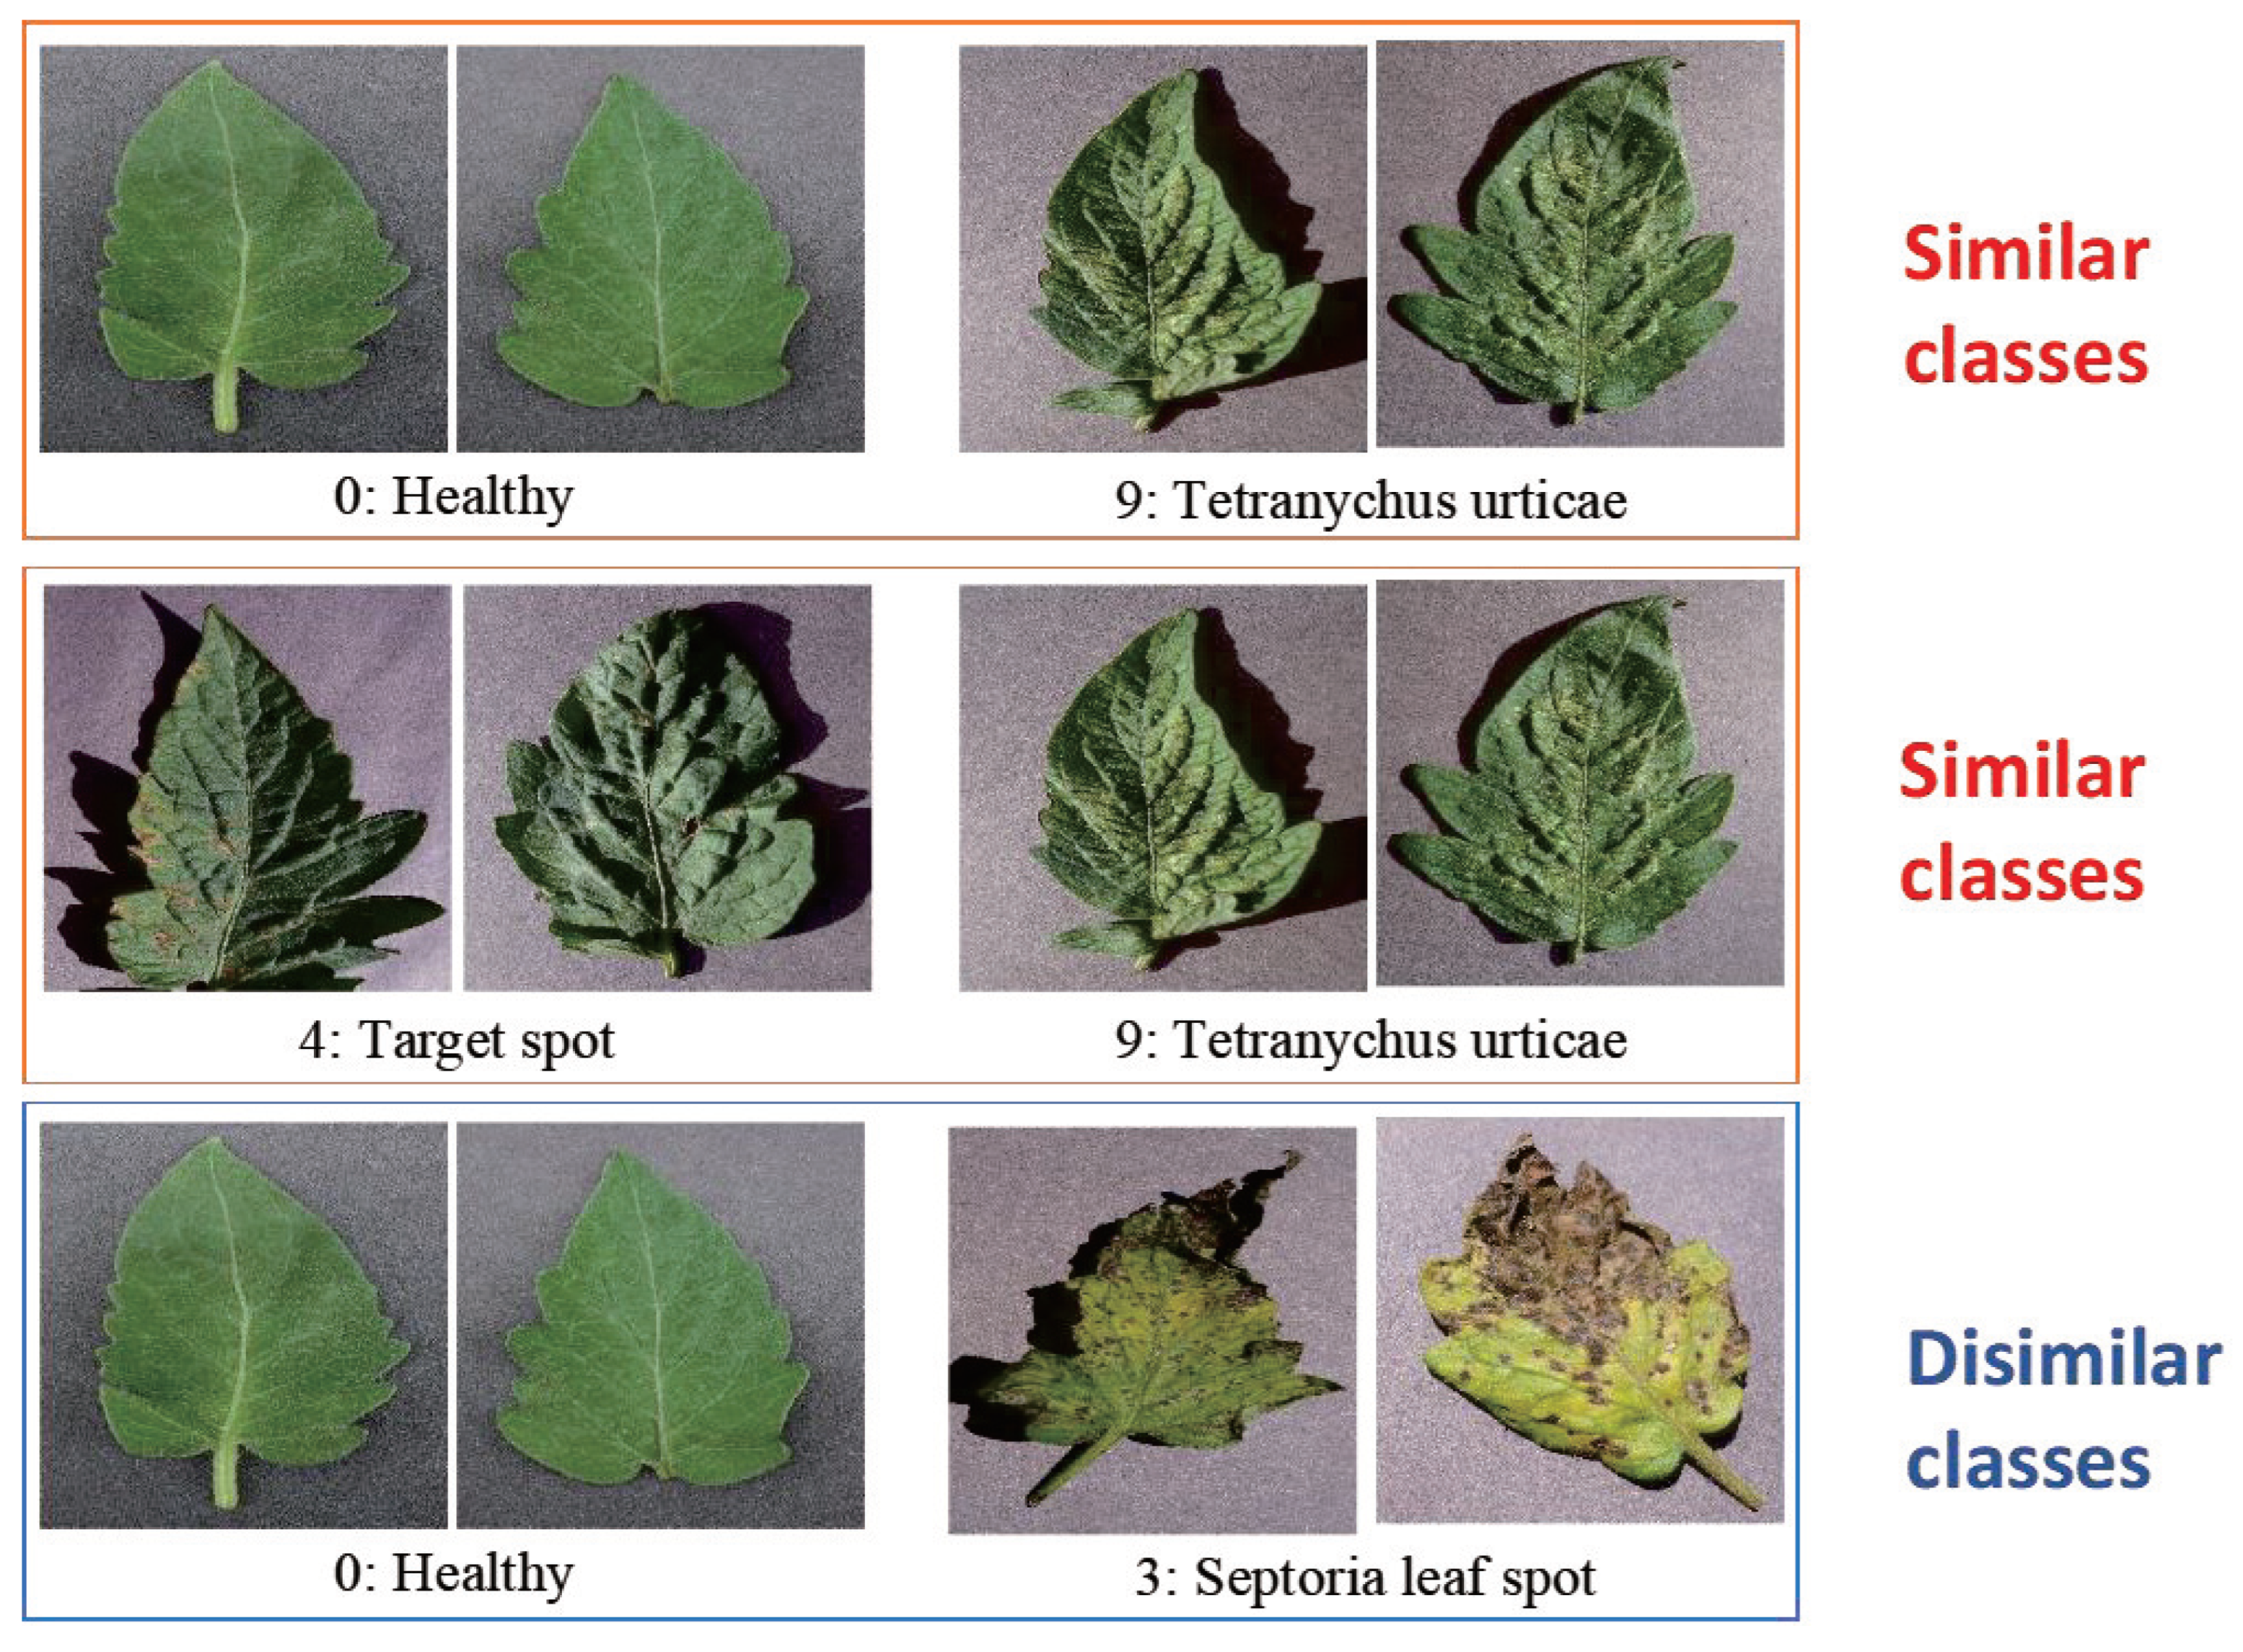
3.1. Inter-Class Similarity Evaluation
3.2. Image Information Contribution Evaluation
4. Experiments
4.1. Experimental Parameter Setting
4.2. Validation Experiment of Image Contribution Evaluation Method
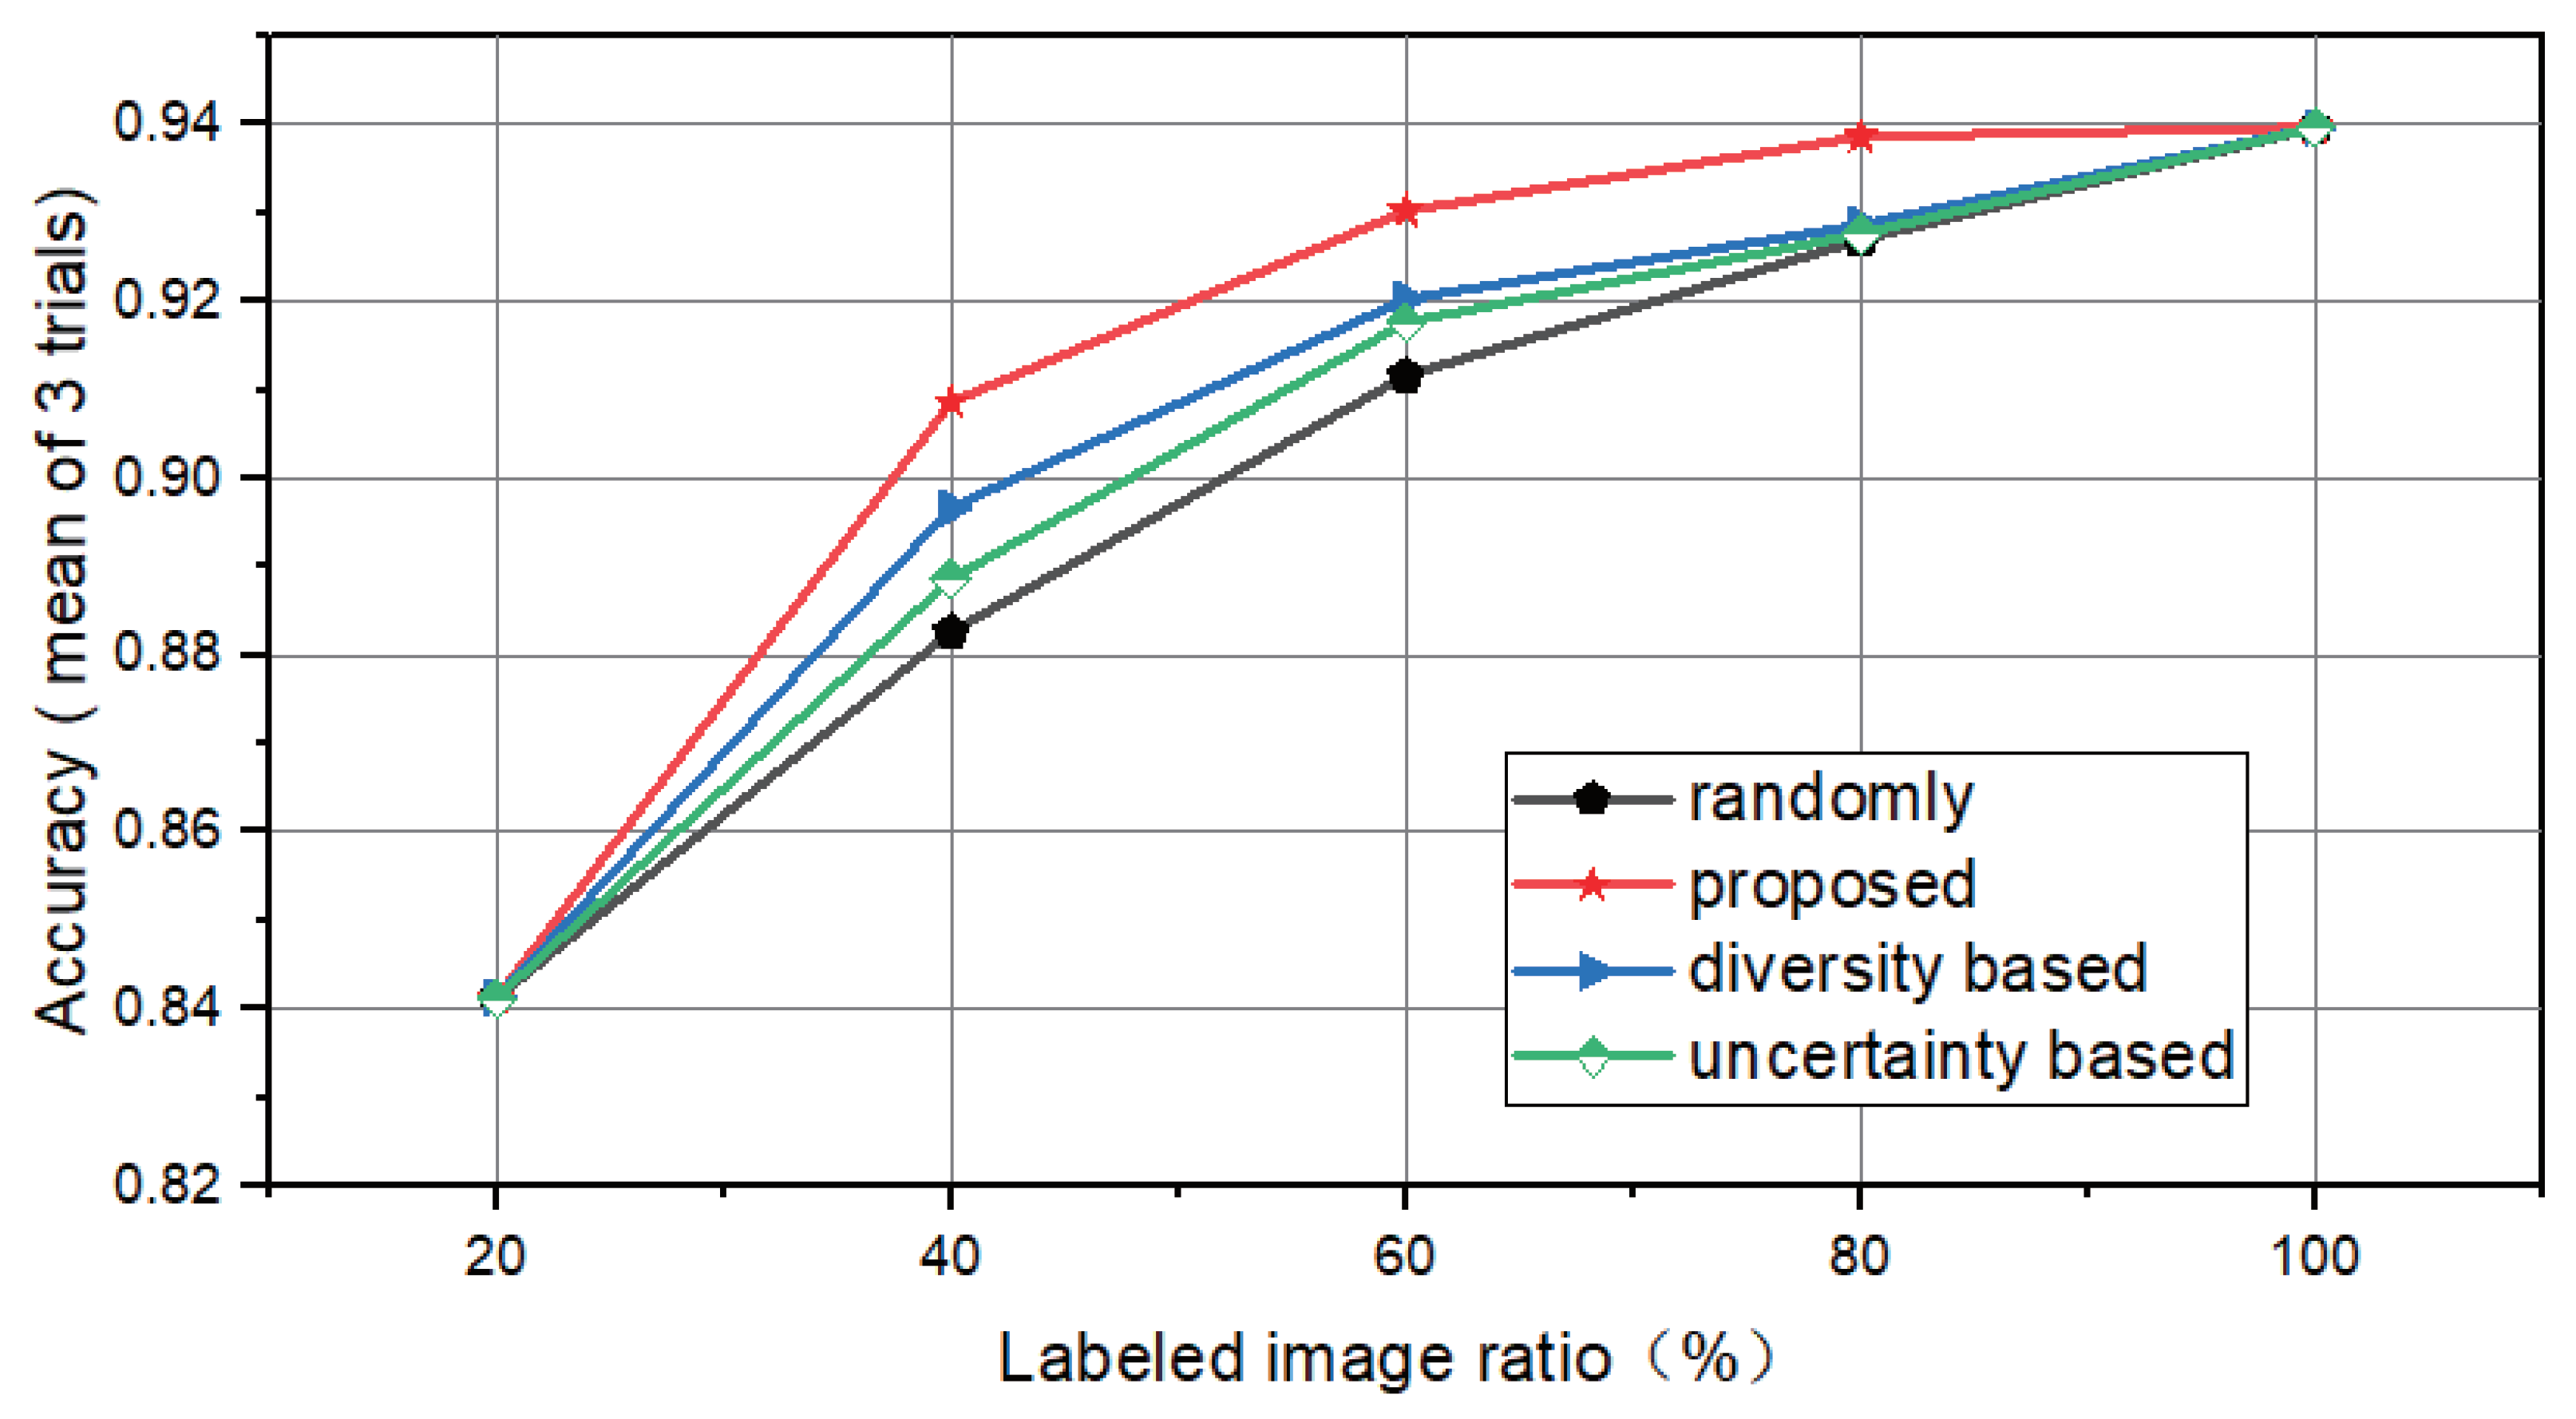
4.3. Comparative Experiment
5. Discussion
5.1. Motivation
5.2. Reasons
5.2.1. Class Similarity Calculate Results
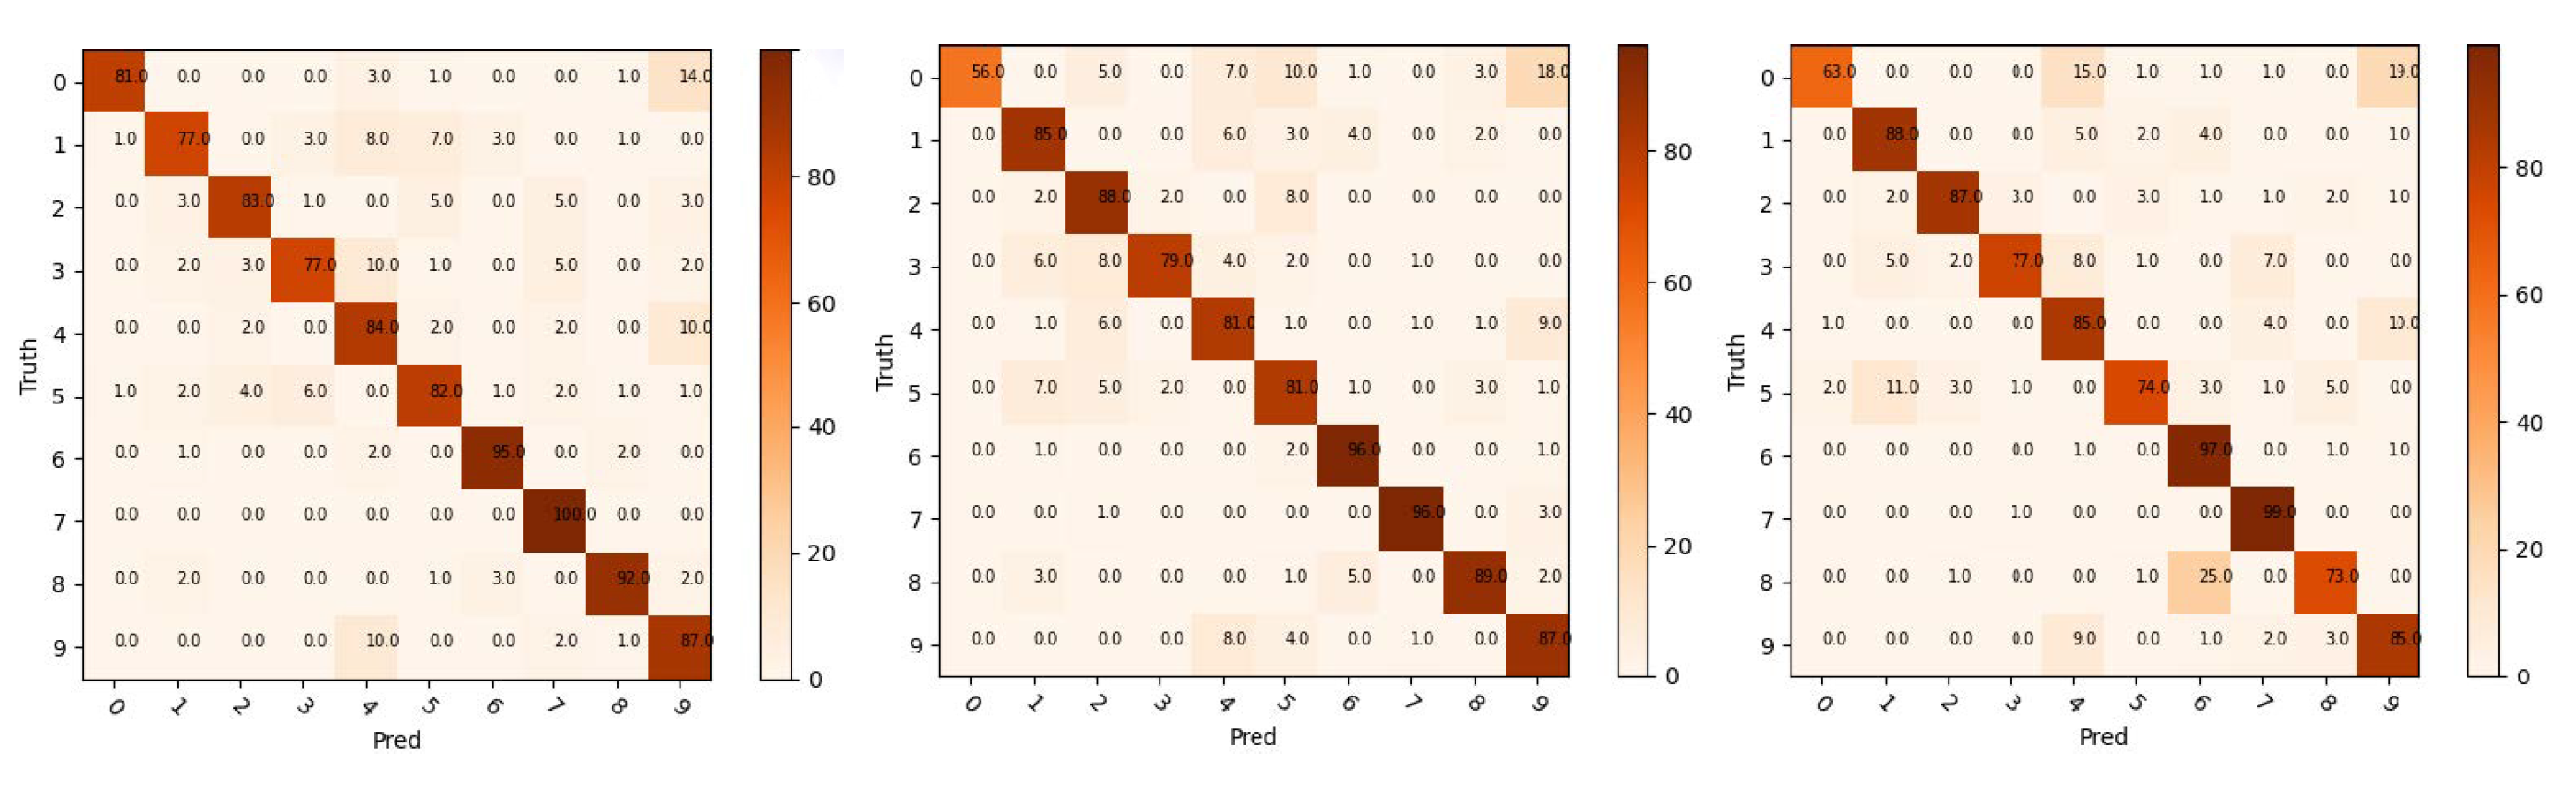
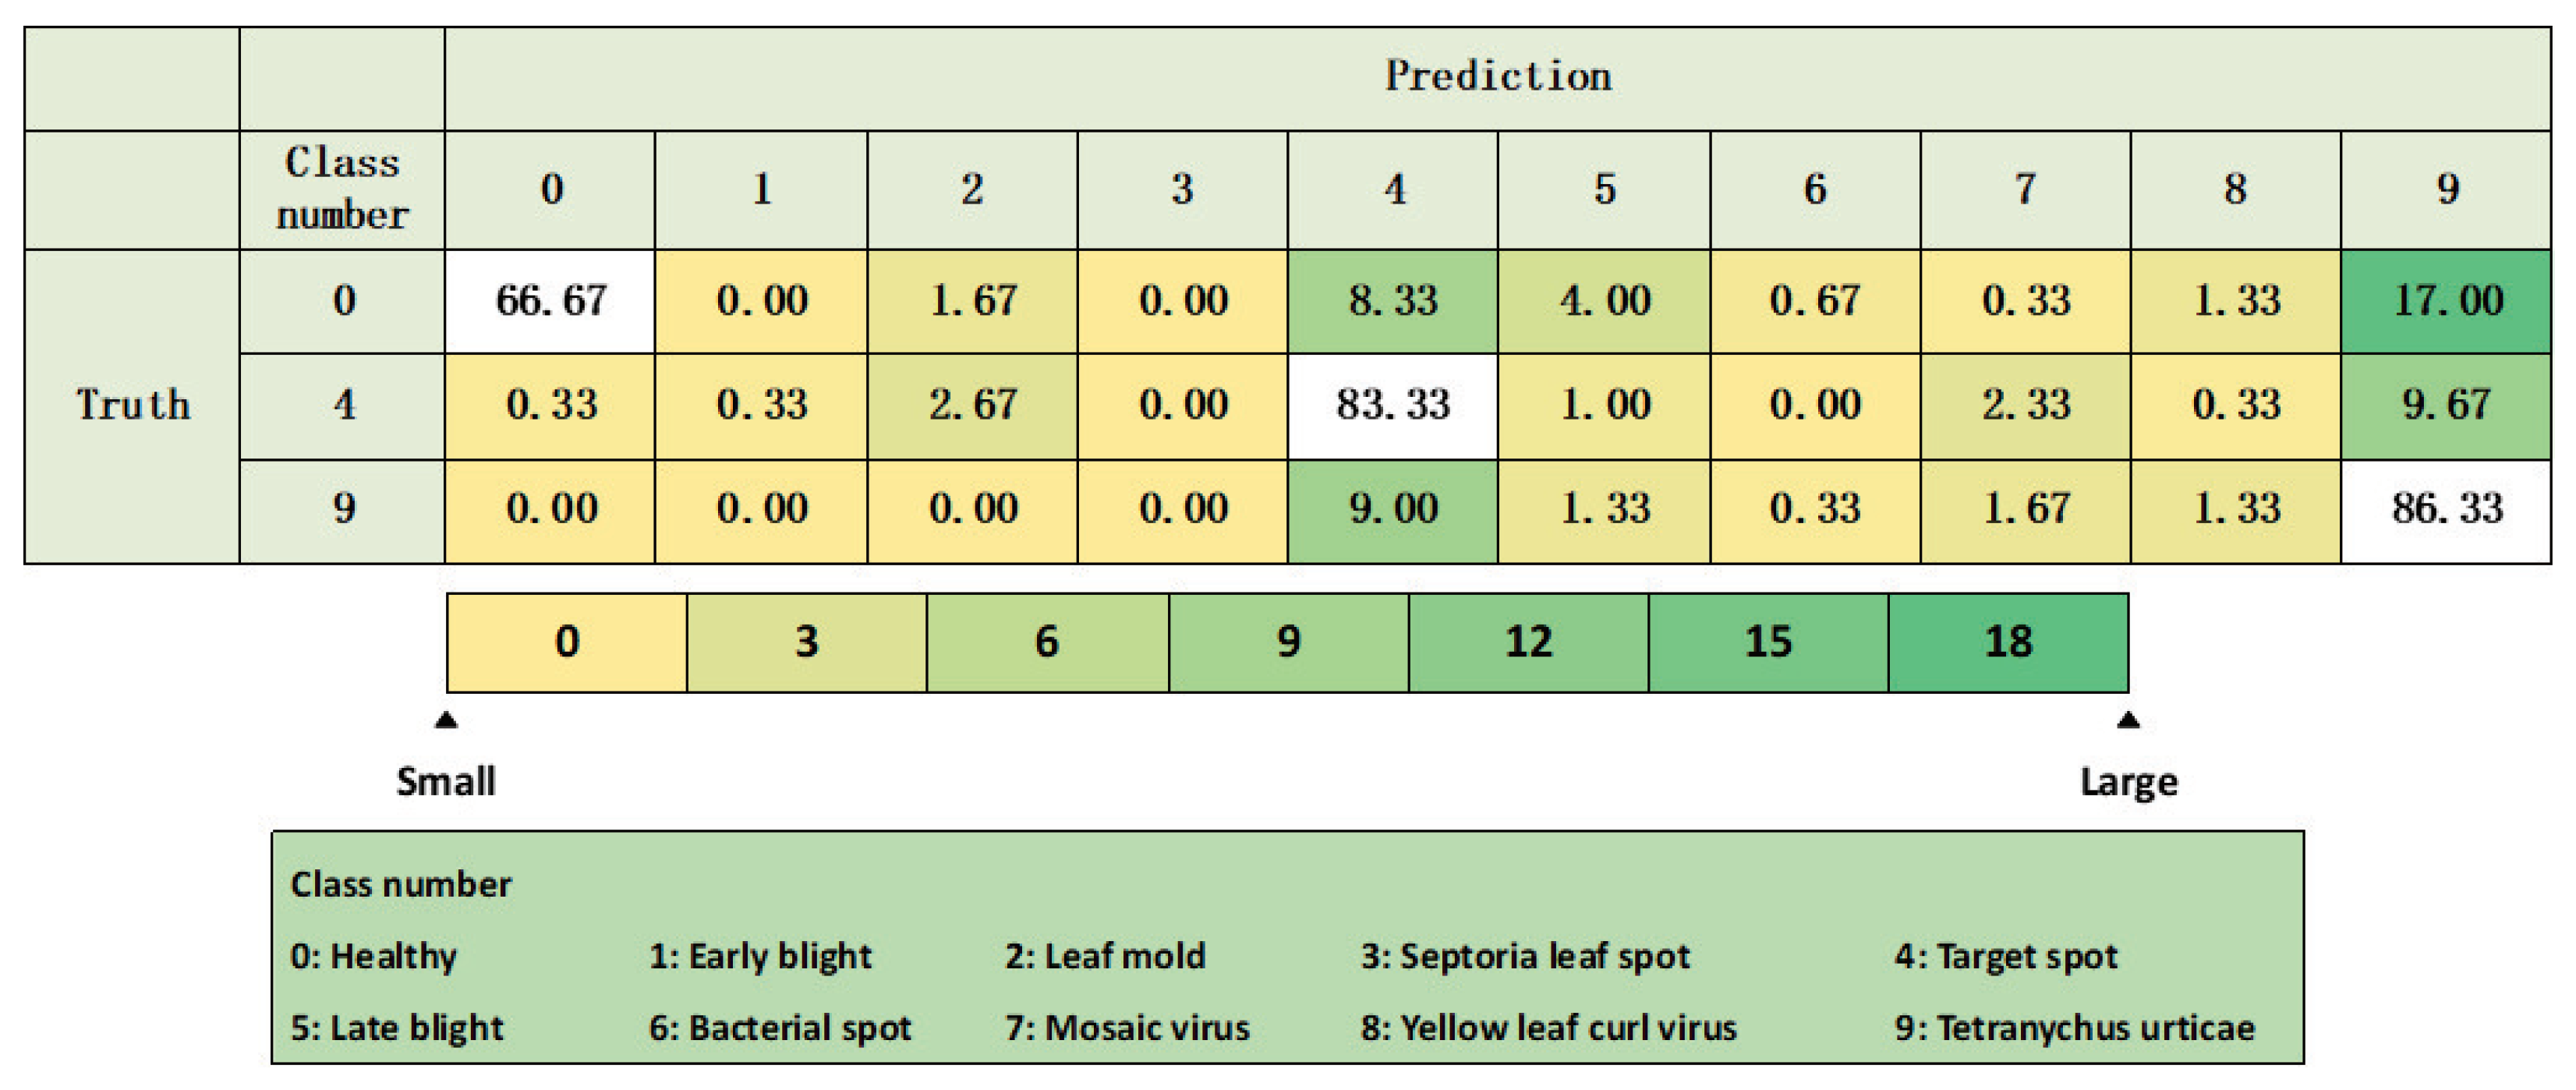
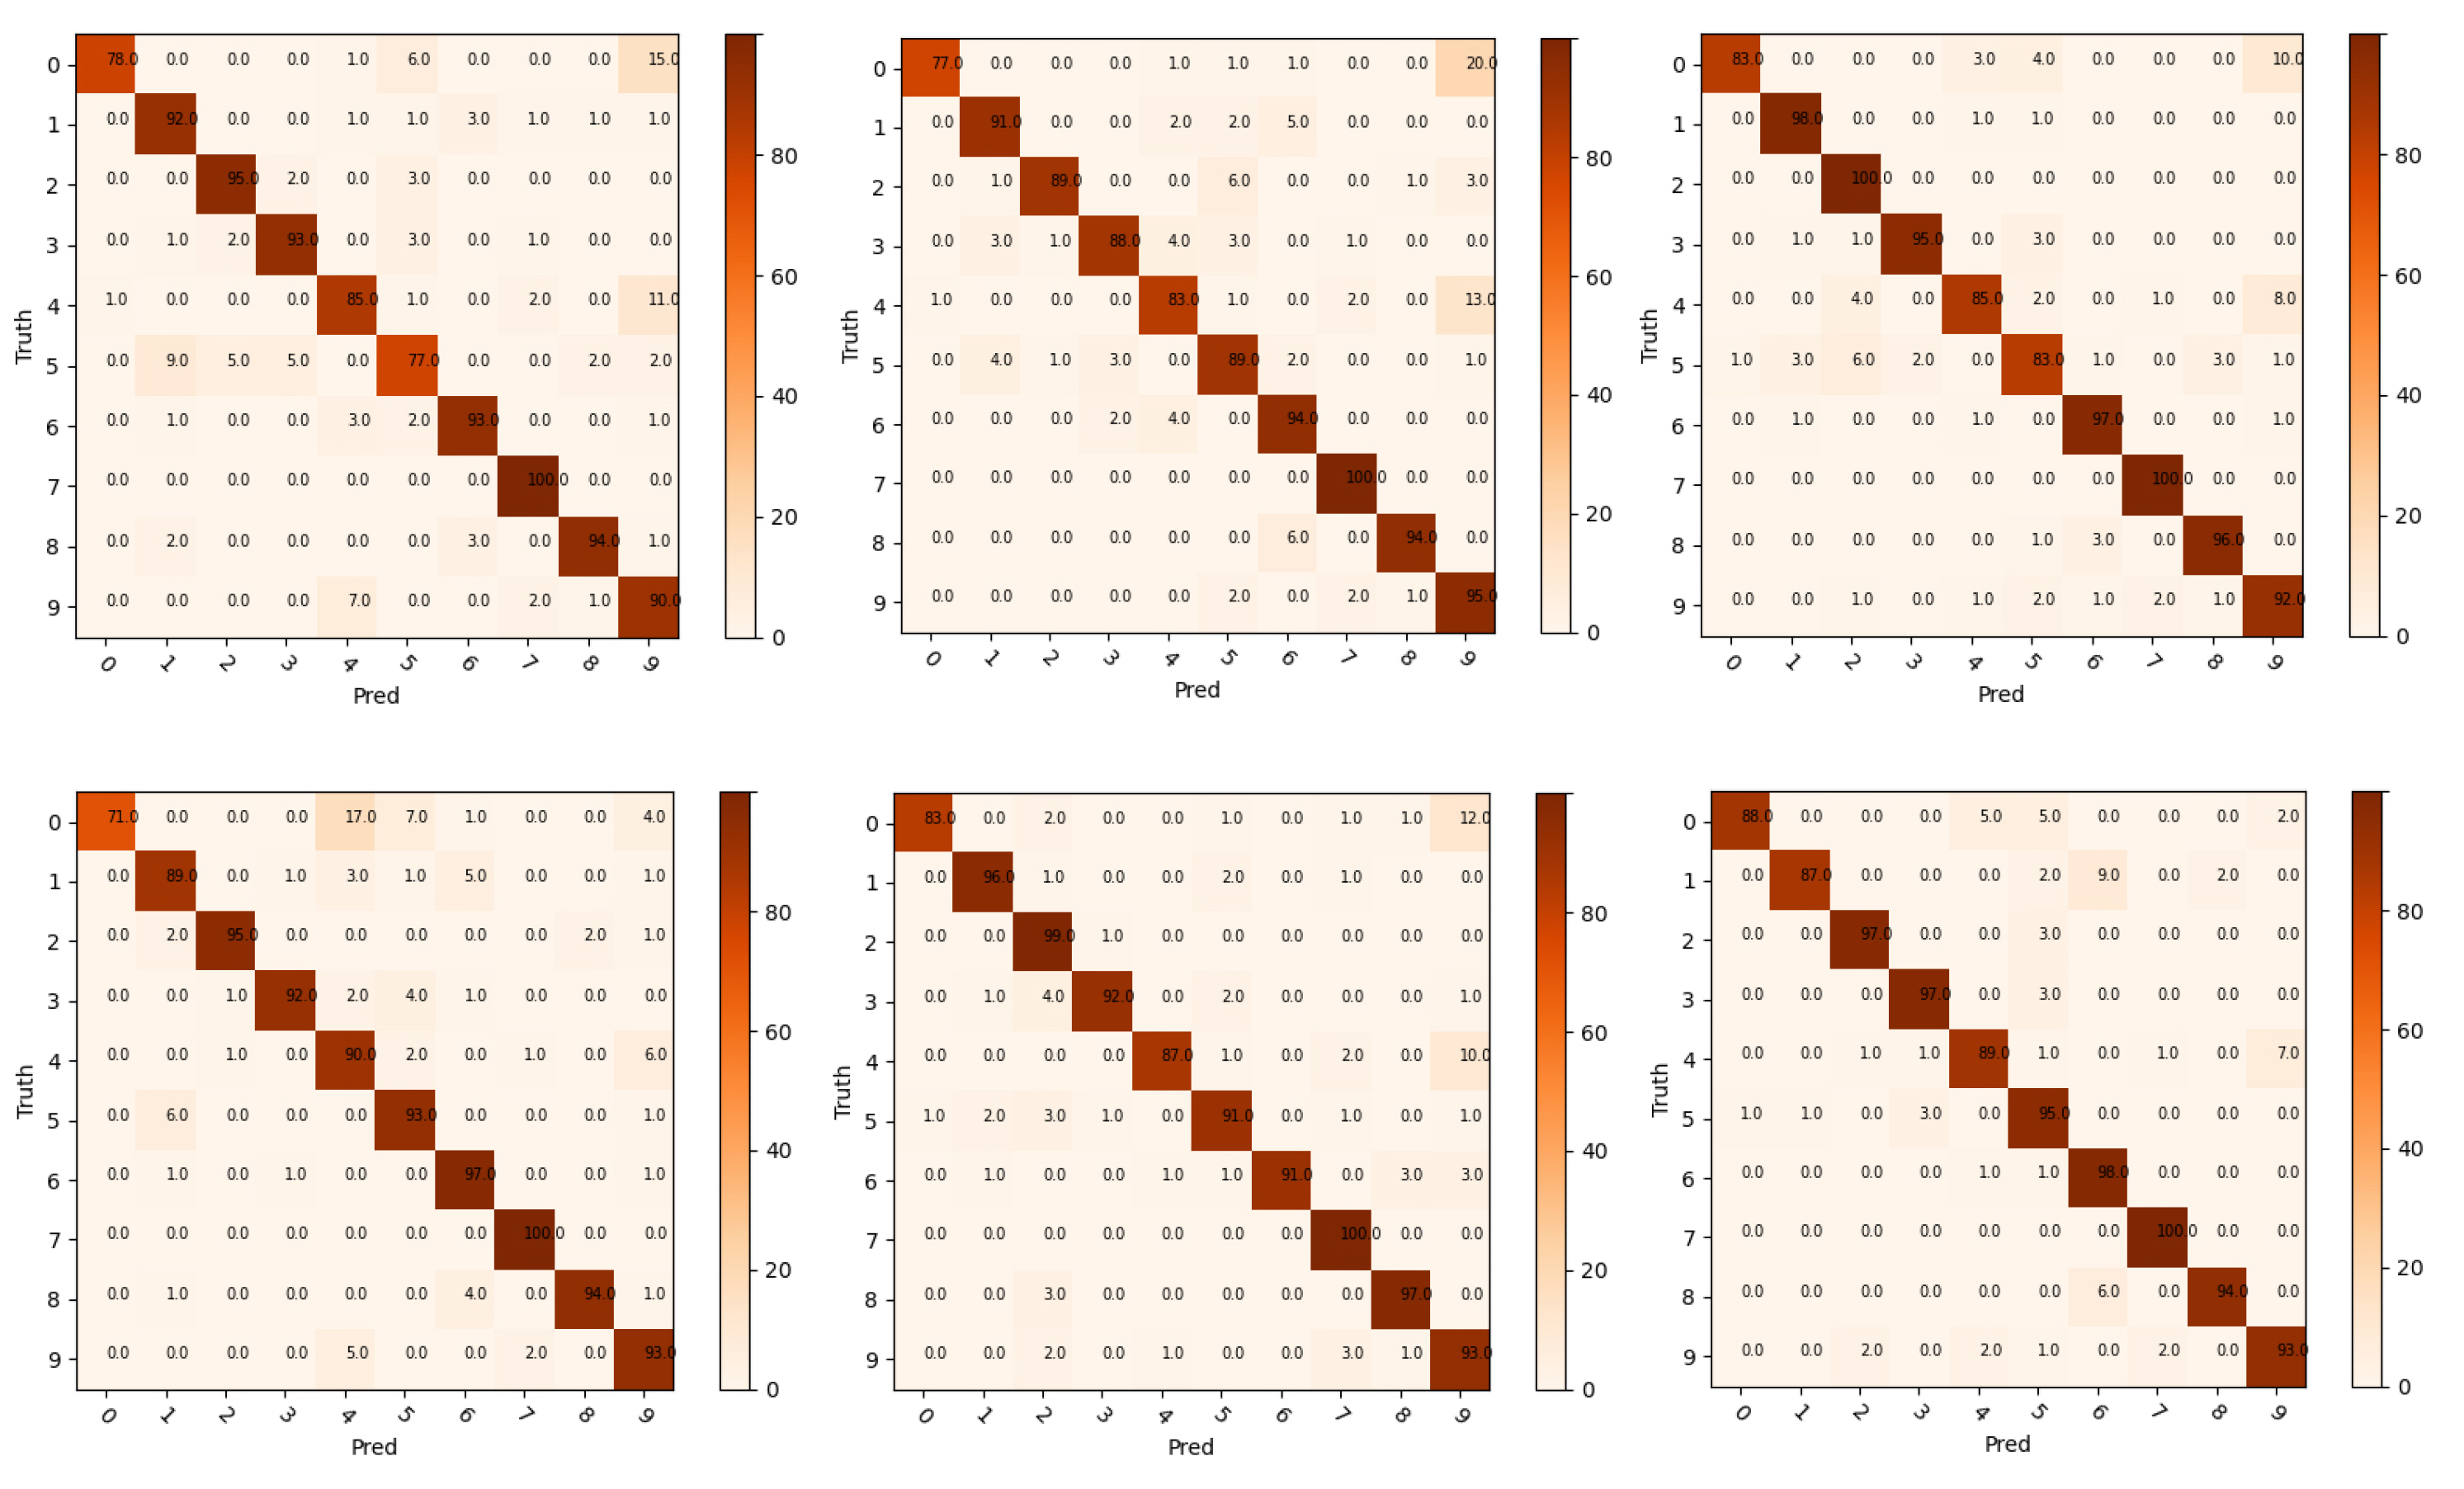
5.2.2. The Models Test Results
5.2.3. Different Budget Test Results
6. Conclusions
Author Contributions
Funding
Institutional Review Board Statement
Informed Consent Statement
Data Availability Statement
Acknowledgments
Conflicts of Interest
References
- Śliwiński, D.; Konieczna, A.; Roman, K. Geostatistical resampling of lidar-derived dem in wide resolution range for modelling in swat: A case study of zgłowiączka river (poland). Remote Sens. 2022, 14, 1281. [Google Scholar] [CrossRef]
- Nuthalapati, S.V.; Tunga, A. Multi-domain few-shot learning and dataset for agricultural applications. In Proceedings of the IEEE/CVF International Conference on Computer Vision, Virtual, 19–25 June 2021; pp. 1399–1408. [Google Scholar]
- Yang, J.; Ni, J.; Li, Y.; Wen, J.; Chen, D. The intelligent path planning system of agricultural robot via reinforcement learning. Sensors 2022, 22, 4316. [Google Scholar] [CrossRef]
- Mahlein, A.K.; Heim, R.H.; Brugger, A.; Gold, K.; Li, Y.; Bashir, A.K.; Paulus, S.; Kuska, M.T. Digital plant pathology for precision agriculture. J. Plant Dis. Prot. 2022, 129, 455–456. [Google Scholar] [CrossRef]
- Li, Y.; Chao, X. Toward sustainability: Trade-off between data quality and quantity in crop pest recognition. Front. Plant Sci. 2021, 12, 811241. [Google Scholar] [CrossRef]
- Dhaka, V.S.; Meena, S.V.; Rani, G.; Sinwar, D.; Ijaz, M.F.; Woźniak, M. A survey of deep convolutional neural networks applied for prediction of plant leaf diseases. Sensors 2021, 21, 4749. [Google Scholar] [CrossRef]
- Atila, Ü.; Uçar, M.; Akyol, K.; Uçar, E. Plant leaf disease classification using efficientnet deep learning model. Ecol. Inform. 2021, 61, 101182. [Google Scholar] [CrossRef]
- Li, Y.; Nie, J.; Chao, X. Do we really need deep cnn for plant diseases identification? Comput. Electron. Agric. 2020, 178, 105803. [Google Scholar]
- Ferentinos, K.P. Deep learning models for plant disease detection and diagnosis. Comput. Electron. Agric. 2018, 145, 311–318. [Google Scholar] [CrossRef]
- Too, E.C.; Yujian, L.; Njuki, S.; Yingchun, L. A comparative study of fine-tuning deep learning models for plant disease identification. Comput. Electron. Agric. 2019, 161, 272–279. [Google Scholar] [CrossRef]
- Li, Y.; Chao, X. Semi-supervised few-shot learning approach for plant diseases recognition. Plant Methods 2021, 17, 68. [Google Scholar] [CrossRef] [PubMed]
- Beluch, W.H.; Genewein, T.; Nürnberger, A.; Köhler, J.M. The power of ensembles for active learning in image classification. In Proceedings of the IEEE Conference on Computer Vision and Pattern Recognition, Salt Lake City, UT, USA, 18–23 June 2018; pp. 9368–9377. [Google Scholar]
- Wang, K.; Zhang, D.; Li, Y.; Zhang, R.; Lin, L. Cost-effective active learning for deep image classification. IEEE Trans. Circuits Syst. Video Technol. 2016, 27, 2591–2600. [Google Scholar] [CrossRef] [Green Version]
- Aghdam, H.H.; Garcia, A.G.; Weijer, J.; López, A.M. Active learning for deep detection neural networks. In Proceedings of the IEEE/CVF International Conference on Computer Vision, Seoul, Korea, 27 October–2 November 2019; pp. 3672–3680. [Google Scholar]
- Li, Y.; Chao, X. Distance-entropy: An effective indicator for selecting informative data. Front. Plant Sci. 2021, 12, 818895. [Google Scholar] [CrossRef] [PubMed]
- Tang, Y.P.; Huang, S.J. Self-paced active learning: Query the right thing at the right time. In Proceedings of the AAAI Conference on Artificial Intelligence, Honolulu, HI, USA, 27 January–1 February 2019; Volume 33, pp. 5117–5124. [Google Scholar]
- Yang, Y.; Li, Y.; Yang, J.; Wen, J. Dissimilarity-based active learning for embedded weed identification. Turk. J. Agric. For. 2022, 46, 390–401. [Google Scholar] [CrossRef]
- Yang, Y.; Zhang, Z.; Mao, W.; Li, Y.; Lv, C. Radar target recognition based on few-shot learning. In Multimedia Systems; Springer: Berlin/Heidelberg, Germany, 2021; pp. 1–11. [Google Scholar]
- Wang, H.; Zhou, R.; Shen, Y.D. Bounding uncertainty for active batch selection. Proc. Aaai Conf. Artif. Intell. 2019, 33, 5240–5247. [Google Scholar] [CrossRef]
- Li, Y.; Yang, J.; Wen, J. Entropy-based redundancy analysis and information screening. In Digital Communications and Networks; Elsevier: Amsterdam, The Netherlands, 2021. [Google Scholar]
- Li, Y.; Chao, X.; Ercisli, S. Disturbed-entropy: A simple data quality assessment approach. In ICT Express; Elsevier: Amsterdam, The Netherlands, 2022. [Google Scholar]
- Siddiqui, Y.; Valentin, J.; Nießner, M. Viewal: Active learning with viewpoint entropy for semantic segmentation. In Proceedings of the IEEE/CVF Conference on Computer Vision and Pattern Recognition, Seattle, WA, USA, 13–19 June 2020; pp. 9433–9443. [Google Scholar]
- Yang, J.; Ma, S.; Li, Y.; Zhang, Z. Efficient data-driven crop pest identification based on edge distance-entropy for sustainable agriculture. Sustainability 2022, 14, 7825. [Google Scholar] [CrossRef]
- Yoo, D.; Kweon, I.S. Learning loss for active learning. In Proceedings of the IEEE/CVF Conference on Computer Vision and Pattern Recognition, Long Beach, CA, USA, 16–20 June 2019; pp. 93–102. [Google Scholar]
- Chen, W.Y.; Liu, Y.C.; Kira, Z.; Wang, Y.C.; Huang, J.B. A closer look at few-shot classification. arXiv 2019, arXiv:1904.04232. [Google Scholar]
- Li, F.F.; Fergus, R.; Perona, P. One-shot learning of object categories. IEEE Trans. Pattern Anal. Mach. Intell. 2006, 28, 594–611. [Google Scholar]
- Yang, J.; Guo, X.; Li, Y.; Marinello, F.; Ercisli, S.; Zhang, Z. A survey of few-shot learning in smart agriculture: Developments, applications, and challenges. Plant Methods 2022, 18, 28. [Google Scholar] [CrossRef] [PubMed]
- Snell, J.; Swersky, K.; Zemel, R. Prototypical networks for few-shot learning. In Proceedings of the Annual Conference on Neural Information Processing Systems 2017, Long Beach, CA, USA, 4–9 December 2017; Volume 30. [Google Scholar]
- Sung, F.; Yang, Y.; Zhang, L.; Xiang, T.; Torr, P.H.; Hospedales, T.M. Learning to compare: Relation network for few-shot learning. In Proceedings of the IEEE Conference on Computer Vision and Pattern Recognition, Salt Lake City, UT, USA, 18–22 June 2018; pp. 1199–1208. [Google Scholar]
- Xiao, T.; Xu, Y.; Yang, K.; Zhang, J.; Peng, Y.; Zhang, Z. The application of two-level attention models in deep convolutional neural network for fine-grained image classification. In Proceedings of the IEEE Conference on Computer Vision and Pattern Recognition, Boston, MA, USA, 7–12 June 2015; pp. 842–850. [Google Scholar]
- Simon, M.; Rodner, E. Neural activation constellations: Unsupervised part model discovery with convolutional networks. In Proceedings of the IEEE International Conference on Computer Vision, Santiago, Chile, 7–13 December 2015; pp. 1143–1151. [Google Scholar]
- Lin, T.Y.; RoyChowdhury, A.; Maji, S. Bilinear cnn models for fine-grained visual recognition. In Proceedings of the IEEE International Conference on Computer Vision, Santiago, Chile, 7–13 December 2015; pp. 1449–1457. [Google Scholar]
- Berg, T.; Belhumeur, P.N. Poof: Part-based one-vs.-one features for fine-grained categorization, face verification, and attribute estimation. In Proceedings of the IEEE Conference on Computer Vision and Pattern Recognition, Portland, OR, USA, 23–28 June 2013; pp. 955–962. [Google Scholar]
- Ge, Z.; McCool, C.; Sanderson, C.; Corke, P. Subset feature learning for fine-grained category classification. In Proceedings of the IEEE Conference on Computer Vision and Pattern Recognition Workshops, Boston, MA, USA, 7–12 June 2015; pp. 46–52. [Google Scholar]
- Gao, Z.; Wu, Y.; Zhang, X.; Dai, J.; Jia, Y.; Harandi, M. Revisiting bilinear pooling: A coding perspective. In Proceedings of the AAAI Conference on Artificial Intelligence, New York, NY, USA, 7–12 February 2020; Volume 34, pp. 3954–3961. [Google Scholar]
- Perronnin, F.; Dance, C. Fisher kernels on visual vocabularies for image categorization. In Proceedings of the 2007 IEEE Conference on Computer Vision and Pattern Recognition, Minneapolis, MN, USA, 17–22 June 2007; pp. 1–8. [Google Scholar]
- Hughes, D.; Salathé, M. An open access repository of images on plant health to enable the development of mobile disease diagnostics. arXiv 2015, arXiv:1511.08060. [Google Scholar]
- He, K.; Zhang, X.; Ren, S.; Sun, J. Deep residual learning for image recognition. In Proceedings of the IEEE Conference on Computer Vision and Pattern Recognition, Las Vegas, NV, USA, 27–30 June 2016; pp. 770–778. [Google Scholar]


| 20% | 40% | 60% | 80% | 100% | |
|---|---|---|---|---|---|
| Randomly | 88.27% | 91.17% | 92.70% | ||
| High information contribution | 84.13% | 90.87% | 93.03% | 93.87% | 93.97% |
| Low information contribution | 87.03% | 89.73% | 91.77% |
| Truth = 0 & Prediction = 9 | Truth = 4 & Prediction = 9 | Truth = 9 & Prediction = 4 | |||
|---|---|---|---|---|---|
| Randomly | Proposed | Randomly | Proposed | Randomly | Proposed |
| 15.00 | 6.00 | 10.67 | 7.67 | 2.67 | 2.67 |
Publisher’s Note: MDPI stays neutral with regard to jurisdictional claims in published maps and institutional affiliations. |
© 2022 by the authors. Licensee MDPI, Basel, Switzerland. This article is an open access article distributed under the terms and conditions of the Creative Commons Attribution (CC BY) license (https://creativecommons.org/licenses/by/4.0/).
Share and Cite
Yang, J.; Yang, Y.; Li, Y.; Xiao, S.; Ercisli, S. Image Information Contribution Evaluation for Plant Diseases Classification via Inter-Class Similarity. Sustainability 2022, 14, 10938. https://doi.org/10.3390/su141710938
Yang J, Yang Y, Li Y, Xiao S, Ercisli S. Image Information Contribution Evaluation for Plant Diseases Classification via Inter-Class Similarity. Sustainability. 2022; 14(17):10938. https://doi.org/10.3390/su141710938
Chicago/Turabian StyleYang, Jiachen, Yue Yang, Yang Li, Shuai Xiao, and Sezai Ercisli. 2022. "Image Information Contribution Evaluation for Plant Diseases Classification via Inter-Class Similarity" Sustainability 14, no. 17: 10938. https://doi.org/10.3390/su141710938