Article

Evaluation of Biomonitoring Strategies to Assess Performance of a Bioremediation Bioprocess

Nantes Université, Oniris, CNRS, GEPEA, UMR 6144, F-85000 La Roche-sur-Yon, France
*
Author to whom correspondence should be addressed.
Sustainability 2022, 14(17), 10932; https://doi.org/10.3390/su141710932
Submission received: 11 July 2022 / Revised: 26 August 2022 / Accepted: 28 August 2022 / Published: 1 September 2022
(This article belongs to the Special Issue Organic Pollutants in the Environment: Analysis and Treatment)

Abstract

:
This study was conducted to propose a suitable set of methods to evaluate the efficiency of two biotreatments. For this purpose, two sets of four 7.5 L bioreactors were followed over 90 days, containing natural sediments from the Bizerte Lagoon (Tunisia) contaminated with 35 mg·kg−1 benzo(a)pyrene (BaP) and 28 mg·kg−1 dichlorodiphenyltrichloroethane (DDT). One set was biostimulated with N/P and bioaugmented with the indigenous Pseudomonas stutzeri, Cupriavidus metallidurans and Rhodococcus equi, and the other set was only biostimulated. In the effluent, organic carbon decreased from 42 gC·L−1 to 0.2 gC·L−1 for the bioaugmented treatment compared to 15 gC·L−1 for biostimulation. Statistical analyses confirmed a significant difference in BaP concentration after bioaugmention from 35 mg·kg−1 to 21 mg·kg−1 sediment, whereas no difference was found with biostimulation. Considering DDT, biostimulation was more efficient (8.5 mg·kg−1 sediment final concentration) than bioaugmentation (15 mg·kg−1 final concentration). Native organotin and metals were also monitored using bioluminescent bioreporter strains. The bioaugmented treatment brought about a significant decrease in TBT content, to below 0.01 µM, whereas its concentration remained significant after biostimulation. The biostimulation did not alter As3+, Cu2+, Cd2+, and Hg2+ concentrations, whereas bioaugmentation induced a decrease of 1 to 2 log for each metal. At the end of the experimental period, toxicity decreased to 90% in the effluent of the bioaugmented reactors compared with a drop of only 48% for biostimulation, and a significant decrease in mutagenicity appeared for bioaugmention only. Interestingly, not all the strains used in the treatments were maintained, as P. stutzeri and R. equi increased up to densities of 8.3 × 10¹³ and 5.2 × 10¹² DNA·g−1 sediment, respectively, while in both treatments, C. metallidurans decreased down to the detection threshold. Among the different methods used, a restricted monitoring panel of analyses appears essential to follow the change occurring over the bioremediation process: (i) organic carbon measurement reporting all biodegradation events, as well as a specific method to monitor the main compounds; (ii) dissolved N, P, O2 and pH measurements, (iii) a qPCR method to track the degraders; and (iv) measurements of the acute toxicity and the mutagenicity.

1. Introduction

Bioremediation treatments using biological entities, such as plants, algae, microorganisms, or enzymes to eliminate pollutants, could be applied to different matrices, such as soil, water, waste, sludges or sediments, for their in situ or ex situ bioprocesses (see [1,2,3] for review). The two main microorganism-based bioremediation approaches generally used are (i) biostimulation, based on the addition of nutrients to stimulate the growth of the indigenous microbial community, and (ii) bioaugmentation with pre-adapted pure bacterial strains, pre-adapted consortia, or genetically engineered bacteria intended for specific pollutants [4,5,6,7].
Evaluating the effectiveness of bioremediation remains an important goal to enable legislative and economic authorities to make informed choices about the management of contaminated sites. Despite the large number of publications on bioremediation (46,429 listed in PubMed as published since 1974), some important questions remain partially unanswered. These include whether bioremediation systems produce toxic by-products; whether in the case of bioaugmentation, strains persist until the end of the process; and whether these strains participate in the bioremediation process.
Evaluation of the effectiveness of bioremediation is generally monitored by physico-chemical analyses based either on the determination of multiple parameters, such as chemical oxygen demand or organic carbon disappearance, or by the measurement of pollutants and quantification of by-products released [8,9,10,11,12,13,14,15,16,17] Because chemical analyses do not provide information about potential hazards for complex matrices, some studies have included bioassays in order to determine whether toxicity has been lowered and/or if the site has regained its initial biological activity [8,18,19,20,21,22,23,24] A large panel of ecotoxicological bioassays could be used to assess toxicity through the use of microorganisms, microalgae, microcrustaceans, or plants. The selection of such bioassays is generally decided by their cost and the nature of the matrix. For example, batteries of bioassays have been applied as supplementary tools to monitor bioremediation processes both in laboratory investigations and at the field scale [19,25,26,27,28,29,30,31,32,33,34] In addition to these traditional assays, microbial and molecular analyses (i.e., microbial community response and profile assessment by the detection of specific nucleic acid sequences, and metagenomics) can provide a comprehensive overview of the biodegradation potential of the communities in polluted environments [8,35,36,37,38,39,40,41,42].
Despite great efforts, there is a lack of consensus on an overall strategy to qualify the bioremediation process that would tell us if such bioprocesses are really useful. To contribute to resolving this issue, we designed bioremediation reactors filled with marine sediments originating from the Bizerte Lagoon (Tunisia), which are known to have been historically exposed to anthropic contaminations. Compared with other lagoons, coasts, and bays in the world, the total concentrations of PAHs in surface sediments of the Bizerte Lagoon are considered low to moderate, with ΣPAHs ranging from 16.9 to 394.1 ng·g−1 dry weight [43] and moderate levels for DDTs (0.3–11.5 ng·g−1 dw [44].
As the pollutants concentrations are low, it was decided to spike the sediments with benzo(a)pyrene (BaP) and dichlorodiphenyltrichloroethane (DDT). Two bioremediation treatments were then compared: biostimulation (no N/P limitation) and bioaugmentation, using previously isolated indigenous degraders [45]. Bioremediation processes were monitored by (1) chemical analyses of the pollutants, (2) assessing the dynamics of the bioaugmented population, and (3) assessing the evolution of the ecotoxicity and the mutagenicity during the treatment.
In our opinion, this paper proposes for the first time to combine and select a comprehensive set of complementary methods to characterize the behavior of two biotreatments at a medium scale for complex sediments.

2. Material and Methods

2.1. Chemicals and Growth Media Used in This Study

The chemicals used in this study were all high analytical grade products with a minimal purity of 98–99.5%. Benzo(a)pyrene, 1,1,1-dichlorodiphenyl trichloroethane (DDT), 1,1-dichloro-2,2-bis(p-chlorophenyl) ethylene (DDE), 1,1-dichloro-2,2-bis(p-chlorophenyl) ethane (DDD), 1-chloro-2-2-bis-(4′-chlorophenyl) ethylene (DDMU), 2,2-bis(4′-chlorophenyl) ethanol (DDO), and bis(4′-chlorophenyl)methane (DDM) were obtained from Sigma-Aldrich (France). A mix of 16 analytical grade chemicals, EPA 610-n PAHkit (Sigma-Aldrich), was used to quantify the 16 PAHs suggested by the Environmental Protection Agency (EPA): acenaphthylene, anthracene, benzo(a)anthracene, benzo(a)pyrene, benzo(b)fluoranthene, benzo(ghi)perylene, benzo(k)fluoranthene, chrysene (93%), dibenzo(a,h)anthracene, fluoranthene, fluorene, indenol(1,2,3-cd)pyrene, naphthalene, phenanthrene, pyrene, and acenaphthene.
Cultures of autochthonous strains were grown in Luria Bertani (LB) medium, composed of NaCl 10 g·L−1, tryptone 10 g·L−1 and yeast extract 5 g·L−1 (Fluka, Grosseron, Nantes, France) dissolved in deionized water and sterilized by autoclaving at 120 °C for 20 min. When necessary, type E agar was added to the preparation before sterilization at 15 g·L−1 to produce a solid medium. Modified microorganisms were selected on solid LB amended with 20 µg·mL−1 gentamycin (Sigma-Aldrich, Darmstadt, Germany).
Bioluminescent reporters were cultivated on acetate medium, composed of 2.835 g·L−1 of CH3COONa (Panreac, Darmstadt, Germany), 0.1919 g·L−1 of NH4Cl (Merck, Fontenay-ss-Bois, France), 0.028 g·L−1 of K2HPO4 (Merck), 5 g·L−1 of NaCl (Merck, Fontenay-ss-Bois, France), 0.5 g·L−1 of yeast extract (Merck, Fontenay-ss-Bois, France), and 0.1 g·L−1 of tryptone (Biokar Diagnotics, Allonne, France). The pH was adjusted to 7 with a solution of HCl (0.2 M) or NaOH (0.2 M), and the medium was sterilized by autoclaving at 120 °C for 20 min [46].
Strains used in the Ames’ test were cultivated according to the provider’s instructions with a dedicated growth medium (GM) provided by the manufacturer (Xenometrix, Allschwil, Switzerland).
The M9 medium used to provide N and P for the biostimulation treatment during bioremediation was composed of Na2HPO4 7 H2O 12.8 g·L−1, KHPO4 3 g·L−1, NaCl 0.5 g·L−1, NH4NO3 1.5 g·L−1, MgSO4 0.5 g·L−1, and CaCl2 0.04 g·L−1 and then was sterilized by autoclaving at 120 °C for 20 min [47].

2.2. Sediment Sampling and Pollutant Spiking

Sediments were collected from Bizerte Lagoon, on the Mediterranean coast of north Tunisia (latitude: 37°8′–37°14′ N, longitude 9°46′–9°56′ E). This site was chosen because of its economic, social, and ecological importance for the region [48,49]. Sixty kilograms of sediment was sampled from the lagoon using Plexiglas hand-cores (10 cm2, 3.6 cm internal diameter) at 20 cm depth. All buckets and spatulas were acid rinsed and sterilized before use. The sediment structure consisted of 90% clay and 10% sand and was largely composed of fine particles (≈70% <63 μm). Total organic C, total N and total P, quantified by leaching, were 42.7 g·kg−1, 3.825 g·kg−1 and 0.41 g·kg−1, respectively.
Contaminant spiking was performed in accordance with the OECD standards [50]. A concentrated mixture of DDT and BaP was solubilized in DMSO and then added to contaminate 1 kg of sediment mixed overnight at room temperature (250 rpm), which was then mixed with a further 59 kg of sediment to reach a final contamination of 35 mg·kg−1 for BaP and 28 mg·kg−1 DDT. Contaminated sediment samples were then mechanically homogenized with a 100 L concrete mixer for six hours before sub-sampling into eight separate bioreactors.

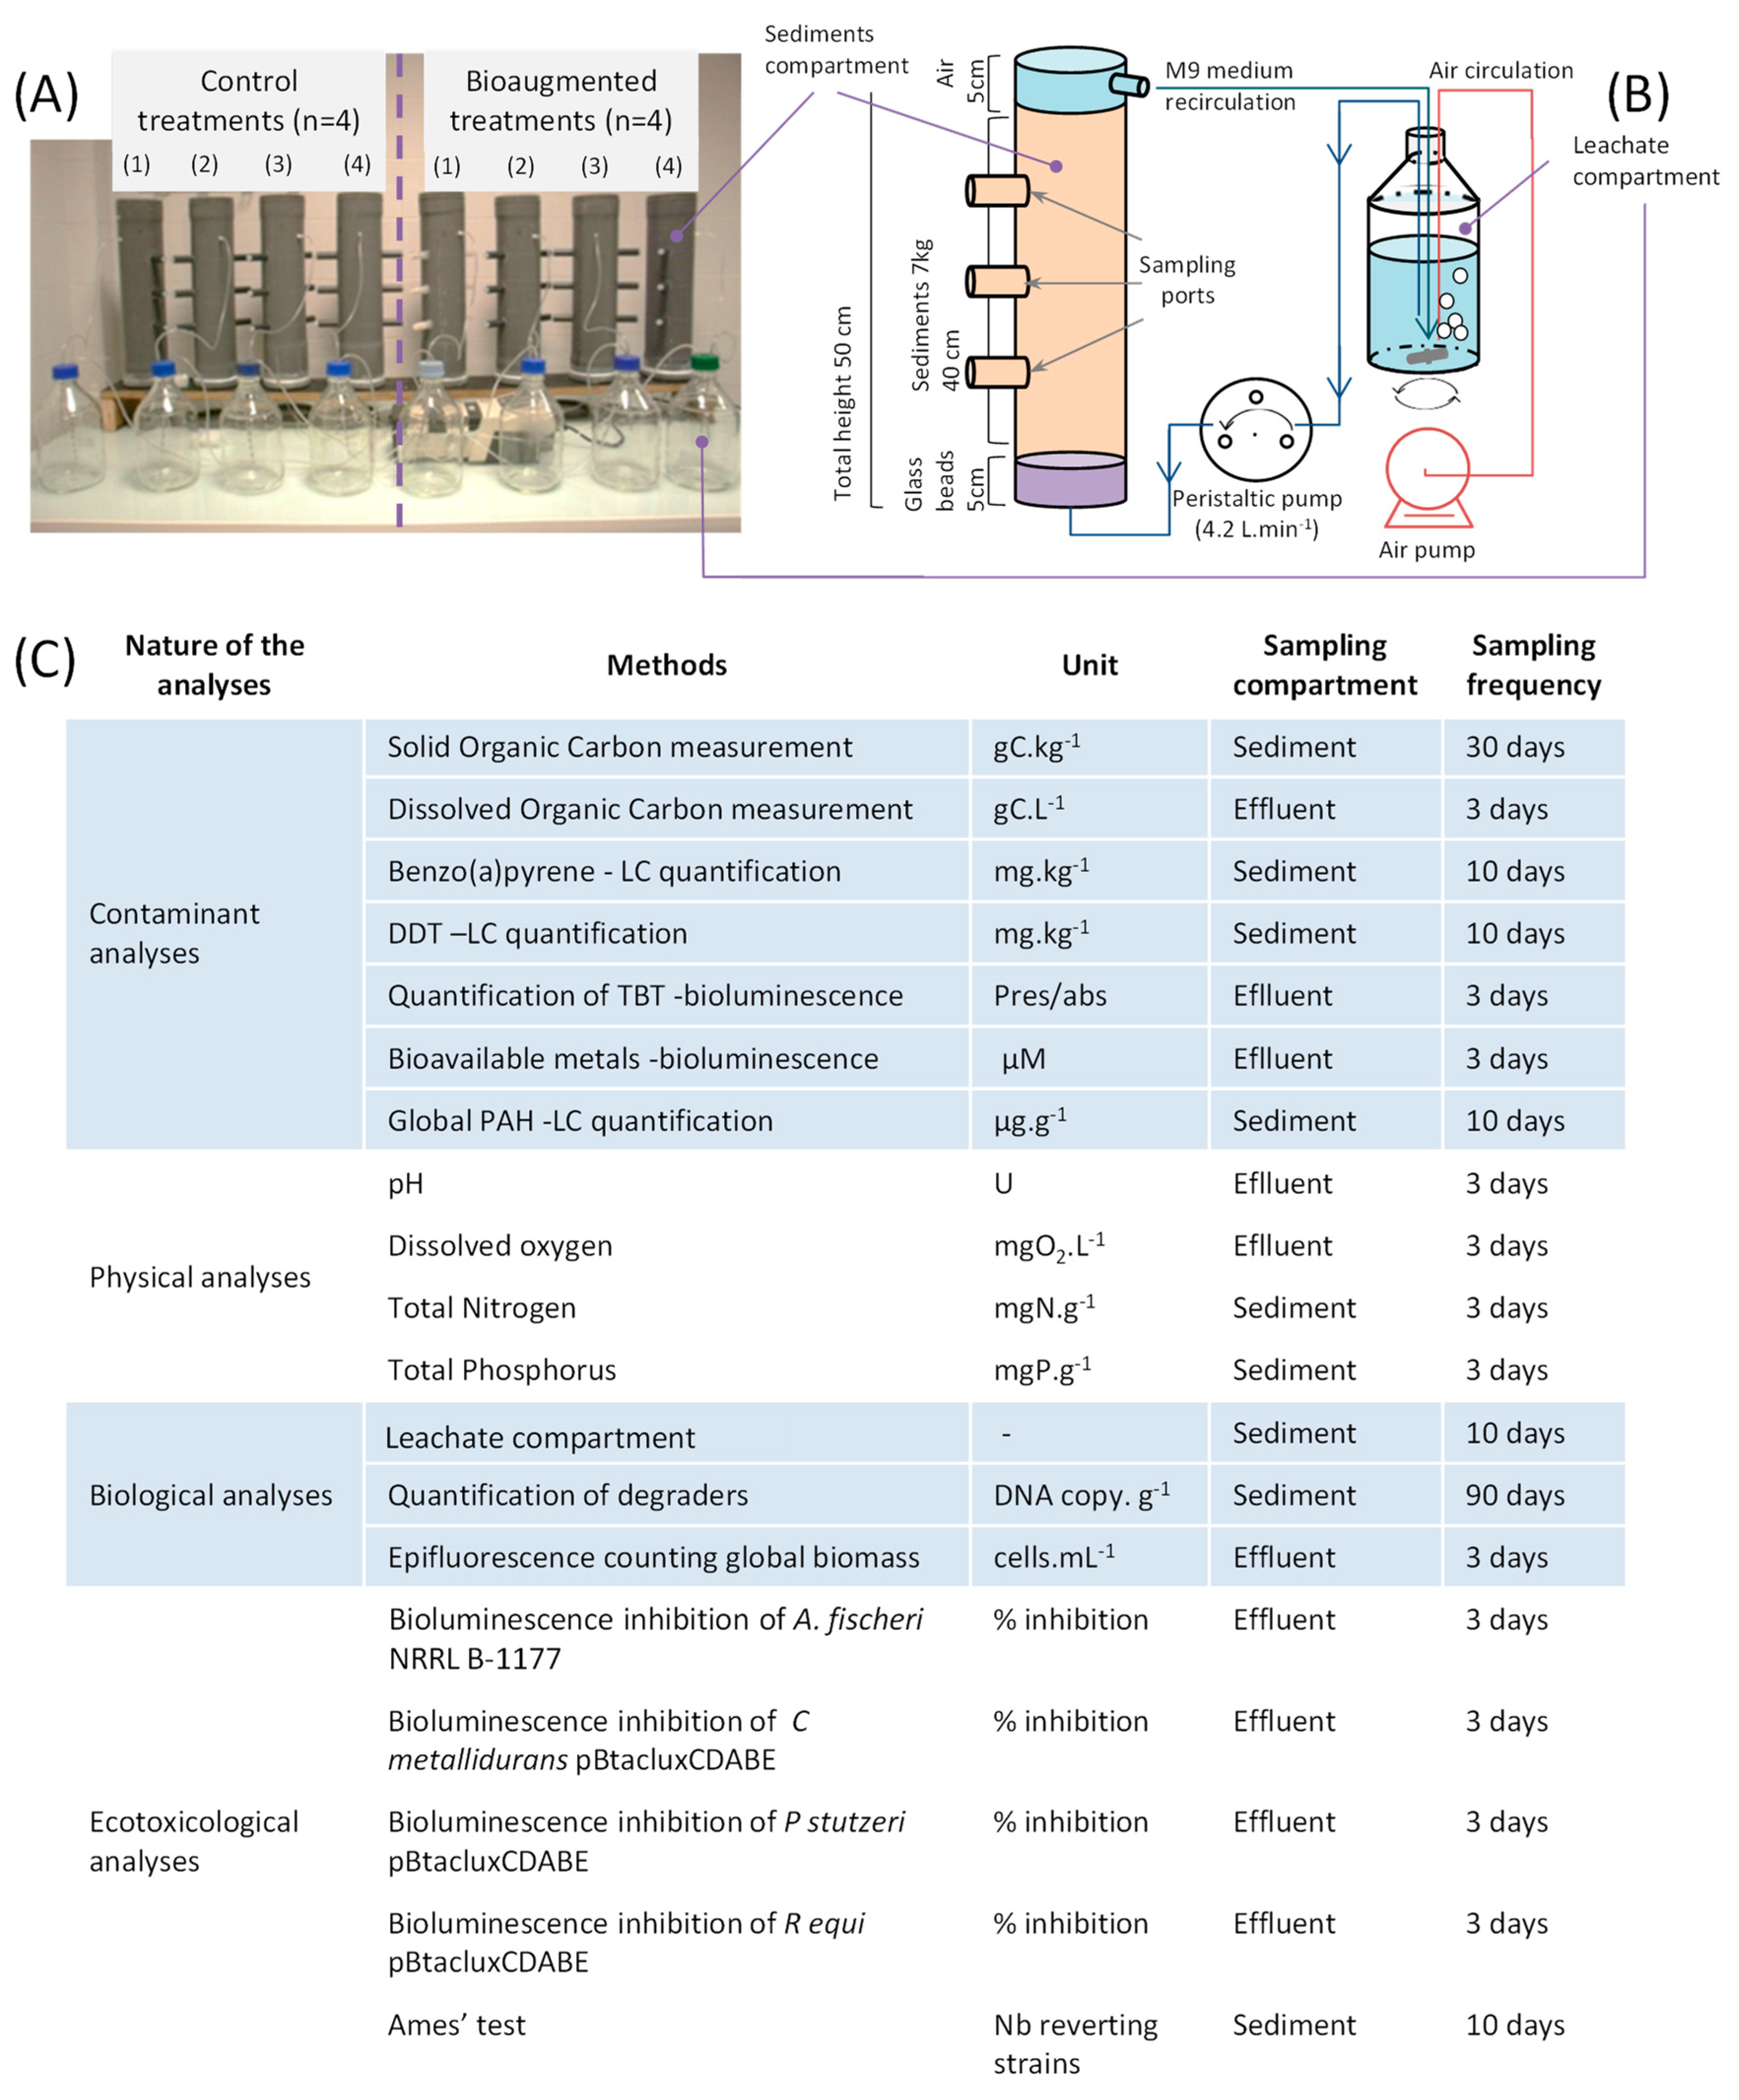
2.3. Bioreactor Configuration and Sampling

Bioremediation assays were performed in 7.5 L bioreactors consisting of PVC pipes (diameter 13 cm, height 50 cm) equipped with sampling ports at different levels (Figure 1A,B). The reactors were filled with contaminated sediment up to 45 cm of their height to allow a headspace of 5 cm to enable the degassing of gases produced during the incubation. A volume of 5 cm at the bottom of the columns was occupied by glass beads (1 cm diameter) to prevent clogging of the pipes and enable water circulation. Sediment sampling was carried out at three different levels of the column to avoid variability related to potential stratification of the sediment in the column (Figure 1).
Two bioremediation treatments were tested, in four replicates, for the contaminated sediments: (1) a control treatment consisting in biostimulation with the M9 medium only, and (2) a bioaugmentation treatment consisting of both biostimulation and bioaugmentation with an additional bacterial consortium. The latter was composed of Pseudomonas stutzeri, Cupriavidus metallidurans, and Rhodococcus equi previously isolated from the Bizerte Lagoon, each supplied at a final concentration of 1.2 × 10⁷ cells·mL−1 [45].
The additional consortium for bioaugmentation was cultivated separately in Luria-Bertani broth and washed three times by centrifugation (10,000× g for 15 min at 4 °C) with MgSO4, 10−2 M. After bacterial inoculation, all bioreactors (both control and bioaugmented) were biostimulated with a mineral medium (M9 mineral medium) and incubated for 90 days, at 21 ± 1 °C, which corresponds to the average temperature of the Bizerte Lagoon. M9 supplementation was provided with the aim of preventing N and P deprivation that could otherwise hamper or stop bioremediation. Dissolved oxygen and pH of the effluent were tested daily, directly in the recirculating M9 medium, using a HQ30D portable pH and dissolved oxygen meter (Hach, Lognes, France).

2.4. Analysis of Physico-Chemical Parameters

2.4.1. Total Organic Carbon Analysis

Carbon analyses were performed on sediment and effluent to quantify the disappearance of organic matter in both treatments with a total organic carbon (TOC) meter equipped with a solid sample combustion unit (TOC-Vcsn, and SSM-5000A module, Shimadzu, Marne la Vallee, France). Organic carbon in the effluent was quantified by non-purgeable organic carbon (NPOC) analyses. The procedure was performed according to the manufacturer’s instructions (Shimadzu). Briefly, the soluble fraction of carbon was recovered by a centrifugation step at 4 °C for 10 min at 10,000× g; thereafter, supernatants containing the soluble organic carbon was analyzed by the NPOC procedure including acidification of the sample with 20% HCl (2M). The solid sample combustion unit was used to quantify organic carbon in the sediment by a subtractive approach (total and inorganic carbon quantification). The combustion of solid samples was performed for 20 min for total and inorganic quantification at 900 °C and 250 °C with an addition of 500 µL phosphoric acid (25%) for the latter, following manufacturer’s instructions (Shimadzu).

2.4.2. Nitrogen and Phosphorus Quantification

Nitrogen and phosphorus concentrations were measured every 3 days in the effluent to confirm the absence of limitation of these elements. The N concentration was measured with a NitraVer X Nitrogen-Nitrate Reagent Set HR, and the P concentration was measured with a Phosphorus (Reactive) TNT Reagent Set, Low Range (Hach). The procedures were carried out following manufacturer’s instructions, using a DR-2800 spectrophotometer (Hach).

2.4.3. Pollutant Extraction and Analysis

The quantification of specific contaminants onto sediments was performed by chromatographic approaches every 10 days. To ensure the sampling was representative, composite samples were created by mixing three subsamples collected from the different sampling traps distributed up the height of each column (Figure 1) and then homogenized by stirring (250 rpm for 10 min) prior to further analyses. Pollutants contained in the sediments were extracted by a liquid–liquid extraction step with 100 mL of dichloromethane in an ultrasonic bath (15 min). After this extraction, the organic fraction was dried in a rotavapor at 800 mbar and 40 °C (vv2000, Heidolph, Schwabach, Germany), and pollutant extracts were solubilized in methanol (99%, Sigma-Aldrich) and stored at 4 °C in amber glass vials, sealed with a Teflon septum until chemical analyses. The latter step was performed with an HPLC Ultimate 3000 (Thermo Scientific®, Waltham, WA, USA) equipped with a diode array detector, DAD 3000 (Thermo Scientific®). The solutes were analyzed using an acetonitrile/water gradient (Supelco®, Darmstadt, Germany) that allowed a separation of the 16 PAHs recommended for study by the EPA as well as DDT and its main derivatives. The separation was carried out at a flow rate of 1 mL·min−1, at 50 bar and 30 °C. The initial proportion of acetonitrile was 60%, from 0 to 1 min and raised from 60% to 100% after 43 min. The acetonitrile was a Chromasolv® Gradient Grade product (Sigma-Aldrich) and the ultra-pure water (18.2 MΩ) was produced with a water purification system, Simplicity (Millipore, Mollsheim, France). The column used was a Hypersil Green PAH (Thermo Scientific, Waltham, WA, USA) 150 × 4.6 mm, 5 μm porosity, equipped with a dedicated pre-column.

2.4.4. Measurement of Bioavailable Metals

The quantification of bioavailable metals was carried out using bioluminescent bacteria in environmental samples with a set of five bioluminescent bacteria, namely E. coli DH1 pBtaclux, E. coli K12 MG1655 pBarslux, E. coli K12 MG1655 pBcoplux, E. coli K12 MG1655 pBzntlux, and E. coli K12 MG1655 pBmerlux. The bacteria enabled the semi-quantification of arsenic (As), mercury (Hg), cadmium (Cd), and copper (Cu) with 99% confidence [46]. These bioluminescent sensors were freeze dried and stored in 96-well plates, in ready-to-use conditions to quantify the bioavailable metals according to previously published protocols. The quantification of bioavailable metals was calculated using the Metalsoft program [46,51,52].

2.4.5. Detection of Bioavailable Tributyltin

The quantification of bioavailable tributyltin (TBT) was carried out using the bioluminescent bacteria E. coli TBT3, enabling TBT quantification in environmental samples [53]. An overnight culture grown in a minimal glucose medium was diluted to 0.15 A620nm. A total of 100 µL of the diluted culture was mixed in a 96-well microplate with 50 µL of leachate. After an incubation of 1 h at 30 °C, 25 µL of decanal solution (210 µM) (ref 1001753612, Sigma-Aldrich) was added, and the bioluminescence was measured with a MicroLumat Plus LB 96 V (Berthold, Thoiry, France). Bioluminescence was expressed in Relative Light Units RLU·s−1, and the quantification was assessed through the induction ratio (IR) according to IRi = (RLU·s−1)i/(RLU·s−1)0, where i is the bioluminescence found for the sample after induction, and 0 the bioluminescence background of the sample [53,54].

2.4.6. Leaching Test

To quantify heavy metals and ecotoxicity from the sediment, leaching tests were performed according to the method of [28]. Briefly, the procedure consisted of a single extraction from the matrix with deionized water using a 1/10 ratio (solid/liquid), for 24 h with an end-over-end agitation of 5 rpm. Afterward, a centrifugation of 15 min at 3.000× g was performed to separate the leachate, which was then filtered on a 0.45 µm cellulose filter. The leaching procedures were performed in triplicate.

2.5. Microbiological Methods

2.5.1. Biodegraders for the Bioremediation

Pseudomonas stutzeri, Cupriavidus metallidurans and Rhodococcus equi came from the laboratory of Biochemistry and Molecular Biology (Bizerte, Tunisia, 44]). Briefly, 2 mL of Bizerte Lagoon water was inoculated into 18 mL of minimal M9 medium containing a final concentration of 50 mg·L−1 BaP and or 50 mg·L−1 DDT. A culture was incubated with shaking at 200 rpm at 30 °C for 30 days in the dark. The selected strains were spread on a solid LB culture medium and incubated at 30 °C for 48 h, then, grown in M9 medium supplemented with DDT and BaP to preserve their degradation ability. Strains were identified following 16SrDNA (see [45]).

2.5.2. Construction of the Microbial Toxicity Bioreporters

Microbial bioreporters for toxicity evaluation were constructed using the pBtacluxCDABE-GmR plasmid from the autochtonous Pseudomonas stutzeri, Cupriavidus metallidurans and Rhodococcus equi described in Section 2.5.1. They were only used for toxicity tests, not added into the bioreactors.
Cell transformation was performed with an aliquot of 10 mL exponentially growing strain washed and resuspended in 100 µL pure water at 4 °C. Electroporation was carried out at 2000 V for 20 s for P. stutzeri and C. metallidurans and at 1800 V for 20 s for R. equi. Immediately after electroporation, 900 µL of the LB medium was added to the strain and it was put on ice for 2 min. Afterward, cells were revivified by an incubation of 1 h at 30 °C. Plasmid integration was confirmed by cell cultivation on Luria-Bertani agar plates supplemented with gentamycin (20 µg·mL−1). Transformants were collected, and their constitutive bioluminescence was characterized according to [51]. The three bioluminescent reporting strains were conserved after a lyophilization procedure, according to [46].

2.5.3. Total Bacterial Counts by Epifluorescence: BacLight Viability Kit

Direct viable and total cell counts were obtained using a BacLight viability kit (Invitrogen, Waltham, WA, USA). Samples of recirculating medium were incubated in the dark at room temperature for 20 min, following the manufacturer’s instructions and details from the literature [55,56]. Cell counts were conducted using an Olympus epifluorescence microscope (BX-51) equipped with U-MWB and U-MWIB (Olympus, Rungis, France) filters. Each measure was performed on 10 independent fields, to assess an average of the total and living biomass.

2.5.4. Quantification of Degraders by qPCR Clone Library Construction and Strain Determination

Molecular analyses were performed using a 1 g sediment sample from each bioreactor at the beginning and the end of the process to quantify the presence of C. metalidurans, P. stutzeri, and R. equi. Total DNA extraction was performed using a FastPrep (MP-Biomedical, Illkirch-Graffenstaden, France) and DNA kit for soil (Q-Biogene, Carlsbad, CA, USA) following the manufacturer’s instructions. The quantity and purity of DNA were determined by measuring its absorbance at 260 and 280 nm with a NanoDrop ND-1000 spectrophotometer (Thermo Scientific, Waltham, WA, USA).
To monitor and quantify the bacterial strains used in bioaugmentation, specific primers for each were used in the qPCR (Table 1).
In order to produce the fragment of interest for qPCR, the amplified fragments were cloned into a plasmid vector (Clone Jet® kit, Thermo Fisher, Waltham, WA, USA) for each of the degrading strains and transformed into 5-alpha competent E. coli (NEB, Herts, UK). Positive products were purified and analyzed by PCR to verify the presence of the insert, using the primers provided in the Clone Jet® kit. Then, the plasmid was extracted using a plasmid extraction kit (Macherey-Nagel, Grosseron, Nantes, France) and the extracted plasmid DNA was assayed with Quantifluor (StepOne, Applied Biosystems, Waltham, WA, USA) to determine the equivalent number of gene copies.

2.6. Ecotoxicity Assessment

A total of five bioluminescent reporters were used to assess acute toxicity of the bioremediation processes. Two well-known allochthonous strains served to assess toxicity: Aliivibrio fischeri NRRL B-11177 and Escherichia coli DH1 pBTacluxCDABE. Three autochthonous strains were produced in this study to report toxicity from the contaminated sediments toward the inhibiting BaP and DDT degraders: P. stutzeri pBTacluxCDABE, C. metallidurans pBTacluxCDABE and R. equi pBTacluxCDABE.

2.6.1. Acute Toxicity Assessments

Aliivibrio fischeri NRRL B-11177 was used to assess the acute toxicity of the effluent according to ISO 1998a standards by using the LUMIStox instrument (Hach Lange, Lognes, France, [60]). The toxicity was measured, in triplicate, after 30 min of exposure. The validity of the procedure was confirmed using zinc as a reference toxicant, according to [60].
The second toxicity reporter was bioluminescent Escherichia coli DH1 pBTacluxCDABE, using the method described by [46,51]. Briefly, a 100 µL sample of reconstituted freeze-dried bacteria was exposed to 25 µL of effluent for one hour at 30 °C. The bioluminescence was integrated for 1 s at 30 °C with a Microlumat Plus LB96V luminometer (Berthold). Toxicity was expressed through the bioluminescence inhibition rate [46].
Toxicity of the pollution toward the three autochthonous P. stutzeri, R. equi, and C. metallidurans was assessed as follows. At the beginning of the bioassay, the lyophilized bacteria were rehydrated with 100 μL of distilled water for 30 min at 30 °C. Thereafter, 25 μL of leachate was added, and the bioassay was incubated for 60 min at 30 °C. Bioluminescence monitoring was recorded using a Microlumat Plus Lb96V microplate luminometer (Berthold). The bioluminescence results were then expressed as an inhibition percentage (I %) of the bioluminescence (Bl) emitted by the sample (Bl assay) versus those of a control (Bl control) (Equation (1)).
I % = 100 − (Bl assay/Bl control) × 100)
where “I %” is the inhibition percentage, “Bl assay” is the bioluminescence after exposure of the biosensor to a sample, and “Bl control” corresponds to the bioluminescence background obtained with distilled water.

2.6.2. Mutagenicity Assessment with the Ames Test

The mutagenicity of the leachate extracted from contaminated sediments was assessed through the Ames test with Salmonella typhimurium his bacteria, using four sensitive strains: TA 98, TA100, TA 1535, and TA 1537 (Xenometrix). The mutagenicity assessment consisted in the measurement of the ratio of mutant his- strains growing on a histidine deficient medium, following the manufacturer’s instructions (Xenometrix). For this, the Ames’ test was applied with and without S9 metabolic activator supplements following literature instructions [61]. DMSO was used as a negative control for the four sensitive strains, whereas the mutagen control was 2-nitrofluorene for strains T98 and TA100 and 9-aminoacridine for strains TA1535 and TA1537. Reverting strains were counted when at least two successive dilutions showed an equivalent number of reverting strains.

2.7. Statistical Analysis

All tests were performed in triplicate, and the results are presented as mean ± standard deviation (SD). The statistical significance of differences was checked using analyses of variance (ANOVAs) and non-parametric Mann–Whitney, Kruskal–Wallis and Dunn’s tests.

3. Results

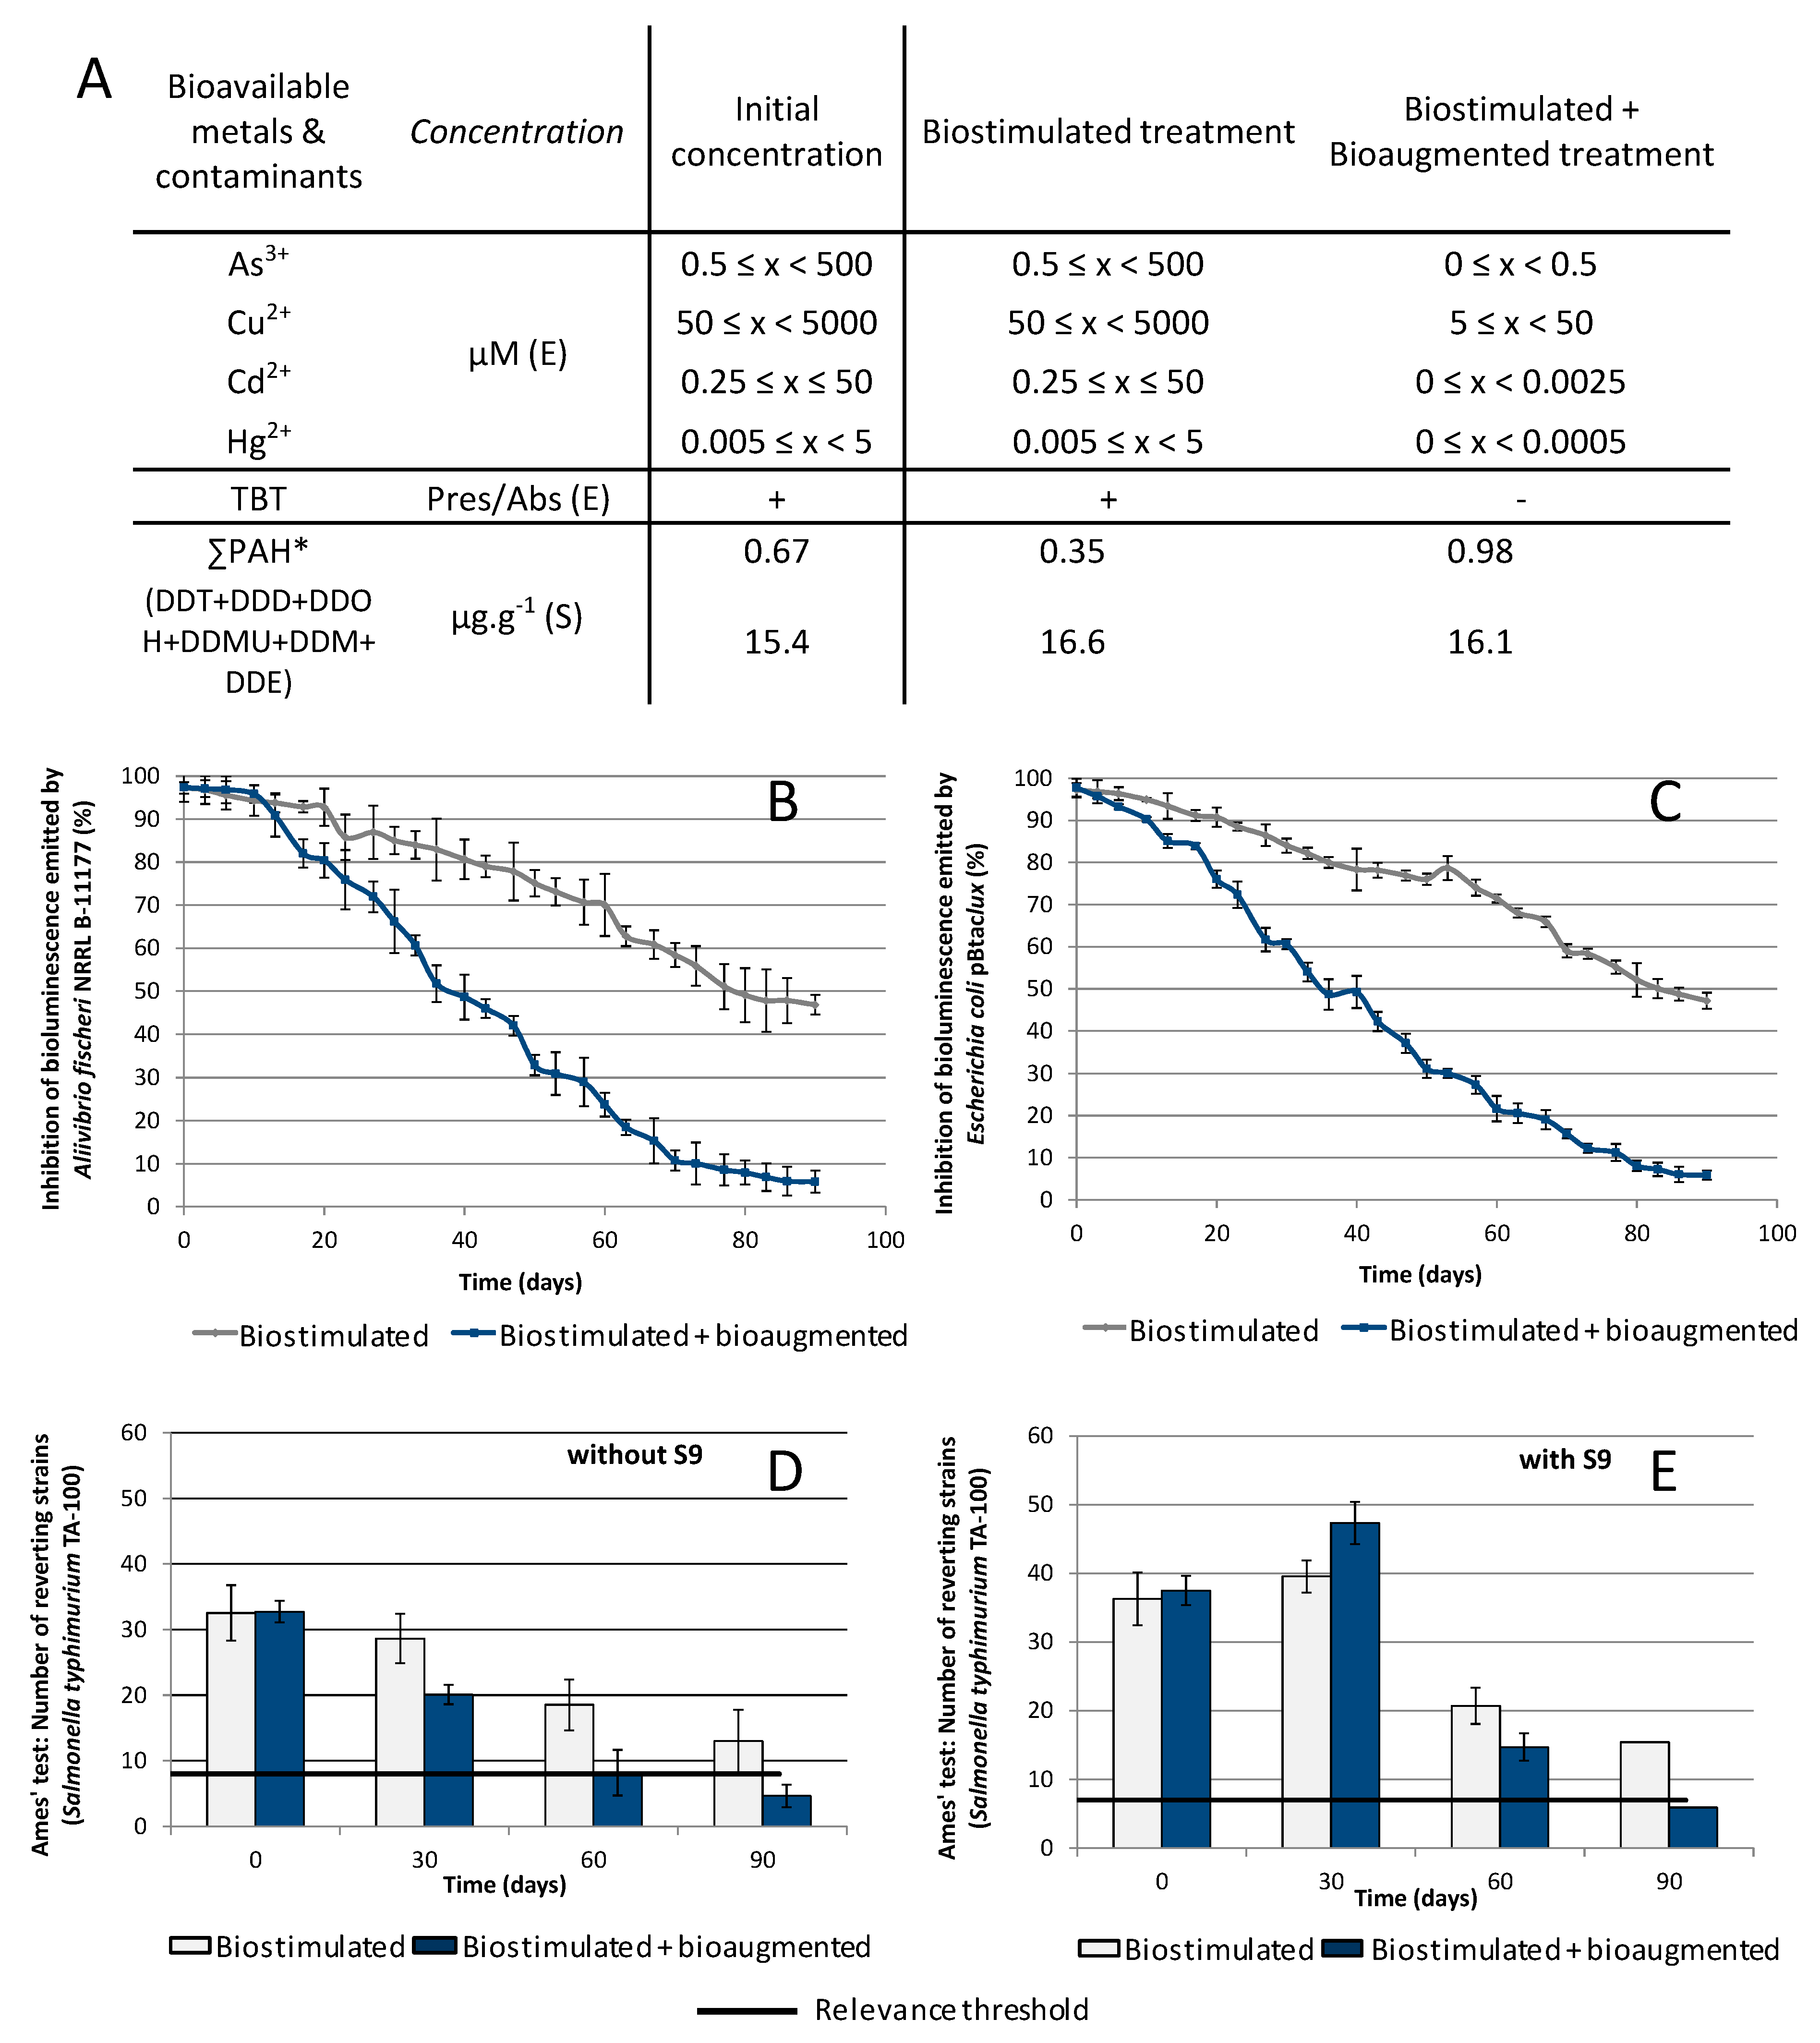
3.1. Overall Efficiency of the Bioremediation Processes

At the beginning of the trial, the sediment in all treatments contained a natural population in which the following strains were present: Rhodococcus equi 3.10 × 10⁴ (±1.26 × 10⁴) DNA·g−1 sediment, Pseudomonas stutzeri 3.52 × 10⁴ (±1.04 × 10⁴) DNA·g−1 sediment, and Cupriavidus metallidurans 1.70 × 10⁴ (±1.37 × 10⁴) DNA·g−1 sediment. Four reactors were biostimulated with N and P additions, using the ability of the natural population, and four other reactors were both biostimulated and bioaugmented by adding 1 × 10⁷ DNA·g−1 sediment of each of the three above strains. At the beginning of the experiment, the overall biomasses in the effluent were 1.43 × 10² (2.5 × 101) cells·mL−1 and 1.44 × 10⁷ (2.82 × 10⁶) cells·mL−1 for the biostimulated and bioaugmented treatments, respectively.
Organic matter content at the beginning of the experiment differed between the bioaugmented (55 gC·kg−1 dried sediment) and biostimulated treatments (62.5 gC·kg−1) both in the solid and liquid fractions. For both treatments, the solid organic matter (SOM) fraction decreased through the bioremediation period to reach a final content of 28 gC·kg−1 dried sediment (Figure 2A). Compared with the biostimulated treatment, for which 3 months were required to reach this final content, only 1 month was needed under the bioaugmented conditions. In the effluent, organic carbon contamination decreased from 42 gC·L−1 at the beginning to 0.2 gC·L−1 for the bioaugmented treatment and to 15 gC·L−1 for the biostimulated treatment, accounting for 99% and 65% decreases, respectively (Figure 2B). No N nor P limitations occurred during the bioremediation process for either treatment, notably due to the periodic feeding of the bioreactors with fresh M9 medium. O2 and pH were stable throughout the incubation period (results not shown).
Overall decreases in BaP and DDT were found for the bioaugmented treatment, whereas only DDT disappeared in the biostimulated treatment. Statistical analyses confirmed a significant difference in BaP concentration after 80 days of incubation in the bioaugmented treatment from 35 mg·kg−1 to 21 mg·kg−1 sediment (Mann–Whitney test at p < 0.05), whereas no difference was found in the biostimulation treatment. Considering DDT, the decrease in the biostimulated treatment was more pronounced and reached a final concentration of 8.5 mg·kg−1 sediment, compared with 15 mg·kg−1 sediment in the bioaugmented treatment (Figure 2C). Mann–Whitney analyses confirmed that the disappearance of DDT found in both treatments is statistically significant, at p < 0.05.
During the bioremediation process, microbial biomass increased in relation to carbon consumption to progressively reach a final concentration of 1.104 cells·mL−1 for the biostimulated treatment and 4 × 10¹⁰ cells·mL−1 for the bioaugmented treatment after the 90 days of bioremediation (Figure 2D). Microbial biomass growth stopped for the biostimulated treatment despite 1/3 of the organic carbon content remaining in the effluent at the end of the experiment and no N or P limitation.
Bioaugmentation initiated with the addition of 1.2 × 10⁷ cells·mL−1 for each bacterium (Pseudomonas stutzeri, Cupriavidus metallidurans, and Rhodococcus equi) was possible, as the pollution did not exert any significant toxic effect. The toxicity of the contaminated effluent was monitored using bacteria isolated from the Bizerte Lagoon genetically modified to serve as lux bioreporters. The data show that despite the BaP and DDT spikings, toxicity caused only 8% inhibition for the three strains P. stutzeri pBtaclux, C. metallidurans pBtaclux, and R. equi pBtaclux (Figure 2E). This low toxicity continued to decline until the end of the process and became negligible for both treatments.
Interestingly, not all the strains used in the treatments were maintained (Figure 2F). For the bioaugmented treatment, P. stutzeri and R. equi increased up to densities of 8.3 × 10¹³ and 5.2 × 10¹² DNA·g−1 sediment, respectively, after 90 days of incubation, while they reached only 5 × 10⁵ and 1.2 × 10⁶ DNA·g−1 sediment in the biostimulated treatment after 90 days of incubation. In both treatments, however, C. metallidurans decreased down to the detection threshold by the end of the experiment.

3.2. Impact of the Bioremediation Processes

In addition to the two contaminants spiked in the experiment, a native contamination of PAHs was found in the sediment, consisting of mainly naphthalene, phenanthrene, and anthracene. The sum of PAH contaminants was 0.67 µg·g−1 sediment at the beginning of the bioremediation process, apart from for BaP. This level of contamination changed according to the bioremediation treatment. In the case of biostimulation, this contamination decreased to 0.35 µg·g−1 sediment, while bioaugmentation induced an increase in the sum PAH up to 0.98 µg·g−1 sediment, notably due to the release of BaP by-products (Figure 3A). Regarding the organochlorine family, despite a more pronounced disappearance of DDT in the biostimulated treatment, the overall contamination by this group remained stable through the bioremediation process. Indeed, for the biostimulated treatment, the DDT disappearance (−58%) was counterbalanced by the apparition of DDD and other DDT derivatives, which are major by-products released by its primary aerobic biodegradation (Figure 3A).
As Bizerte bay sediment contains other contaminants in addition to BaP and DDT, organotin and metals were also monitored using bioreporter strains able to detect bioavailable compounds. The TBT3 biosensor revealed the presence of organotin compounds and, notably, TBT in significant amounts in the native sediment. TBT concentration was higher than the TBT3 sensitivity threshold, estimated at 0.01 µM. The bioaugmented treatment brought about a significant decrease in TBT content, to below the detection threshold, whereas its concentration remained significant in the biostimulated treatment (Figure 3A). Metal bioreporters indicated the presence of bioavailable metals As3+, Cu2+, Cd2+, and Hg2+ in the native sediment. The biostimulation treatment did not alter their concentration, whereas bioaugmentation induced a decrease of 1 to 2 log for each metal (Figure 3A).
In parallel with the detection or monitoring of specific organic and inorganic compounds, the monitoring of overall toxicity was useful to assess the true balance of the treatment efficiency.
Acute toxicity of the sediments contaminated with DDT and BaP at the beginning of the experiment was significant and induced a total inhibition of the two microbial models: the marine Aliivibrio fischeri NRRL B-11177 and Escherichia coli DH1 pBTacluxCDABE (Figure 3B,C). The two treatments decreased the toxicity but, according to the two microbial models, bioaugmentation was more efficient with regard to overall toxicity reduction. At the end of the experimental period, there was a drop of 90% of toxicity in the effluent of the bioaugmented reactors compared with a drop of only 48% for the biostimulated reactors. Looking at mutagenicity (Figure 3D,E for TA100, Supplementary Data Figure S1 for S. typhimurium TA98, TA100, TA1535 and TA1537), a decrease is observed for both treatments during the 90 days of incubation. Nevertheless, whatever the time of observation, the biostimulation process never allowed a significant decrease below the threshold, while 90 days of incubation allowed the bioaugmentation process to decrease the mutagenicity with or without addition of the S9 fraction.

4. Discussions

The bioprocess efficiency differed between the bioaugmented and biostimulated treatments in terms of organic carbon consumption and BaP, DDT removal performances. Organic carbon consumption was higher for the bioaugmented treatment and should be correlated directly with the microbial enrichment. This observation seems to be in accordance with the literature in which an increase of organic carbon removal has already been found to be 30% higher with bioaugmentation approaches [62,63,64,65]. Regarding the two contaminants BaP and DDT, bioaugmentation led to a decrease of 23% BaP compared with the biostimulated treatment. However, this biodegradation was not total as observed by [66], and led notably to the release of intermediary by-products, as found in ΣPAH compounds. Concerning DDT, its disappearance was higher in the biostimulated treatment compared with the bioaugmented one, but the sum of organochlorine by-products remained unchanged throughout the bioremediation process, resulting notably in the accumulation in the sediment of DDD, a by-product of major environmental concern [12], (Mansouri et al, 2017). Adding to these major contaminants, bioavailable metals and TBT were monitored during the bioremediation process using bioreporters already described in the literature. The use of bioluminescent reporters highlighted the fact that bioaugmentation provoked a decrease in the concentration of metals and TBT in the sediment compared with biostimulated conditions, for which no relevant changes were found over the incubation. Nevertheless, at this stage of observation, either the bioaugmentation provoked a decrease in bioavailability by a physical modification (measurable with the bioreporter) or the metallic and organotin pollutions were really depolluted, for example by adsorption/chelation/chemical modifications by specific microorganisms, but this question remains to be explored.
Different methods were used to manage the evolution of the bioremediation process, to confirm the absence of toxic events for the autochthonous microbial community in the reactors but also to monitor the strains used for bioaugmentation. The use of bioluminescent bioreporters based on the degrading strains confirmed the absence of any substantial toxicity during the process. This suggests that these autochthonous degraders are able to survive and degrade pollutants in bioremediation systems. To confirm the survivability of the degraders, qPCR analyses were performed at the end of the process and highlighted the maintenance of two out of the three degraders used for bioaugmentation. During the incubation, concentrations of P. stutzeri and R. equi increased by 2 and 4 log, respectively, whereas C. metallidurans concentration decreased down to the detection threshold for both treatments. Coupling this information with the results obtained from the bioluminescent reporters suggests that the C. metallidurans disappearance could have resulted from internal competition rather than toxicity.
Despite the decrease in the targeted contaminants, an increase in toxicity could have occurred due to the release of degradation by-products that can have higher toxicity and/or bioavailability than parental compounds. To ensure that the bioremediation process was not affected in this way, ecotoxicological impact of the bioremediation was assessed with toxicity and mutagenicity measurements. Toxicity was assessed with both a fresh and a saline bacterium. Acute toxicity, which was high at the start of the process, decreased below the detection threshold for the bioaugmented treatment compared with the biostimulated control. These results are in accordance with those obtained in different DDT bioremediation processes in which contaminant removal decreased toxicity [67,68]. The mutagenicity of the sediment decreased for the bioaugmented bioreactors at the end of the incubation. [69], studying the mutagenicity of three PAHs (pyrene, fluoranthene and phenanthrene) and their by-products after their biodegradation by Mycobacterium sp. SNP11, similarly found a significant decrease in the mutagenicity with partial degradation accompanied by the accumulation of intermediary metabolites. However, it is not clear if the level of mutagenicity found at the beginning of our experiment was due to the spiking of BaP and DDT, or whether it was already present in the organic carbon fraction present in the sediment.

5. Conclusion

Bioaugmentation allows an overall increase in organic carbon removal and the detoxification of effluent, despite a relatively low decrease in the BaP and DDT contents. To promote these depollution approaches, it will first be essential to expand such monitoring solutions to assess the efficiency of bioremediation in field conditions. However, according to the diversity of monitoring methods that can be handled to report on a bioremediation, we investigated a relatively large panel of descriptors to characterize a bioremediation process. Among the different methods used, a restricted monitoring panel of analyses appears essential to follow change occurring over the bioremediation process, including the following: (i) organic carbon measurement reporting all biodegradation occurring in the system, as well as a specific method to monitor the decrease of the main compounds; (ii) dissolved N, P, O2 and pH measurements, ensuring the stability of the physico-chemical conditions of the bioreactors; (iii) a qPCR method to track the degraders when bioaugmentation is the selected technique; and (iv) measurements of the acute toxicity, notably toward degrading strains, and the mutagenicity are considered essential. All these analyses provide information about the steady state of the reactors (Figure 4).
These results show that three families of methods are needed to evaluate the effectiveness of a bioremediation process in order to report on the decontamination of the pollutant(s), the proper functioning of the process and finally the ecotoxicity and mutagenicity of the effluent before and after treatment. From a monitoring research point of view, two issues are important. The first is to convince the bioremediation industry to adopt these three families of methods at least in the laboratory. With the exception of toxicity onto degraders that need specific genetic constructions, all the methods are available. The second and most difficult challenge is to transpose most of these methods to the field under the constraints of reliability, simplicity and cost. Our laboratory is now working on developing transportable mini systems to meet industrial needs.

Supplementary Materials

The following supporting information can be downloaded at: https://www.mdpi.com/article/10.3390/su141710932/s1, Figure S1: Mutagenicity of the sediment for Salmonella typhimurium TA 98; TA 100; TA 1535 and TA 1537 without and with S9 supplement (n = 48, tested in triplicate).

Author Contributions

Conceptualization, G.T. and M.-J.D.; Investigation, A.M., M.C. and S.J.; Methodology, A.M., M.C. and M.-J.D.; Project administration, M.-J.D.; Supervision, G.T. and M.-J.D.; Visualization, S.J.; Writing—original draft, A.M., M.C. and M.-J.D.; Writing—review & editing, G.T. and M.-J.D. All authors have read and agreed to the published version of the manuscript.

Funding

Ahlem Mansouri gratefully acknowledges a grant from the Tunisia Research Department and the financial support from the UMR CNRS GEPEA laboratory (France).

Institutional Review Board Statement

Not applicable for studies not involving humans or animals.

Informed Consent Statement

Not applicable for studies not involving humans.

Data Availability Statement

Data sharing not applicable.

Acknowledgments

The authors gratefully acknowledge S. Abbes and A. Landoulsi for the loan of Pseudomonas stutzeri, Cupriavidus metallidurans and Rhodococcus equi strains isolated from Bizerte Lagoon.

Conflicts of Interest

The authors declare that they have no known competing financial interests or personal relationship that could have appeared to influence the work reported in this paper.

References

  1. Dangi, A.K.; Sharma, B.; Hill, R.T.; Shukla, P. Bioremediation through microbes: Systems biology and metabolic engineering approach. Crit. Rev. Biotechnol. 2019, 39, 79–98. [Google Scholar] [CrossRef]
  2. Dua, M.; Singh, A.; Sethunathan, N.; Johri, A. Biotechnology and bioremediation: Successes and limitations. Appl. Microbiol. Biotechnol. 2002, 59, 143–152. [Google Scholar]
  3. Quintella, C.M.; Mata, A.M.T.; Lima, L.C.P. Overview of bioremediation with technology assessment and emphasis on fungal bioremediation of oil contaminated soil. J. Environ. Manag. 2019, 241, 159–166. [Google Scholar] [CrossRef] [PubMed]
  4. Margesin, R.; Fonteyne, P.A.; Redl, B. Low-temperature biodegradation of high amounts of phenol by Rhodococcus spp. and basidiomycetous yeasts. Res. Microbiol. 2005, 156, 68–75. [Google Scholar] [CrossRef] [PubMed]
  5. Teng, Y.; Luo, Y.; Sun, M.; Liu, Z.; Li, Z.; Christie, P. Effect of bioaugmentation by Paracoccus sp. strain HPD-2 on the soil microbial community and removal of polycyclic aromatic hydrocarbons from an aged contaminated soil. Bioresour. Technol. 2010, 101, 3437–3443. [Google Scholar] [CrossRef] [PubMed]
  6. Tyagi, M.; Da Fonseca, M.M.R.; De Carvalho, C.C.C.R. Bioaugmentation and biostimulation stategies to improve the effectiveness of bioremediation processes. Biodegradation 2011, 22, 231–241. [Google Scholar] [CrossRef]
  7. Ward, O.; Singh, A.; Van Hamme, J. Accelerated biodegradation of petroleum hydrocarbon waste. J. Ind. Microbiol. Biotechnol. 2003, 30, 260–270. [Google Scholar] [CrossRef]
  8. Andreoni, V.; Gianfreda, L. Bioremediation and monitoring of aromatic-polluted habitats. Appl. Microbiol. Biotechnol. 2007, 76, 287–308. [Google Scholar] [CrossRef]
  9. Crisafi, F.; Genovese, M.; Smedile, F.; Russo, D.; Catalfamo, M.; Yakimov, M.; Denaro, R. Bioremediation technologies for polluted seawater sampled after an oil-spill in Taranto Gulf (Italy): A comparison of biostimulation, bioaugmentation and use of a washing agent in microcosm studies. Mar. Pollut. Bull. 2016, 106, 119–126. [Google Scholar] [CrossRef]
  10. Heitzer, A.; Sayler, G.S. Monitoring the efficacy of bioremediation. Trends Biotechnol. 1993, 11, 334–343. [Google Scholar] [CrossRef]
  11. Korda, A.; Santas, P.; Tenente, A.; Santas, R. Petroleum hydrocarbon bioremediation: Sampling and analytical techniques, in situ treatments and commercial microorganisms currently used. Appl. Microbiol. Biotechnol. 1997, 48, 677–686. [Google Scholar] [CrossRef] [PubMed]
  12. Mansouri, A.; Cregut, M.; Abbes, C.; Durand, M.J.; Landoulsi, A.; Thouand, G. The environmental issues of DDT pollution and bioremediation: A multidisciplinary review. Appl. Biochem. Biotechnol. 2017, 181, 309–339. [Google Scholar] [CrossRef]
  13. Martins, M.V.A.; Zaaboub, N.; Aleya, L.; Frontalini, F.; Pereira, E.; Miranda, P.; Mane, M.; Rocha, F.; Laut, L.; El Bour, M. Environmental quality assessment of Bizerte Lagoon (Tunisia) using living foraminifera assemblages and a multiproxy approach. PLoS ONE 2015, 10, e0137250. [Google Scholar] [CrossRef]
  14. Phillips, T.M.; Liu, D.; Seech, A.G.; Lee, H.; Trevors, J.T. Monitoring bioremediation in creosote-contaminated soils using chemical analysis and toxicity tests. J. Ind. Microbiol. Biotech. 2000, 24, 132–139. [Google Scholar] [CrossRef]
  15. Pierro, L.; Matturro, B.; Rossetti, S.; Sagliaschi, M.; Sucato, S.; Alesi, E.; Bartsch, E.; Arjmand, F.; Papini, M.P. Polyhydroxyalkanoate as a slow-release carbon source for in situ bioremediation of contaminated aquifers: From laboratory investigation to pilot-scale testing in the field. New Biotechnol. 2017, 37, 60–68. [Google Scholar] [CrossRef] [PubMed]
  16. Sabaté, J.; Viñas, M.; Solanas, A.M. Bioavailability assessment and environmental fate of polycyclic aromatic hydrocarbons in biostimulated creosote-contaminated soil. Chemosphere 2006, 63, 1648–1659. [Google Scholar] [CrossRef]
  17. Van Straalen, N.M. Assessment of soil contamination–a functional perspective. Biodegradation 2002, 13, 41–52. [Google Scholar] [CrossRef]
  18. D’souza, S.F. Microbial biosensors. Biosens. Bioelectron. 2001, 16, 337–353. [Google Scholar] [CrossRef]
  19. Man, Y.B.; Chow, K.L.; Kang, Y.; Wong, M.H. Mutagenicity and genotoxicity of Hong Kong soils contaminated by polycyclic aromatic hydrocarbons and dioxins/furans. Mutat. Res. Genet. Toxicol. Environ. Mutagen. 2013, 752, 47–56. [Google Scholar] [CrossRef]
  20. Phillips, T.M.; Liu, S.; Seech, A.G. Bioremediation in Field Box Plots of a Soil Contaminated with Wood-Preservatives: A Comparison of Treatment Conditions using Toxicity Testing as a Monitoring Technique. Water Air Soil Pollut. 2000, 121, 173–187. [Google Scholar] [CrossRef]
  21. Steliga, T.; Jakubowicz, P.; Kapusta, P. Changes in toxicity during in situ bioremediation of weathered drill wastes contaminated with petroleum hydrocarbons. Bioresour. Technol. 2012, 125, 1–10. [Google Scholar] [CrossRef] [PubMed]
  22. Verma, N.; Singh, M. Biosensors for heavy metals. Biometals 2005, 18, 121–129. [Google Scholar] [CrossRef] [PubMed]
  23. White, D.C.; Flemming, C.A.; Leung, K.T.; Macnaughton, S.J. In situ microbial ecology for quantitative appraisal, monitoring, and risk assessment of pollution remediation in soils, the subsurface, the rhizosphere and in biofilms. J. Microbiol. Methods 1998, 32, 93–105. [Google Scholar] [CrossRef]
  24. Widada, J.; Nojiri, H.; Omori, T. Recent developments in molecular techniques for identification and monitoring of xenobiotic-degrading bacteria and their catabolic genes in bioremediation. Appl. Microbiol. Biotechnol. 2002, 60, 45–59. [Google Scholar]
  25. Barhoumi, B.; Elbarhoumi, A.; Clérandeau, C.; Al-Rawabdeh, A.M.; Atyaoui, A.; Touil, S.; Driss, M.R.; Cachot, J. Using an Integrated Approach to Assess the Sediment Quality of a Mediterranean Lagoon, the Bizerte Lagoon (Tunisia). Ecotoxicology 2016, 25, 1082–1104. [Google Scholar] [CrossRef]
  26. De Souza Pohren, R.; Rocha, J.A.V.; Horn, K.A.; Vargas, V.M.F. Bioremediation of soils contaminated by PAHs: Mutagenicity as a tool to validate environmental quality. Chemosphere 2019, 214, 659–668. [Google Scholar] [CrossRef]
  27. Dorn, P.B.; Salanitro, J.P. Temporal ecological assessment of oil contaminated soils before and after bioremediation. Chemosphere 2000, 40, 419–426. [Google Scholar] [CrossRef]
  28. Foucault, Y.; Durand, M.J.; Tack, K.; Schreck, E.; Geret, F.; Leveque, T.; Pradere, P.; Goix, S.; Dumat, C. Use of ecotoxicity test and ecoscores to improve the management of polluted soils: Case of a secondary lead smelter plant. J. Hazard. Mater. 2013, 246, 291–299. [Google Scholar] [CrossRef] [PubMed]
  29. Jouanneau, S.; Durand, M.J.; Lahmar, A.; Thouand, G. Main Technological Advancements in Bacterial Bioluminescent Biosensors Over the Last Two Decades. In Bioluminescence: Fundamentals and Applications in Biotechnology; Thouand, G., Marks, R., Eds.; Advances in Biochemical Engineering/Biotechnology; Springer: Berlin/Heidelberg, Germany, 2015; Volume 3, pp. 101–116. [Google Scholar]
  30. Kim, K.R.; Owens, G. Potential for enhanced phytoremediation of landfills using biosolids—A review. J. Environ. Manag. 2010, 91, 791–797. [Google Scholar] [CrossRef]
  31. Lei, Y.; Chen, W.; Mulchandani, A. Microbial biosensors. Anal. Chim. Acta 2006, 568, 200–210. [Google Scholar] [CrossRef]
  32. Leitgib, L.; Kálmán, J.; Gruiz, K. Comparison of bioassays by testing whole soil and their water extract from contaminated sites. Chemosphere 2007, 66, 428–434. [Google Scholar] [CrossRef] [PubMed]
  33. Płaza, G.; Nałęcz-Jawecki, G.; Ulfig, K.; Brigmon, R.L. The application of bioassays as indicators of petroleum-contaminated soil remediation. Chemosphere 2005, 59, 289–296. [Google Scholar] [CrossRef] [PubMed]
  34. Saterbak, A.; Toy, R.J.; Wong, D.C.; McMain, B.J.; Williams, M.P.; Dorn, P.B.; Brzuzy, L.P.; Chai, E.Y.; Salanitro, J.P. Ecotoxicological and analytical assessment of hydrocarbon-contaminated soils and application to ecological risk assessment. Environ. Toxicol. Chem. 1999, 18, 1591–1607. [Google Scholar] [CrossRef]
  35. Chi, X.Q.; Zhang, J.J.; Zhao, S.; Zhou, N.Y. Bioaugmentation with a consortium of bacterial nitrophenol-degraders for remediation of soil contaminated with three nitrophenol isomers. Environ. Pollut. 2013, 172, 33–41. [Google Scholar] [CrossRef] [PubMed]
  36. Edlund, A.; Jansson, J.K. Changes in active bacterial communities before and after dredging of highly polluted Baltic Sea sediments. Appl. Environ. Microbiol. 2006, 72, 6800–6807. [Google Scholar] [CrossRef]
  37. Hall, K.; Miller, C.D.; Sorensen, D.L.; Anderson, A.J.; Sims, R.C. Development of a catabolically significant genetic probe for polycyclic aromatic hydrocarbon-degrading Mycobacteria in soil. Biodegradation 2005, 16, 475–484. [Google Scholar] [CrossRef]
  38. Hendrickx, B.; Dejonghe, W.; Boënne, W.; Brennerova, M.; Cernik, M.; Lederer, T.; Bucheli-Witschel, M.; Bastiaens, L.; Verstraete, W.; Top, E.M.; et al. Dynamics of an oligotrophic bacterial aquifer community during contact with a groundwater plume contaminated with benzene, toluene, ethylbenzene, and xylenes: An in situ mesocosm study. Appl. Environ. Microbiol. 2005, 71, 3815–3825. [Google Scholar] [CrossRef]
  39. Junca, H.; Pieper, D.H. Functional gene diversity analysis in BTEX contaminated soils by means of PCR-SSCP DNA fingerprinting: Comparative diversity assessment against bacterial isolates and PCR-DNA clone libraries. Environ. Microbiol. 2004, 6, 95–110. [Google Scholar] [CrossRef]
  40. Paissé, S.; Coulon, F.; Goñi-Urriza, M.; Peperzak, L.; McGenity, T.J.; Duran, R. Structure of bacterial communities along a hydrocarbon contamination gradient in a coastal sediment. FEMS Microbiol. Ecol. 2008, 66, 295–305. [Google Scholar] [CrossRef]
  41. Rutgers, M.; Breure, A.M. Risk assessment, microbial communities, and pollution-induced community tolerance. Hum. Ecol. Risk Assess 1999, 5, 661–670. [Google Scholar] [CrossRef]
  42. Sabaté, J.; Vinas, M.; Solanas, A.M. Laboratory-scale bioremediation experiments on hydrocarbon-contaminated soils. Int. Biodeterior. Biodegrad. 2004, 54, 19–25. [Google Scholar] [CrossRef]
  43. Barhoumi, B.; LeMenach, K.; Devier, M.H.; Ben Ameur, W.; Etcheber, H.; Budzinski, H.; Cachot, J.; Driss, M.R. Polycyclic aromatic hydrocarbons (PAHs) in surface sediments from the Bizerte Lagoon, Tunisia: Levels, sources, and toxicological significance. Environ. Monit. Assess. 2014, 186, 2653–2669. [Google Scholar] [CrossRef] [PubMed]
  44. Barhoumi, B.; LeMenach, K.; Devier, M.H.; El Megdiche, Y.; Hammami, B.; Ben Ameur, W.; Ben Hassine, S.; Cachot, J.; Budzinski, H.; Driss, M.R. Distribution and ecological risk of polychlorinated biphenyls (PCBs) and organochlorine pesticides (OCPs) in surface sediments from the Bizerte lagoon, Tunisia. Environ. Sci. Pollut. Res. 2014, 21, 6290–6302. [Google Scholar] [CrossRef]
  45. Mansouri, A.; Abbes, C.; Ben Mouhoub, R.; Ben Hassine, S.; Landoulsi, A. Enhancement of mixture pollutant biodegradation efficiency using a bacterial consortium under static magnetic field. PLoS ONE 2019, 14, e0208431. [Google Scholar] [CrossRef] [PubMed]
  46. Jouanneau, S.; Durand, M.J.; Courcoux, P.; Blusseau, T.; Thouand, G. Improvement of the identification of four heavy metals in environmental samples by using predictive decision tree models coupled with a set of five bioluminescent bacteria. Env. Sci. Technol. 2011, 45, 2925–2931. [Google Scholar] [CrossRef]
  47. Atlas, R.M. Handbook of Microbiological Media, 2nd ed.; CRC Press: Boca Raton, FL, USA, 1997. [Google Scholar]
  48. Ben Garali, A.; Ouakad, M.; Gueddari, M. Contamination of superficial sediments by heavy metals and iron in the Bizerte lagoon, northern Tunisia. Arab. J. Geosci. 2010, 3, 295–306. [Google Scholar] [CrossRef]
  49. Trabelsi, S.; Driss, M.R. Polycyclic aromatic hydrocarbons in superficial coastal sediments from Bizerte Lagoon, Tunisia. Mar. Pollut. Bull. 2005, 50, 344–348. [Google Scholar] [CrossRef]
  50. OECD. Sediment-Water Chironomid Life-Cycle Toxicity Test Using Spiked Water or Spiked Sediment. In OECD Guidelines for the Testing of Chemicals Proposal for a New Guideline 2009; OECD: Paris, France, 2009. [Google Scholar]
  51. Charrier, T.; Chapeau, C.; Bendria, L.; Picart, P.; Daniel, P.; Thouand, G. A multi-channel bioluminescent bacterial biosensor for the on-line detection of metals and toxicity. Part II: Technical development and proof of concept of the biosensor. Anal. Bioanal. Chem. 2011, 400, 1061–1070. [Google Scholar] [CrossRef]
  52. Jouanneau, S.; Durand, M.J.; Thouand, G. Online detection of metals in environmental samples: Comparing two concepts of bioluminescent bacterial biosensors. Env. Sci. Technol. 2012, 46, 11979–11987. [Google Scholar] [CrossRef]
  53. Gueuné, H.; Thouand, G.; Durand, M.J. A new bioassay for the inspection and identification of TBT-containing antifouling paint. Mar. Pollut. Bull. 2009, 58, 1734–1738. [Google Scholar] [CrossRef]
  54. Durand, M.J.; Thouand, G.; Dancheva-Ivanova, T.; Vachon, P.; DuBow, M. Specific detection of organotin compounds with a recombinant luminescent bacteria. Chemosphere 2003, 52, 103–111. [Google Scholar] [CrossRef]
  55. Cregut, M.; Jouanneau, S.; Brillet, F.; Durand, M.J.; Sweetlove, C.; Chenèble, J.C.; L’Haridon, J.; Thouand, G. High throughput and miniaturised systems for biodegradability assessments. Environ. Sci. Pollut. Res. 2014, 21, 9545–9552. [Google Scholar] [CrossRef] [PubMed]
  56. François, B.; Maul, A.; Durand, M.J.; Thouand, G. From laboratory to environmental conditions: A new approach for chemical’s biodegradability assessment. Environ. Sci. Pollut. Res. 2016, 23, 18684–18693. [Google Scholar] [CrossRef] [PubMed]
  57. Bennasar, A.; Guasp, C.; Lalucat, J. Molecular methods for the detection and identification of Pseudomonas stutzeri in pure culture and environmental samples. Microbial. Ecol. 1998, 35, 22–33. [Google Scholar] [CrossRef]
  58. Ryan, M.P.; Adley, C.C. Specific PCR to identify the heavy-metal-resistant bacterium Cupriavidus metallidurans. J. Ind. Microbiol. Biotechnol. 2011, 38, 1613–1615. [Google Scholar] [CrossRef]
  59. Rodríguez-Lázaro, D.; Lewis, D.A.; Ocampo-Sosa, A.A.; Fogarty, U.; Makrai, L.; Navas, J.; Scortti, M.; Hernández, M.; Vázquez-Boland, J.A. Internally controlled real-time PCR method for quantitative species-specific detection and vapA genotyping of Rhodococcus equi. Appl. Environ. Microbiol. 2006, 72, 4256–4263. [Google Scholar] [CrossRef]
  60. ISO 11348-3:2007; Water Quality—Determination of the Inhibitory Effect of Water Samples on the Light Emission of Vibrio fischeri (Luminescent bacteria Test)—Part 3: Method Using Freeze-Dried Bacteria. ISO: Geneva, Switzerland, 2007.
  61. Ames, B.N.; McCann, J.; Yamasaki, E. Methods for detecting carcinogens and mutagens with the Salmonella/mammalian-microsome mutagenicity test. Mut. Res. Environ. Mutagenesis Relat. Subj. 1975, 31, 347–363. [Google Scholar] [CrossRef]
  62. Ceccanti, B.; Masciandaro, G.; Garcia, C.; Macci, C.; Doni, S. Soil bioremediation: Combination of earthworms and compost for the ecological remediation of a hydrocarbon polluted soil. Water Air Soil Pollut. 2006, 177, 383–397. [Google Scholar] [CrossRef]
  63. Kao, C.M.; Wang, C.C. Control of BTEX migration by intrinsic bioremediation at a gasoline spill site. Water Res. 2000, 34, 3413–3423. [Google Scholar] [CrossRef]
  64. Lin, T.C.; Pan, P.T.; Cheng, S.S. Ex situ bioremediation of oil-contaminated soil. J. Hazard. Mater. 2010, 176, 27–34. [Google Scholar] [CrossRef]
  65. Vinas, M.; Sabaté, J.; Espuny, M.J.; Solanas, A.M. Bacterial community dynamics and polycyclic aromatic hydrocarbon degradation during bioremediation of heavily creosote-contaminated soil. Appl. Environ. Microbiol. 2005, 71, 7008–7018. [Google Scholar] [CrossRef] [PubMed]
  66. Nocentini, M.; Pinelli, D.; Fava, F. Bioremediation of a soil contaminated by hydrocarbon mixtures: The residual concentration problem. Chemosphere 2000, 41, 1115–1123. [Google Scholar] [CrossRef]
  67. Betancur-Corredor, B.; Pino, N.J.; Cardona, S.; Peñuela, G.A. Evaluation of biostimulation and Tween 80 addition for the bioremediation of long-term DDT-contaminated soil. J. Environ. Sci. 2015, 28, 101–109. [Google Scholar] [CrossRef] [PubMed]
  68. Brohon, B.; Gourdon, R. Influence of soil microbial activity level on the determination of contaminated soil toxicity using Lumistox and MetPlate bioassays. Soil Biol. Biochem. 2000, 32, 853–857. [Google Scholar] [CrossRef]
  69. Pagnout, C.; Rast, C.; Veber, A.M.; Poupin, P.; Férard, J.F. Ecotoxicological assessment of PAHs and their dead-end metabolites after degradation by Mycobacterium sp. strain SNP11. Ecotoxicol. Environ. Saf. 2006, 65, 151–158. [Google Scholar] [CrossRef]
Figure 1. Bioreactor configuration and biomonitoring strategies used to assess sediment bioremediation. Eight bioreactors were studied simultaneously to assess the performance of two bioremediation conditions: four control reactors are biostimulated by a mineral medium (M9) only, and four reactors are biostimulated and bioaugmented with a bacterial consortium composed of three known BaP and DDT degraders (A). Detailed information about the bioremediation processes (B). Different measurements performed during the bioremediation process for the sediment and effluent (recirculating M9 medium) (C).
Sustainability 14 10932 g001
Figure 2. Overall depollution of the biostimulated and bioaugmented bioremediation processes, with organic carbon disappearance for the solid fraction (A) and soluble fraction (B). Disappearance of benzo(a)pyrene (BaP) and DDT (C). Evolution of the microbial biomass in the effluent for bioaugmented and biostimulated treatments (D). Acute toxicity of the effluent for the three autochthonous degrading strains used for bioaugmentation (E) and their maintenance quantified by quantitative PCR at the end of the process (F). Results presented correspond to a mean and a standard deviation of 4 reactors for each treatment.
Sustainability 14 10932 g002
Figure 3. Distribution of the native pollutants present in the sediment and by-products released by the bioremediation process respectively in the effluent and in sediment noted as (E) and (S) (A); *∑PAH corresponds to the sum of the 15 PAH reported in the EPA (without the BaP value). Toxicity of the effluent for the constitutive bioluminescent bioreporters Aliivibrio fischeri NRRL B-11177 (B) and Escherichia coli pBtacluxCDABE (C). Mutagenicity of the sediment for Salmonella typhimurium TA-100 without and with S9 supplement (n = 48, tested in triplicate) (D,E).
Sustainability 14 10932 g003
Figure 4. Suggested set and sampling frequency for the monitoring methods used in this study. (3) Every 3 days; (10) every 10 days; (30) every 30 days; (END) at the end. An essential panel of methods is proposed in blue.
Sustainability 14 10932 g004
Table 1. Primers used for the detection of bacteria used for the bioaugmentation.
StrainsTarget GenePrimersTm (°C)References
Pseudomonas stutzeriFps1585′-GTGGGGGACAACGTTTC-3′
5′-CGATTATGACTGACTCCAC-3′
48[57]
Cupriavidus metalliduransCm5′-AGTTTCCTGGCCATGATGAG-3′
5′-TCCGTTTCCTGTACCACCTC-3′
59[58]
Rhodococcus equiChoE5′-CGACAAGCGCTCGATGTG-3′
3′-TGCCGAAGCCCATGAAGT-5′
56[59]
Publisher’s Note: MDPI stays neutral with regard to jurisdictional claims in published maps and institutional affiliations.

