Article

Can Carbon Emission Trading Policy Reduce PM2.5? Evidence from Hubei, China

1
College of Civil Engineering, Nanjing Forestry University, Nanjing 210037, China
2
College of Art & Design, Nanjing Forestry University, Nanjing 210037, China
*
Author to whom correspondence should be addressed.
Sustainability 2022, 14(17), 10755; https://doi.org/10.3390/su141710755
Submission received: 24 July 2022 / Revised: 21 August 2022 / Accepted: 26 August 2022 / Published: 29 August 2022
(This article belongs to the Special Issue Air Pollution Management and Environment Research)

Abstract

:
China is facing serious haze pollution while its economy is developing at a high speed. Nevertheless, traditional command-and-control environmental regulation has been ineffective in reducing haze pollution. The Chinese government must find more effective ways to combat haze pollution immediately. Through the synthetic control method, this paper uses the provincial PM2.5 concentration and economic data from 2000 to 2016 to examine the causal effect between the Hubei carbon emission trading pilot and haze pollution, and further establish a mediating effect model to explore the impact mechanism between the carbon emission trading market and haze pollution. The results show that the pilot of carbon emission trading in Hubei Province has led to a decrease of PM2.5 by 10% in five years, which is significant at least at the level of 10%. It mainly achieves the purpose of reducing haze pollution by adjusting the energy structure and increasing R&D investment.

1. Introduction

Since the reform and opening-up, China’s economy has developed rapidly, achieving the progress from a low-income country to a middle-income country. From 1978 to 2020, China’s total GDP has increased 42 times, with an average annual growth rate of 9.3%, becoming the world’s second largest economy [1] after the United States. However, in the process of rapid economic growth and the creation of a large amount of material wealth, serious environmental problems have been increasingly exposed. The 2020 global environmental performance index report shows that China’s environmental performance ranks 120th among 180 countries, and the environmental problems that appear in stages in the industrialization process of developed countries are concentrated in China in a short period of time.
As one of the main manifestations of environmental problems, haze pollution has the characteristics of wide coverage, high degree of harm, and long duration [2]. PM2.5 (fine particles less than or equal to 2.5 microns in diameter) [3], the culprit of haze weather, pose a serious threat to the human body. After PM2.5 is inhaled into the human body, part of it is effectively deposited in all areas of the respiratory tract [4] through the diffusion mechanism, and the other part is absorbed into cells; passes through epithelial cells and endothelial cells; and reaches potential sensitive target sites, such as the bone marrow, lymph nodes, spleen, and heart, through blood circulation and lymphatic circulation [5], causing premature mortality in humans [6]. According to the 2016 report of the World Health Organization, outdoor exposure to fine particulate matter causes over 3 million deaths worldwide [7]. From 2013 to 2018, the over-standard rate of urban air quality in China remained at more than 60 percent according to the environmental situation bulletin published by the Chinese government over the years. Likewise, PM2.5 is the main pollutant in the days of heavy pollution, accounting for 78.8%. However, PM2.5 does not only harm human health [8] and shorten life expectancy [7], but also interferes with the earth’s climate change, resulting in the weakening of the atmospheric cycle [9] and the water cycle [10,11], and affects human capital, leading to the decline of labor productivity [12], further aggravating the gap between the rich and poor [13]. How to effectively restrain haze pollution has become an important environmental problem in China, and it is also the main purpose of our research.
Faced with worsening haze pollution, the Chinese government typically formulates environmental regulations to limit pollutant emissions [14], and implements fines or the closure of polluting enterprises in order to reduce pollution [15]. This traditional “command-and-control environmental regulation” failed to effectively reduce pollution, and PM2.5-dominated air pollution deteriorated [16]. The primary reason is that the Chinese government’s punishment measures failed to effectively curb the pollution behavior of businesses [17] and failed to encourage cleaner production by businesses. The promotion of Chinese government officials is strongly correlated with the GDP [18,19]. Under the system of intense political competition, local government officials lack the motivation for environmental supervision; consequently, air quality may continue to deteriorate [20,21]. The existing literature shows that the traditional environmental supervision measures have not effectively restrained the haze pollution problem, and the Chinese government must immediately implement more effective measures to reduce haze pollution. China started the pilot construction of carbon emission trading in 2011, and successively opened carbon emission trading pilot projects in Shenzhen, Shanghai, Beijing, Guangzhou, Tianjin, Hubei, and Chongqing in 2013, corresponding to the establishment of seven voluntary greenhouse gas emission reduction trading institutions to start online trading [22]. As a type of market incentive environmental regulation, whether the carbon emission trading market can reduce haze pollution has become a pressing issue that must be addressed. However, the present research is almost non-existent, since it focuses on the emission reduction effect of the carbon emission trading market [23,24] while disregarding the carbon emission trading market’s potential collaborative governance capability. The carbon emission trading market aims to reduce carbon dioxide emissions. Considering the correlation between carbon dioxide and PM2.5, the main sources of carbon dioxide and PM2.5 come from the combustion of fossil fuels and vehicle emissions [25]. The carbon emission trading market may promote enterprises to increase investment in technological innovation [17,18,19,20,21,22,23] and reduce the use of fossil energy and adjust the energy structure [17], as well as reduce PM2.5 pollution, so as to achieve the effect of coordinated control of the greenhouse effect and haze pollution. However, existing research also shows that China’s carbon emission trading market may not alleviate haze pollution. A national survey found that Chinese enterprises have little enthusiasm for participating in the carbon emission trading market, and most enterprises only regard participating in the carbon emission trading market as a means to improve relations with the government and win a good social reputation [26]. In addition, quotas are allocated according to the historical emission data of enterprises in the past few years. Those enterprises that have excellent emission reduction capacity and have taken emission reduction actions may, therefore, receive fewer quotas, which may further weaken their motivation to reduce emissions [27]. On the other hand, environmental regulation may have a pollution substitution effect. Environmental regulation for a single pollutant causes the emission cost of the pollutant to rise, and enterprises may take alternative measures to cause other media pollution [28,29]. For example, due to the US Clean Air Act’s increasing emission cost of air pollution, some enterprises use a large amount of water in terminal treatment, resulting in increased water pollution [28,29,30], which is difficult for regulators to capture [29]. In a word, whether carbon emission trading can inhibit haze pollution is of great significance. At present, there is a relative lack of empirical research, which requires us to further explore the internal mechanisms of carbon emission trading and haze pollution.
This paper adopts the synthetic control method proposed by Abadie and Gardeazabal [31] to evaluate the causal effect of carbon emission trading pilot policy and haze pollution, empirically tests whether the carbon emission trading market has achieved the synergistic governance effect on haze pollution, and verifies the rationality of the Hubei carbon emission trading pilot from the perspective of haze pollution by using the PM2.5 concentration and economic data of China’s provincial administrative regions from 2000 to 2016. In addition, this paper further studies the impact mechanism of reducing PM2.5 concentration in the carbon emission trading market and provides corresponding suggestions for controlling haze pollution and improving the construction of China’s carbon emission trading market.
Compared with the existing literature research, the possible innovations of this paper focus on the following three aspects: first of all, the research on the policy effects of the carbon emission trading market at present focuses on the carbon dioxide emission reduction effect and the economic effect of the carbon emission trading market, ignoring the possible impact of the carbon emission trading market on haze pollution. This paper enriches the carbon emission trading policy evaluation theory from the perspective of haze pollution, and verifies the rationality of the pilot element design of China’s carbon emission trading market. Second, the existing research on environmental regulation and haze pollution concentrates on environmental regulation’s efficacy while neglecting the distinctions between environmental laws. Although traditional command-based environmental regulation can have a certain effect in the short term, there are many problems. This paper takes the market-based environmental regulation, the Hubei carbon emission trading pilot, as the research object. Empirical evaluation of its causal relationship with haze pollution has explored a new possible way for China to control haze pollution. Third, this paper’s research technique differs from prior publications. Currently, much of the research employs the computable general equilibrium (CGE) model to assess the impact of the carbon emission trading market prior to participation. The CGE model, on the other hand, is based on model assumptions, but lacks empirical backing. As a result, the CGE model’s applicability in policy assessment has several limitations. In addition, despite the fact that the publications employing difference-in-difference (DID) investigated the impact of carbon emission trading policies from a post-engagement viewpoint, it is impossible to exclude the subjectivity of picking the control group [32]. The synthetic control mechanism utilized in this study circumvents the aforementioned issues.
The remainder of this paper is structured as follows: first, a literature review is presented in Section 2; then, the background of China’s carbon emission trading policy is introduced in Section 3; after which, the theoretical model data and methods of this paper are displayed in Section 4; the empirical model is proposed in Section 5; the impact mechanism is further explored in Section 6; and finally, the paper’s conclusions and recommendations are presented in Section 7.

2. Literature Review

2.1. Relevant Research on Haze Pollution Control

Due to China’s unique political environment, the Chinese government’s most common method of environmental regulation is issuing administrative orders to intervene in economic production to reduce haze pollution [14]. This command-and-control environmental regulation, such as the closure of polluting businesses and the imposition of fines, is essential for controlling haze pollution because it can intervene in time [33,34] to improve air quality in a short time [35]. Despite the fact that command-and-control environmental regulation has played a positive role, many academics believe that it has numerous problems [36]. They found that command-and-control environmental regulation did not take into account the variation in emission reduction costs and did not use the lowest cost method to reduce pollution, resulting in inefficient governance [37]. Using spatial econometric models, Li (2019) [38] demonstrated that command-controlled environmental regulation is not conducive to environmental technology innovation. Li and Wu (2017) [39] subdivided China’s prefecture-level cities based on urban political characteristics and regional differences; discovered that government environmental supervision inhibited the original technological innovation of enterprises; and believed that the government should reduce market intervention and improve enterprises’ adaptability to market changes. In addition, enterprises with different attributes exhibit distinct behavioral characteristics in response to command-and-control environment regulations. Companies with clean production will lobby to strengthen regulation, whereas companies with high pollution may lobby to weaken regulation, resulting in the final regulatory measures favoring the interest groups of high-pollution companies [40]. In summary, China’s traditional command-and-control approach to environmental regulation failed to effectively alleviate haze pollution. On the one hand, when the government administrative department punished the pollution behaviors of businesses, the environment had been polluted and the goal of protecting the environment was not achieved [17]. Correspondingly, in the face of enormous profits, businesses frequently viewed punishment as insignificant, and lacked the motivation to control pollution [41]. On the other hand, regulatory authorities have limited resources, and the behavior of local governments within their jurisdiction is constrained by financial pressure. To avoid the transfer of environmental costs, they tend to reduce environmental regulation standards and attract polluting businesses [42]. Simultaneously, in the official promotion evaluation system with GDP as the central index, the primary objective of government officials is to increase GDP, and a significant evaluation index related to political promotion [17,18]; therefore, local government officials tend to relax regulation, and air quality may worsen [20,21].

2.2. Research on Carbon Emission Trading

The Coase theorem, proposed by Coase in 1960, serves as the theoretical foundation for the carbon emission trading market as a typical market incentive for environmental regulation [43]. By establishing a mature market mechanism, he can develop an incentive measure. Even without oversight, businesses can achieve environmental objectives at the lowest cost. The carbon emission trading markets in Europe and the United States were established earlier and are generally more mature than China’s system, which is still in its infancy. Many scholars compared the differences between China and the European and American carbon trading markets and put forward the experience of China’s carbon trading market construction. For instance, Liu (2015) [44] compared China’s carbon emission trading market to that of developed nations, highlighting the dominance of state-owned enterprises in China and the macrocontrol of electricity prices that distorts the market economy and eliminates the market’s functional characteristics. The inefficiency of China’s carbon emission trading market was analyzed by Zhao (2017) and others [45] in terms of institutional arrangements, market participants, and supply and demand. Scholars believe that the construction of China’s carbon emission trading market should be optimized by reducing the range of quota changes [46], increasing policy transparency [47], exploring effective emission reduction mechanisms [48], and rationally utilizing government regulation [49]. However, the literature on the effectiveness of China’s carbon emission trading market is scarce, with the majority of studies focusing on the market’s effect on emission reduction. Zhang (2020) and others [23] evaluated the emission reduction effect of China’s emission trading policy and concluded that the carbon emission trading market can effectively reduce the carbon emissions of pilot cities. Yu (2020) [50] examined the effect and mechanism of the carbon emission trading market on urban carbon emission intensity, and found that the carbon emission trading market significantly promoted the reduction of carbon emissions by adjusting the industrial structure and energy conservation and emission reduction strategies.
In respect to the policy evaluation methods, many studies have established a CGE model to simulate the effects of carbon emission trading policies from the perspective of pre-engagement. Tang (2013) [51] simulated the impact on economic output and social welfare at the national and regional levels with and without a carbon emission trading market. Compared to the mandatory emission contract scenario, the economic output and welfare losses under the implementation of carbon emission trading are significantly lower. Peng (2015) [52] analyzed the economic impact of four energy-intensive industries in Guangdong Province against the backdrop of carbon emission trading policy using the dynamic CGE model of two regions. However, previous simulations rely on model assumptions and lack empirical support. Consequently, the application of the CGE model to the evaluation of policy has certain limitations. Nevertheless, there are still some academics who evaluate the policy impact of carbon emission trading from a post-period perspective. Zhang (2020) and others [23] evaluated the impact of China’s carbon emission trading market on carbon emissions using the DID model, whereas Yu (2020) [50] examined the impact and mechanism of the carbon emission trading market on urban carbon emission intensity using the DID model. However, the subjectivity of the DID model makes it difficult to objectively select the control group. It is crucial to select the control group in a scientific and objective manner [53].
In a word, the existing literature contains a great deal of research on China’s carbon emission trading market and pollution control, but there are still gaps in the research: first, the existing research focuses primarily on the impact of the carbon emission trading market on carbon dioxide emissions and economic benefits; however, what is the impact of the carbon emission trading market on PM2.5? Will the carbon emission trading market result in the “pollution substitution” or “collaborative governance” of multiple pollutants? Effective research of the carbon emission trading market is incomplete due to the lack of relevant evidence at present. Second, domestic articles on haze pollution control emphasize the effectiveness of environmental regulation while disregarding its heterogeneity. Traditional command-and-control environmental regulation has numerous flaws in the context of environmental governance. It must be investigated whether carbon emission trading, as a market incentive for environmental regulation, can control haze pollution. Lastly, due to the late development of China’s carbon emission trading market and the immature market construction, the majority of studies use CGE models for policy simulation, and the literature on empirical analysis of carbon emission trading effects using data from the post perspective is scarce, and the majority of empirical analysis articles use CGE models for policy evaluation. However, it is subjective and must satisfy the common trend assumption, which may result in estimation error. Therefore, it is necessary to reevaluate China’s carbon emission trading market using reasonable and scientific methods.

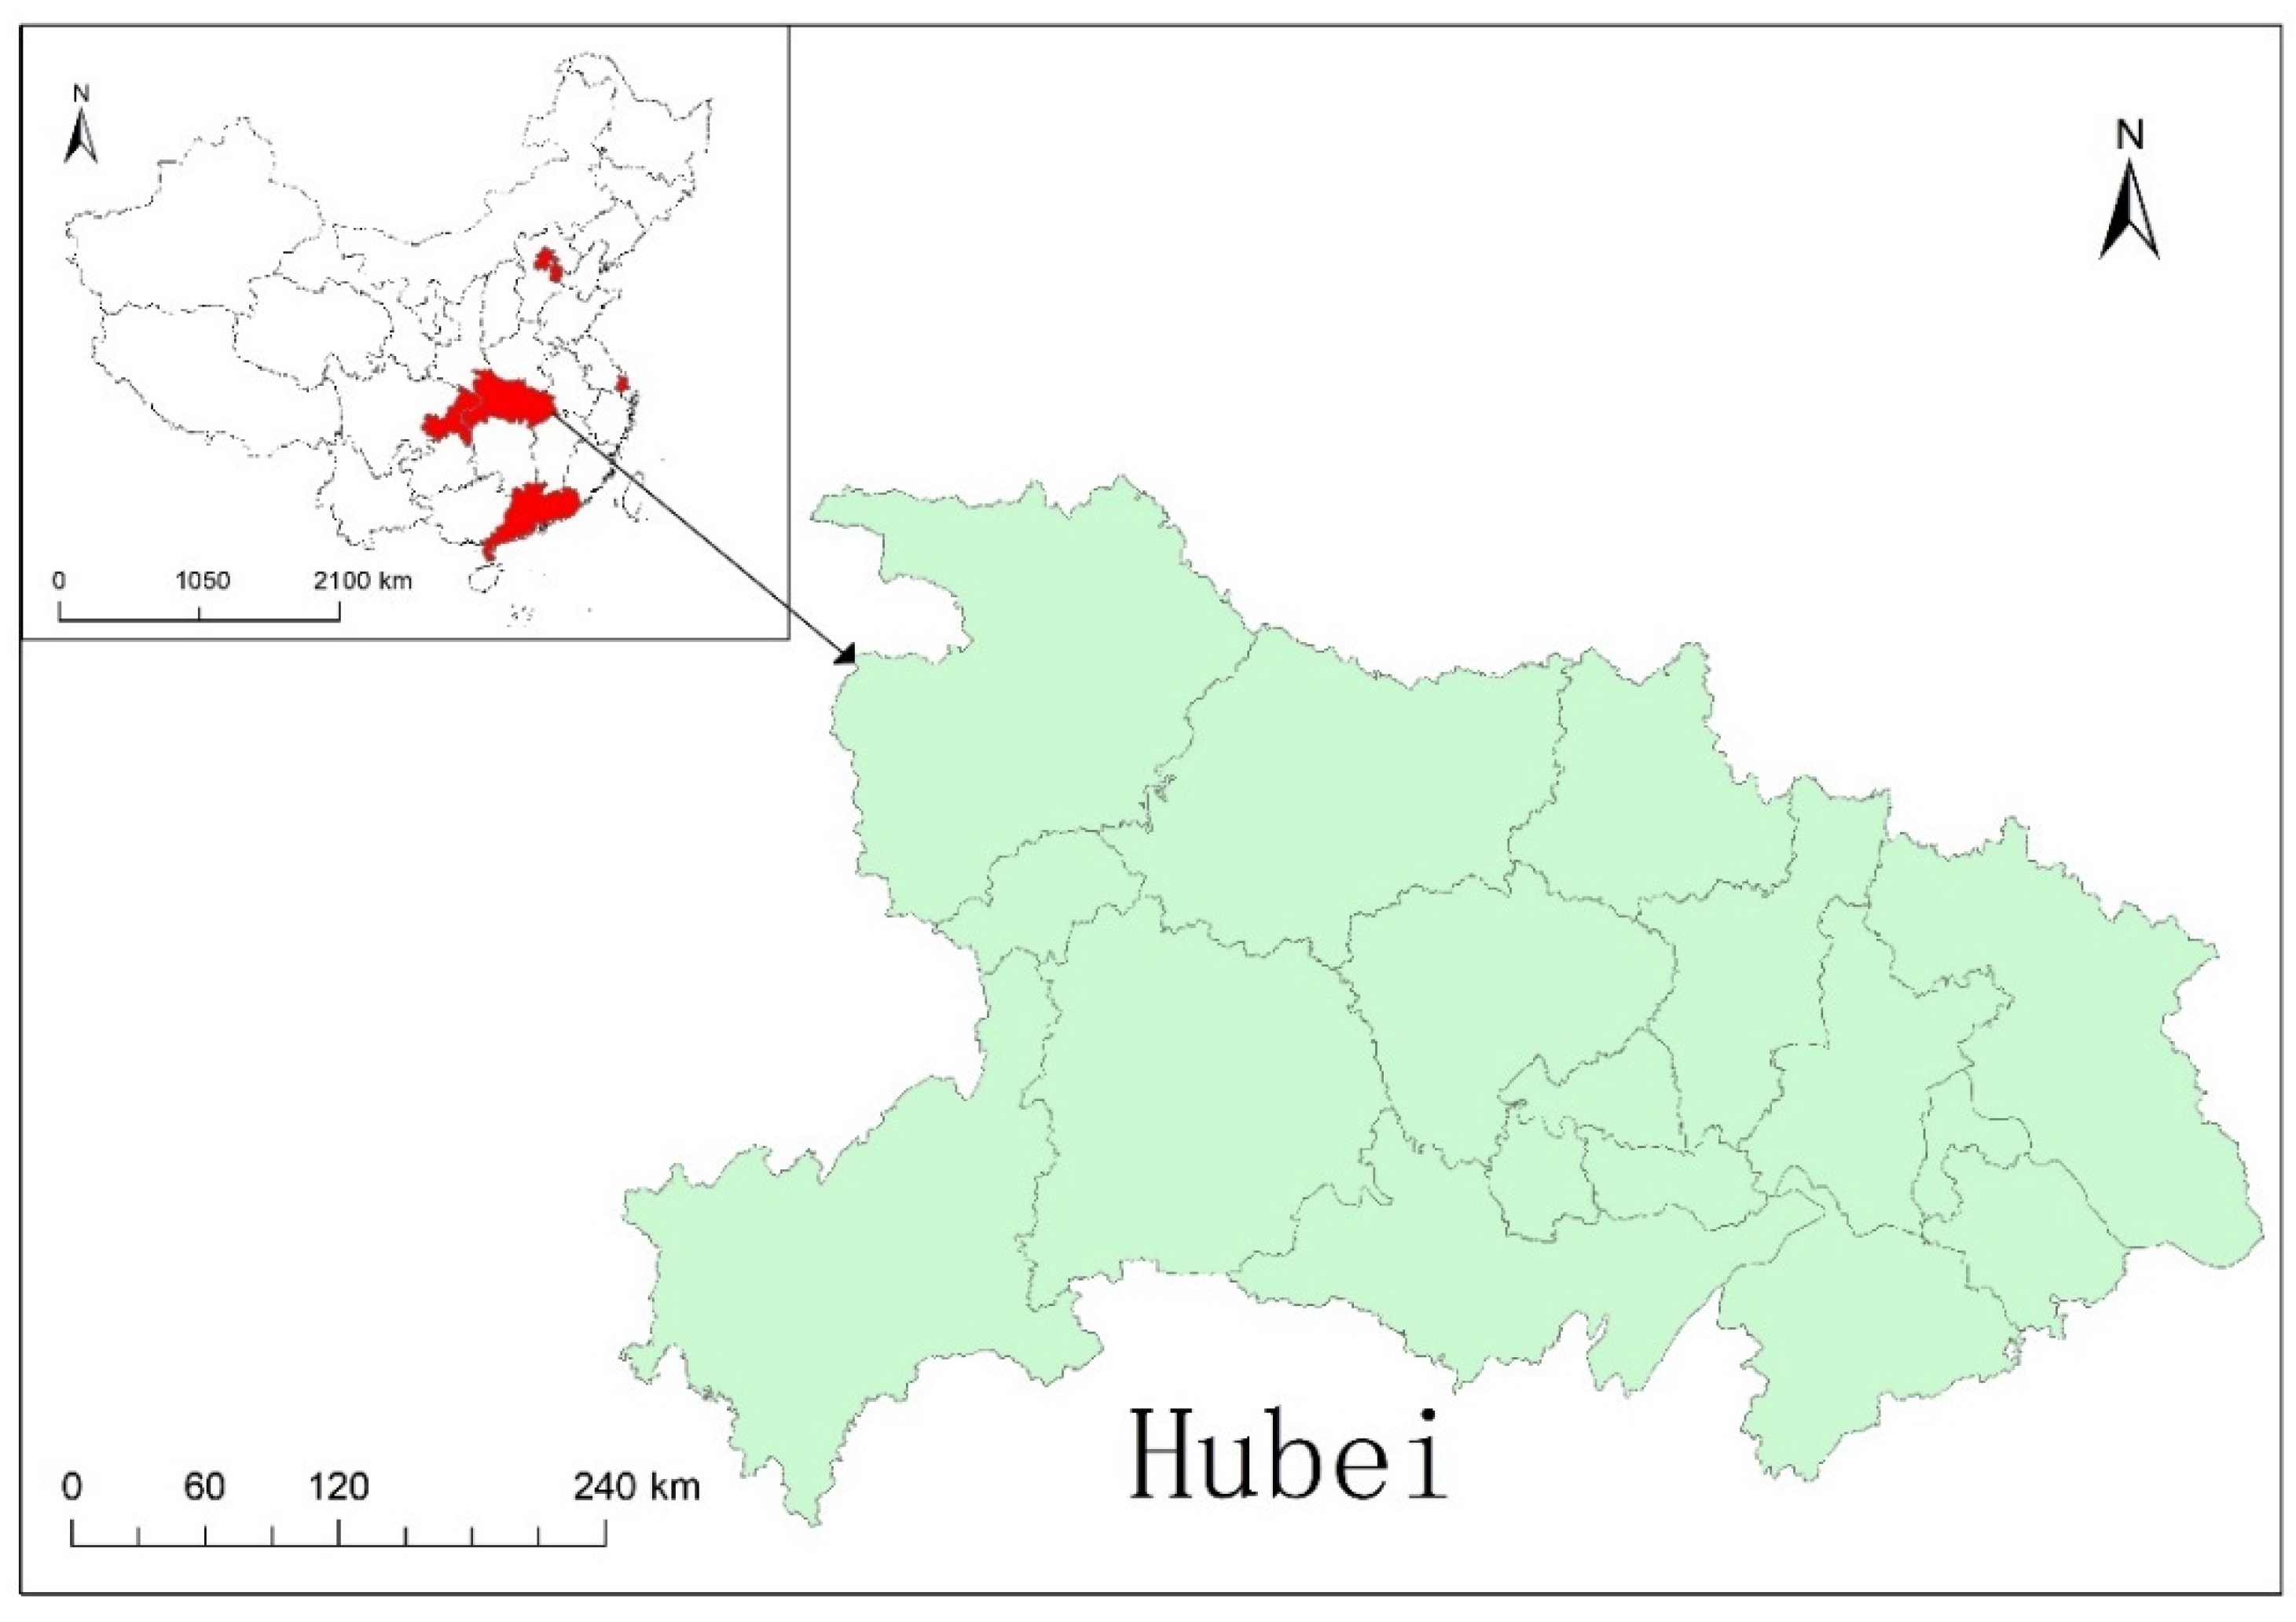
3. Institutional Background

In December 1997, the first additional agreement to the Convention, namely, the Kyoto Protocol, was adopted in Kyoto, Japan. The Kyoto protocol proposed using the carbon emission rights quota as a scarce resource for public trading, thereby forming an artificial market that can achieve the purpose of reducing carbon emissions through incentives and constraints [54], which is the carbon emission trading market. After the formal entry into force of the Kyoto Protocol in 2005, the global carbon emission trading market has experienced explosive growth, and 17 regions [55] in the world, such as the EU-ETS [56] and the Chicago Climate Exchange [57,58], have produced positive emission reduction effects. The development of carbon emission trading in China is relatively late. In the 12th Five Year Plan issued by the CPC Central Committee, it was proposed that China will establish its own carbon emission trading market. On 29 October 2011, the general office of the National Development and Reform Commission officially issued the Notice on The Pilot Work of Carbon Emission Trading, approving the pilot work of carbon emission trading to be carried out in Beijing, Tianjin, Shanghai, Chongqing, Hubei, Guangdong, and Shenzhen (as depicted in Figure 1), signifying that after approximately two years of preparation, from planning to practice of carbon emission trading [59], seven pilot projects of carbon emission trading in China have been launched one after another. In 2017, the National Development and Reform Commission released the Construction Plan of the National Carbon Emission Trading Market (Power Generation Industry), marking the market’s official launch. The document outlined China’s carbon emission trading market in detail and noted that the national carbon emission trading market is implemented in three stages: infrastructure construction, simulation operation, and deepening and improvement. The national carbon emission trading market was launched for online trading in 2021, and the power generation industry was the first industry to be included in the national carbon emission trading market, signifying that China’s carbon emission trading market officially entered the simulation operation period. Simultaneously, the original pilot local trading market and the national carbon emission trading market continued to operate on parallel tracks. China has achieved the policy goal of reducing the intensity of carbon emissions by 40–45 percent by 2020 compared to 2005 through a combination of market mechanisms and government oversight in carbon emission trading pilots. Additionally, the Chinese government pledges to strive for peak carbon dioxide emissions by 2030 and carbon neutrality by 2060 [60].
Given that the national carbon emission trading market implementation period is relatively brief, and the policy effect has a certain lag, it is difficult for us to evaluate the effect of the national carbon emission trading market comprehensively. Therefore, we have chosen to evaluate the policy effect of China’s carbon emission trading pilot. However, although the frameworks of the seven carbon emission trading pilots are comparable, there are significant differences in the specific details of policies, such as the industry scope of the regulated enterprises and the initial allocation method of carbon quotas, among the various carbon emission trading pilots. We must differentiate between these seven carbon emission trading pilot programs. Despite the late establishment of the Hubei carbon emission trading pilot, the total transaction volume and major market indicators, such as the number of investors, the cumulative daily average trading volume, and the amount of foreign capital introduced from outside the province, are well ahead of schedule [61]. The total volume of quota transactions in Hubei in 2015 was 17.95 million tons, with a trading volume of 424.5 million yuan, making it the second largest carbon emission trading market after the European Union Emission Trading Scheme (EUETS). As of 30 June 2021, there were 357 million tons of quota transactions on the Hubei carbon market, with a total cumulative trading volume of 8.375 billion yuan, of which, 348 million tons were traded on the secondary (spot and derivatives) market, representing 49.55 percent of the country; the turnover was 8.163 billion yuan, representing 54.84 percent of the country. Hubei’s carbon emission trading market is responsible for half of China’s trading volume and turnover [50]. In addition, Hubei Province is located in the central region of China; transportation between the nine provinces is convenient; Hubei Province’s industrial structure is similar to that of China, which is dominated by the tertiary industry and has a strong industrial foundation; and Hubei Province’s economic situation is close to the average level of China’s economy. Therefore, this paper chooses the Hubei carbon emission trading pilot as the research object to study the impact of the Hubei carbon emission trading pilot on PM2.5 concentration, which is conducive to the construction of the national carbon emission trading market, so as to achieve the purpose of coordinated environmental governance.

4. Data and Methods

4.1. Synthetic Control Method

We use the PM2.5 concentration data obtained by the Atmospheric Composition Analysis Group at Dalhousie University to draw the PM2.5 concentration distribution map of China before and after the implementation of the carbon emission trading market (as shown in Figure 2), in which Hong Kong, Macao, and Taiwan are white due to a lack of data. As depicted in Figure 2, North China, East China, and the center of China have the highest PM2.5 concentrations in China. However, the concentration of PM2.5 in many regions has decreased since the implementation of the carbon emission trading policy, making it difficult to determine whether this is a direct result of carbon emission trading. In order to scientifically evaluate the carbon emission trading market, it is crucial to select appropriate evaluation methods.
This paper uses the synthetic control method to evaluate the pilot of carbon emission trading. Abadie (2003) [31] first proposed the synthetic control method, and used it to evaluate the economic impact of terrorist activities in the Basque region of Spain. Its central tenet is to view the external intervention as a quasi-natural experiment, and to give the control group the most appropriate weight to form the experimental group’s counterfactual framework (a situation that did not occur) [62]. Comparing the real situation of the experimental group with the counterfactual framework of the experimental group, the actual impact of the external treatment can be obtained.
We assume that we have collected panel data from 1 + M regions in the T period. Among them, the intervention region, i, was set up as the pilot region of carbon emission trading at the t0 time point, and the remaining M regions were not intervened by the carbon emission trading market as the control group. Pit,1 represents the PM2.5 concentration in Region i when carbon emission trading was active at time, t, and Pit,0 represents the PM2.5 concentration in Region i when carbon emission trading was not active at time, t. When t > t0, the policy effect of carbon emission trading can be expressed as:
α it = P it , 1 P it , 0
However, in fact, we cannot observe Pit,0, so we use the factor model constructed by Abadie (2010) [63] to construct Pit,0 under the counterfactual framework:
P it , 0 = δ t + β t Z i + γ t μ i + ε it
Among them, δ t is the time-fixed effect, β t   is the unknown coefficient vector, Z i is the observable control variable, γ t   is the unobservable public factor, μ i   is the unobservable regional fixed effect, and   ε it is the unobservable shock.
The method to solve Pit,0 is to weight and average all regions of the control group, so assume that an N × 1-dimensional weight vector W = (w2,…, wn+1) is required, for any wn ≥ 0 and w2 + … + wn+1 = 1, wj represents the proportion of the j th region in the synthesis control group [63], and the concentration of PM2.5 in the experimental region can be expressed as:
n = 2 N + 1 w n P nt = δ t + β t n = 2 N + 1 w n Z n + γ t n = 2 N + 1 w n μ n + n = 2 N + 1 ε nt
Suppose there is W = (w2, …, wn+1) such that:
n = 2 N + 1 w n × P n 1 = P 11 ,                 n = 2 N + 1 w n × P n 2 = P 12
n = 2 N + 1 w n × P nT 0 = P 1 T 0 ,           and n = 2 N + 1 w n × Z n = Z 1
Abadie (2010) [63] proved that the obtained n = 2 N + 1 w n × P nt can be used as an unbiased estimate of Pit,0, so the effect of policy intervention can be expressed as:
α it = P it , 1 n = 2 N + 1 w n × P nt   , t t 0 + 1 , T
The key of the synthetic control method is to solve W, and the solution of W can be obtained by minimizing the distance function between X1 and X0W [63]; this means that before the implementation of the policy, the situation in the real area is as close as possible to that in the synthetic area, X1 is the (m × 1) dimensional eigenvector, X0 is the dimensional eigenvector of the pilot area without carbon emission trading, and the function expression is:
X 1 X 0 W = X X 0 W V X X 0 W
V is a n × n-dimensional symmetric positive semidefinite matrix with diagonal elements whose values reflect the relative significance of various control variables. Select the optimal V to make the synthetic control of the treatment unit the best track to change the carbon emission level before the implementation of the carbon emission trading mechanism of the reprocessing unit. Learn from the research of Abadie and others [63], use Stata software to figure out V and W to minimize the carbon emission trajectory of the synthetic area and the experimental group before T0, and then evaluate the effect of the policy.
Compared with the DID model, the synthetic control method, as a data-driven non-parametric method, overcomes the subjective randomness of the difference-in-differences model when selecting the control group and the “common trend hypothesis” that the experimental group and the control group need to meet. In addition, the synthetic control method avoids the recessive deviation of unobservable control variables in a data-driven way. Athey and Imbens (2017) believe that the synthetic control approach is arguably the most important innovation in the policy evaluation literature in the last 15 years [32]. For the aforementioned reasons, the synthetic control approach was chosen as the pilot method for evaluating carbon emission trading.

4.2. Variables and Data Sources

We select the Hubei carbon emission trading pilot as our research object and build a counterfactual framework to evaluate the impact of the carbon emission trading market on haze pollution. The data are drawn from the balanced panel data of China’s 25 provincial administrative regions from 2000 to 2016 (the data of Tibet, Hong Kong, Macao, and Taiwan are missing, and Beijing, Tianjin, Shanghai, Chongqing, and Guangzhou were excluded due to the implementation of the carbon emission trading pilot). The primary sources of information are the China Statistical Yearbook, the China Energy Statistical Yearbook, provincial statistical yearbooks, and statistical bulletins. The National Development and Reform Commission released the Notice on the Pilot Work of Carbon Emission Trading in October 2011. Hubei Province was included in the carbon emission trading pilot program. Although the carbon emission trading market had not yet been launched, relevant businesses had taken the necessary precautions. As a result, the year 2011 was selected to determine whether the carbon emission trading pilot had an effect. Our sample period starts in 2000, since that is the first year for which we have access to all the data. China’s national carbon emission trading market, which may be impacted by the carbon emission trading system and cannot become a potential control group, started construction in 2017 in response to the spontaneous carbon emission trading markets (such as Fujian Province) in some provinces. Therefore, we decided to stop collecting data at the end of 2016.
The culprit behind haze pollution is PM2.5. In this paper, the concentration of PM2.5 is selected as the outcome variable. This paper uses the PM2.5 concentration data obtained by the Atmospheric Composition Analysis Group at Dalhousie University, which uses the ideas of Van Donkelaar [64] to obtain the 0.01° × 0.01° raster data of PM2.5 concentration values in the global range via global satellite data, as the Chinese government’s PM2.5 detection data only began in 2013, and the data before 2013 are missing. Based on the base map of ArcGIS and PM2.5 concentration raster data at the provincial level in China, this paper uses ArcGIS software to parse it into PM2.5 annual average concentration data at the prefecture level and above, and excludes dust and sea salt. Affected by the data update, the time span of the data used in this paper is 2000–2016.
This paper selects economic size [65], population density [66,67], urbanization rate [68,69], the transport sector [69,70], and energy consumption [71] as the prediction variables of PM2.5 concentration, with reference to the relevant literature. The level of economic development is expressed by per capita GDP; population density is expressed by resident population/administrative area; urbanization rate is expressed by urban population/total population; the transport sector is expressed by the total number of cars owned by the region; and energy consumption is expressed by the total consumption of raw coal, crude oil and its products, natural gas, and electricity, and the unit is converted to standard coal. Table 1 displays the particulars of these prediction variables. In addition, we use the PM2.5 concentration in 2000, 2005, and 2010 as three additional prediction variables in order to ensure that the synthetic region can be well fitted.

5. Analysis of Empirical Results

5.1. Estimate Results of SCM

The synthetic Hubei will be set as a control group that is not affected by carbon emission trading pilot projects. In the experimental group influenced by the carbon emission trading pilot policy, the real Hubei began to build the carbon emission trading market in 2011. Although the carbon emission trading market has not been completely launched at this time, the Chinese government has announced the notice of building a carbon emission trading market. Related companies have taken corresponding measures. Therefore, we will take 2011 as a time point for dividing whether to be piloted by carbon emission trading. In synthetic Hubei, the carbon emission trading market has never been put into practice. The weighted average of the potential control provinces can be represented by synthetic Hubei. We choose a suitable weight through the synthetic control method, so that the PM2.5 concentration of Hubei and the real Hubei before the implementation of the carbon emission trading pilot policy is as consistent as possible. In this paper, the weight is calculated with the help of Stata17’s synth program operation synthesis control method, and a composite Hubei is formed. The synthetic Hubei is composed of potential control provinces and is fitted by predictive variables such as economic size, population density, urbanization rate, transport sector, energy consumption, etc. The basic idea is to synthesize a synthetic Hubei closest to the real Hubei through predictive variables before the implementation of the carbon emission trading pilot. Since synthetic Hubei is composed of a control group, and the control group has not received the policy impact of the carbon emission trading pilot, we intend to take synthetic Hubei as the counterfactual framework when Hubei has not implemented the carbon emission trading pilot. The weight of synthetic Hubei is shown in Table 2. The higher the provincial weight of the control group, the more similar the modified area is to the experimental group, in which synthetic Hubei is composed of Hunan, Anhui, Liaoning, Fujian, Shanxi, Ningxia, and Hainan.
Table 3 compares the average values of the prediction variables of real Hubei and synthetic Hubei with all control groups before the implementation of the carbon emission trading pilot. From the table, we can see that the parameters of real Hubei and synthetic Hubei are not that different. This means that the fitting effect of synthetic Hubei is better, which makes this study even more reliable.
Figure 3 shows the concentration of PM2.5 in Hubei. The red solid line represents the concentration of PM2.5 in real Hubei, the black dotted line represents the concentration of PM2.5 in synthetic Hubei, and the position of the vertical line represents the starting time of the impact of the carbon emission trading pilot policy. The carbon emission trading market has no effect on the synthetic or real Hubei on the left of the vertical line, and the carbon emission trading market has an effect on the real Hubei on the right of the vertical line, but not on the synthetic Hubei. It can be seen from the figure that the concentration of PM2.5 in real Hubei and synthetic Hubei on the left side of the vertical line is relatively close, indicating that synthetic Hubei better matches the concentration of PM2.5 in real Hubei. Therefore, we have reason to believe that synthetic Hubei is more appropriate as the counterfactual framework when the real Hubei does not implement the carbon emission trading market. In addition, we can see that the black dotted line and the red solid line on the right side of the vertical line have clearly decreased, which reflects that the concentration of PM2.5 will decline no matter whether Hubei has realized the carbon emission trading market, which may be related to the Chinese government’s attention to PM2.5 after 2011. However, we can also see that the concentration of PM2.5 in real Hubei and synthetic Hubei on the right side of the vertical line is gradually separated. The concentration of PM2.5 in real Hubei is significantly lower than that in synthetic Hubei. The difference between the two just represents the real policy effect (net effect) of the carbon emission trading pilot, which means that compared with synthetic Hubei without the carbon emission trading pilot, the implementation of the carbon emission trading pilot has significantly reduced the concentration of PM2.5 in Hubei. In the five years from 2011 to 2016, the amount of PM2.5 in Hubei dropped by about 25%. The carbon emission trading market led to a 10% drop in the amount of PM2.5 in Hubei, and the haze pollution in Hubei has gotten a lot better.

5.2. Placebo Test

The empirical evidence presented above indicates that the Hubei carbon emission trading pilot is conducive to reducing PM2.5 levels, but this conclusion may be contested. Is the decrease in PM2.5 levels in Hubei due to an accidental factor other than the establishment of a carbon emission trading pilot? This paper uses the “placebo test” proposed by Abadie (2010) [63] to verify the validity of the conclusion, i.e., to verify that the change in PM2.5 concentration in Hubei Province is, indeed, caused by the carbon emission trading pilot, rather than other intervention policies or other accidental factors introduced by the Chinese government to control haze pollution at the same time. The following are the specific steps of the placebo test: a provincial administrative region will be selected randomly from the potential control group’s provincial administrative regions to serve as the placebo test region. Assuming the placebo test region and the processing region implemented the same carbon emission trading pilot in the same year, the region’s policy is evaluated based on the synthetic control law. If the decrease in PM2.5 concentration in Hubei is caused by the carbon emission trading pilot, the placebo test area should experience a lesser policy impact than Hubei. In this paper, we chose Anhui and Hunan, the provinces with the highest synthetic Hubei production. The greater the weight, the greater the similarity between the province and Hubei, and the greater the accuracy of the placebo test. According to the fitting results of Figure 4 and Figure 5, the real PM2.5 concentration of Anhui and Hunan before and after the implementation of the policy is nearly identical to the synthetic PM2.5 concentration, indicating that the carbon emission trading pilot in Anhui and Hunan has no effect if Anhui and Hunan also implement it. This also demonstrates that the reduction of PM2.5 concentration in Hubei is a direct result of the carbon emission trading pilot program, as opposed to other random factors.
Although the carbon emission trading market began construction in 2011, the carbon emission trading market may not be fully completed at that time. Therefore, it may not be accurate to use 2011 as the starting point for the impact of the carbon trading pilot, and it is necessary for us to change the starting time of the carbon trading policy [72]. Considering that the Hubei carbon emission trading market was officially launched in early 2014, in this paper, we lag the impact time of the carbon emission trading pilot by two periods, and choose 2013 as the time node to divide the carbon emission trading policy. The carbon emission trading market had not been launched before 2013 (including 2013), and the carbon emission trading system was officially launched after 2013. Once again, we use the synthetic control method to evaluate the impact of the carbon emission trading policy on PM2.5 concentration, and the results are shown in Figure 6. It can be seen from Figure 6 that, on the left side of the vertical line (before 2013), the concentration of real Hubei and synthetic Hubei PM2.5 is close, which indicates that the synthetic Hubei province well reflects the PM2.5 concentration when it is not affected by the carbon emission trading policy and meets the basic conditions of the synthetic control method. On the right side of the vertical line, after the carbon emission trading market is launched, the PM2.5 concentration gap between the real Hubei and the synthetic Hubei gradually increases, and the concentration gap between the real Hubei and the synthetic Hubei just reflects the policy effect of carbon emission trading, indicating that the PM2.5 concentration in Hubei province did not improve before the launch of the carbon emission trading market in 2014. However, after the launch of the carbon emission trading market, the PM2.5 concentration gap between real Hubei and synthetic Hubei gradually increased, and the PM2.5 concentration in Hubei province decreased significantly. Therefore, whether it is the announcement of the carbon emission trading market project in 2011 or the official launch of the carbon emission trading market in early 2014, the carbon emission trading market has had a long-term impact on PM2.5 concentration. We demonstrate the objectivity of the carbon emission trading market in reducing the PM2.5 concentration by using a placebo test.

5.3. Permutation Test

Abadie et al. [63] proposed a sort test comparable to the rank test in statistics to assess the robustness and significance of the effect of policy evaluation. This method can be used to determine whether there are additional pilot provinces without carbon emission trading. After employing the synthetic control method, the results for the policy pilot provinces and the probability of the Hubei carbon emission trading pilot policy effect are comparable. The idea of the sequencing test is to assume that provinces other than Hubei have also implemented carbon emission trading pilots during the same time period. In accordance with the synthetic control method, the corresponding control group is synthesized, and the carbon emission differences between the provinces that assume the implementation of the policy and its synthetic group are compared to determine the probability of the assumed provinces’ and pilot provinces’ policy effects. As depicted in Figure 7, the Y-axis of the coordinate axis represents the gap between the real PM2.5 concentration and the synthetic PM2.5 concentration in each region, with the solid line representing Hubei Province and the dashed line representing provinces that have not implemented the carbon emission trading pilot. According to Figure 7, the PM2.5 concentration in Hubei province did not change significantly prior to the implementation of the carbon emission trading pilot. However, after the implementation of the carbon emission trading pilot, the decline rate in Hubei Province is significantly greater than in all non-pilot areas. This indicates that the carbon emission trading pilot has reduced the concentration of PM2.5 in Hubei Province as a whole, and the statistical inference probability of the Hubei carbon emission trading pilot on the concentration of PM2.5 is 1/25 = 4%, and the result can be considered at a 5% statistical level.
To ensure the effect of the sequencing test and the reliability of the simulation of provincial data of synthetic control groups to real provincial data after the implementation of the carbon emission trading pilot, we refer to the method of Abadie et al. [63], and use root mean square prediction error (RMSPE) to measure the difference in PM2.5 concentration between carbon emission trading pilot provinces (including hypothetical pilot provinces). In Formula (6), the specific calculation formula is shown:
RMSPE = 1 t 0 t = 1 t 0 P it n = 2 N + 1 w n × P nt 2
We eliminated the urban areas in the control group where the RMDSPE is greater than five times that of Hubei, leaving 13 areas. Figure 8 depicts the error distribution after these areas have been eliminated. After adjusting for prediction error, the robustness of the policy effect has been enhanced. Prior to the implementation of the policy, the difference between the real value and the synthetic value of PM2.5 concentration in Hubei Province fluctuated around zero, as shown in the Figure 8. In general, the change range is smaller than that of other cities. After the policy was implemented, the concentration of PM2.5 in Hubei Province decreased significantly, and the gap with other regions widened significantly, indicating that Hubei carbon emission trading has a significant positive impact on the haze pollution control in North Hubei Province. According to the concept of statistical probability distribution, the probability that this result was caused by random factors is only 1 in 13 (7.69 percent). Therefore, the result is statistically significant at the 10% level.

6. Further Discussion

What method does the carbon emission trading market employ to reduce the concentration of PM2.5 in Hubei, given that the carbon emission trading market has a considerable inhibitory effect on the concentration of PM2.5 in the pilot areas? The existing research indicates that the carbon emission trading market raises the price of carbon dioxide emissions, and fossil-fuel-burning is a significant cause of excessive carbon dioxide emissions. To combat the challenge of rising carbon dioxide emission prices, businesses must, therefore, consider modifying their energy structure or intensifying their technical innovation. These two channels may contribute to the decrease in PM2.5 concentration. To test the aforementioned two hypotheses, this research explores the internal mechanism of the carbon emission trading market based on the fixed effect model, and uses the method of intermediary effects with reference to [73,74]. First of all, in this paper, we select the fixed effect model to construct the following three recursive equations:
P it = β 0 + β 1 Time × treat it + δ control it + u i +   ρ t + ε it
W it = φ 0 + γ 1 Time ×   treat it + φ control it + u i +   ρ t + ε it
P it = σ 0 + β 2 Time ×   treat it + θ W it + μ control it + u i +   ρ t + ε it
Among them, Pit indicates the PM2.5 concentration of Region i when it is not affected by carbon emission trading at t time. Time × treatit is the virtual variable of the carbon emission trading pilot. If Province i has become a carbon emission trading pilot in period t, the variable is assigned a value of 1, otherwise 0. Controlit is a group of control variables that may affect the upgrading of industrial structure, including economic size [66], population density [66,67], urbanization rate [68,69], transport sector [69,70], and energy consumption [71]. Wit is an intermediary variable that includes: (1) energy structure (EST), expressed as the proportion of coal energy consumption in total energy consumption [17]; and (2) technological innovation investment, expressed as R&D funds [23]. The u i and ρ t , respectively, represent location-fixed effects and time-fixed effects. ε it is the residual term, which reflects the noise caused by factors that have an impact on the explained variable, but are not included in the explanatory variable. The steps to test the intermediary effect are as follows: first, estimate the model (1) to test whether carbon emission trading has an impact on PM2.5 concentration. If β1 is significantly negative, it indicates that carbon emission trading does have an inhibitory effect on the concentration of PM2.5; second, estimate the model (2) and investigate the relationship between the carbon emission trading mechanism and intermediary variables. If γ 1 is significantly positive, it indicates that carbon emission trading promotes intermediary variables; if γ 1 is negative, it indicates that carbon emission trading suppresses intermediary variables; third, estimate model (3). If at least one of γ 1 and θ is not significant, the next test is required; if γ 1 and θ are both significant, there is an intermediary effect. In this case, if the regression coefficient, β2, is also significant, it is a partial mediating effect; if β2 is not significant, it is a complete intermediary effect.
As indicated in column (1) of Table 4, the carbon emission trading effect on PM2.5 concentration is strongly negative, demonstrating that carbon emission trading can reduce PM2.5 concentration, thus satisfying the intermediary effect test’s premise. The estimated results of the second stage of the intermediary effect model are presented in columns (2) and (4) of the table. Column (2) is significantly negative at the statistical level of 1%, indicating that carbon emission trading can effectively adjust the energy structure. The coefficient in column (4) of the table is significantly positive, which means that carbon emission trading has a positive effect on increasing technological innovation. The third stage of the intermediate effect model estimates the influence of energy structure and technological innovation investment on PM2.5 concentration in columns (3) and (5), respectively. The coefficient for energy structure PM2.5 concentration is significantly negative, and the coefficient for scientific and technological innovations is significantly positive, indicating that adjusting the energy structure and increasing investment in technological innovation are also significant for reducing PM2.5 concentration. This further supports the aforementioned hypothesis. On the other hand, the strong negative effect of carbon emission trading on PM2.5 concentrations in columns (3) and (5) implies that there are some intermediate effects between energy structures and scientific and technical innovation. When both energy structure and technological innovation are included as intermediate variables, column (6) represents the outcome of the regression. This further demonstrates that both energy structure and investment in technological innovation act as intermediaries, and it suggests that carbon emission trading can reduce the use of fossil fuels such as coal by changing the energy structure and increasing investment in technological innovation.

7. Conclusions

China has a severe problem with haze pollution. To attain ecological civilization, the Chinese government must find a balance between accomplishing economic growth goals and considering the carrying capacity of resources and the environment. The Hubei carbon emission trading pilot is treated as a quasi-natural experiment in this research. On the basis of China’s province panel data from 2000 to 2016, the influence of the carbon emission trading market on PM2.5 concentration is examined using the synthetic control approach, and the internal mechanism for reducing PM2.5 concentration in the carbon emission trading market is evaluated. Our research results are mainly in the following three aspects: first, Hubei began to build a carbon emission trading market in 2011, and the concentration of PM2.5 in Hubei decreased to a certain extent in the first two years of construction, whereas the concentration of PM2.5 in Hubei decreased significantly after 2013, and the effect of reducing the PM2.5 concentration in the carbon emission trading market is more significant. During the five years between 2011 and 2016, the concentration of PM2.5 in Hubei declined by approximately 25 percent, with carbon emission trading accounting for around 10 percent of this decrease, and haze pollution in Hubei has been greatly reduced. Second, we prove that the conclusion of restraining PM2.5 concentration in the Hubei carbon emission trading pilot project is robust through a placebo test, sequencing test, and other robustness tests, and the results are statistically significant at a minimum level of 5 percent. If certain provinces and locations with a low degree of fit are eliminated, the effect of the carbon emission trading pilot policy can also fulfill the 10 percent significance threshold. Third, we establish an intermediary effect model to study the influence mechanism of carbon emission trading on PM2.5 concentration. The results show that carbon emission trading can lower PM2.5 concentration mainly by modifying the energy structure, decreasing the use of fossil fuels such as coal, and raising investment in technological innovation. These are our main research results.
The research results in this paper have both theoretical and practical significance. Most literature focuses on the carbon emission reduction effect of the carbon emission trading market, ignoring the possibility of coordinating the governance of haze pollution in the carbon emission trading market. Our research can further enrich the relevant theory of policy evaluation of the carbon emission trading market, and provide certain theoretical supplements for the coordination governance of the environment. From the point of view of reality, there are some shortcomings in China’s current environmental regulations. This research has found a way that can effectively reduce the PM2.5 concentration and further tap the two carbon emission trading markets to reduce the PM2.5 concentration, which provides path support for the government to alleviate haze pollution.

Author Contributions

Conceptualization, R.W. and X.M.; methodology, R.W.; resources, R.W. and H.T.; data curation, R.W. and X.M.; writing—original draft preparation, R.W. and X.M.; writing—review and editing, R.W., H.T. and X.M.; visualization, R.W. and H.T.; supervision, X.M.; project administration, X.M. and R.W.; funding acquisition, X.M. All authors have read and agreed to the published version of the manuscript.

Funding

This research was supported by Youth Project of National Natural Science Foundation of China, BK20200782.

Institutional Review Board Statement

Not applicable.

Informed Consent Statement

Not applicable.

Data Availability Statement

Not applicable.

Acknowledgments

Thanks to the judging experts and all members of our team for their insightful advice.

Conflicts of Interest

The authors declare no conflict of interest.

References

  1. Song, Z.; Storesletten, K.; Zilibotti, F. Growing Like China. Am. Econ. Rev. 2011, 101, 196–233. [Google Scholar] [CrossRef]
  2. Guo, S.; Hu, M.; Zamora, M.L.; Peng, J.; Shang, D.; Zheng, J.; Zhang, R. Elucidating severe urban haze formation in China. Proc. Natl. Acad. Sci. USA 2014, 111, 17373–17378. [Google Scholar] [CrossRef] [PubMed]
  3. Huang, R.J.; Zhang, Y.; Bozzetti, C.; Ho, K.F.; Cao, J.J.; Han, Y.; Prévôt, A.S. High secondary aerosol contribution to particulate pollution during haze events in China. Nature 2014, 514, 218–222. [Google Scholar] [CrossRef] [PubMed]
  4. Valavanidis, A.; Fiotakis, K.; Vlachogianni, T. Airborne Particulate Matter and Human Health: Toxicological Assessment and Importance of Size and Composition of Particles for Oxidative Damage and Carcinogenic Mechanisms. J. Environ. Sci. Health Part C 2008, 26, 339–362. [Google Scholar] [CrossRef]
  5. Schlesinger, R.B.; Kunzli, N.; Hidy, G.M.; Gotschi, T.; Jerrett, M. The Health Relevance of Ambient Particulate Matter Characteristics: Coherence of Toxicological and Epidemiological Inferences. Inhal. Toxicol. 2006, 18, 95–125. [Google Scholar] [CrossRef]
  6. Hall, J.V.; Brajer, V.; Lurmann, F.W. Air pollution, health and economic benefits—Lessons from 20years of analysis. Ecol. Econ. 2010, 69, 2590–2597. [Google Scholar] [CrossRef]
  7. Lelieveld, J.; Evans, J.S.; Fnais, M.; Giannadaki, D.; Pozzer, A. The contribution of outdoor air pollution sources to premature mortality on a global scale. Nature 2015, 525, 367–371. [Google Scholar] [CrossRef]
  8. Gao, M.; Guttikunda, S.K.; Carmichael, G.R.; Wang, Y.; Liu, Z.; Stanier, C.O.; Yu, M. Health impacts and economic losses assessment of the 2013 severe haze event in Beijing area. Sci. Total Environ. 2015, 511, 553–561. [Google Scholar] [CrossRef]
  9. Zheng, Y.; Zhang, Q.; Tong, D.; Davis, S.J.; Caldeira, K. Climate effects of China’s efforts to improve its air quality. Environ. Res. Lett 2020, 15, 104052. [Google Scholar] [CrossRef]
  10. Ramanathan, V.; Crutzen, P.J.; Kiehl, J.T.; Rosenfeld, D. Aerosols, Climate, and the Hydrological Cycle. Science 2001, 294, 2119–2124. [Google Scholar] [CrossRef] [Green Version]
  11. Shao, T.; Liu, Y.; Wang, R.; Zhu, Q.; Tan, Z.; Luo, R. Role of anthropogenic aerosols in affecting different-grade precipitation over eastern China: A case study. Sci. Total Environ. 2022, 807, 150886. [Google Scholar] [CrossRef] [PubMed]
  12. Liu, X. The influence of urban haze pollution on urban shrinkage in China—An analysis of the mediating effect of the labor supply. Environ. Sci. Pollut. Res. 2021, 28, 63297–63304. [Google Scholar] [CrossRef] [PubMed]
  13. Zhou, A.; Li, J. Air pollution and income distribution: Evidence from Chinese provincial panel data. Environ. Sci. Pollut. Res. 2021, 28, 8392–8406. [Google Scholar] [CrossRef] [PubMed]
  14. Tang, H.; Liu, J.; Wu, J. The impact of command-and-control environmental regulation on enterprise total factor productivity: A quasi-natural experiment based on China’s “Two Control Zone” policy. J. Clean. Prod. 2020, 254, 120011. [Google Scholar] [CrossRef]
  15. Ren, S.; Li, X.; Yuan, B.; Li, D.; Chen, X. The effects of three types of environmental regulation on eco-efficiency: A cross-region analysis in China. J. Clean. Prod. 2018, 173, 245–255. [Google Scholar] [CrossRef]
  16. Jin, Y.; Andersson, H.; Zhang, S. Air Pollution Control Policies in China: A Retrospective and Prospects. Int. J. Environ. Res. Public Health 2016, 13, 1219. [Google Scholar] [CrossRef]
  17. Li, X.; Hu, Z.; Cao, J. The impact of carbon market pilots on air pollution: Evidence from China. Environ. Sci. Pollut. Res. 2021, 28, 62274–62291. [Google Scholar] [CrossRef]
  18. Wu, H.; Li, Y.; Hao, Y.; Ren, S.; Zhang, P. Environmental decentralization, local government competition, and regional green development: Evidence from China. Sci. Total Environ. 2020, 708, 135085. [Google Scholar] [CrossRef]
  19. Li, B. Top-down place-based competition and award: Local government incentives for non-GDP improvement in China. J. Chin. Gov. 2018, 3, 397–418. [Google Scholar] [CrossRef]
  20. Vo, X.V.; Zaman, K. Relationship between energy demand, financial development, and carbon emissions in a panel of 101 countries: “go the extra mile” for sustainable development. Environ. Sci. Pollut. Res. 2020, 27, 23356–23363. [Google Scholar] [CrossRef]
  21. Zhang, K.; Xu, D.; Li, S.; Wu, T.; Cheng, J. Strategic interactions in environmental regulation enforcement: Evidence from Chinese cities. Environ. Sci. Pollut. Res. 2021, 28, 1992–2006. [Google Scholar] [CrossRef] [PubMed]
  22. Zhang, D.; Karplus, V.J.; Cassisa, C.; Zhang, X. Emissions trading in China: Progress and prospects. Energy Policy 2014, 75, 9–16. [Google Scholar] [CrossRef]
  23. Zhang, Y.; Li, S.; Luo, T.; Gao, J. The effect of emission trading policy on carbon emission reduction: Evidence from an integrated study of pilot regions in China. J. Clean. Prod. 2020, 265, 121843. [Google Scholar] [CrossRef]
  24. Ge, S.; Yu, X.; Zhou, D.; Sang, X. The Integrated Effect of Carbon Emissions Trading and Pollution Rights Trading for Power Enterprises—A Case Study of Chongqing. Sustainability 2019, 11, 3099. [Google Scholar] [CrossRef]
  25. Wang, Y.; Yao, L.; Wang, L.; Liu, Z.; Ji, D.; Tang, G.; Xin, J. Mechanism for the formation of the January 2013 heavy haze pollution episode over central and eastern China. Sci. China Earth Sci. 2014, 57, 14–25. [Google Scholar] [CrossRef]
  26. Yang, L.; Li, F.; Zhang, X. Chinese companies’ awareness and perceptions of the Emissions Trading Scheme (ETS): Evidence from a national survey in China. Energy Policy 2016, 98, 254–265. [Google Scholar] [CrossRef]
  27. Mackenzie, I.A.; Hanley, N.; Kornienko, T. The optimal initial allocation of pollution permits: A relative performance approach. Environ. Resour. Econ. 2008, 39, 265–282. [Google Scholar] [CrossRef]
  28. Gibson, M. Regulation-Induced Pollution Substitution. Rev. Econ. Stat. 2019, 101, 827–840. [Google Scholar] [CrossRef]
  29. Hahn, R.W.; Malès, E.H. Can Regulatory Institutions Cope with Cross Media Pollution? J. Air Waste Manag. Assoc. 1990, 40, 24–31. [Google Scholar] [CrossRef]
  30. Bi, X. “Cleansing the air at the expense of waterways?” Empirical evidence from the toxic releases of coal-fired power plants in the United States. J. Regul. Econ. 2017, 51, 18–40. [Google Scholar] [CrossRef]
  31. Abadie, A.; Gardeazabal, J. The Economic Costs of Conflict: A Case Study of the Basque Country. Am. Econ. Rev. 2003, 93, 113–132. [Google Scholar] [CrossRef]
  32. Athey, S.; Imbens, G.W. The State of Applied Econometrics: Causality and Policy Evaluation. J. Econ. Perspect. 2017, 31, 3–32. [Google Scholar] [CrossRef]
  33. Guo, X.; Fu, L.; Sun, X. Can Environmental Regulations Promote Greenhouse Gas Abatement in OECD Countries? Command-and-Control vs. Market-Based Policies. Sustainability 2021, 13, 6913. [Google Scholar] [CrossRef]
  34. Xie, L.; Li, Z.; Ye, X.; Jiang, Y. Environmental regulation and energy investment structure: Empirical evidence from China’s power industry. Technol. Forecast. Soc. Chang. 2021, 167, 120690. [Google Scholar] [CrossRef]
  35. Bergquist, A.-K.; Söderholm, K.; Kinneryd, H.; Lindmark, M.; Söderholm, P. Command-and-control revisited: Environmental compliance and technological change in Swedish industry 1970–1990. Ecol. Econ. 2013, 85, 6–19. [Google Scholar] [CrossRef]
  36. Gerigk, J.; MacKenzie, I.A.; Ohndorf, M. A Model of Benchmarking Regulation: Revisiting the Efficiency of Environmental Standards. Environ. Resour. Econ. 2015, 62, 59–82. [Google Scholar] [CrossRef]
  37. Aidt, T.S.; Dutta, J. Transitional politics: Emerging incentive-based instruments in environmental regulation. J. Environ. Econ. Manag. 2004, 47, 458–479. [Google Scholar] [CrossRef]
  38. Li, W.; Gu, Y.; Liu, F.; Li, C. The effect of command-and-control regulation on environmental technological innovation in China: A spatial econometric approach. Environ. Sci. Pollut. Res. 2019, 26, 34789–34800. [Google Scholar] [CrossRef]
  39. Li, B.; Wu, S. Effects of local and civil environmental regulation on green total factor productivity in China: A spatial Durbin econometric analysis. J. Clean. Prod. 2017, 153, 342–353. [Google Scholar] [CrossRef]
  40. Cai, D.; Li, J. Pollution for Sale: Firms’ Characteristics and Lobbying Outcome. Environ. Resour. Econ. 2020, 77, 539–564. [Google Scholar] [CrossRef]
  41. Sjöberg, E. An empirical study of federal law versus local environmental enforcement. J. Environ. Econ. Manag. 2016, 76, 14–31. [Google Scholar] [CrossRef]
  42. Becker, R.; Henderson, V. Effects of Air Quality Regulations on Polluting Industries. J. Political Econ. 2000, 108, 379–421. [Google Scholar] [CrossRef]
  43. Coase, R.H. The Problem of Social Cost. J. Law Econ. 2013, 56, 837–877. [Google Scholar] [CrossRef]
  44. Liu, L.; Chen, C.; Zhao, Y.; Zhao, E. China׳s carbon-emissions trading: Overview, challenges and future. Renew. Sustain. Energy Rev. 2015, 49, 254–266. [Google Scholar] [CrossRef]
  45. Zhao, X.; Wu, L.; Li, A. Research on the efficiency of carbon trading market in China. Renew. Sustain. Energy Rev. 2017, 79, 1–8. [Google Scholar] [CrossRef]
  46. Jiang, W.; Liu, J.; Liu, X. Impact of Carbon Quota Allocation Mechanism on Emissions Trading: An Agent-Based Simulation. Sustainability 2016, 8, 826. [Google Scholar] [CrossRef]
  47. Liu, Y. Residents’ Willingness and Influencing Factors on Action Personal Carbon Trading: A Case Study of Metropolitan Areas in Tianjin, China. Sustainability 2019, 11, 369. [Google Scholar] [CrossRef]
  48. Zhu, Q.; Duan, K.; Wu, J.; Wang, Z. Agent-Based Modeling of Global Carbon Trading and Its Policy Implications for China in the Post-Kyoto Era. Emerg. Mark. Financ. Trade 2016, 52, 1348–1360. [Google Scholar] [CrossRef]
  49. Fang, G.; Tian, L.; Liu, M.; Fu, M.; Sun, M. How to optimize the development of carbon trading in China—Enlightenment from evolution rules of the EU carbon price. Appl. Energy 2018, 211, 1039–1049. [Google Scholar] [CrossRef]
  50. Feng, Y. Does China’s carbon emission trading policy alleviate urban carbon emissions? IOP Conf. Ser. Earth Environ. Sci. 2020, 508, 012044. [Google Scholar] [CrossRef]
  51. Qian, H.; Zhou, Y.; Wu, L. Evaluating various choices of sector coverage in China’s national emissions trading system (ETS). Clim. Policy 2018, 18, 7–26. [Google Scholar] [CrossRef]
  52. Wang, P.; Dai, H.; Ren, S.; Zhao, D.; Masui, T. Achieving Copenhagen target through carbon emission trading: Economic impacts assessment in Guangdong Province of China. Energy 2015, 79, 212–227. [Google Scholar] [CrossRef]
  53. Meyer, B.D. Natural and Quasi-Experiments in Economics. J. Bus. Econ. Stat. 1995, 13, 151–161. [Google Scholar]
  54. Aichele, R.; Felbermayr, G. The Effect of the Kyoto Protocol on Carbon Emissions: Kyoto and Carbon Emissions. J. Pol. Anal. Manag. 2013, 32, 731–757. [Google Scholar] [CrossRef]
  55. Haites, E. Carbon taxes and greenhouse gas emissions trading systems: What have we learned? Clim. Policy 2018, 18, 955–966. [Google Scholar] [CrossRef]
  56. Borghesi, S.; Cainelli, G.; Mazzanti, M. Linking emission trading to environmental innovation: Evidence from the Italian manufacturing industry. Res. Policy 2015, 44, 669–683. [Google Scholar] [CrossRef]
  57. Zhang, C.; Wang, Q.; Shi, D.; Li, P.; Cai, W. Scenario-based potential effects of carbon trading in China: An integrated approach. Appl. Energy 2016, 182, 177–190. [Google Scholar] [CrossRef]
  58. Caron, J.; Rausch, S.; Winchester, N. Leakage from sub-national climate policy: The case of California’s cap and trade program. Energy J. 2015, 36. [Google Scholar] [CrossRef]
  59. Goulder, L.H.; Morgenstern, R.D.; Munnings, C.; Schreifels, J. China’s national carbon dioxide emission trading system: An introduction. Econ. Energy Environ. Policy 2017, 6, 1–18. [Google Scholar] [CrossRef]
  60. Zeng, N.; Jiang, K.; Han, P.; Hausfather, Z.; Cao, J.; Kirk-Davidoff, D.; Ali, S.; Zhou, S. The Chinese Carbon-Neutral Goal: Challenges and Prospects. Adv. Atmos. Sci 2022, 39, 1229–1238. [Google Scholar] [CrossRef]
  61. Li, H.; Lei, M. The influencing factors of China carbon price: A study based on carbon trading market in hubei province. IOP Conf. Ser. Earth Environ. Sci. 2018, 121, 052073. [Google Scholar] [CrossRef]
  62. Dawid, A.P. Causal Inference without Counterfactuals. J. Am. Stat. Assoc. 2000, 95, 407–424. [Google Scholar] [CrossRef]
  63. Abadie, A.; Diamond, A.; Hainmueller, J. Synthetic Control Methods for Comparative Case Studies: Estimating the Effect of California’s Tobacco Control Program. J. Am. Stat. Assoc. 2010, 105, 493–505. [Google Scholar] [CrossRef]
  64. Van, D.A.; Martin, R.V.; Brauer, M.; Boys, B.L. Use of Satellite Observations for Long-Term Exposure Assessment of Global Concentrations of Fine Particulate Matter. Environ. Health Perspect. 2015, 123, 135–143. [Google Scholar]
  65. Leng, X.; Zhong, S.; Kang, Y. Citizen participation and urban air pollution abatement: Evidence from environmental whistle-blowing platform policy in Sichuan China. Sci. Total Environ. 2022, 816, 151521. [Google Scholar] [CrossRef] [PubMed]
  66. Guo, Y.; Zhang, Q.; Lai, K.K.; Zhang, Y.; Wang, S.; Zhang, W. The Impact of Urban Transportation Infrastructure on Air Quality. Sustainability 2020, 12, 5626. [Google Scholar] [CrossRef]
  67. Borck, R.; Schrauth, P. Population density and urban air quality. Reg. Sci. Urban Econ. 2021, 86, 103596. [Google Scholar] [CrossRef]
  68. Kim, S.-Y.; Kim, H.; Lee, J.-T. Health Effects of Air-Quality Regulations in Seoul Metropolitan Area: Applying Synthetic Control Method to Controlled-Interrupted Time-Series Analysis. Atmosphere 2020, 11, 868. [Google Scholar] [CrossRef]
  69. Xu, B.; Lin, B. Regional differences of pollution emissions in China: Contributing factors and mitigation strategies. J. Clean. Prod. 2016, 112, 1454–1463. [Google Scholar] [CrossRef]
  70. Colvile, R.N.; Hutchinson, E.J.; Mindell, J.S.; Warren, R.F. The transport sector as a source of air pollution. Atmos. Environ. 2001, 35, 1537–1565. [Google Scholar] [CrossRef]
  71. Xia, Q.; Li, L.; Dong, J.; Zhang, B. Reduction Effect and Mechanism Analysis of Carbon Trading Policy on Carbon Emissions from Land Use. Sustainability 2021, 13, 9558. [Google Scholar] [CrossRef]
  72. Abadie, A.; Diamond, A.J.; Hainmueller, J. Comparative Politics and the Synthetic Control Method. Am. J. Political Sci. 2015, 59, 495–510. [Google Scholar] [CrossRef]
  73. Baron, R.M.; Kenny, D.A. The moderator–mediator variable distinction in social psychological research: Conceptual, strategic, and statistical considerations. J. Personal. Soc. Psychol. 1986, 51, 1173–1182. [Google Scholar] [CrossRef]
  74. Hayes, A.F. Beyond Baron and Kenny: Statistical Mediation Analysis in the New Millennium. Commun. Monogr. 2009, 76, 408–420. [Google Scholar] [CrossRef]
Figure 1. Hubei Province and other pilot areas of carbon emission trading in China. The data are from the Ministry of Natural Resources of the People’s Republic of China.
Sustainability 14 10755 g001
Figure 2. PM2.5 concentration distribution before (left) and after (right) the implementation of carbon emission trading market. The data are derived from the PM2.5 concentration data obtained by the Atmospheric Composition Analysis Group at Dalhousie University.
Sustainability 14 10755 g002
Figure 3. PM2.5 concentration of real Hubei and synthetic Hubei.
Sustainability 14 10755 g003
Figure 4. PM2.5 concentration of real Anhui and synthetic Anhui.
Sustainability 14 10755 g004
Figure 5. PM2.5 concentration of real Hunan and synthetic Hunan.
Sustainability 14 10755 g005
Figure 6. Time placebo test of PM2.5 concentration in Hubei.
Sustainability 14 10755 g006
Figure 7. PM2.5 concentration gaps in Hubei and other provinces.
Sustainability 14 10755 g007
Figure 8. Eliminate the control group whose RMSPE is five times greater than Hubei.
Sustainability 14 10755 g008
Table 1. Predictors of PM2.5 concentration.
PredictorIndexAbbreviation
Economic sizeGDP/Total populationES
Population densityPopulation/AreaPD
Urbanization rateUrban population/Total populationUR
Transport sectorCar ownershipTS
Energy consumptionTotal of all energy consumptionEC
Table 2. Weight composition of synthetic Hubei Province.
Provinces Involved in SynthesisHunanAnhuiLiaoningFujianShanxiNingxiaHainan
weight0.5120.2690.1350.0510.0240.0070.002
Table 3. Comparison of true value and synthetic value of predictive variables.
Predictive VariablesReal HubeiSynthetic HubeiAverage of Control Provinces
Economic size1,3661.911,3565.691,4941.83
Population density292.90292.83254.47
Energy consumption5478.585431.268006.99
Transport sector56.9763.1771.89
Urbanization rate0.39110.39080.3931
Washington (2000)46.0046.0035.67
Washington (2005)46.3046.2632.00
Washington (2010)57.0055.9039.06
Table 4. The Influence Mechanism of Carbon Emission Trading on PM2.5 Concentration.
VariablePitESTPitRDPitPit
(1)(2)(3)(4)(5)(6)
Time × treatit−5.236 **−0.655 ***−4.976 **1277.094 ***−6.2776 **−7.0340 ***
(−2.10)(−5.63)(−2.11)(4.87)(−2.10)(−2.36)
EST −2.007 ** −1.587 ***
(−2.01)(−3.38)
RD 0.0007 ***0.0009 ***
(3.26)(5.17)
ES0.002 ***0.006 **−0.003 ***24.173 ***−0.002 ***−0.003 ***
(4.24)(2.63)(−4.22)(3.72)(−5.20)(−4.63)
PD0.016 ***0.0380.157 ***125.3020.016 ***0.024 ***
(4.49)(0.06)(4.48)(0.34)(4.58)(4.27)
TS0.005−0.052 ***0.0057284.004 ***0.005 **0.003
(0.96)(−5.56)(0.97)(13.38)(2.05)(1.21)
UR−0.009 **−0.492−0.973 **3024.54−0.097 **−0.125 *
(−2.02)(−0.50)(−2.01)(0.59)(−2.19)(−1.66)
EI0.001 ***0.001 ***0.012 ***38.688 ***0.001 ***0.003 ***
(9.18)(4.74)(5.28)(2.71)(8.82)(7.61)
Time fixed effectYESYESYESYESYESYES
Regional fixed effectYESYESYESYESYESYES
Observed value422422422422422422
R20.64090.91210.58270.97940.68150.6022
*, **, and *** indicate statistical significance at the 10%, 5%, and 1% levels. Numbers in parentheses are t-Student statistics.
Publisher’s Note: MDPI stays neutral with regard to jurisdictional claims in published maps and institutional affiliations.

