Article

Comparing Four Machine Learning Algorithms for Land Cover Classification in Gold Mining: A Case Study of Kyaukpahto Gold Mine, Northern Myanmar

1
Faculty of Environment and Resource Studies, Mahidol University, Nakhon Pathom 73170, Thailand
2
Thai Telecommunication Relay Service, Bangkok Noi, Bangkok 10700, Thailand
*
Author to whom correspondence should be addressed.
Sustainability 2022, 14(17), 10754; https://doi.org/10.3390/su141710754
Submission received: 18 June 2022 / Revised: 19 August 2022 / Accepted: 24 August 2022 / Published: 29 August 2022

Abstract

:
Numerous studies have been undertaken to determine the optimal land use/cover classification algorithm. However, there have not been many studies that have compared and evaluated the performance of maximum likelihood (ML), random forest (RF), support vector machine (SVM), and classification and regression trees (CART) using ASTER imagery, especially in a mining district. Therefore, this study aims to investigate land use/cover (LULC) change over three decades (1990–2020), comparing the performance of the ML, RF, SVM, and CART machine learning algorithms. The Landsat and ASTER data were retrieved using Google Earth Engine (GEE). Traditional ML classification was performed on ArcGIS 10.2 software while RF, SVM, and CART classification were undertaken on GEE. Then, thematic accuracy assessments were conducted for the four algorithms and their performances were compared. The results showed that the largest changes in area occurred in forest cover that decreased from 37.8 to 27.3 km2 during the three decades. The remarkable expansion of gold mining occurred during 2005–2010 with the increases of 1.6%. The mining land rose by 2.9% during the study period whereas agricultural land increased significantly by 10.7% between 1990 and 2020. When comparing the four algorithms, the RF algorithm gives the highest accuracy with an overall accuracy of 95.85% while SVM follows RF with 91.69%. This study proved that RF is the best choice for optimal land use/cover classification, particularly in the mining district.

1. Introduction

By collecting data over broad portions of the Earth, satellite remote sensing has offered an incredible possibility for precise mapping and monitoring of environmental processes and land cover change [1,2]. Since 1972, the Landsat satellite mission has been collecting the images that cover the whole world and providing a twice-a-week observation of Earth at a resolution of 30 × 30 m, excluding Landsat-1 which has 80 meter ground resolution [3]. The USGS’s (U.S. Geological Survey) Landsat open data policy, which went into effect in 2008, enables researchers to freely mine the data and quantify land cover change in ways that were previously impossible [4].
According to Lu and Weng [5], the outcomes of land use/cover mapping are influenced not only by the appropriateness of imagery but also by the correct choice of classification method. A variety of classification approaches for land use/cover assessment utilizing remotely sensed data have been developed and evaluated in the publications. These classifiers include unsupervised algorithms (such as ISODATA or K-means) as well as parametric supervised algorithms (such as maximum likelihood (ML)) and machine learning algorithms including artificial neural networks (ANN), k-Nearest Neighbors (kNN), decision trees (DT), support vector machines (SVM) and random forest (RF), and Classification And Regression Trees (CART) [6,7,8,9]. Non-parametric approaches (machine-learning-based algorithms) have received a huge amount of interest in remote sensing studies in the past decade [10].
Several studies have been conducted to determine the best algorithm for land use/cover classification by evaluating their performances. Their conclusions, however, are quite different. In a land cover classification study using Landsat TM data conducted by Dixon and Candade [11], SVM produced good results, however, ML performed much worse. Moreover, SVM was shown to be superior to traditional classification algorithms such as maximum likelihood (ML), k-nearest neighbor (kNN), and neural networks (NN) in hyperspectral remote sensing classification according to the previous studies [12,13,14]. On the other hand, according to Adam et al. [15] and Ghosh and Joshi [16], SVM and RF produced similar results of classification. Pouteau et al. [17] also compared the performance of six machine learning algorithms (SVM, naïve Bayes, C4.5, RF, boosted regression tree, and kNN) using different satellite data and concluded that kNN performs best with Landsat-7 ETM+ data. When comparing naïve Bayesian, kNN, SVM, tree ensemble, and artificial neural network using Landsat data, SVM and kNN perform better in the classification [18]. Furthermore, Lizarazo [19] and Tso and Mather [20] used SVM and RF, respectively, in both supervised and unsupervised classification and claimed that these two classifiers give the most accurate results.
In the comparative study on decision tree (DT), ANN, and ML, according to Pal and Mather [21] there are no remarkable differences in classification accuracy between the former two, whereas the manual work and computational time effort turned out to be much more intensive for ANN. A land cover classification with ANN, SVM, DT, and ML published by Huang et al. [12] resulted in higher accuracies of ANN and SVM as compared to DT. Nonetheless, DT performed much faster with a calculation time of minutes compared to hours and days, respectively, for SVM and ANN.
No one would deny that, in a mining area where numerous human activities occur, there will be many disturbances that can change land use/land cover (LULC) [22]. Kamga et al., (2020) [23] used the maximum likelihood algorithm and Landsat data to study the LULC change in gold mining areas and highlighted the effectiveness of the data and the method they used. It is difficult to track LULC dynamics in large-scale underground mining areas where LULC heterogeneity is substantial, and there has been a long history of disturbances. In such areas, Mi et al., (2019) [24] tested the performance of RF, SVM, ML, and NN and proved that RF had a better performance compared to other classifiers in this heterogeneous area.
To the best of our knowledge, only a limited number of studies comparing and evaluating the performance of ML, RF, SVM, and CART using ASTER imagery, particularly in a mining district, has been published. Therefore, it is valuable for a comparison and evaluation of the performance of ML, RF, SVM, and CART in terms of land use/cover mapping. The objectives of this study are to assess land use/cover change in the Kyaukpahto mining district over the three decades ranging from 1990 to 2020 and evaluate the performance of the four popular classifiers, ML, RF, SVM, and CART, when applied to an ASTER image. This paper mainly contributes to the selection of a suitable classifier for land use/cover change studies in a mining district, and it will be useful for those who conduct similar research.

2. Materials and Methods
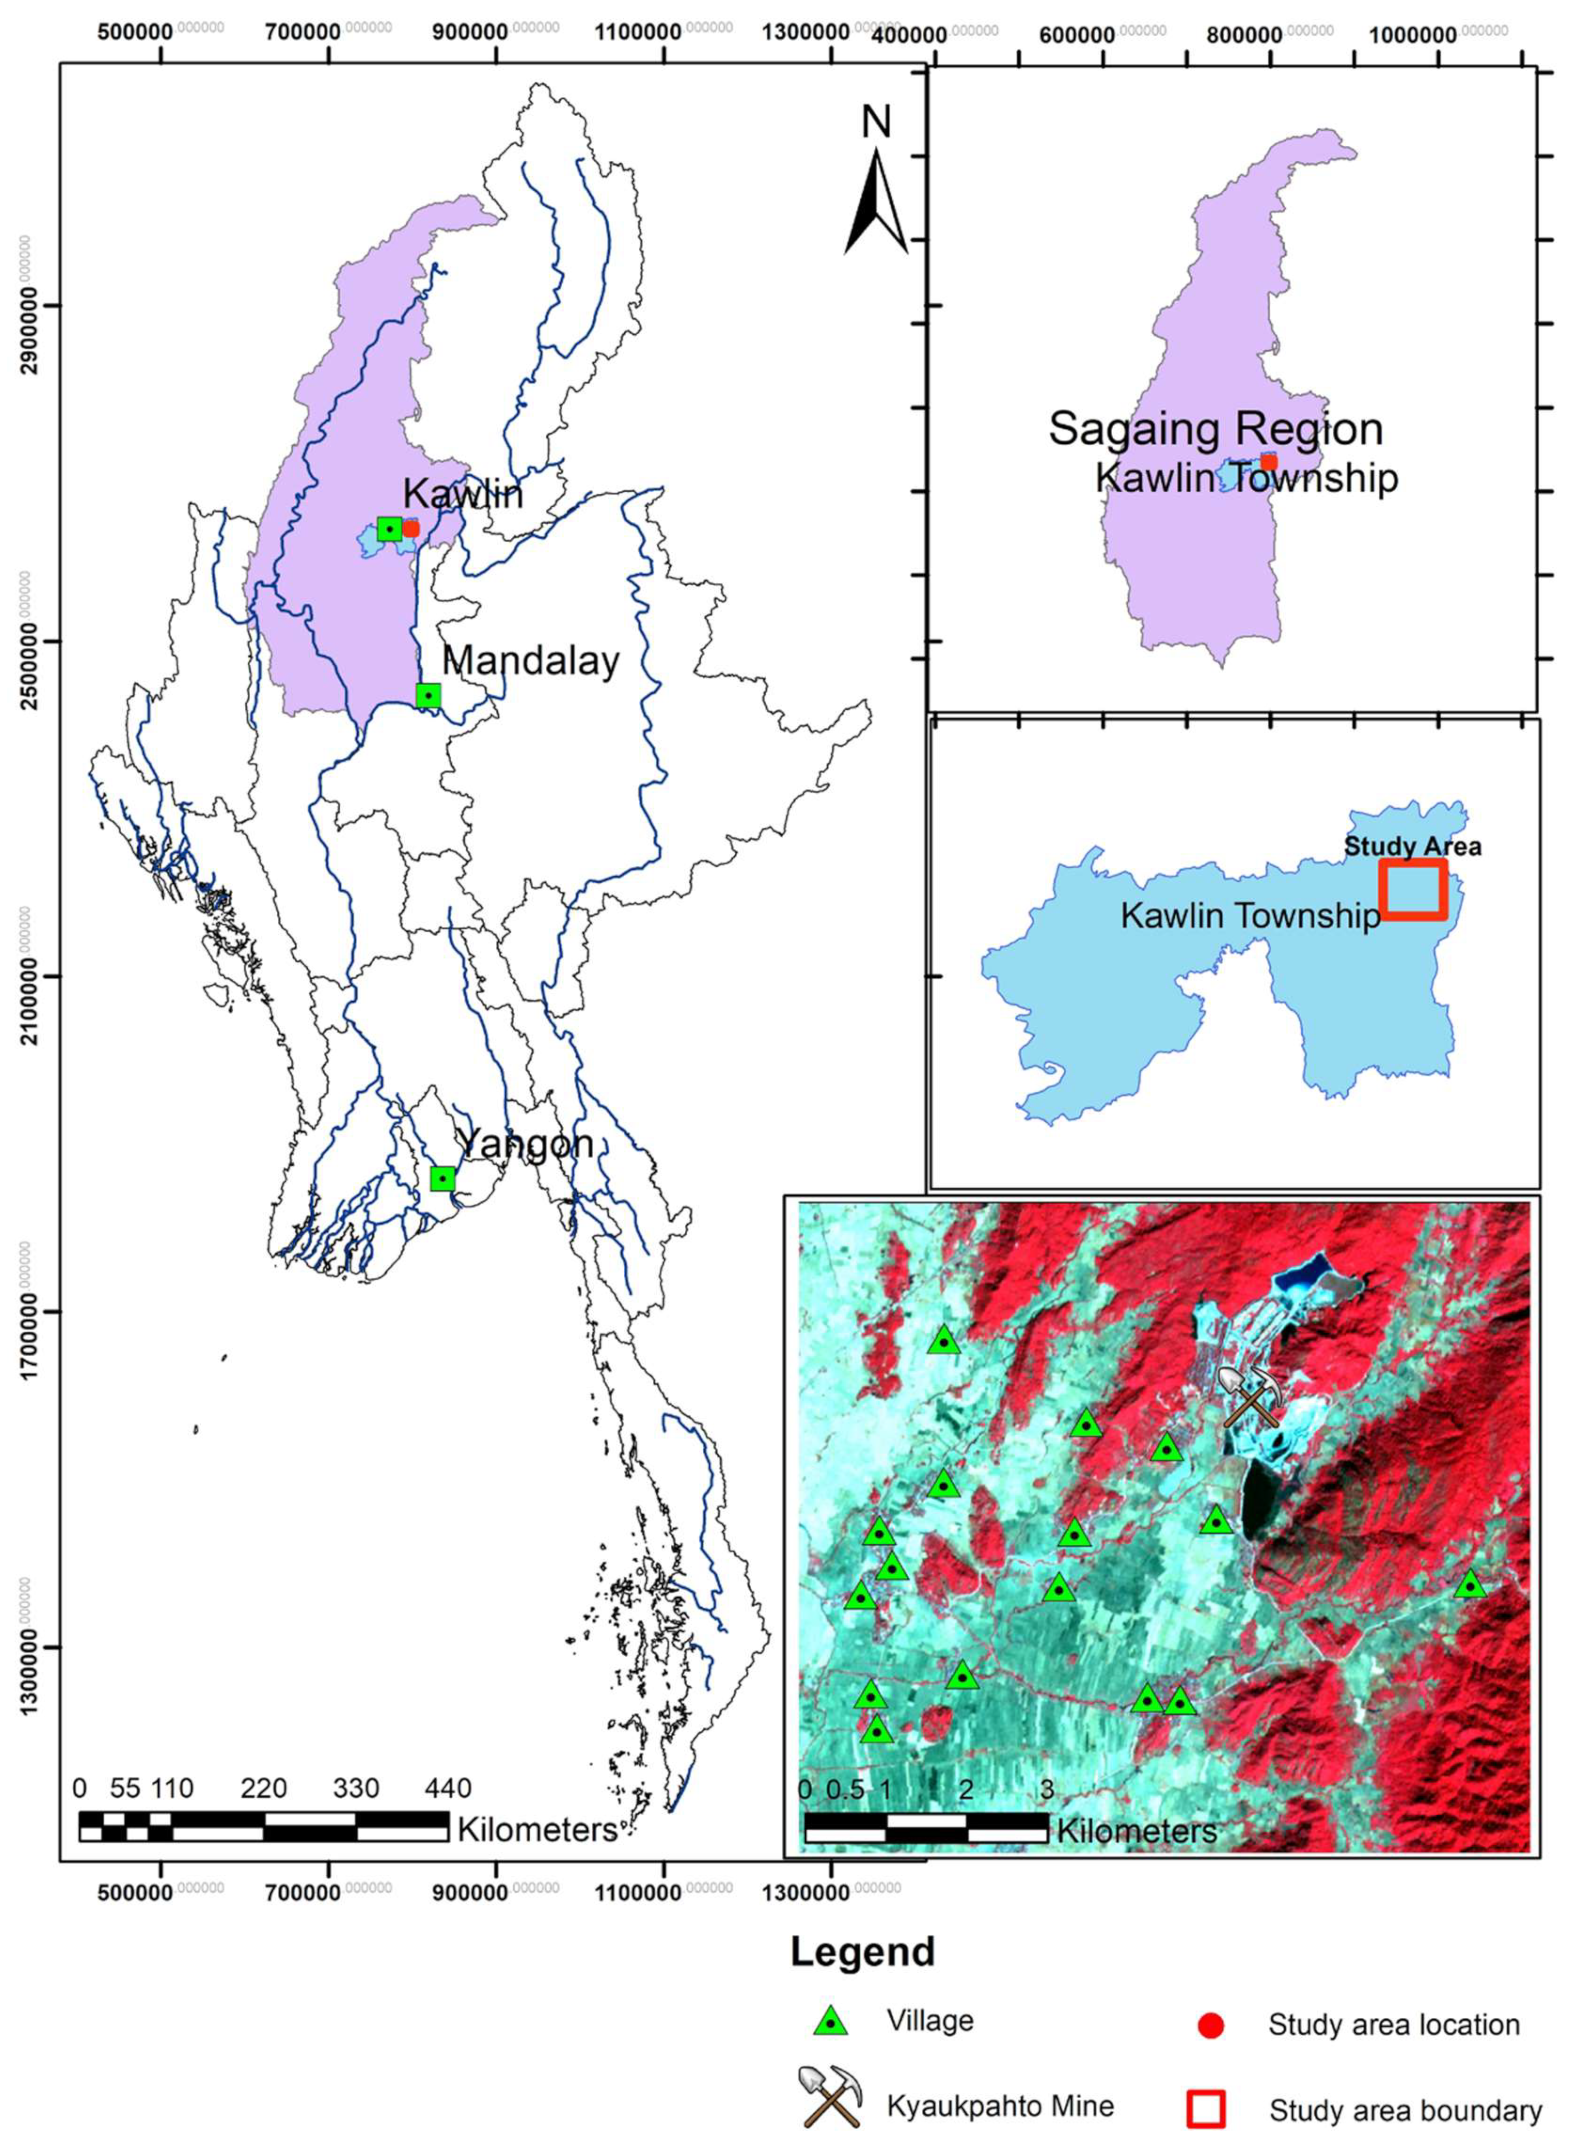
2.1. Study Area

The Kyaukpahto gold mine is located at Latitude 23°48′55″ N and Longitude 95°56′44″ E, approximately 30 km east of Kawlin and 250 km north of Mandalay, in northern Myanmar (Figure 1). The study area covers approximately 72.72 square kilometers. The mine is accessible all year round by motor vehicle from Mandalay or by train from Mandalay to Kawlin and then to the east along a 30 km metalled road. The area can also be reached by boat from Mandalay to Tigyaing, 25 km east of Kyaukpahto, on the Ayeyarwady river. This river is also navigable all seasons. Tigyaing and Kyaukpahto are connected with an all-season motorable road. The gold deposit lies within the north–south trending Minwun Range and the altitude in the region varies from 250 to 400 m with isolated peaks rising to 700 m in height. The Kyaukpahto region enjoys a sub-tropical monsoon climate with an annual rainfall of 1000–1500 mm and is covered by deciduous forest. The study area mainly includes four typical land use/cover classes: agricultural land, mining land, forest cover, and water body.

2.2. Data Used

Landsat 5 and 8 and ASTER data were downloaded via Google Earth Engine (GEE) as these data are readily available on GEE and some pre-processing works can be performed. ASTER acquired on 7 December 2020 was used to evaluate the four classifiers while Landsat 5 and 8 data acquired on 15 December 2020, 16 November 2015, 10 December 2010, 5 February 2005, 8 December 2000, 2 December 1995 and 13 December 1990 were utilized for land use/cover change analysis.

2.3. Training and Testing Sample Datasets

The training data (training and testing samples) were gathered using a manual interpretation of the original ASTER data as well as high-resolution imagery from Google Earth. ArcGIS 10.2 was used to create training and testing sample data for each land cover class. The number of the training and testing samples per class is shown in Table 1.

2.4. Classification Algorithms

The three machine learning algorithms tested in this study including RF, SVM, and CART are available in Google Earth Engine (GEE). Therefore, the classifications using RF, SVM, and CART were completed on GEE. The traditional maximum likelihood classification was performed on ArcGIS 10.2 software. These four classifiers are briefly explained in the following paragraphs.
The most often used supervised classification approach is the maximum likelihood (ML) algorithm. It is used in a variety of studies and applications including land cove/use [25,26,27,28,29]. Maximum likelihood classification (MLC) is used to determine the maximum for a given statistic from a known class of distributions. For the training samples, a normal distribution is assumed. The probability density functions for each category are created using the algorithm. Assigning every unclassified pixel as membership is based on the relative likelihood (probability) of that pixel appearing within each category’s probability density function during classification. If G specified categories exist, the unclassified image will have m bands. The posterior probability of category k, P(Gk/x), is defined by the Bayesian formula as,
P G k / x = P x / G k P G k P x  
where P(Gk) is the prior probability of category k, P(x/Gk) is conditional probability of observing x from Gk (probability density function), P(x) is the same for each category. We can presume that all categories are probable if we do not know anything about the prior distributions P(Gk). As a result, P(x/Gk), also known as the likelihood of Gk with regard to x, determines the likelihood function.
Breiman [30] created Random Forest (RF), a new non-parametric ensemble machine learning algorithm. The RF algorithm has been used to solve various environmental problems. It can process a wide range of data, including satellite images and numerical data [31]. It is a decision-tree-based ensemble learning method that combines huge ensemble regression and classification trees. Two factors are required to set up the RF model, which are referred to as the base of the model. These factors are (1) the number of trees, which ‘n-tree’ can explain and (2) the number of features in each split, which ‘m-try’ can explain. Individual voting power or vote is generated by classification trees, which provide correct classification in managing the majority vote from trees across the forest.
Vapnik and Chervonenkis [32] were the first to propose SVM as a nonparametric algorithm. The SVM method creates a hyperplane based on the largest gap in the given training sample sets, then categorizes the segmented objects into one of the recognized LULC classes. The common kernel functions employed in SVM algorithms are linear, polynomial, radial basis function (RBF), and sigmoid kernels (Kavzoglu and Colkesen, 2009). RBF kernel is the most commonly used one. The “cost” (C) and gamma which are tuning parameters of the RBF kernel, influences overall classification accuracy [33].
Breiman et al. [34] developed the decision trees (DT) model, which is a common non-parametric one. The classification and regression tree (CART) algorithm is a very common DT used for different purposes. By splitting the training sample set into subsets based on an attribute value test and then repeating this procedure on every resulting subset, a tree can be developed in a binary recursive partitioning process using CART. When no further subset splits are conceivable, the tree-growing process comes to an end. In CART, the maximum depth of the tree is an important tuning parameter that defines the model’s complexity. Generally, a deeper depth allows for a more complicated tree to be built, perhaps leading to improved overall classification accuracy. Nevertheless, having too many nodes can result in the model being overfitted.

2.5. Thematic Accuracy Assessment and Comparisons

This step used 313 validation pixels retrieved from sampling polygons, as well as their corresponding classified pixels produced in the classification process. These data were used as input to build the associated confusion matrixes by running the confusion function for each of the classifiers. The overall accuracy (OA) and the Kappa index [20] were determined using the confusion matrix. The OA is the percentage of correctly classified pixels in an image. For all the included categories, the global Kappa index assesses the agreement between pixels classified and class sample pixels. The OA, kappa value, user’s accuracy, and producer’s accuracy were calculated using confusion matrixes and the comparisons between the four classifiers were made to evaluate their performances.

3. Results

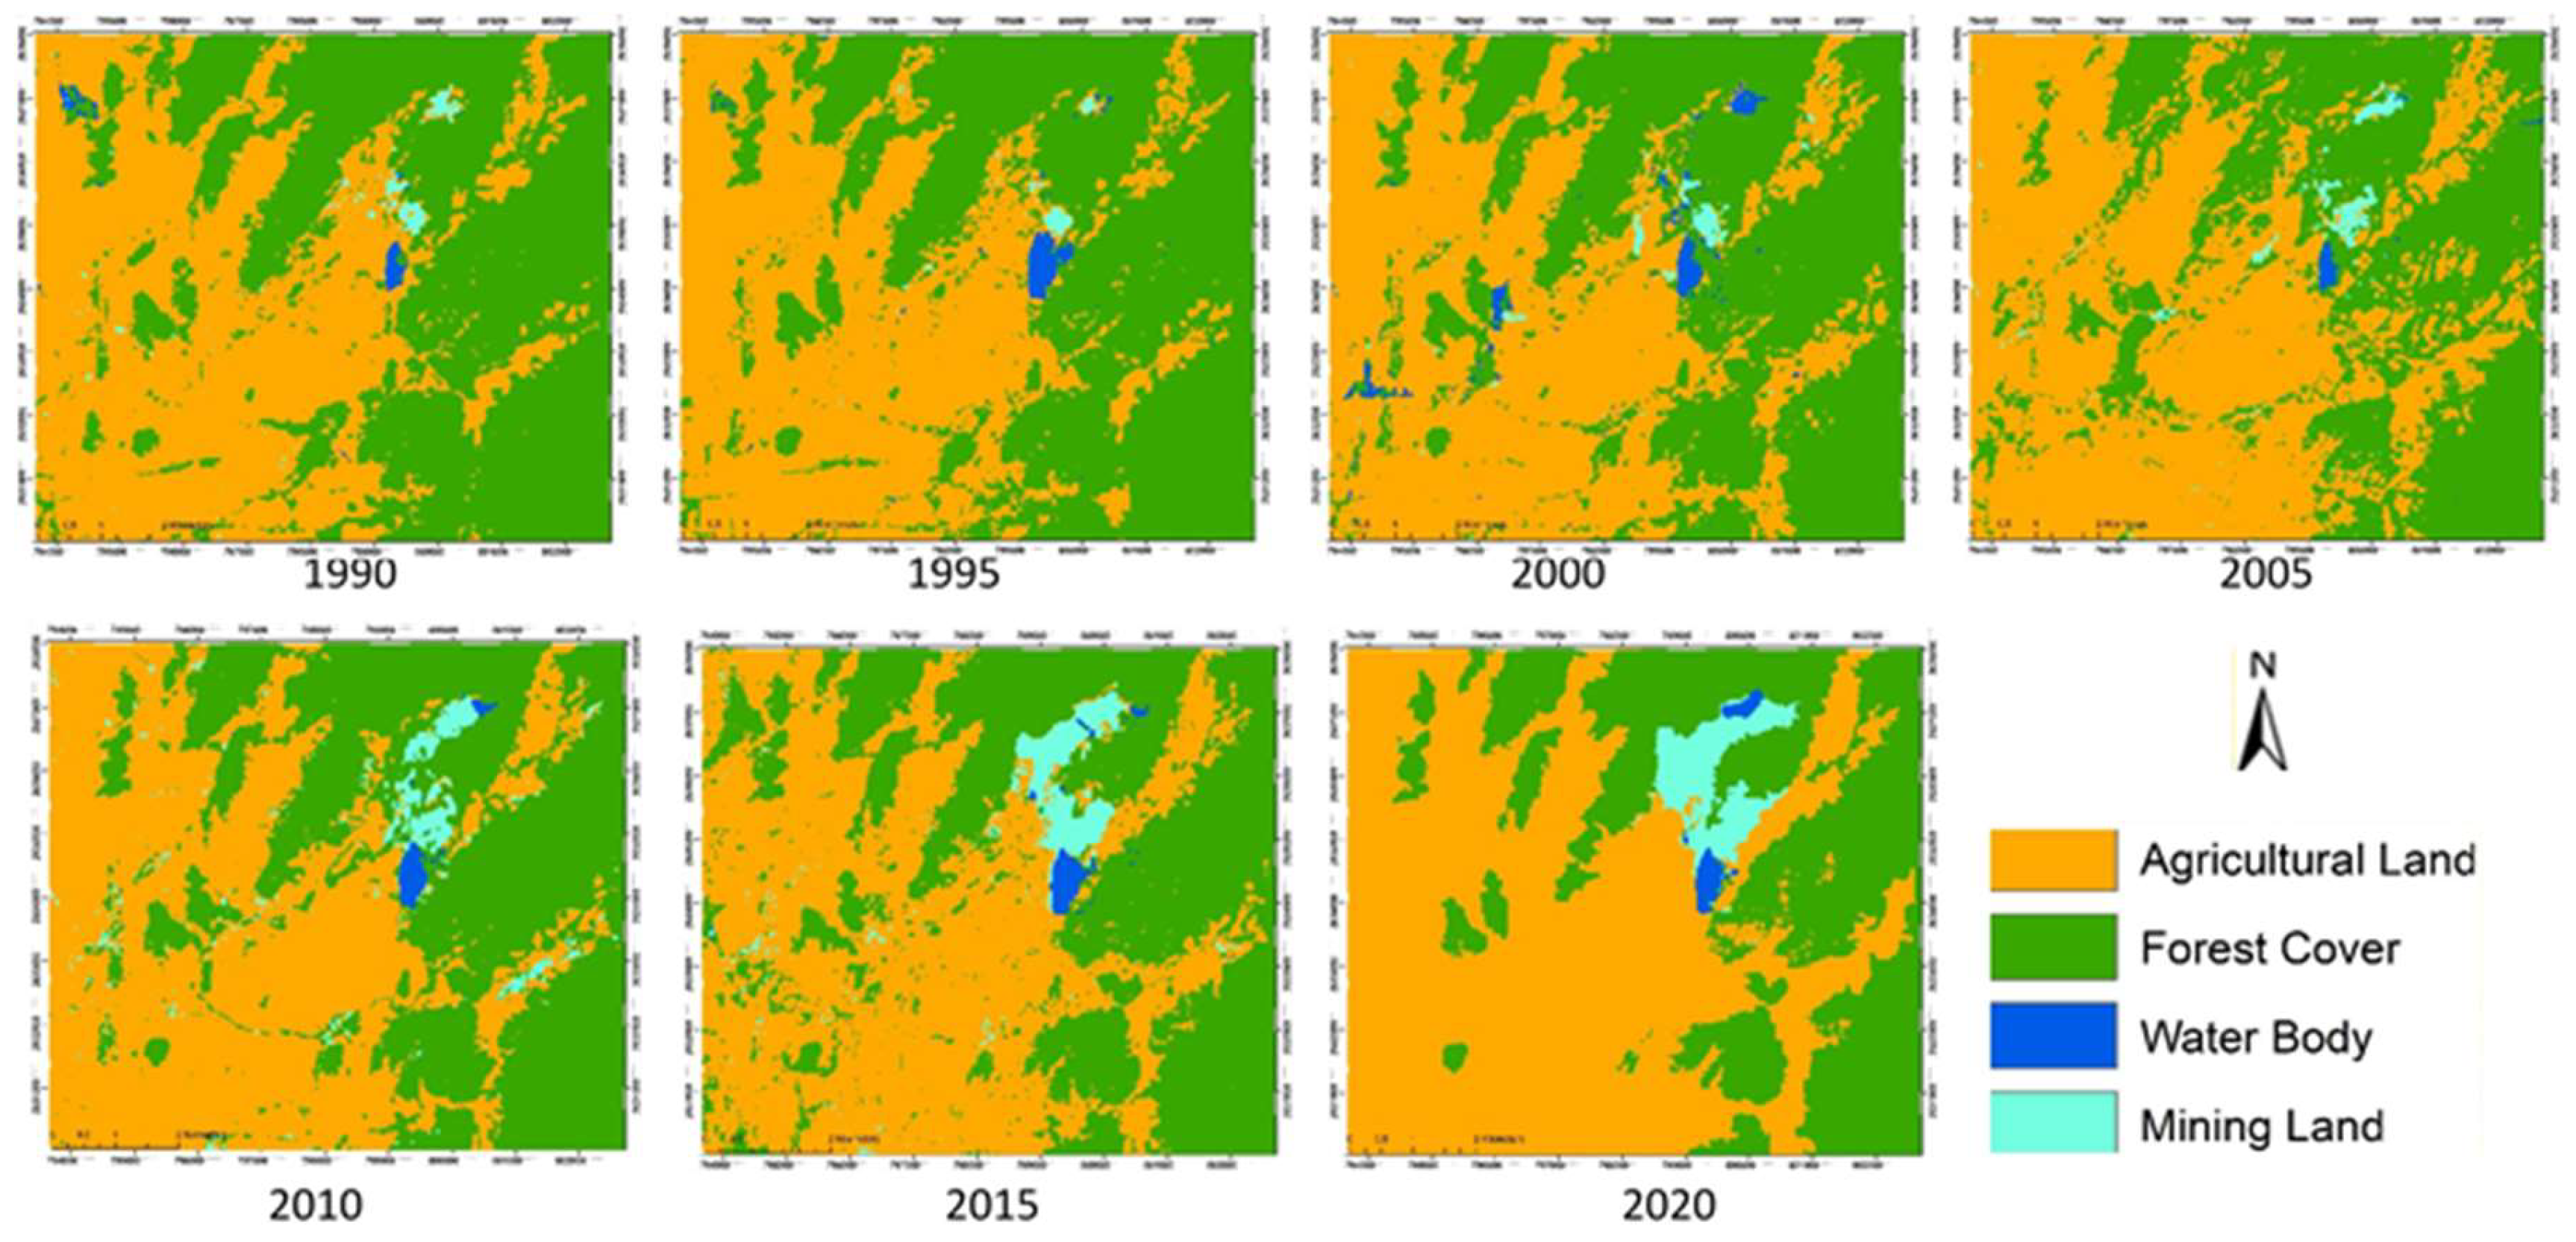
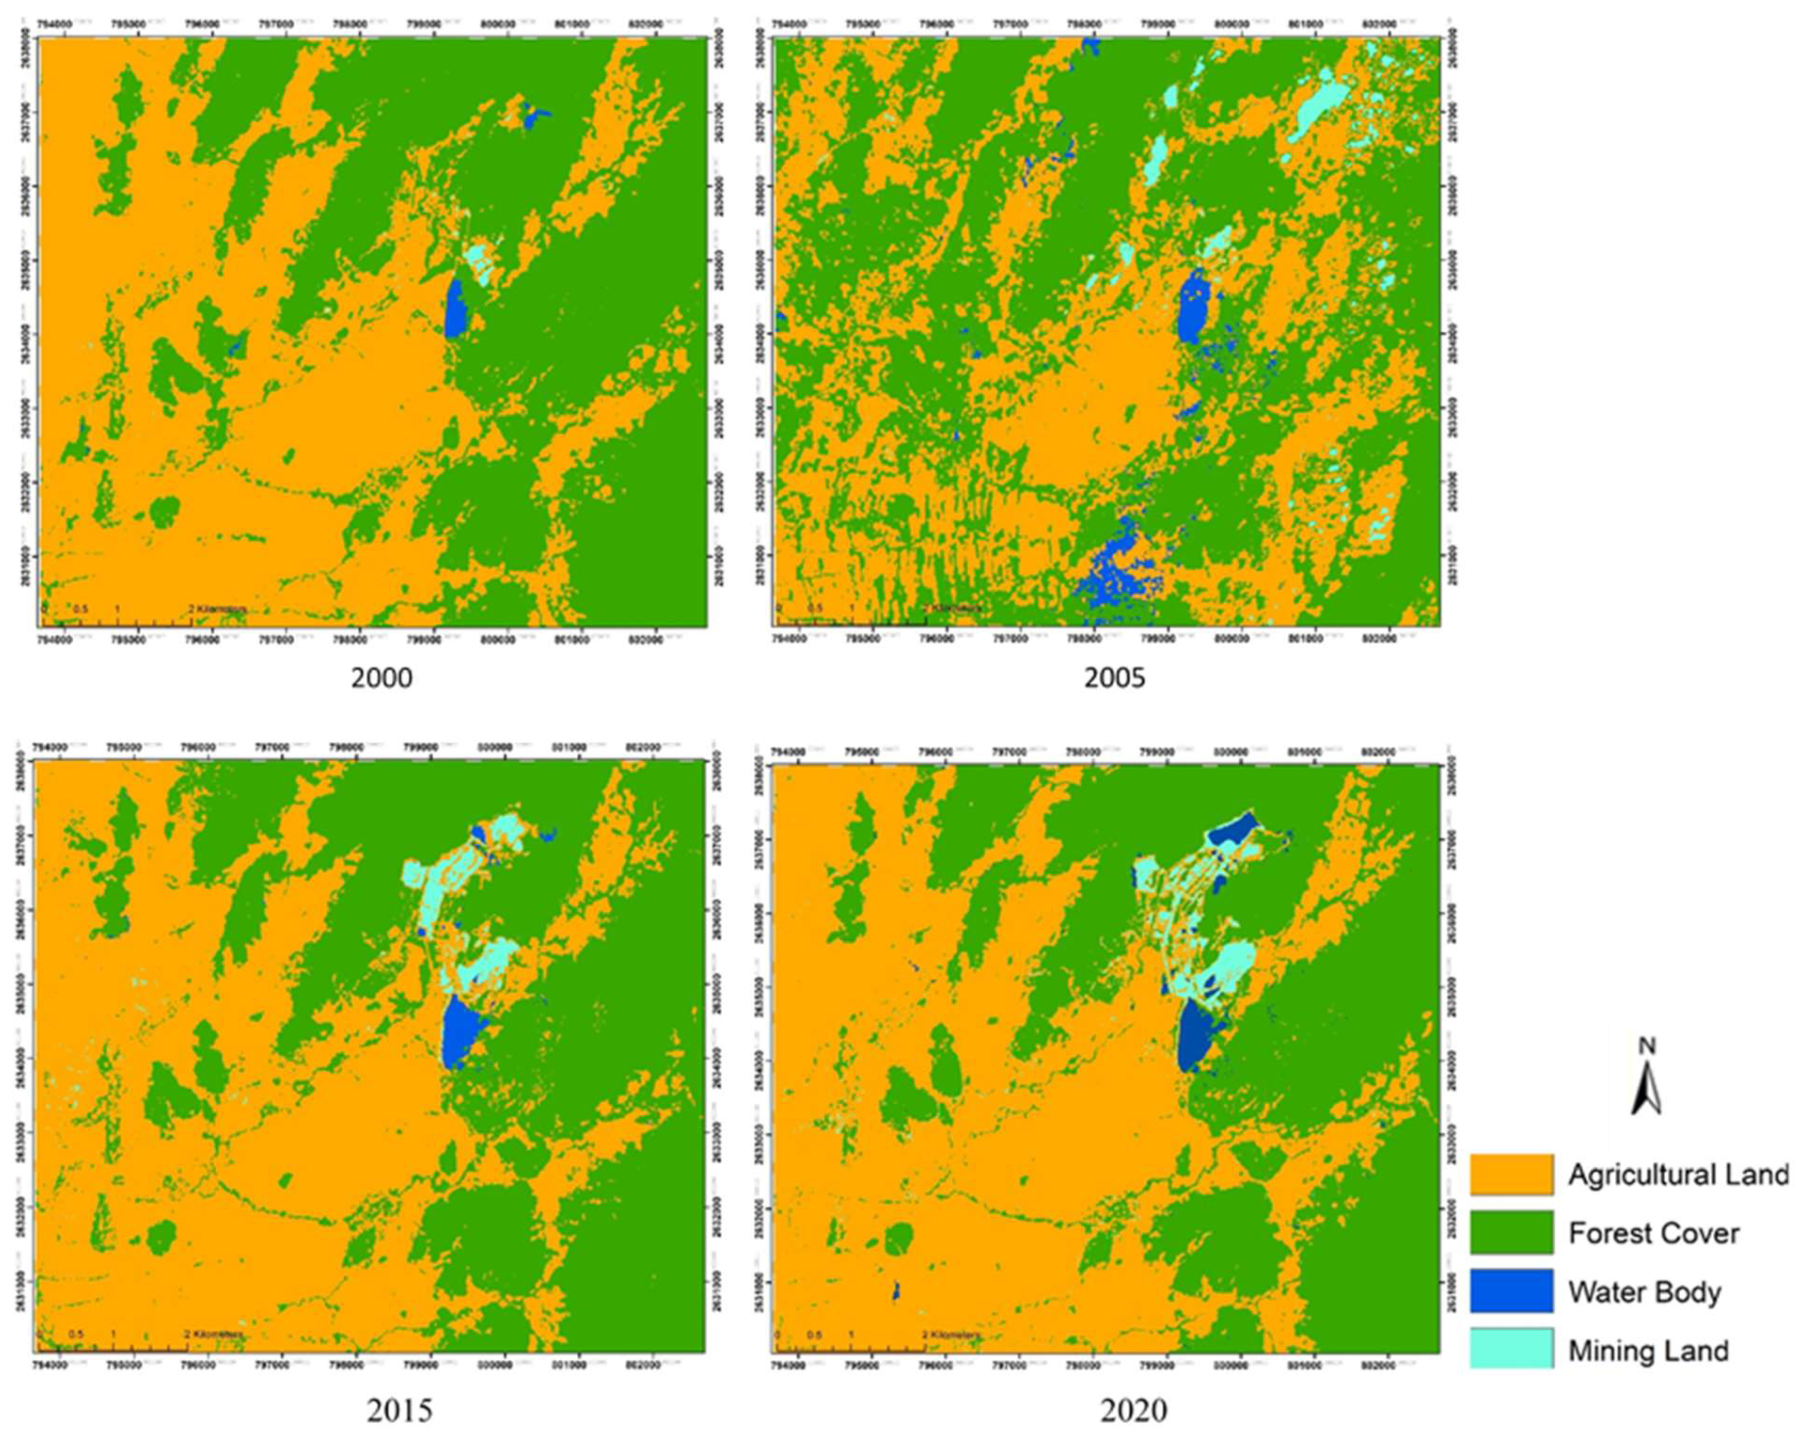
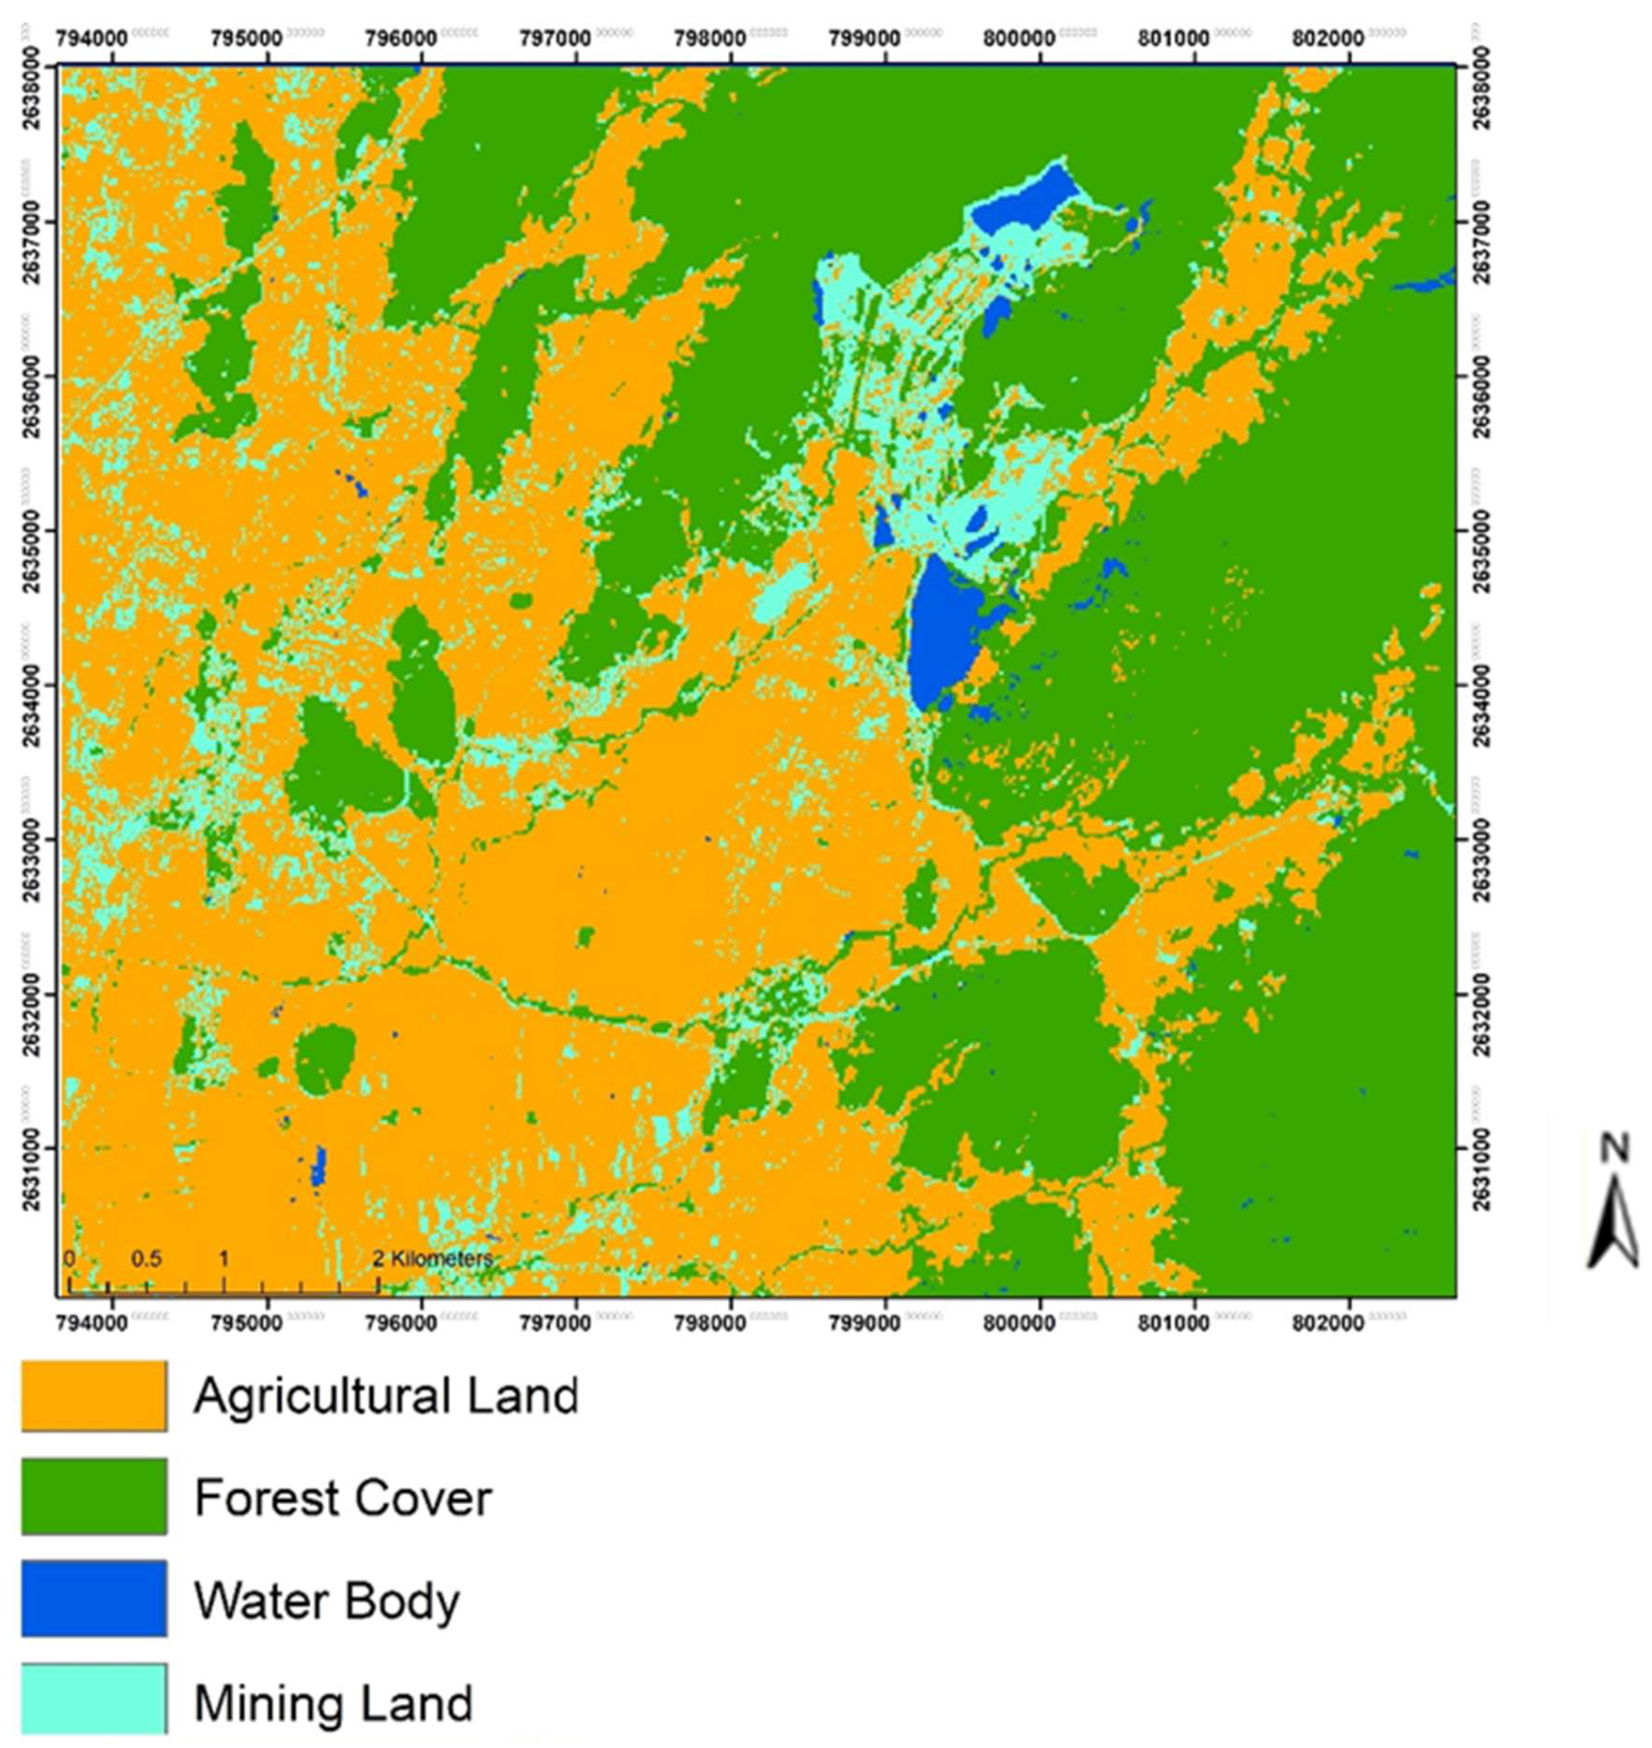
3.1. Land Use/Cover Change Analysis

The current research examines and summarizes the changes in LULC from 1990 to 2020. The land cover maps (Figure 2) utilized in this study were produced using Landsat satellite data and the random forest algorithm (RF), which has a higher accuracy. The thematic LULC maps derived from ASTER data are shown in Figure 3, and these data do not cover the whole study period. Areas in km2 and percentages of each class in each year throughout the study period are shown in Table 2. Table 3 summarizes the changes between the LULC maps of 1990 and 2020, covering 75.8 km2 of the study area.
LULC in the Kyaukpahto mining district has changed dramatically during the study period (1990–2020) (Table 3). The largest changes in the area occurred in forest cover. The forest cover decreased from 37.8 to 27.3 km2 during the three decades. It is noteworthy that the remarkable expansion of gold mining occurred between 2005 and 2010 with an increase of 1.6%. The mining land rose by 2.9% during the study period. The reasons behind the expansion of gold mining are the increase in foreign direct investment (FDI) in the mining industry, the advancement of mining technology, and the stable demand for gold. Similarly, agricultural land also increased significantly by 10.7% between 1990 and 2020. The notable decline in the water body occurred in the study area between 2000 and 2005 with −1.0%. Overall, both agricultural land mining land increased over the study period while the declining trend can be seen only in forest cover.

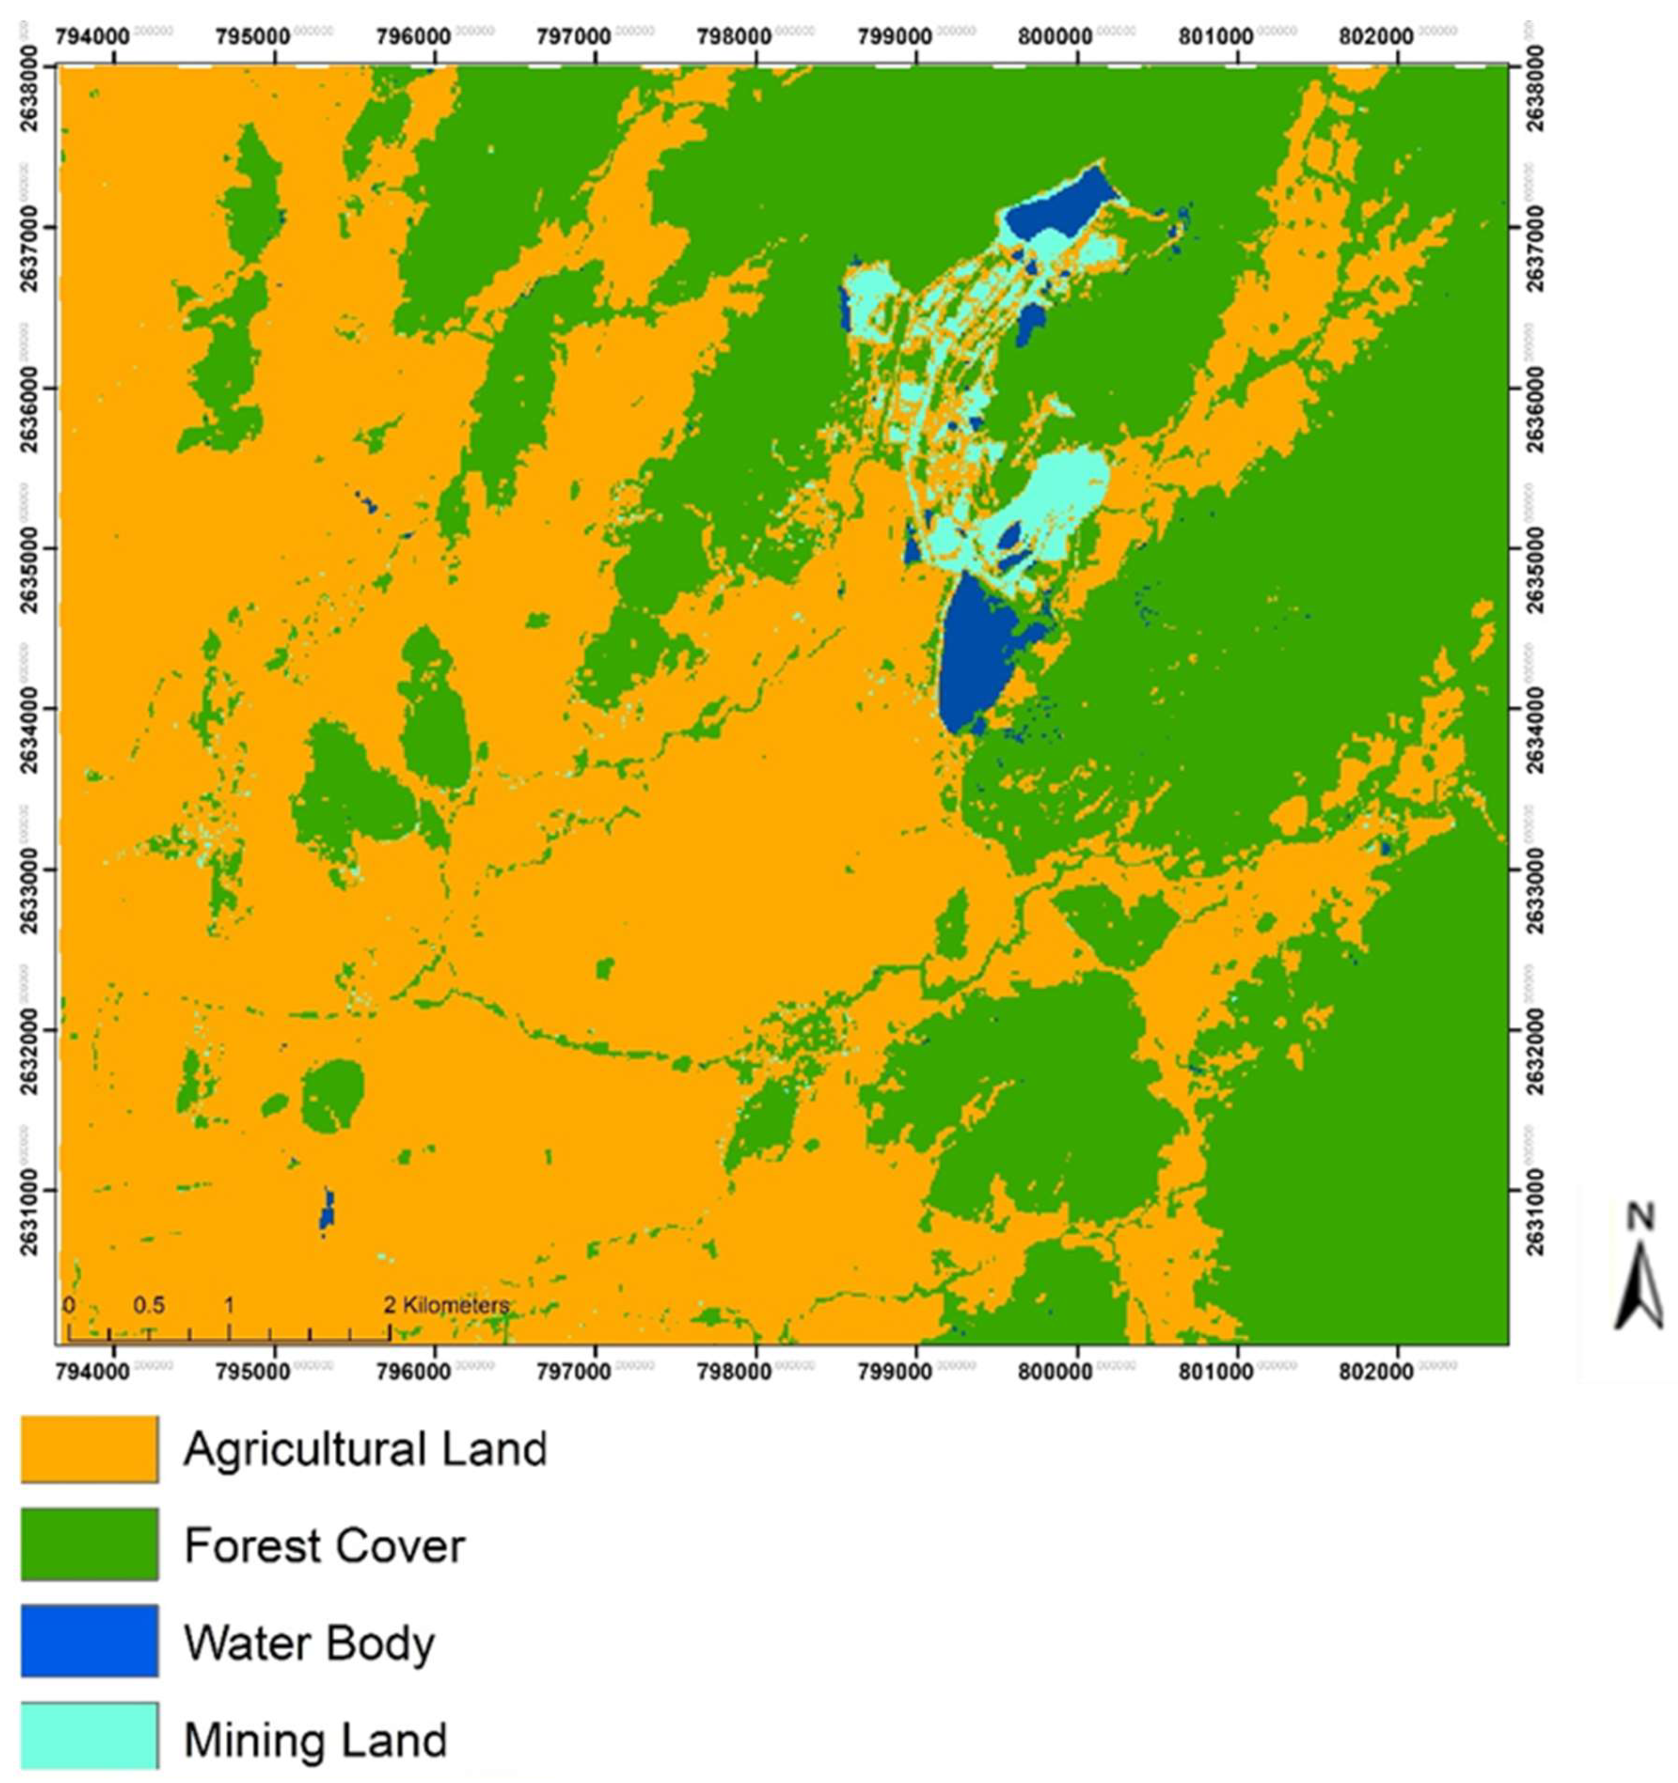
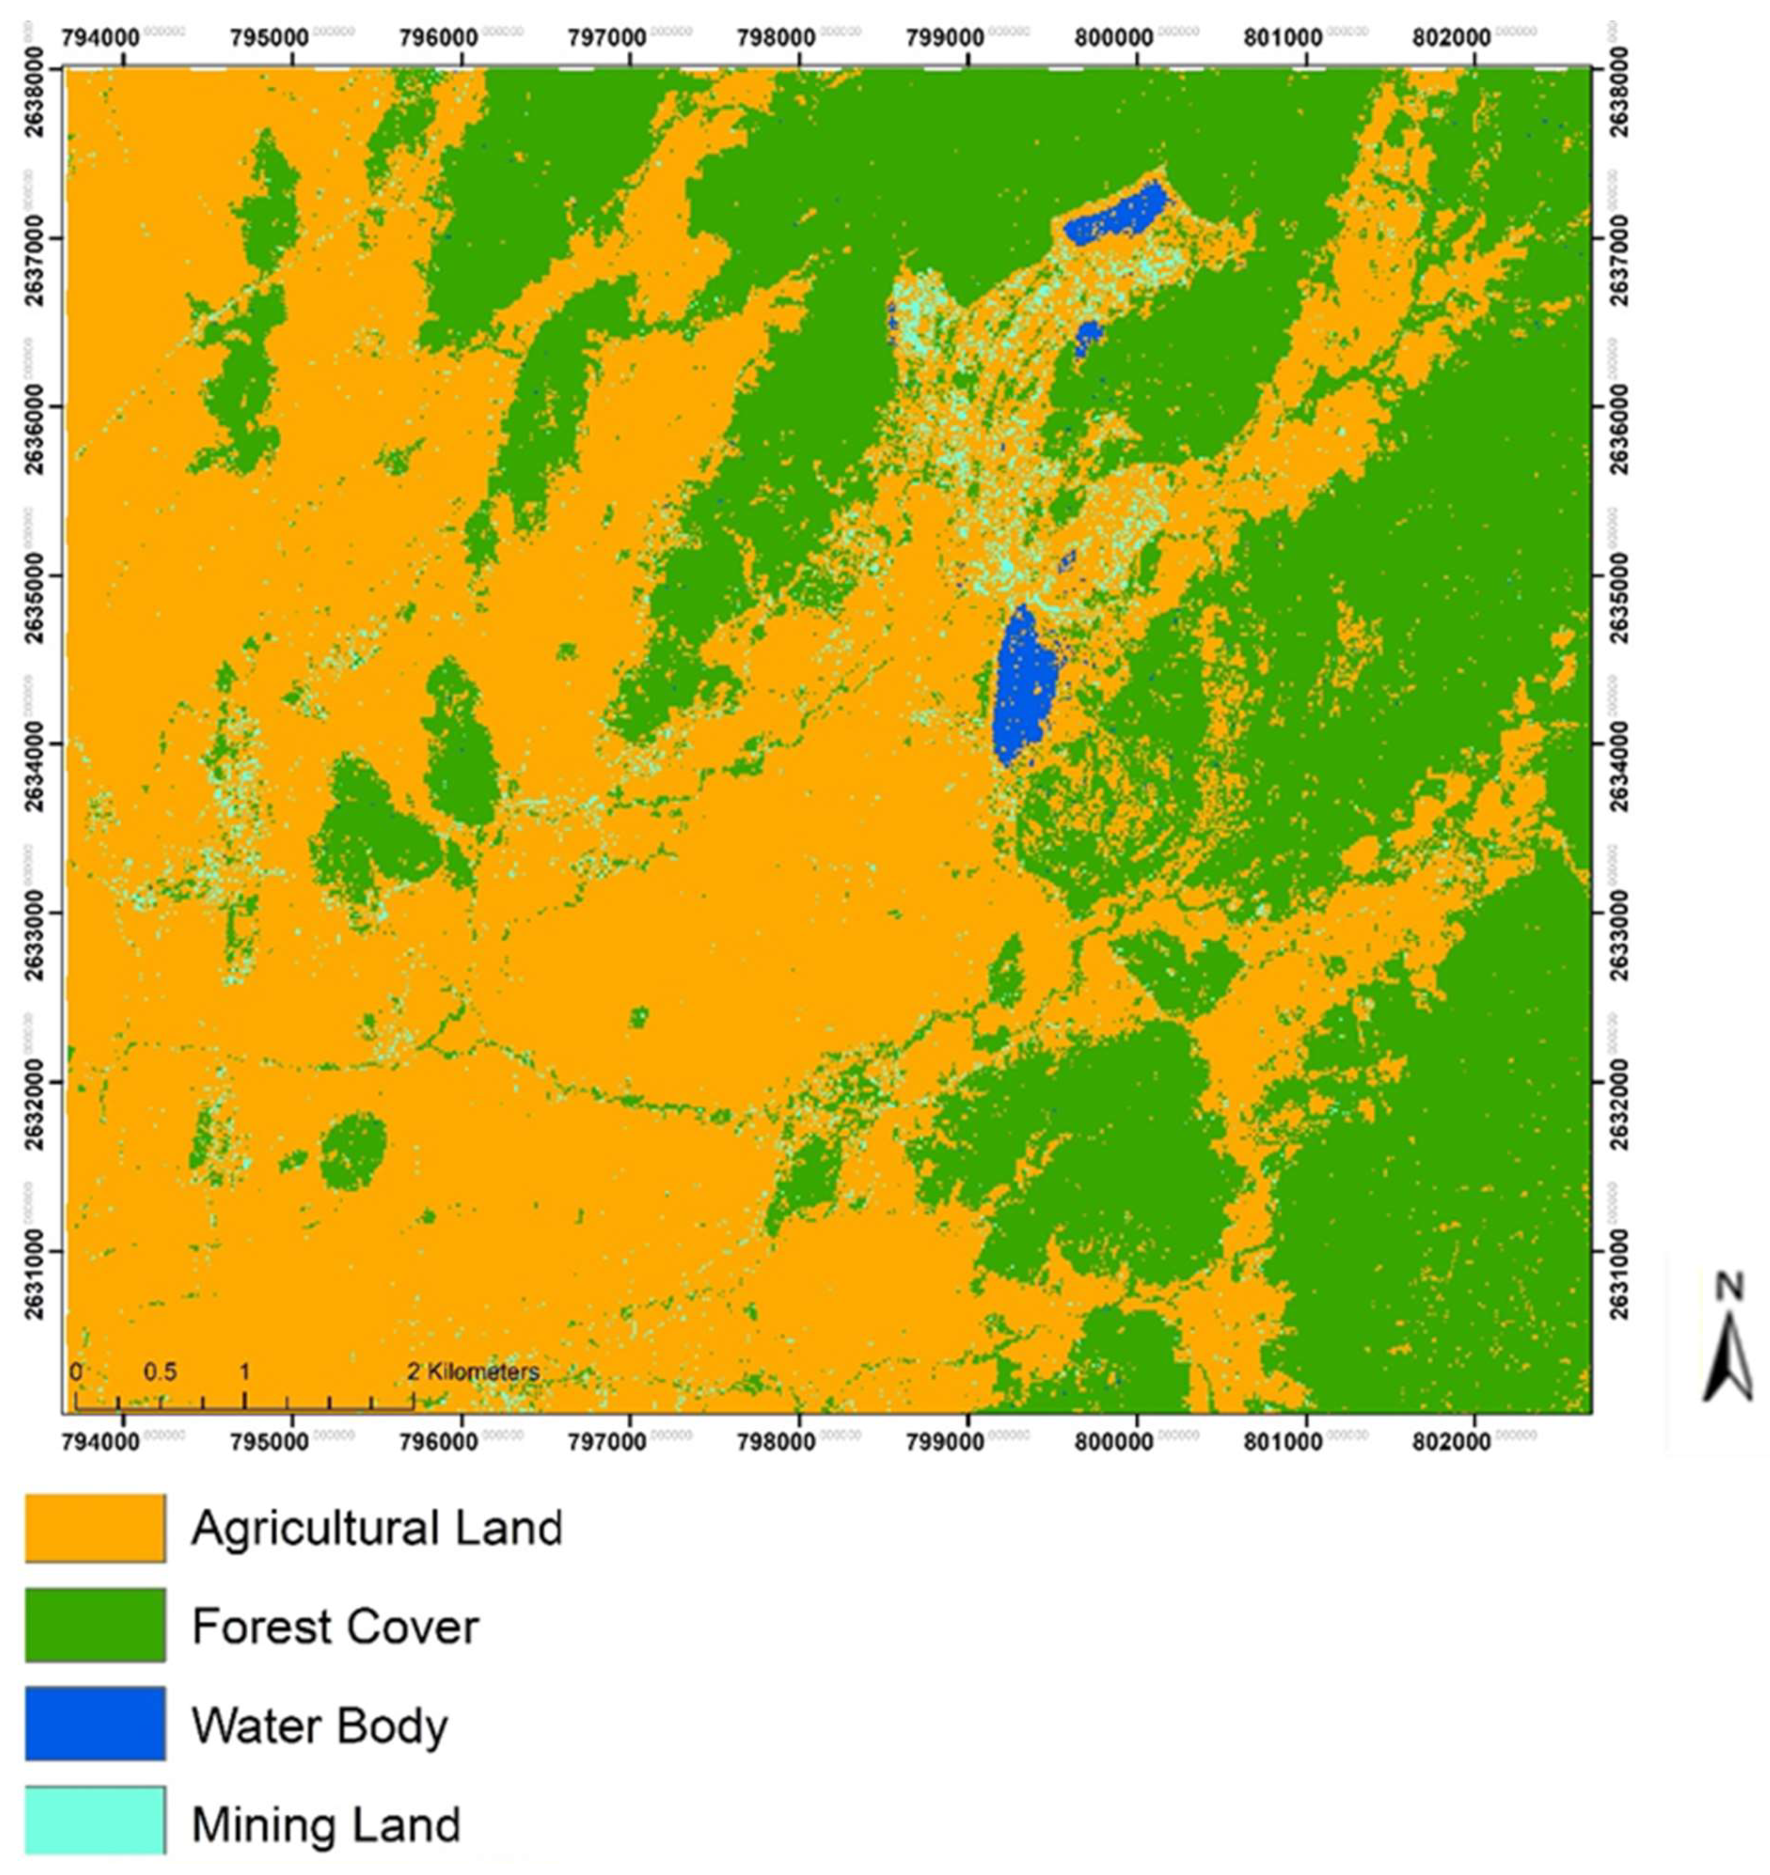
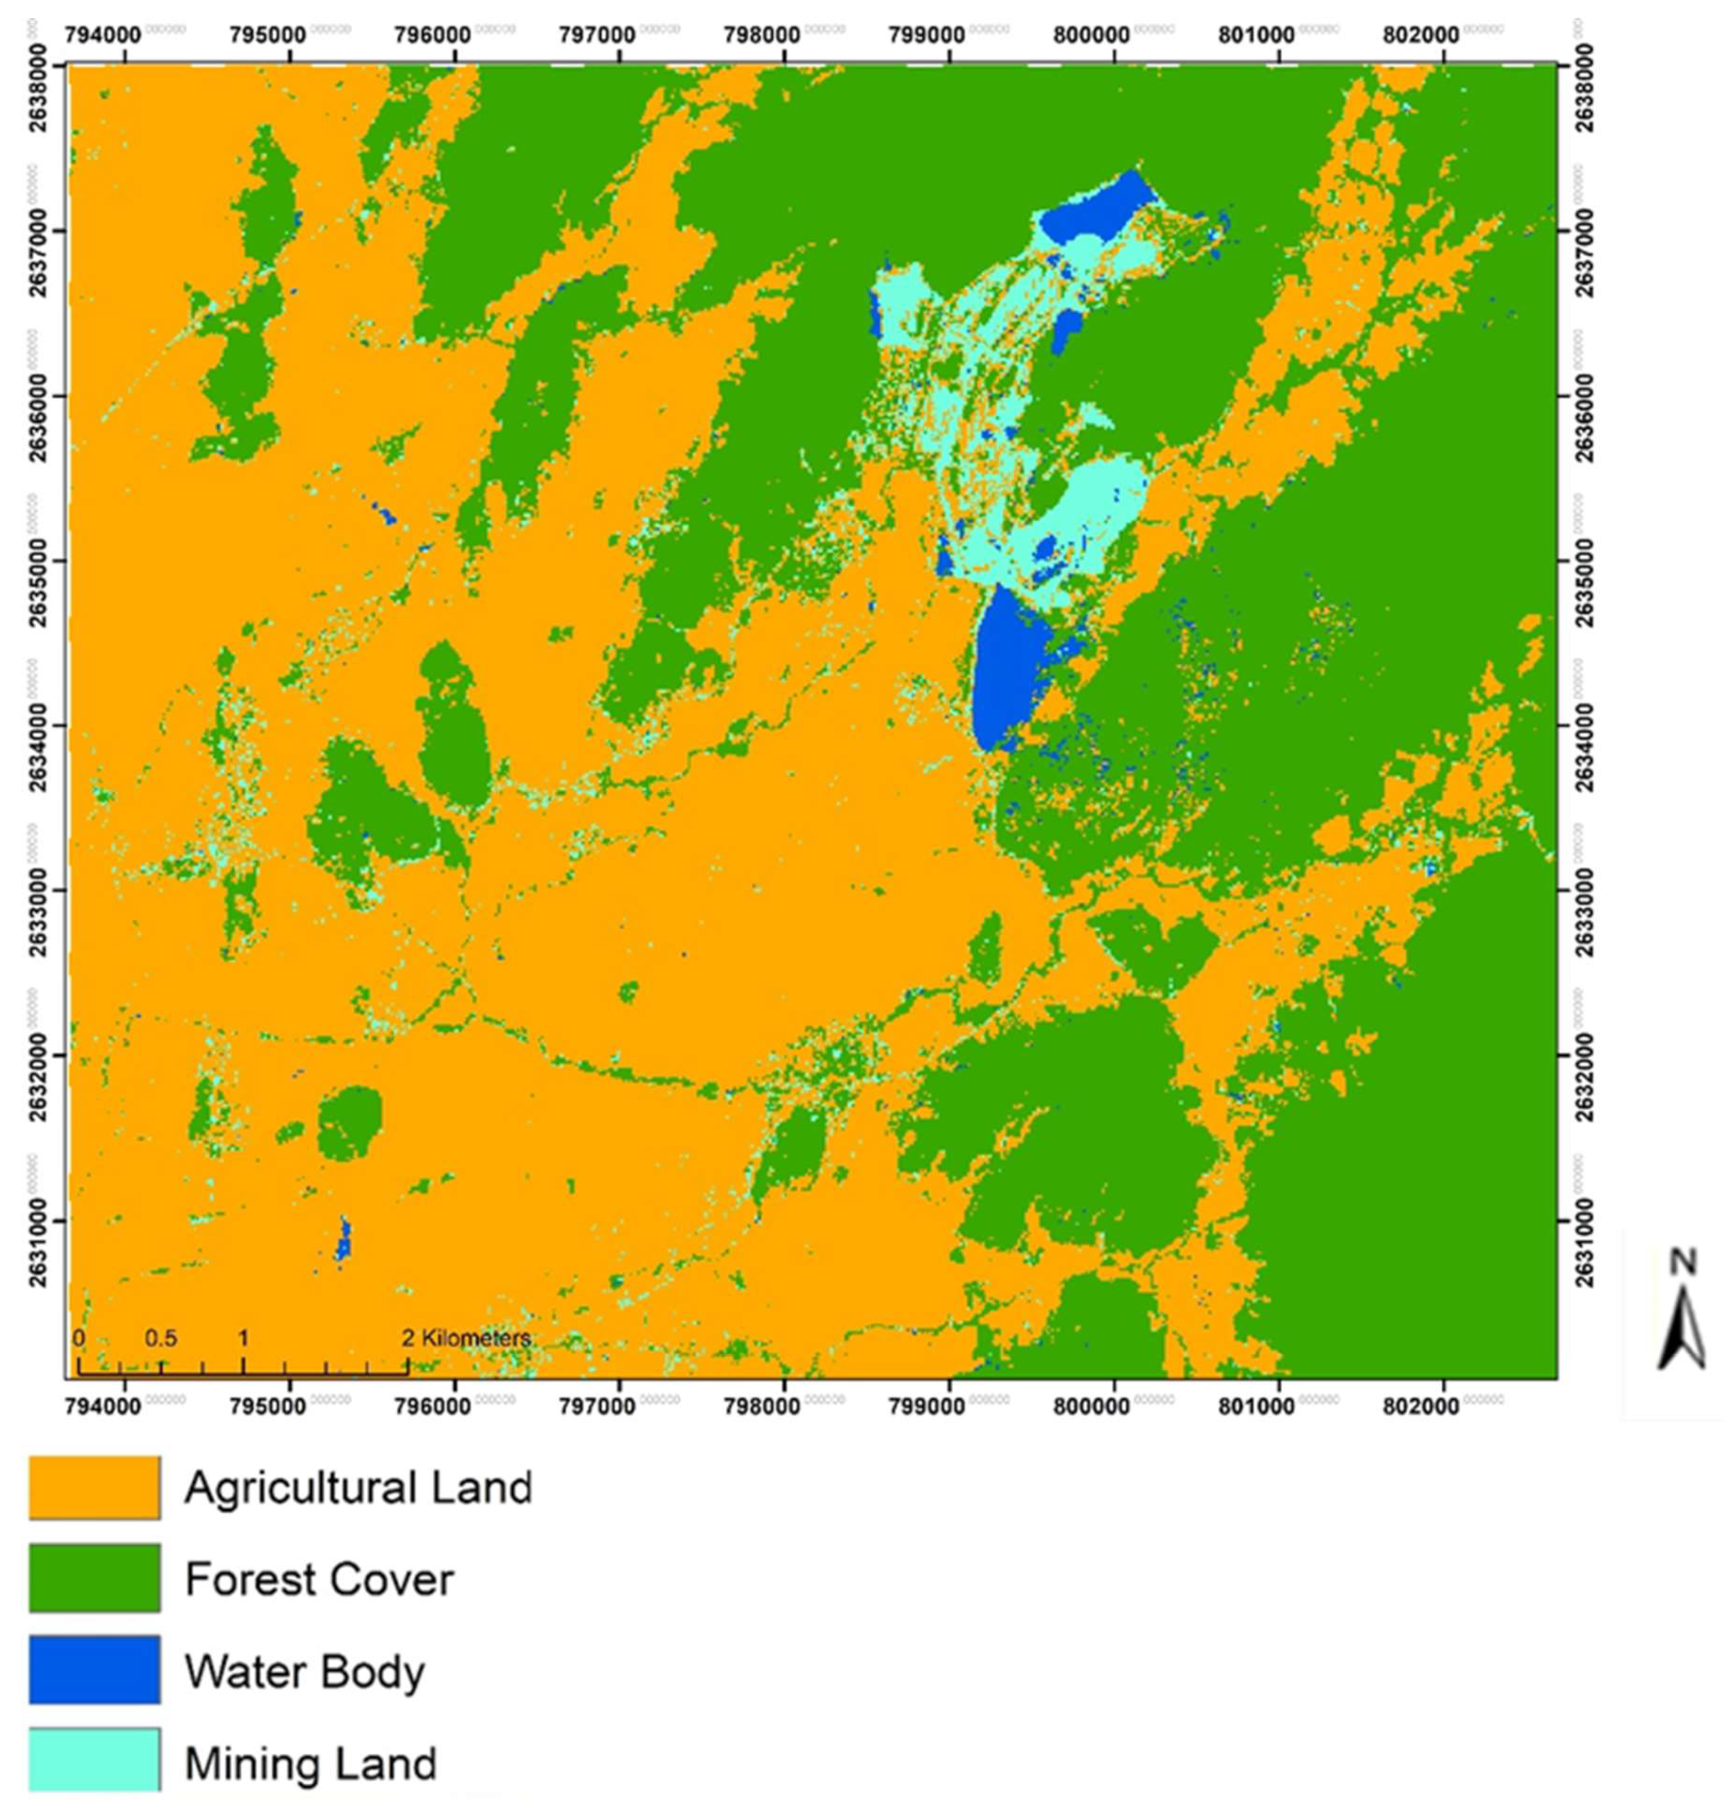
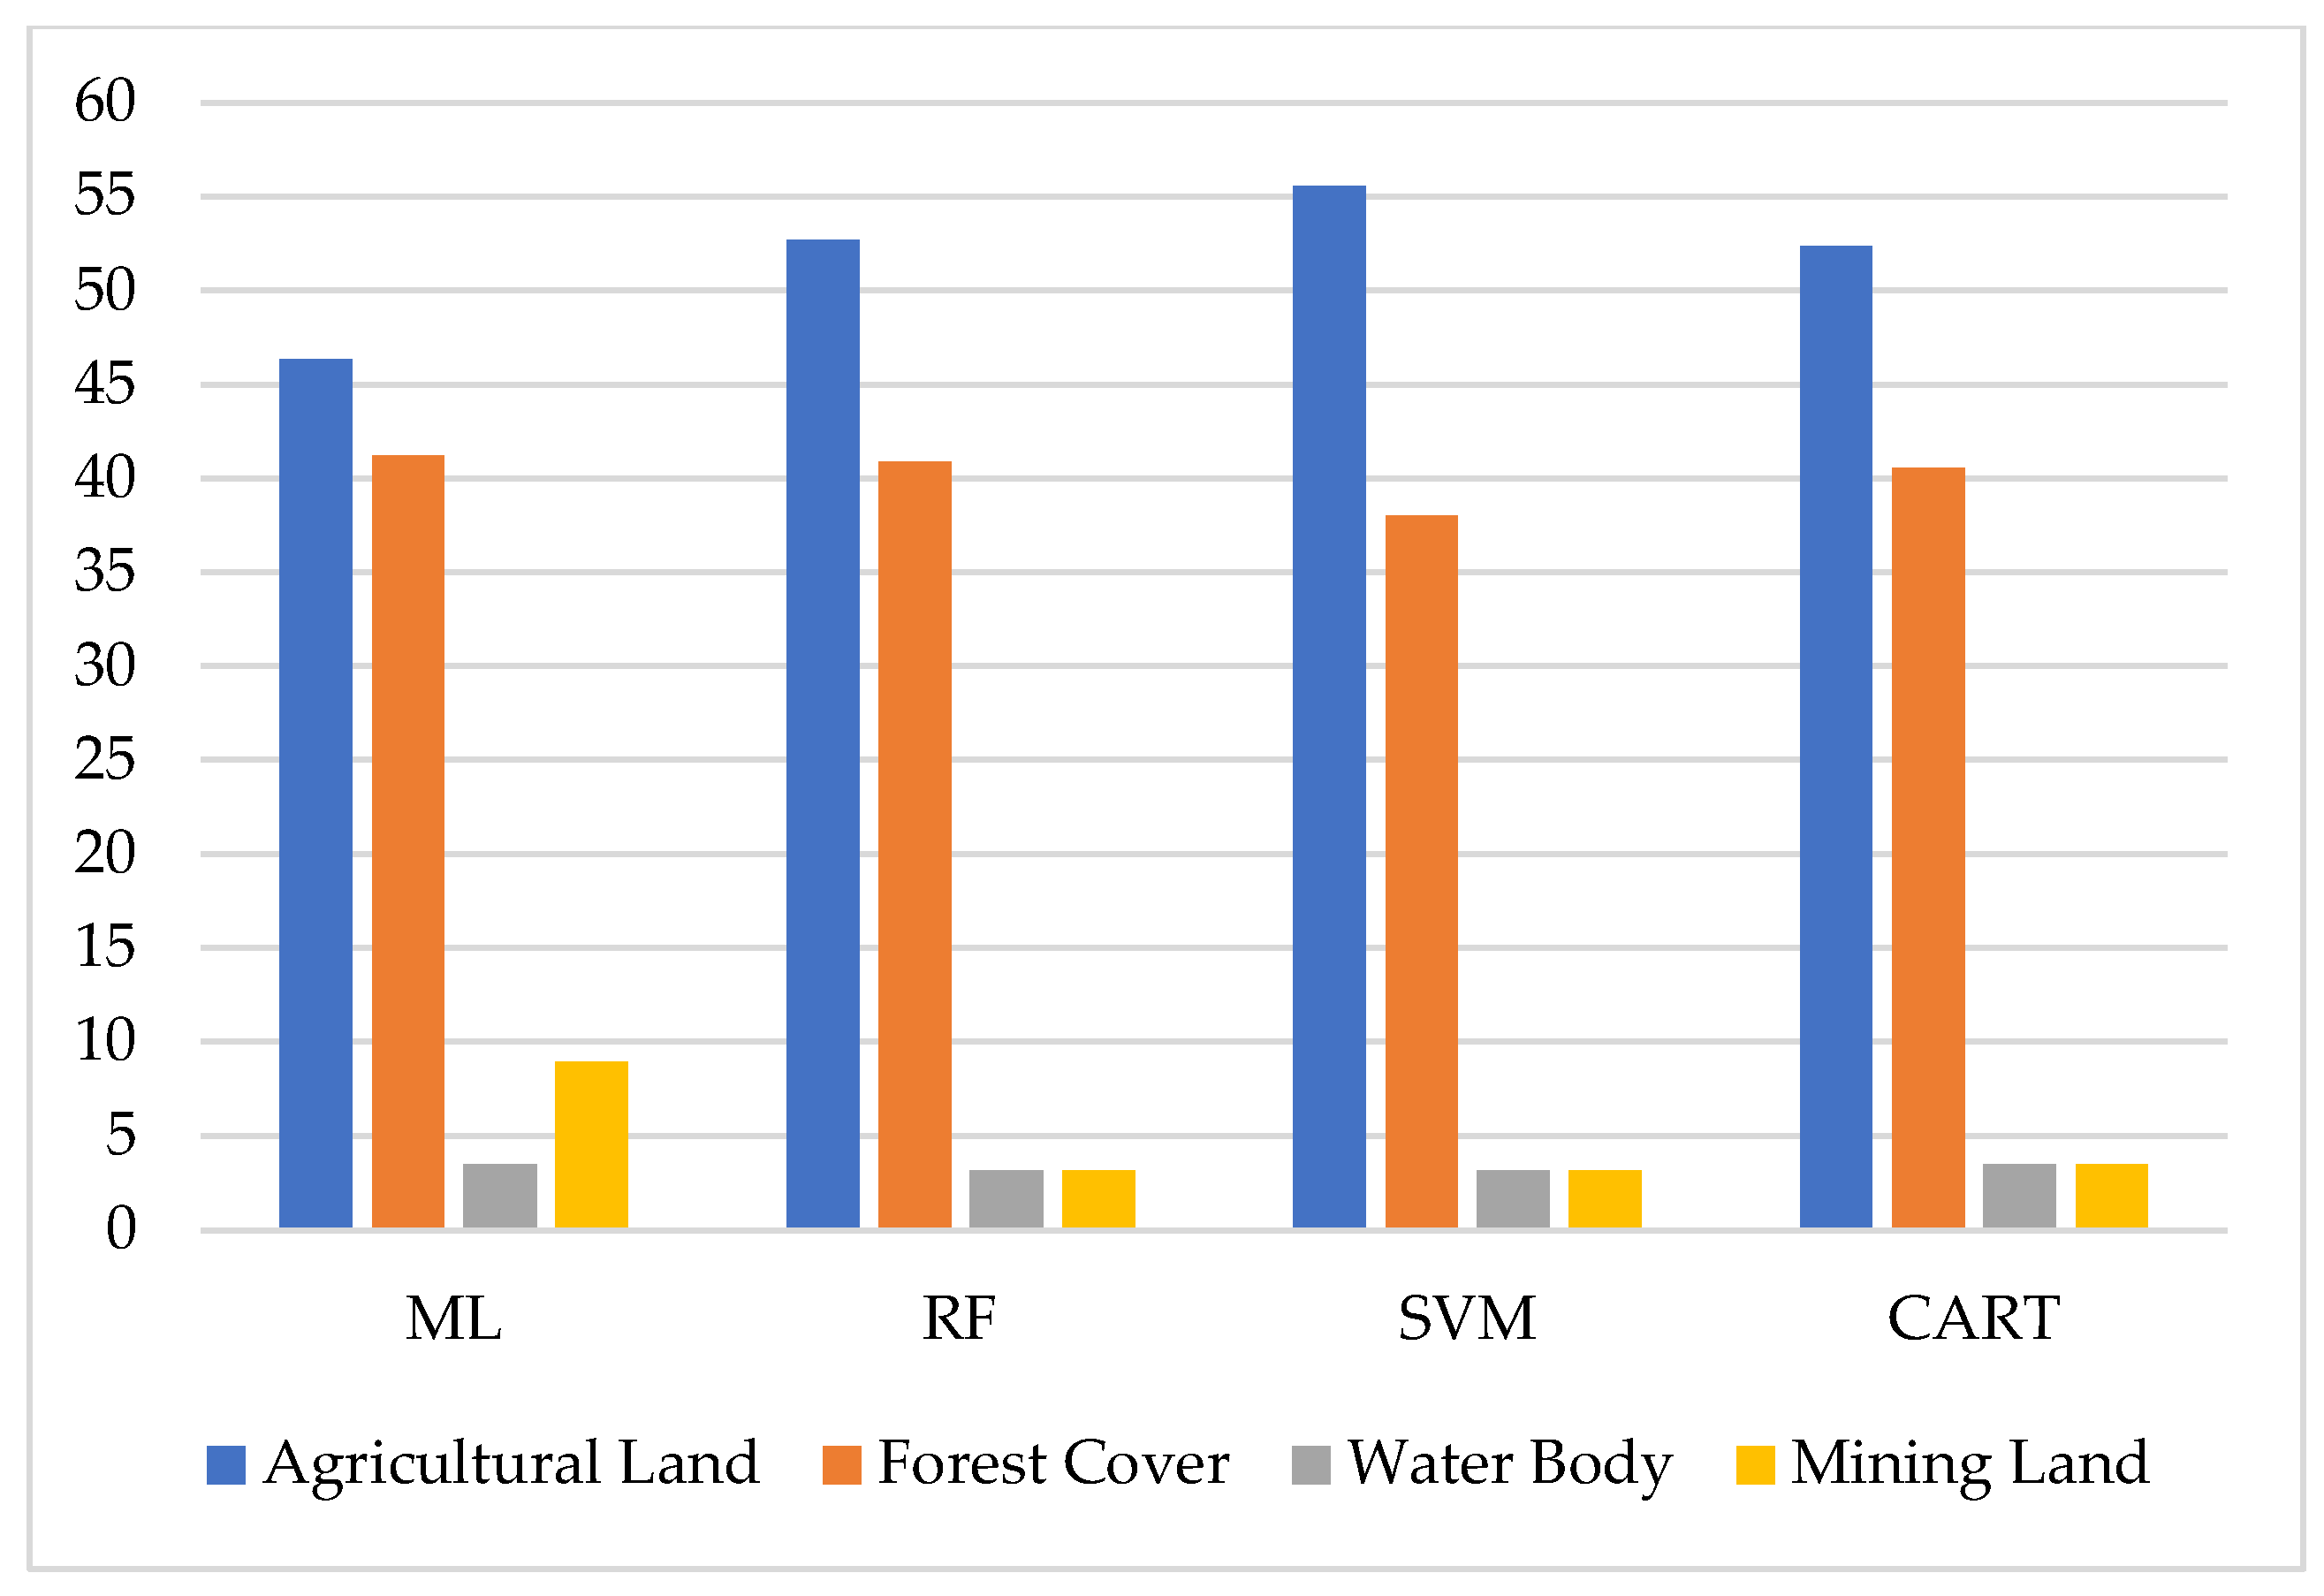
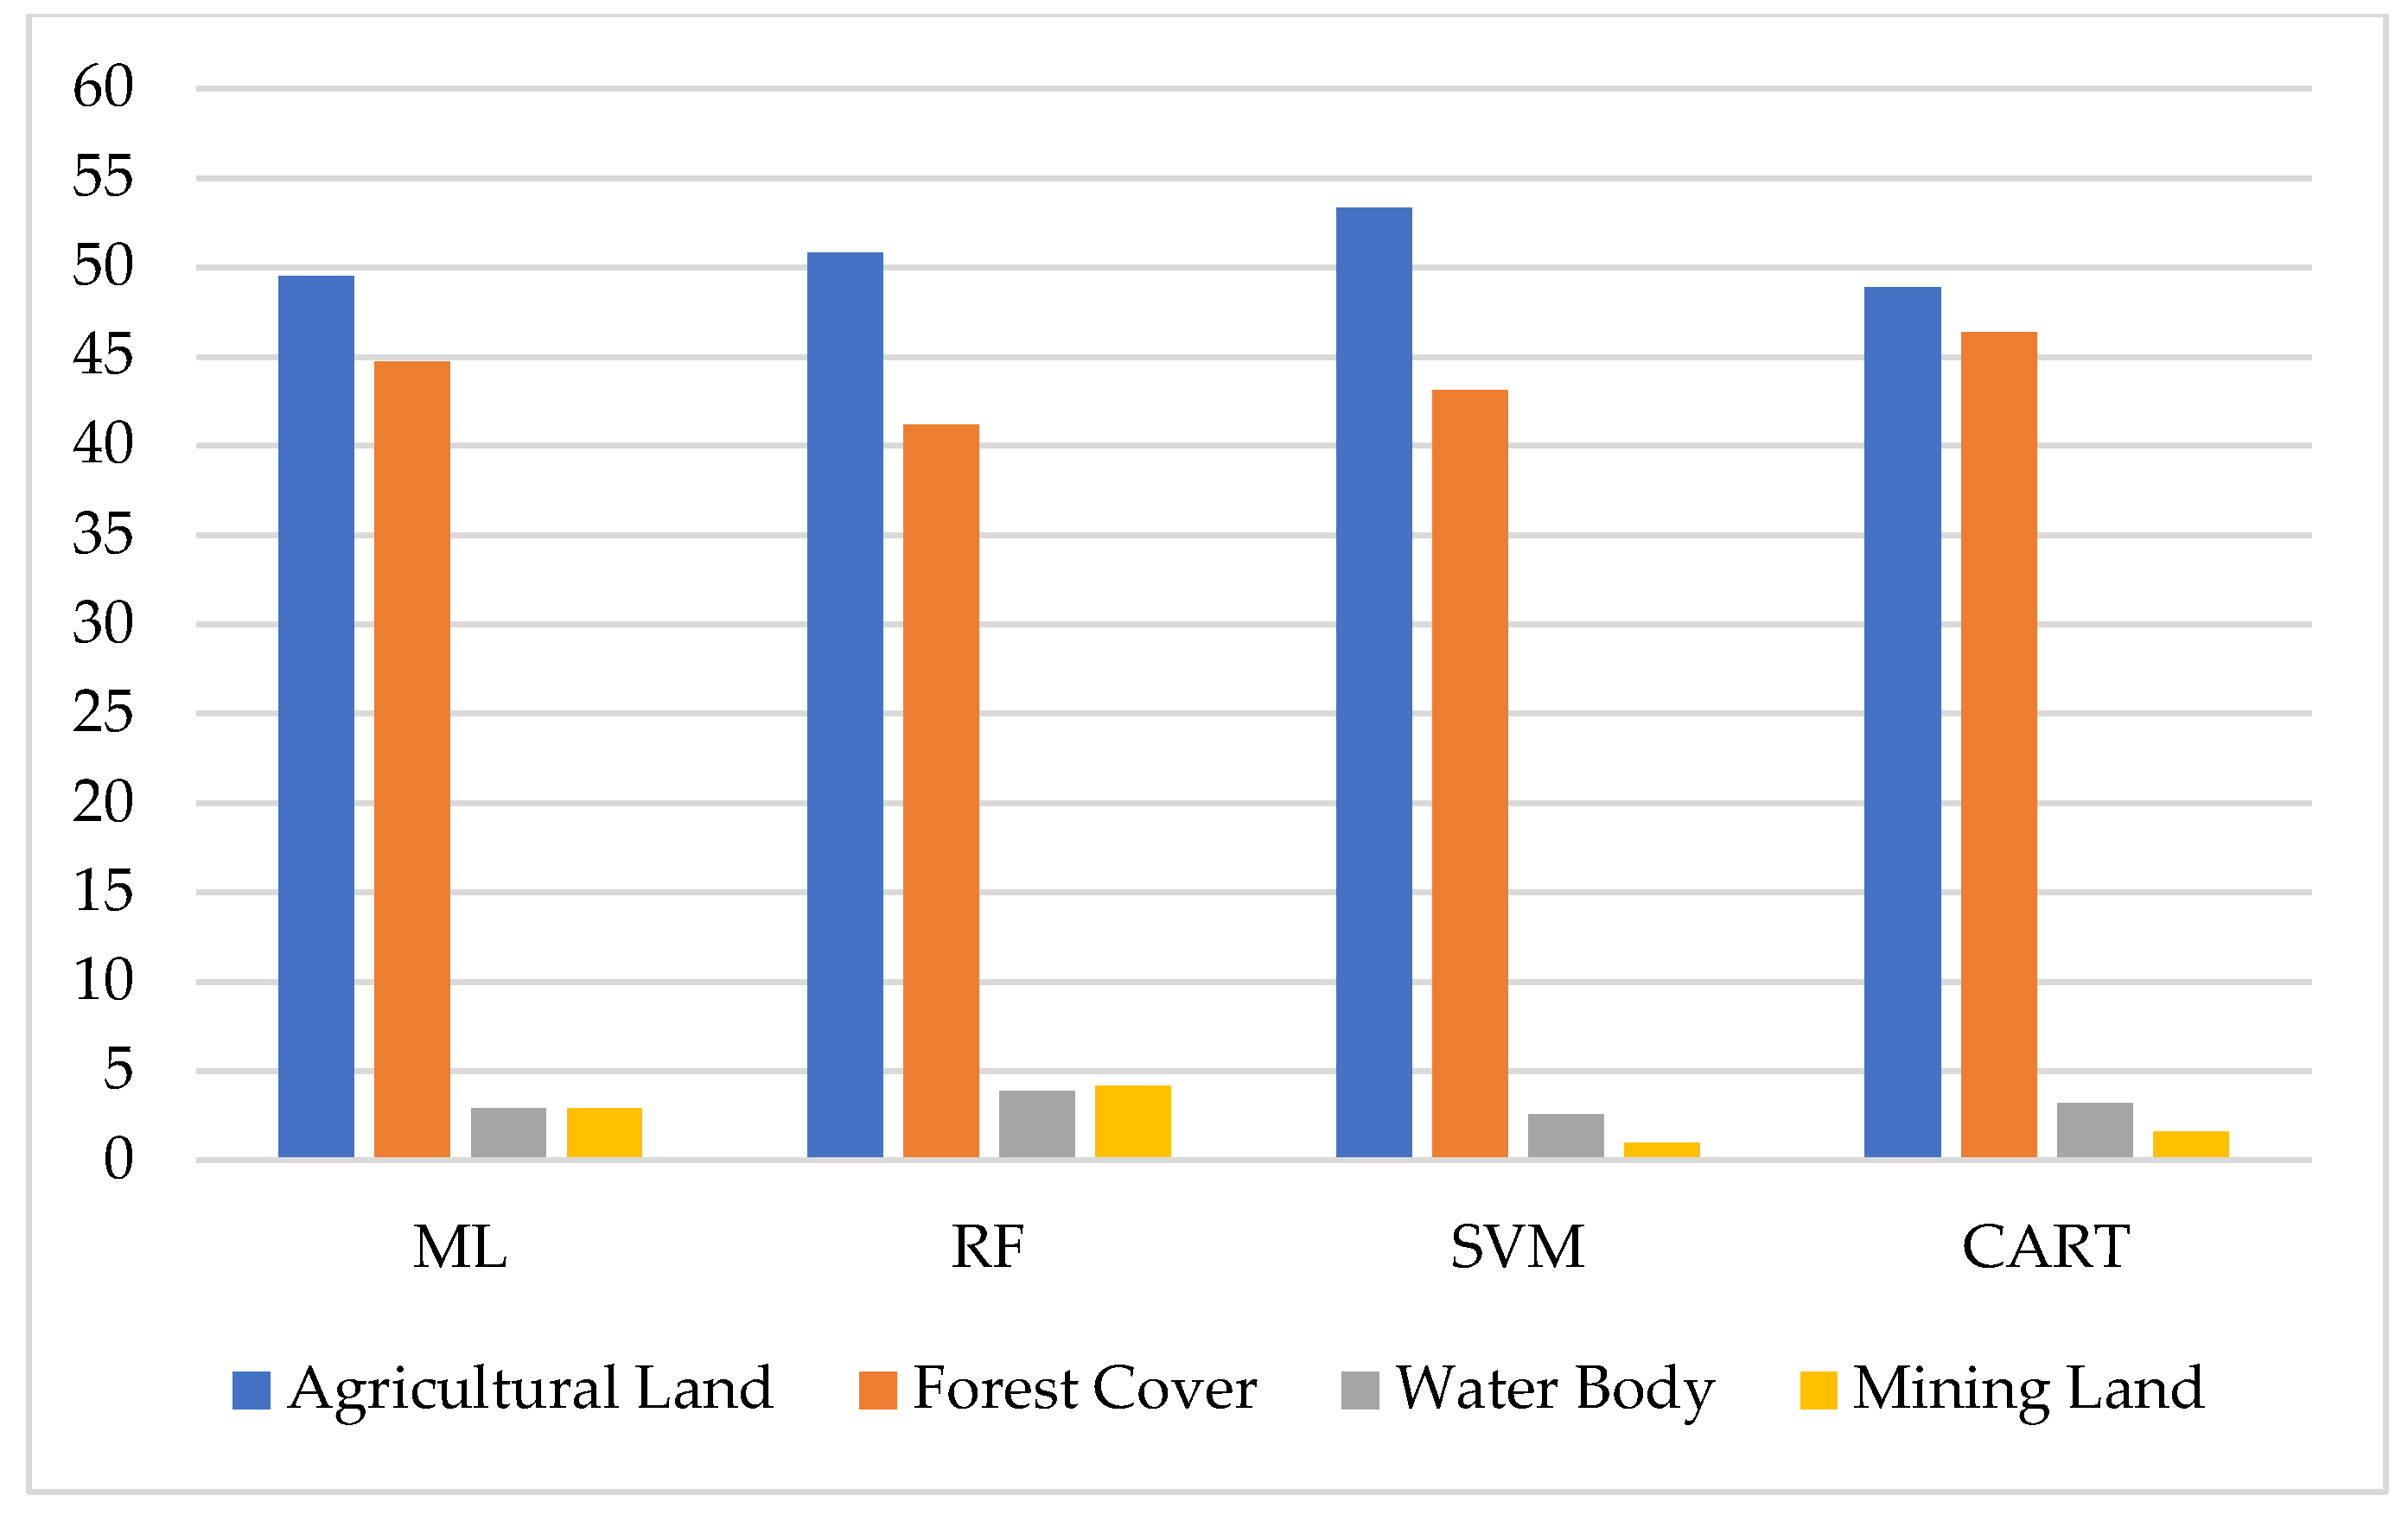
3.2. Comparison of Machine Learning Algorithms

The obtained classification images derived from ML, RF, SVM, and CART classifiers are shown in Figure 4, Figure 5, Figure 6 and Figure 7 while Table 4 includes confusion matrices of four classifiers. Table 5 shows overall accuracy (OA) and kappa values for each algorithm used in this study.
The random forest (RF) algorithm provides the highest accuracy with an overall accuracy of 95.85% (kappa value = 0.93) while support vector machine (SVM) follows RF with 91.69% (kappa value = 0.85). CART takes the third place with an overall accuracy of 91.05% (kappa value = 0.84) and the performance of ML is not good if it is compared to the three other algorithms.
SVM and RF classifiers identified agricultural land more accurately compared to ML and CART with the user’s accuracy (UA) (Figure 3) of 55.59% and 52.71%, respectively. On the other hand, the higher UAs of ML (8.95%) and CART (3.51%) in terms of mining land were also witnessed. Similarly, ML and CART provide higher UAs in identifying forest cover with 41.21% and 40.89%, respectively. Moreover, the performances of ML and CART in identifying the water body are more or less the same with 3.51%.
Figure 8 and Figure 9 show user’s and producer’s accuracies for each classification algorithm. The producer’s accuracy (PA) (Figure 9) of SVM and RF classifiers was also relatively higher than the ML and CART classifiers regarding the classification agricultural land. It is noteworthy that the highest PA in terms of RF was 4.15% for mining land. Similarly, RF gives the highest PA with 3.83% in classifying the water body. must be mentioned that the performances of SVM and CART are bad when identifying mining land as they provide lower PAs compared to the two other classifiers. In the classification of forest cover, CART gives the highest PA with 46.33%.

4. Discussion

4.1. Land Use/Land Cover Change in the Mining District

Over 14% of the forest cover was changed to different land use over the three decades from 1990 to 2020. Agriculture (cultivation) and mining are the key drivers behind the shift in land use and land cover (LULC) in the Kyaukpahto area, according to satellite data analysis. During the last three decades, it is assumed that 11% of the forest cover has been transformed to agricultural land and 3% to mining land as agriculture is the largest driver of deforestation and mining is the second largest in the area. Previously, agriculture has been the most common land use in the study area, but with the introduction of gold mining, the mining and agricultural sectors began to compete for land. Increased land will be needed to store and dispose of mine waste generated during the different phases of ore processing as the intensity of mining in the area increases.
Land use conflicts are more common than ever at all scales. In the study area, mining is a source that leads to conflicts. The Kyaukpahto gold mine uses the surface mining method which requires removal of vegetation and overburden soil. The nature of the mining method results in the loss of agricultural land and forest cover. The transformation of land uses in the area more or less impacts local livelihoods.

4.2. Performance of Four Algorithms

A visual analysis of the classifications (Figure 4, Figure 5, Figure 6 and Figure 7) reveals that the number of classes defined is small, owing to the underutilization of the discrimination offered by the ASTER image, which has 14 spectral bands and a spatial resolution of 15 m in three visible and near-infrared (VNIR) bands. The sensor’s resolution is directly proportional to the variability of the coverage, i.e., more spatial detail in the image means better sensitivity to detect internal variations in a category. To take advantage of the ASTER image, the size of both the training and validation samples should be larger. However, since the aim of the work was to compare the four classifiers, this condition can be overlooked.
The visual examination also allowed us to observe that RF and CART classifications achieved a better differentiation of mining land from other classes. On the other hand, ML overestimated the coverage of mining land while SVM underestimated the class of mining land. ML is the classical parametric classifier which is used during the assumption of the multivariate normal distribution of data [35] whereas SVM provides higher accuracy and a better classification result as its nature is non-parametric [32].
The accuracy assessment is a difficult but necessary phase in the classification and mapping of land cover [36]. Accuracy assessment refers to the examination of a commonly used procedure in order to determine the accuracy of a map or classification [37]. To quantify the map quality, evaluation of various classification algorithms, identification of errors, and accuracy assessment are carried out. Assessing and validating the land cover map provides data quality indicators such as overall accuracy, user accuracy, and producer accuracy. The high accuracy of the assessment indicates that the bias of land cover classification is low. The producer’s accuracy can explain how effectively a certain area can be classified while the user’s accuracy ensures that the image’s classified pixel matches the category on the ground exactly [38].
The results obtained from the classifications and validation samples indicate that the RF and SVM techniques have the fewest errors. They both have a higher number of correctly classified pixels, which can be seen in the confusion matrix and in the results of the Kappa index. However, the underestimation of SVM in identifying mining land is remarkable. Therefore, it is clear that the RF classification is superior.

4.3. Recommendations for Future Studies

The use of satellite data with higher spatial resolution is recommended in future studies for more detailed LULC classification. Moreover, the use of an object-based classification instead of the normal pixel-based should be utilized with the use of high-resolution data. The frequent update of data through mapping of the Kyaukpahto mining district at periodic times will ascertain whether or not land use practices have improved.

5. Conclusions

Historical land use/cover changes were assessed using Landsat data with the RF classifier. Beside mining activities, traditional agricultural practices are also a large contributor to the transformation of the land use/cover of the mining district. As a result, it is necessary to consider the combined effects of both industries in this mining district.
Four classification algorithms were compared using ASTER data as inputs. The classification experiments were conducted in the mining district in which mining land was included as a small but significant class. The RF achieved a higher overall accuracy and Kappa coefficient compared to the ML, SVM, and CART algorithms. Although SVM takes the second place in the accuracy of classification in the experiment, it does not perform well when discriminating the mining land. On the other hand, the ML’s overestimation of mining land affects the overall accuracy of classification. The RF obtained an overall accuracy of 95.85%, proving that this classifier is highly reliable. Moreover, its accuracy was relatively higher than ML, SVM, and CART. Due to these findings obtained from our study, we recommend RF as a suitable option for precise classification of land cover, particularly in the mining district.

Author Contributions

Acquisition of data, analysis and interpretation of data, and drafting and revision of manuscript—T.K.O. and N.A.; Analysis and interpretation of data, and critical revision—N.A.; Critical revision and editorial supervising—N.A., S.S., A.U., U.C., W.N. All authors have read and agreed to the published version of the manuscript.

Funding

This paper is from the first author’s PhD study which is financially supported by the Mahidol-Norway Capacity Building Initiative for ASEAN (CBIA) scholarship program.

Institutional Review Board Statement

The study was conducted according to the guidelines of the Declaration of Helsinki and approved by Mahidol University Central Institutional Review Board (MU-CIRB) (COA No. MU-CIRB 2018/182.1210) (Protocol No.: MU-CIRB 2018/086.0504).

Informed Consent Statement

Not applicable.

Data Availability Statement

Not applicable.

Acknowledgments

We thank Parkorn Suwanich who provided the valuable comments and suggestions. Moreover, our deepest gratitude goes to Nathsuda Pumijumnong, Program Director in Doctor of Philosophy Program in Environment and Resource Studies (International Program), Mahidol University and program committee members for their consistent encouragement to complete the study. As this paper is the output of the first author’s PhD study, he is grateful towards the Mahidol-Norway Capacity Building Initiative for ASEAN (CBIA) program for awarding scholarship.

Conflicts of Interest

The authors declare no conflict of interest.

References

  1. Lam, N.S.N. Methodologies for mapping land cover/land use and its change. In Advances in Land Remote Sensing: System, Modeling, Inversion and Application; Liang, S., Ed.; Springer: Dordrecht, The Netherlands, 2008; pp. 341–367. [Google Scholar]
  2. Rimal, B.; Keshtkar, H.; Sharma, R.; Stork, N.; Rijal, S.; Kunwar, R. Simulating urban expansion in a rapidly changing landscape in eastern Tarai, Nepal. Environ. Monitor. Assess. 2019, 191, 255. [Google Scholar] [CrossRef] [PubMed]
  3. Cohen, W.B.; Goward, S.N. Landsat’s role in ecological applications of remote sensing. BioScience 2004, 54, 535–545. [Google Scholar] [CrossRef]
  4. Wulder, M.A.; Masek, J.G.; Cohen, W.B.; Loveland, T.R.; Woodcock, C.E. Opening the archive: How free data has enabled the science and monitoring promise of Landsat. Remote Sens. Environ. 2012, 122, 2–10. [Google Scholar] [CrossRef]
  5. Lu, D.; Weng, Q. A survey of image classification methods and techniques for improving classification performance. Inter. J. Remote Sens. 2007, 28, 823–870. [Google Scholar] [CrossRef]
  6. Friedl, M.A.; Brodley, C.E. Decision tree classification of land cover from remotely sensed data. Remote Sens. Environ. 1997, 61, 399–409. [Google Scholar] [CrossRef]
  7. Waske, B.; Braun, M. Classifier ensembles for land cover mapping using multitemporal SAR imagery. ISPRS J. Photogramm. Remote Sens. 2009, 64, 450–457. [Google Scholar] [CrossRef]
  8. Li, C.; Wang, J.; Wang, L.; Hu, L.; Gong, P. Comparison of classification algorithms and training sample sizes in urban land classification with Landsat Thematic Mapper imagery. Remote Sens. 2014, 6, 964–983. [Google Scholar] [CrossRef]
  9. Shao, Y.; Lunetta, R.S. Comparison of support vector machine, neural network, and CART algorithms for the land-cover classification using limited training data points. ISPRS J. Photogramm. Remote Sens. 2012, 70, 78–87. [Google Scholar] [CrossRef]
  10. Thanh Noi, P.; Kappas, M. Comparison of Random Forest, k-Nearest Neighbor, and Support Vector Machine Classifiers for Land Cover Classification Using Sentinel-2 Imagery. Sensors 2018, 18, 18. [Google Scholar] [CrossRef]
  11. Dixon, B.; Candade, N. Multispectral landuse classification using neural networks and support vector machines: One or the other, or both? Inter. J. Remote Sens. 2008, 29, 1185–1206. [Google Scholar] [CrossRef]
  12. Huang, C.; Davis, L.S.; Townshend, J.R.G. An assessment of support vector machines for land cover classification. Inter. J. Remote Sens. 2002, 23, 725–749. [Google Scholar] [CrossRef]
  13. Melgani, F.; Bruzzone, L. Classification of hyperspectral remote sensing images with support vector machines. IEEE Trans. Geosc. Remote Sens. 2004, 42, 1778–1790. [Google Scholar] [CrossRef]
  14. Pal, M.; Mather, P.M. Support vector machines for classification in remote sensing. Inter. J. Remote Sens. 2005, 26, 1007–1011. [Google Scholar] [CrossRef]
  15. Adam, E.; Mutanga, O.; Odindi, J.; Abdel-Rahman, E.M. Land-use/cover classification in a heterogeneous coastal landscape using RapidEye imagery: Evaluating the performance of random forest and support vector machines classifiers. Inter. J. Remote Sens. 2014, 35, 3440–3458. [Google Scholar] [CrossRef]
  16. Ghosh, A.; Joshi, P.K. A comparison of selected classification algorithms for mapping bamboo patches in lower Gangetic plains using very high resolution WorldView 2 imagery. Int. J. Appl. Earth Obs. Geoinf. 2014, 26, 298–311. [Google Scholar] [CrossRef]
  17. Pouteaua, R.; Collinb, A.; Stolla, B.A. A Comparison of Machine Learning Algorithms for Classification of Tropical Ecosystems Observed by Multiple Sensors at Multiple Scales. In Proceedings of the 34th International Symposium on Remote Sensing of Environment, Sydney, Australia, 11–15 April 2011; Available online: https://www.isprs.org/proceedings/2011/ISRSE-34/211104015Final00913.pdf (accessed on 16 June 2022).
  18. Heydari, S.S.; Mountrakis, G. Effect of classifier selection, reference sample size, reference class distribution and scene heterogeneity in per-pixel classification accuracy using 26 Landsat sites. Remote Sens. Environ. 2018, 204, 648–658. [Google Scholar] [CrossRef]
  19. Lizarazo, I. SVM-based segmentation and classification of remotely sensed data. Inter. J. Remote Sens. 2008, 29, 7277–7283. [Google Scholar] [CrossRef]
  20. Tso, B.; Mather, P. Classification Methods for Remotely Sensed Data; CRC Press: Boca Raton, FL, USA, 2009. [Google Scholar]
  21. Pal, M.; Mather, P.M. An assessment of the effectiveness of decision tree methods for land cover classification. Remote Sens. Environ. 2003, 86, 554–565. [Google Scholar] [CrossRef]
  22. Li, J.; Zipper, C.E.; Donovan, P.F.; Wynne, R.H.; Oliphant, A.J. Reconstructing disturbance history for an intensively mined region by time-series analysis of Landsat imagery. Environ. Monit. Assess. 2015, 187, 557. [Google Scholar] [CrossRef] [PubMed]
  23. Kamga, M.A.; Nguemhe Fils, S.C.; Ayodele, M.O.; Olatubara, C.O.; Nzali, S.; Adenikinju, A.; Khalifa, M. Evaluation of land use/land cover changes due to gold mining activities from 1987 to 2017 using landsat imagery, East Cameroon. GeoJournal 2020, 85, 1097–1114. [Google Scholar] [CrossRef]
  24. Mi, J.; Yang, Y.; Zhang, S.; An, S.; Hou, H.; Hua, Y.; Chen, F. Tracking the Land Use/Land Cover Change in an Area with Underground Mining and Reforestation via Continuous Landsat Classification. Remote Sens. 2019, 11, 1719. [Google Scholar] [CrossRef]
  25. Jensen, J.R. Introductory Digital Image Processing: A Remote Sensing Perspective, 2nd ed.; Prentice-Hall: Upper Saddle River, NJ, USA, 1996. [Google Scholar]
  26. Jensen, J.R. Introductory Digital Image Processing: A Remote Sensing Perspective, 3rd ed.; Prentice-Hall: Upper Saddle River, NJ, USA, 2005. [Google Scholar]
  27. Jonathan, M.; Meirelles, M.S.P.; Berroir, J.-P.; Herlin, I. Regional scale land use/landcover classification using temporal series of MODIS data. In Proceedings of the ISPRS Commission VII Mid-Term Symposium “Remote Sensing: From Pixels to Processes”, Enschede, The Netherlands, 8–11 May 2006; pp. 522–527. [Google Scholar]
  28. Manandhar, R.; Odeh, I.O.A.; Ancev, T. Improving the accuracy of land use and land cover classification of Landsat data using post-classification enhancement. Remote Sens. 2009, 1, 330–344. [Google Scholar] [CrossRef]
  29. Saha, S.K.; Kudrat, M. Selection of spectral band combination for land cover/land use classification using a brightness value overlapping index (BVOI). J. Indian Soc. Remote Sens. 1991, 19, 141–147. [Google Scholar] [CrossRef]
  30. Breiman, L. Random forests. Mach. Learn. 2001, 45, 5–32. [Google Scholar] [CrossRef]
  31. Abdullah, A.Y.M.; Masrur, A.; Adnan, M.S.G.; Baky, M.; Al, A.; Hassan, Q.K.; Dewan, A. Spatio-temporal patterns of land use/land cover change in the heterogeneous coastal region of Bangladesh between 1990 and 2017. Remote Sens. 2019, 11, 790. [Google Scholar] [CrossRef]
  32. Vapnik, V.N.; Chervonenkis, A.Y. On the uniform convergence of relative frequencies of events to their probabilities. In Theory of Probability and Its Applications; Springer: Cham, Switzerland, 1971; Volume 16, pp. 264–280. [Google Scholar]
  33. Burges, C.J. A tutorial on support vector machines for pattern recognition. Data Min. Knowl. Discov. 1998, 2, 121–167. [Google Scholar] [CrossRef]
  34. Breiman, L.; Friedman, J.H.; Olshen, R.A.; Stone, C.J. Classification and Regression Trees; Wadsworth & Brooks: Monterey, CA, USA, 1984. [Google Scholar]
  35. Kavzoglu, T.; Colkesen, I. A kernel functions analysis for support vector machines for land cover classification. Int. J. Appl. Earth Obs. Geoinf. 2009, 11, 352–359. [Google Scholar] [CrossRef]
  36. Campbell, J.B. Introduction to Remote Sensing; The Guilford Press: New York, NY, USA, 1996. [Google Scholar]
  37. Foody, G.M. Status of land cover classification accuracy assessment. Remote Sens. Environ. 2002, 80, 185–201. [Google Scholar] [CrossRef]
  38. Congalton, R.G. A review of assessing the accuracy of classifications of remotely sensed data. Remote Sens. Environ. 1991, 37, 35–46. [Google Scholar] [CrossRef]
Figure 1. Location map of the study area.
Sustainability 14 10754 g001
Figure 2. Land use/cover maps derived from Landsat data.
Sustainability 14 10754 g002
Figure 3. Land use/cover maps derived from ASTER data.
Sustainability 14 10754 g003
Figure 4. Resulting image from the maximum likelihood classification.
Sustainability 14 10754 g004
Figure 5. Resulting image from the random forest classification.
Sustainability 14 10754 g005
Figure 6. Resulting image from the SVM classification.
Sustainability 14 10754 g006
Figure 7. Resulting image from the CART classification.
Sustainability 14 10754 g007
Figure 8. User’s accuracy assessment (in percentage).
Sustainability 14 10754 g008
Figure 9. Producer’s accuracy assessment (in percentage).
Sustainability 14 10754 g009
Table 1. The training and testing samples for each land use/cover class.
Land Use/Cover ClassTraining SamplesTesting Samples
Agricultural Land258112
Forest Cover235101
Water Body8235
Mining Land15065
Table 2. Land use/cover area coverage of each class.
Land Use/Cover Type1990199520002005201020152020
km2%km2%km2%km2%km2%km2%km2%
Agricultural Land48.937.148.136.550.738.456.843.050.938.651.939.359.645.2
Forest Cover50.037.850.838.547.435.941.931.745.834.744.233.536.127.3
Water Body0.40.30.70.61.20.90.20.20.60.40.70.50.70.5
Mining Land0.70.50.30.30.70.51.10.82.72.13.22.43.62.7
Table 3. Land use/cover change in percentage (%).
Land Use/Cover Type1990–19951995–20002000–20052005–20102010–20152015–20201990–2020
Agricultural Land−0.82.56.1−5.91.07.710.7
Forest Cover0.8−3.4−5.54.0−1.6−8.1−13.9
Water Body0.30.5−1.00.30.10.00.2
Mining Land−0.30.40.41.60.50.42.9
Table 4. Confusion matrices for each classification algorithm.
Machine Learning
Algorithms
Agricultural LandForest CoverWater BodyMining Land
Maximum likelihood classificationAgricultural Land139501
Forest Cover012810
Water Body2180
Mining Land14608
Random forest
classification
Agricultural Land157503
Forest Cover112421
Water Body00100
Mining Land1009
SVM classificationAgricultural Land1591401
Forest Cover111800
Water Body1180
Mining Land6202
CART classificationAgricultural Land1471700
Forest Cover212410
Water Body0290
Mining Land4205
Table 5. Overall accuracy and kappa values of for each algorithm.
AlgorithmOverall Accuracy (%)Kappa Value
Maximum Likelihood90.420.84
Random Forest95.850.93
Support Vector Machine91.690.85
Classification and Regression Trees91.050.84
Publisher’s Note: MDPI stays neutral with regard to jurisdictional claims in published maps and institutional affiliations.

