Article

Evaluation of Soil Quality in a Composite Pecan Orchard Agroforestry System Based on the Smallest Data Set

1
Department of Forest, College of Forestry and Landscape Architecture, Anhui Agricultural University, Hefei 230036, China
2
Fuyang Xinfeng Seed Industry Co., Ltd., Fuyang 236000, China
*
Authors to whom correspondence should be addressed.
These authors contributed equally to this work.
Sustainability 2022, 14(17), 10665; https://doi.org/10.3390/su141710665
Submission received: 5 August 2022 / Revised: 21 August 2022 / Accepted: 23 August 2022 / Published: 26 August 2022

Abstract

:
Agroforestry not only takes into account the use of land for forestry and agriculture but can also improve the efficacy of utilized above- and belowground resources, which have always garnered widespread attention. The objective of this study is to evaluate the quality of pecan orchard soil following the implementation of agroforestry. Consequently, 15 indices were selected for a principal component analysis (PCA), which was then combined with the norm value of each index and the correlation coefficients between indices to establish a minimum data set (MDS). A comprehensive index model was used to calculate the soil quality index (SQI) of the total data set (TDS) and MDS (SQI-TDS and SQI-MDS, respectively), and a linear regression of the two was performed. The results revealed that the MDS indices for the evaluation of soil fertility included the pH, electrical conductivity value (EC), bulk density (BD), available potassium (AK), total nitrogen (TN), magnesium (Mg), and the index screening and filtering rates attained 60%. The Soil Quality Index (SQI-MDS) of the four planting patterns, sorted from largest to smallest, were: PPS (0.573) > PPH (0.519) > PPL (0.355) > CK (0.315). BD and AK were the main factors that affected the quality of hickory orchard soils. The agroforestry composite system improved the availability of nutrients and soil quality. Thus, the promotion of understory intercropping and appropriate increases in potassium fertilizers for plantations are recommended.

1. Introduction

Soil is a critical component of terrestrial ecosystems that operates at the intersection of the atmosphere, lithosphere, hydrosphere, and biosphere, which serves as an essential substrate for the regulation of nutrient absorption, material decomposition, and energy flows [1,2]. It plays an invaluable role in the maintenance of energy security and the protection of biodiversity [3]. The capacity to maintain crop production levels while improving environmental quality within specific boundaries is referred to as soil quality [4]. Soil quality is defined as the ability to ensure the sustainability of the soil environment and biosphere, which is a comprehensive reflection of soil characteristics based on its fertility [5,6].
As a tool for assessing the impacts of management measures and human activities such as land-use changes, soil quality assessments have attracted widespread attention [5,7,8]. They can assist with defining the status and dynamics of soil quality in a timely manner towards achieving the sustainable management of land resources [9]. Topsoil (0 to 20 cm) is a reliable indicator of the health of the soil as it is prone to disturbances. It is rich in important chemical elements such as C, N, P, and K, and is where soil microbes are most active [10,11]. Anthropogenic land management activities induce changes in physical and chemical soil properties, which ultimately impact its quality [12]. Poor soil quality is primarily manifested through decreased organic matter, lower permeability, reduced microbial diversity, increased bulk weight, the destruction of aggregate structures, and adverse pH changes [13,14]. Thus, the precise evaluation of soil quality is essential for guiding sustainable soil health [15].
Due to differences in the scale of soil quality evaluation parameters and the complexity of intense soil management, there is currently no unified standard for the evaluation of soil quality [16]. The Soil Quality Index (SQI) is the most common and widely accepted of the various available soil quality assessment tools [17,18]. The minimum data set (MDS) is a representative minimum set of soil parameters that can reflect most soil property data [8,19]. Studies have shown that MDS can accurately evaluate soil quality using minimal indicators, which can improve work efficiencies [5,16].
Agroforestry comprises an artificial ecosystem that makes full use of land for the development of multiple economies, primarily by planting crops beneath trees or large shrubs to maximize land utilization, while maintaining soil fertility [20]. It is generally believed that this management strategy can enhance soil structures, water holding capacities, and microenvironments to a certain extent, as well as reduce the loss of soil nutrients caused by soil erosion and leaching, and improve the activities of soil microorganisms [21]. Previous studies have reported that crop leaves or vines can maintain a relatively constant soil temperature while mitigating direct soil erosion by storms, can reduce water and nutrient loss, and provide a suitable environment for the reproduction and activities of microorganisms [22,23,24]; furthermore, increased soil microbial activities and the presence of fine roots within the surface soil improve nutrient turnover. Additional litter serves to augment soil carbon and nitrogen inputs, which are conducive to the improvement of soil quality [20,25].
Pecan (Caray illinoensis) is native to North America and is currently widely grown in more than 20 countries, including the United States, Mexico, South Africa, and China. In 2021, according to the U.S. Department of Agriculture, its 2020 production totaled 302 million pounds, covering an estimated 402,000 acres [26]. It was recently projected that by 2022 Mexico’s total pecan production will reach ~330 million pounds [27]. As of 2021, 440,000 pecan trees were grown in South Africa, which produced 19,112 tons of fruit [28]. Introduced to China in the 19th century, pecans are now grown extensively countrywide, with Anhui Province covering the largest area at ~98,000 acres [29]. Since the growth of pecans is a long-term process, Chinese farmers typically select certain crops (e.g., Paeonia suffruticosa, Hemerocallis citrina, and Glycine max) for planting under young pecan trees to improve land efficiency and increase economic returns [30,31]. The accurate assessment of soil quality in the Pecan Agroforestry Complex system is required for the sustained management of thin-shelled pecans.
We hypothesized that the monocultivation of pecans reduces soil quality, whereas the agroforestry complex model has the capacity to improve soil quality. The objectives of this study were to: (1) Screen out the main factors that affected the soil quality of pecan fruit compound management; (2) Establish an MDS dataset to evaluate the soil quality of woodlands under the composite management model; (3) Compare the differences in SQI between MDS and the full data sets (TDS); (4) Select the optimal composite pecan fruit farming/forestry business model.

2. Materials and Methods
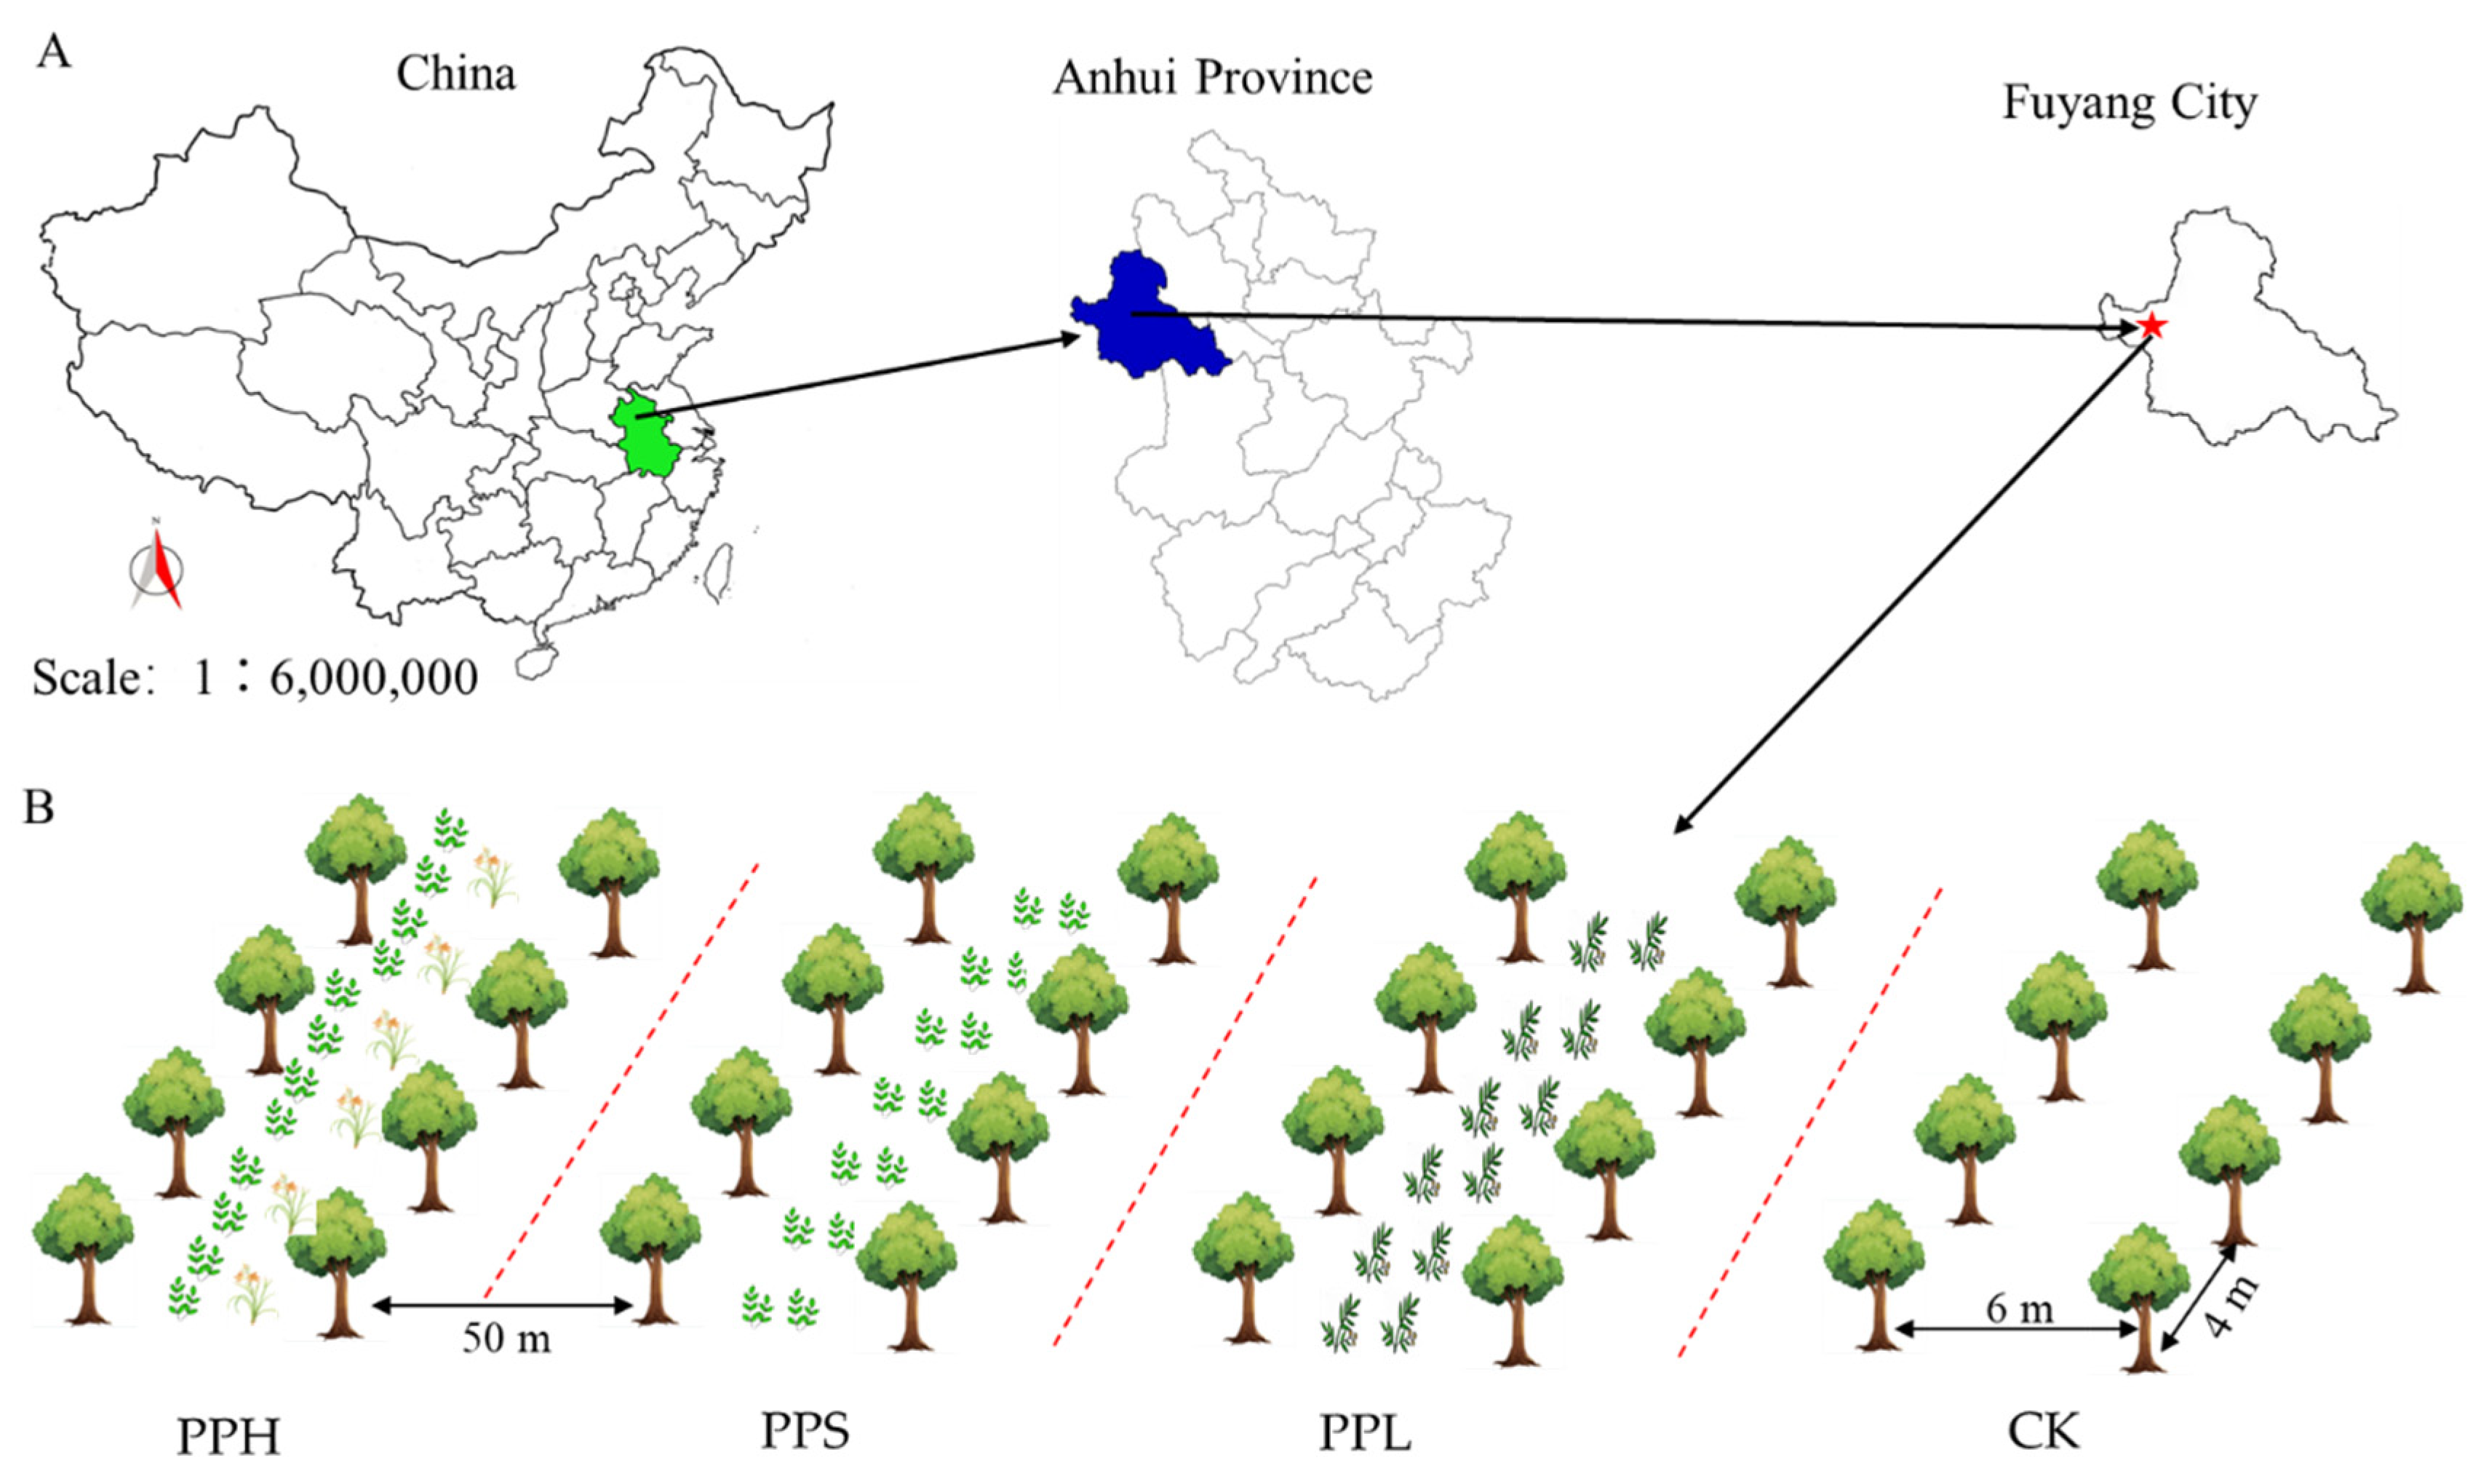
2.1. Study Area

This study took place at Xinfeng Agricultural Park, in the Yingquan District of Fuyang City, Anhui Province, China (115°33′44″ E, 32°57′25″ N). This area belongs to a warm semi-humid monsoon area with an average annual rainfall of 750–900 mm, an average annual temperature of 15 °C, and an average altitude of 33 m. The soil type is lime concretion black soil [20] (Table 1).
The pecans were planted in 2016 followed by perennial herbs or small shrubs such as Paeonia suffruticosa, Hemerocallis citrina, and Paeonia lactiflora in 2017. In September 2019, an experimental randomized cluster design including three agroforestry composite models was adopted, and a single plantation of pecans was used as a control. The pecan row spacing was 4 m × 6 m and the agroforestry composite model included: (1) Pecans—Paeonia lactifloraHemerocallis citrina (PPH), with a peony row spacing of 0.2 m × 0.2 m, and yellow cauliflower row spacing of 0.4 m × 0.8 m; (2) Pecans—Paeonia suffruticosa (PPS), with a PPS row spacing of 0.2 m × 0.6 m; (3) Pecans—Paeonia lactiflora (PPL), with a PPL row spacing of 0.2 m × 0.6 m; (4) Single pecan plantation forest (CK) (Figure 1). The same cultivation and management measures were adopted for the different treatments. Organic fertilizer (6000 kg/acre) was applied in the winter after defoliation, whereas compound fertilizer and trace elements such as Zn and Mg were applied in summer.

2.2. Sampling Design

We sampled nine plots from each of the four composite agroforestry models for a total of thirty-six plots, all of which were >50 m from any roadway. For each plot, a rectangle enclosed by eight pecan trees was randomly used as a cell. To reduce spatial autocorrelation, two drainage channels (~50 m) were spaced apart for each cell.
Soil samples were collected from the test site in early September 2019. Following the removal of plants and their litter on the plot surface, according to the “S” shape sampling method, the topsoil at 0 to 20 cm depth was extracted from each cell. After the removal of the roots and organic debris, the resulting sample was mixed and sampled using an Ø6 cm ring knife for a total of 36 mixed soil samples. The soil samples were then sealed and transferred to the laboratory at low temperatures to determine their physicochemical properties.

2.3. Laboratory Analysis

All sample processing and analyses were completed in a laboratory at Anhui Agricultural University. The fresh soil samples were divided into two parts in the laboratory, where the nitrate nitrogen (NO3-N), ammonium nitrogen (NH4+-N), available phosphorus (AP), and available potassium (AK) were quantified for one portion within 48 h. The ring knife method was used for the other portion to collect samples to determine the soil bulk density (BD), soil moisture content (MC), and Soil Porosity (SP) using the Specific Gravity Method [32]. After air drying, the soil pH, electrical conductivity (EC), total carbon (TC), total nitrogen (TN), total potassium (TK), calcium (Ca), and magnesium (Mg) were determined using 100 mesh sieves. The soil NO3-N, NH4+-N, AP, and AK were quantified using an automatic discontinuous chemical analyzer (CleverChem Anna, DeChem-Tech, Germany) [33]. The pH of the soil was determined using a pH meter (Mettler Toledo, Shanghai, China) in an aqueous solution of 1:2.5 (w/v), whereas the EC value was determined with an electrical conductivity meter (DDB-303A) using a 1:5 soil/water leaching solution at 25 °C [34]. The TC and TN of the soil were determined via an automatic element analyzer (Vario EL Cube, Elementar, Langenselbold, Germany) [33,35]. The TK, Ca, and Mg were determined using an inductively coupled plasma emission spectrometer (iCAP 6300 Series, Thermo Fisher Scientific, Waltham, MA, USA) [20].

2.4. Data Analysis

We selected 15 soil physicochemical properties (EC, SC, BD, pH, SP, AP, TP, NH4+-N, NO3-N, TK, AK, TN, TC, Ca, and Mg) as the total data set (TDS). The affiliation function method and the soil quality index were employed for comprehensive evaluation. First, an evaluation factor was selected to establish the minimum data set (MDS). To overcome autocorrelations between indicators, principal component analysis (PCA) was selected for grouping. The data for all indicators was standardized and the correlations between them were determined, after which the number of principal components was finally determined. Among the principal components of the eigenvalue ≥ 1 soil indicators with loads of ≥0.5 were designated into a group. For metrics that were likely to go into more than one group, those with low correlations were selected. The norm value was then calculated for the grouped indicator, where the larger the norm value the stronger its capacity to interpret the synthesis data. Indicators within the top 10% range of the norm values in each group were selected to further analyze the correlations between them. If the correlation was strong (r > 0.5) the indicator with the highest norm value was determined to enter the MDS, whereas if the correlation was low (r < 0.5) all entered and obtained the final MDS. The calculation method of the norm value of the evaluation index was as follows:
N ik = i k μ i k 2 β k
where Nik is the combined load of the first k principal component of the i variable on the eigenvalue ≥1; μik is the load of the i variable on the k-th principal component; βk is the characteristic value of the k-th principal component.
Second, the membership and weight values of the indicators entering the MDS were obtained. According to the positive and negative effects of different indicators on soil quality, the MC, SP, AP, TP, NH4+-N, NO3-N, TK, AK, TN, TC, EC, Ca, and Mg were selected as S-type membership functions, while EC and BD were selected as anti-S membership functions. Pecans typically grow in soils at pH 6 to 8 as plantation soils are typically weakly alkaline; thus, the pH also selects for the inverse S-type membership function (Table 2). According to the norm value of each MDS indicator, the norm value ratio of each indicator to the sum of the norm values was calculated, and the weight W of each MDS indicator was obtained.
Finally, the soil quality index (SQI) was calculated by weighting the membership values and weights of each evaluation index to be obtained. The calculation formula was:
SQI = i = 1 n W i N i
where SQI represents the soil quality index; Wi represents the weight of the i-th evaluation index; Ni is the i-evaluation index membership value; n is the number of evaluation indicators.
All data analysis was performed with R 4.1.3, using Pearson correlation coefficients to quantify the correlations between soil indicators, whereas principal component analysis (PCA) was used to screen soil indicators into the MDS. To understand the capacity of MDS to interpret soil quality, we employed the ‘basic trendline’ package fitted linear regression to quantify the relationship between MDS and TDS [36,37].

3. Results

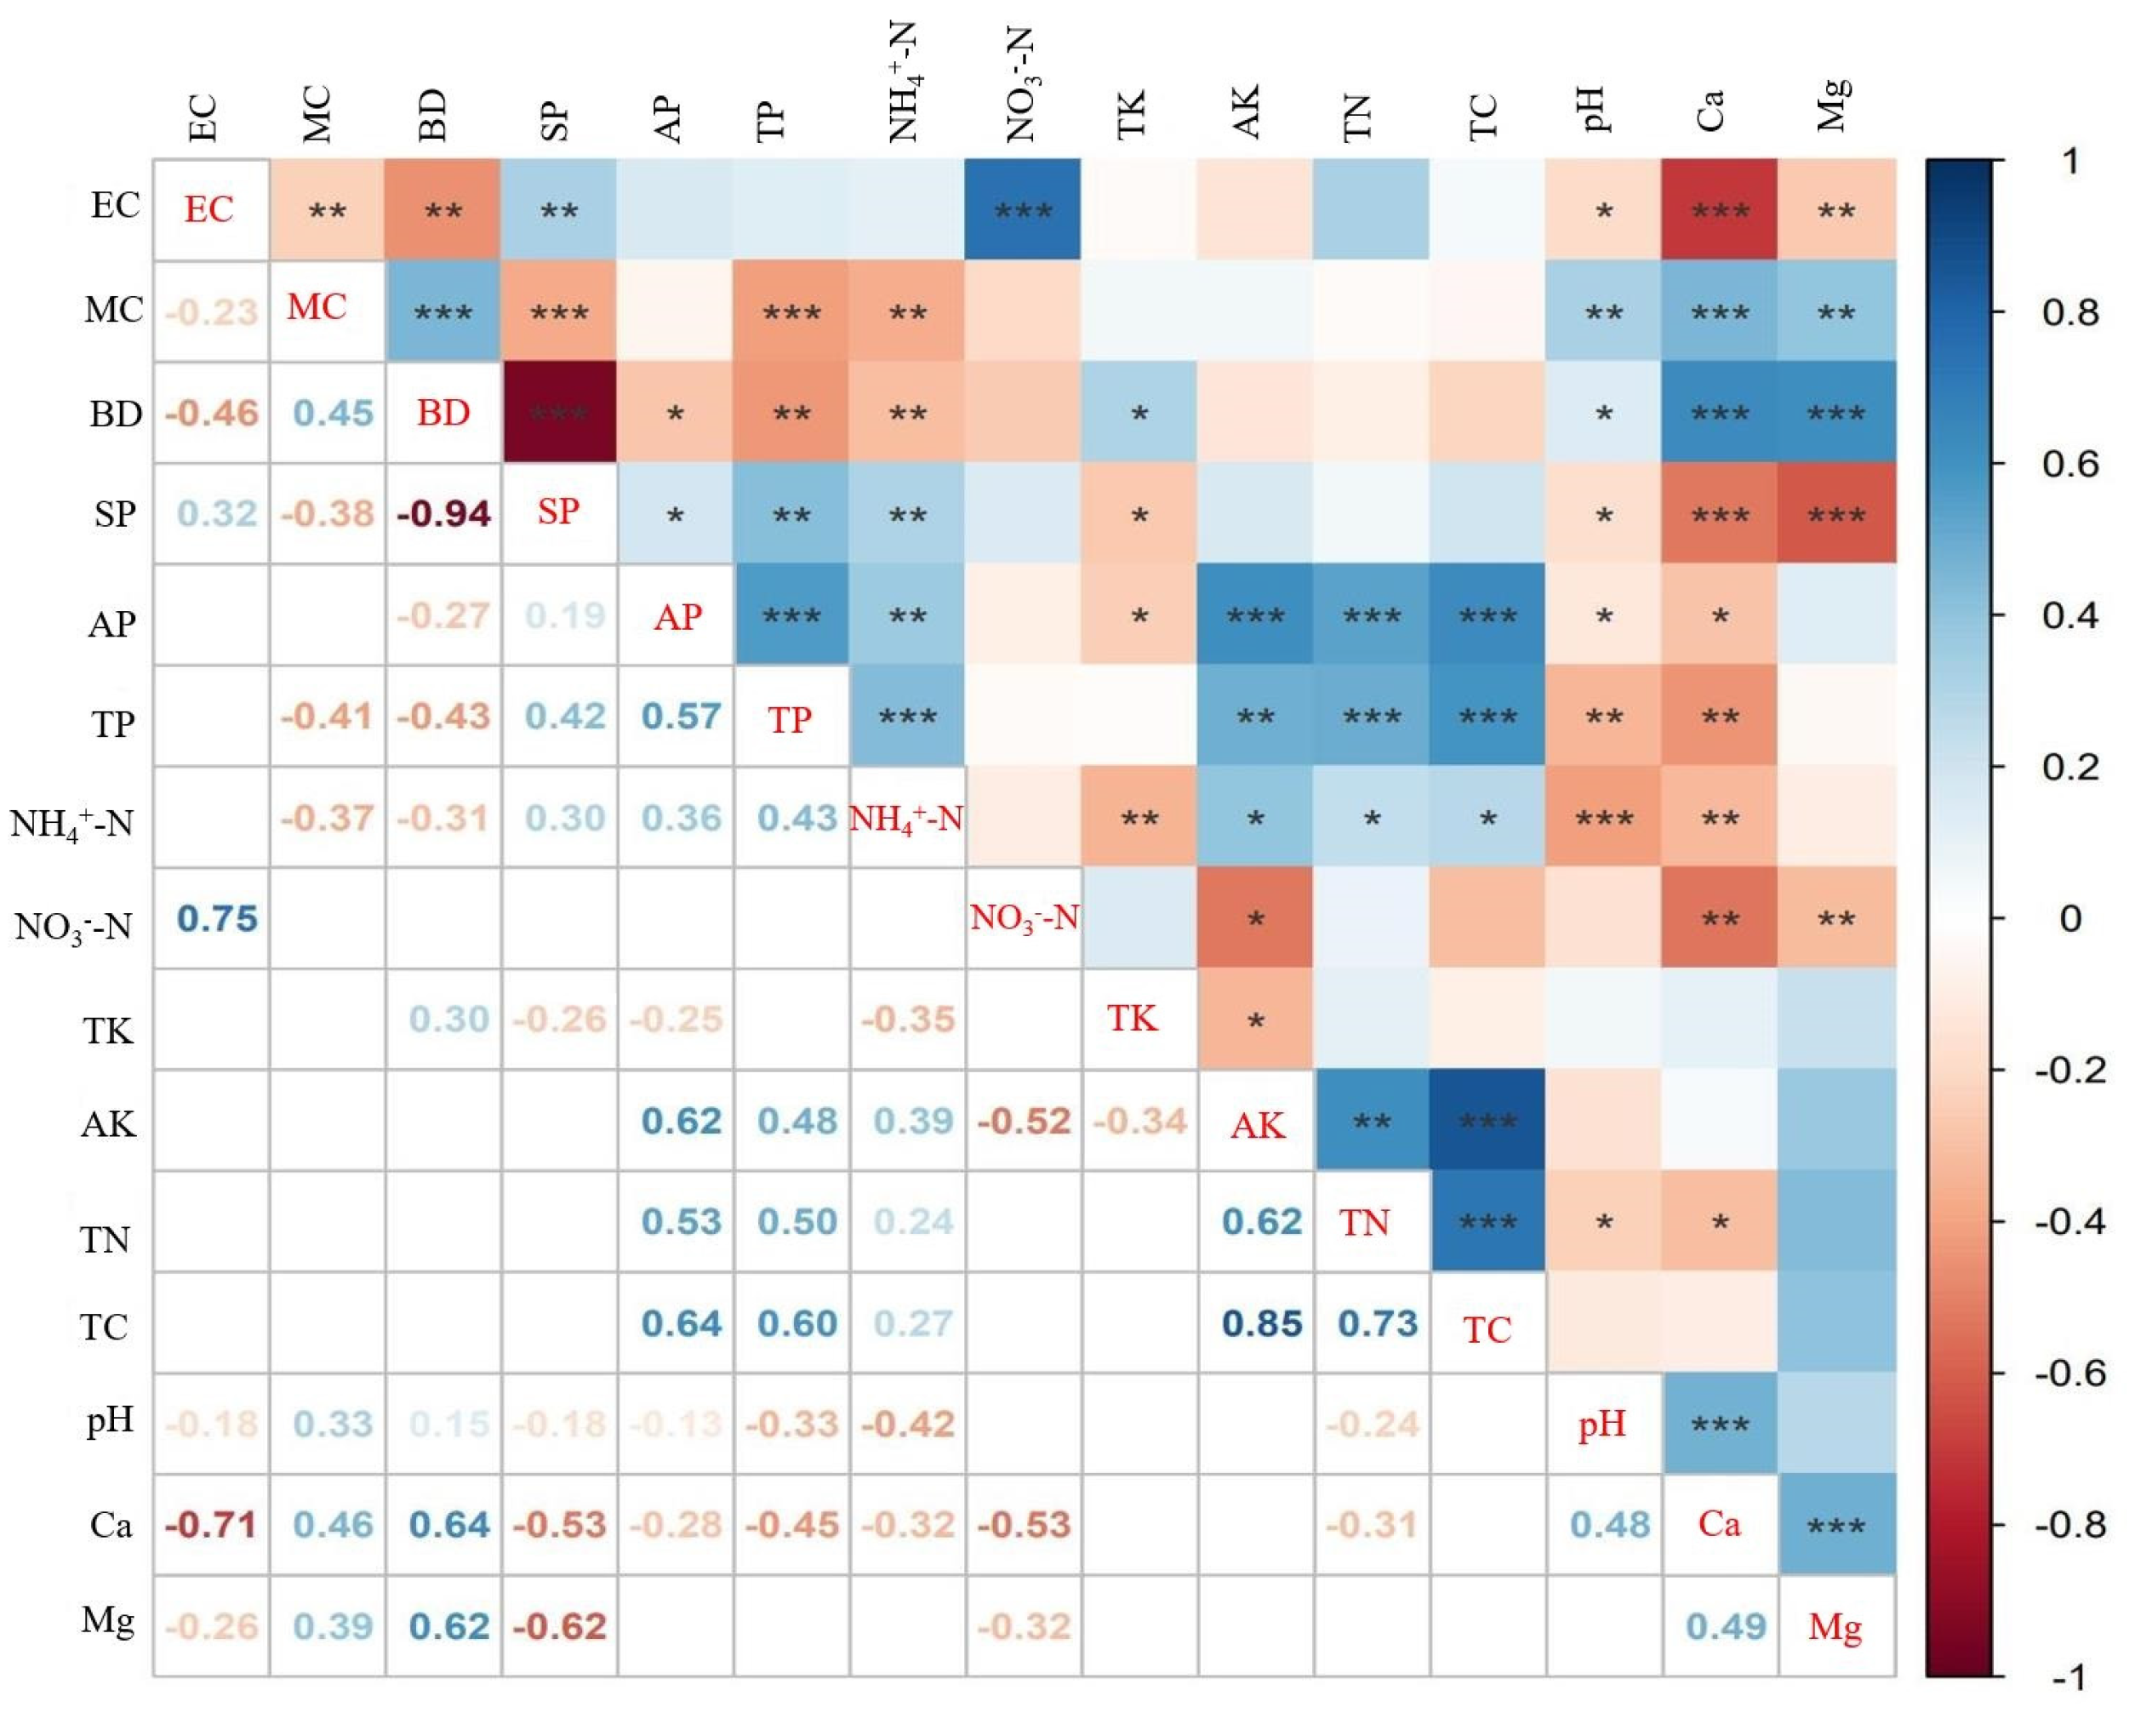
3.1. Soil Physicochemical Properties of Agroforestry Composite Systems

There were physical differences in the surface woodland soils following the implementation of the agroforestry composite (Table 3), and the EC of PPL in the four woodlands was significantly higher than that of the CK and the other two groups (p < 0.05). The MC of PPH was lowest among the four woodland soils, and significantly lower than PPS and CK (p < 0.05). The range of soil BD variations in all woodlands was 1.37 g/cm3 to 1.56 g/cm3, of which PPS and CK soil BD was significantly higher than those of PPH and PPL (p < 0.05). The SP of PPH was significantly higher than that of the other three groups (p < 0.05).
Compared with the agroforestry composite management model, the AP, TP, AK, TC, and TN content of the single model were significantly lower than those of the other three groups (p < 0.05); however, the TK content of PPH was significantly lower than that of CK and the other two compound planting modes. The NH4+-N and NO3-N were enriched in the PPH and PPL groups, respectively. The content of Ca and Mg in PPS was significantly higher than that of PPH and PPL. The pH varied from 8.09 to 8.25 but showed no statistical difference.

3.2. Establishment of MDS

The smallest data set is a set of the fewest index parameters that can reflect soil quality. The MDS was established to select the indicators that were most suitable for evaluating soil quality in the study area, thereby reducing data redundancy. The results of the principal component analysis revealed that there were four principal components with eigenvalues of >1. The cumulative contribution rate of variance attained 76.328%, which implied that the four principal components had a strong capacity to interpret the overall variance (Table 4). Among them, BD, Ca, TP, SP, AP, NH4+-N, and MC all met the load ≥ 0.5 on PC1; all of which were classified as Group 1. AK, Mg, TC, and NO3-N satisfied the load ≥ 0.5 on PC2, whereas NO3-N satisfied the load ≥0.5 on PC2 and PC3. However, the correlation coefficient between NO3-N and EC (Group 3) was significantly positively correlated with 0.75 (Figure 2); thus, NO3-N was still classified in Group 2. TK met the load ≥ 0.5 on PC2; TN had an average load ≥0.5 on PC1, PC2, and PC3; EC met the load ≥ 0.5 on PC2 and PC3. However, as TN and EC had higher correlations with the indicators of Group 1 and Group 2, TK, TN, and EC were all included in Group 3. The pH satisfied the load ≥ 0.5 only on PC4, which was grouped into Group 4. Through the principal component analysis, the final Group 1 included BD, Ca, TP, SP, AP, NH4+-N, and MC, whereas Group 2 included AK, Mg, TC, and NO3-N, Group 3 included TK, TN, and EC, and Group 4 included the pH.
According to the principle of MDS index filtering, the norm values of each group were calculated and compared. The indicators with norm values within 10% of the maximum value in each group were selected, after which the correlations between the selected parameters in each group were compared (Table 4, Figure 2). Eventually, BD in Group 1 entered the MDS, and Group 2 had the highest norm values in AK. However, Mg had no significant correlation with AK, and all entered MDS. Group 3 had the highest norm values for TNs, but EC had no significant correlation with TNs, and all entered MDS, and Group 4 pH entered MDS. The final MDS metrics were BD, AK, Mg, TN, EC, and pH. In this study, a total of fifteen preliminary indicators were selected, a total of six indicators were entered into the minimum data set, and the index screening and filtering rate reached 60%. This simplified the soil quality evaluation system and better eliminated the impact of redundant data between indicators on soil quality evaluation.

3.3. Determination of the Weights of Comprehensive Evaluation Indicators for Soil Quality

Once the MDS index was determined, the weight value of each index was obtained by analyzing the TDS and MDS through the principal component analysis. The weight values W of EC, BD, AK, TN, pH, and Mg in MDS were 0.160, 0.188, 0.184, 0.169, 0.130, and 0.169, respectively. BD and AK contributed more to the evaluation of the quality of surface soil in the study area, followed by TN (Table 5).

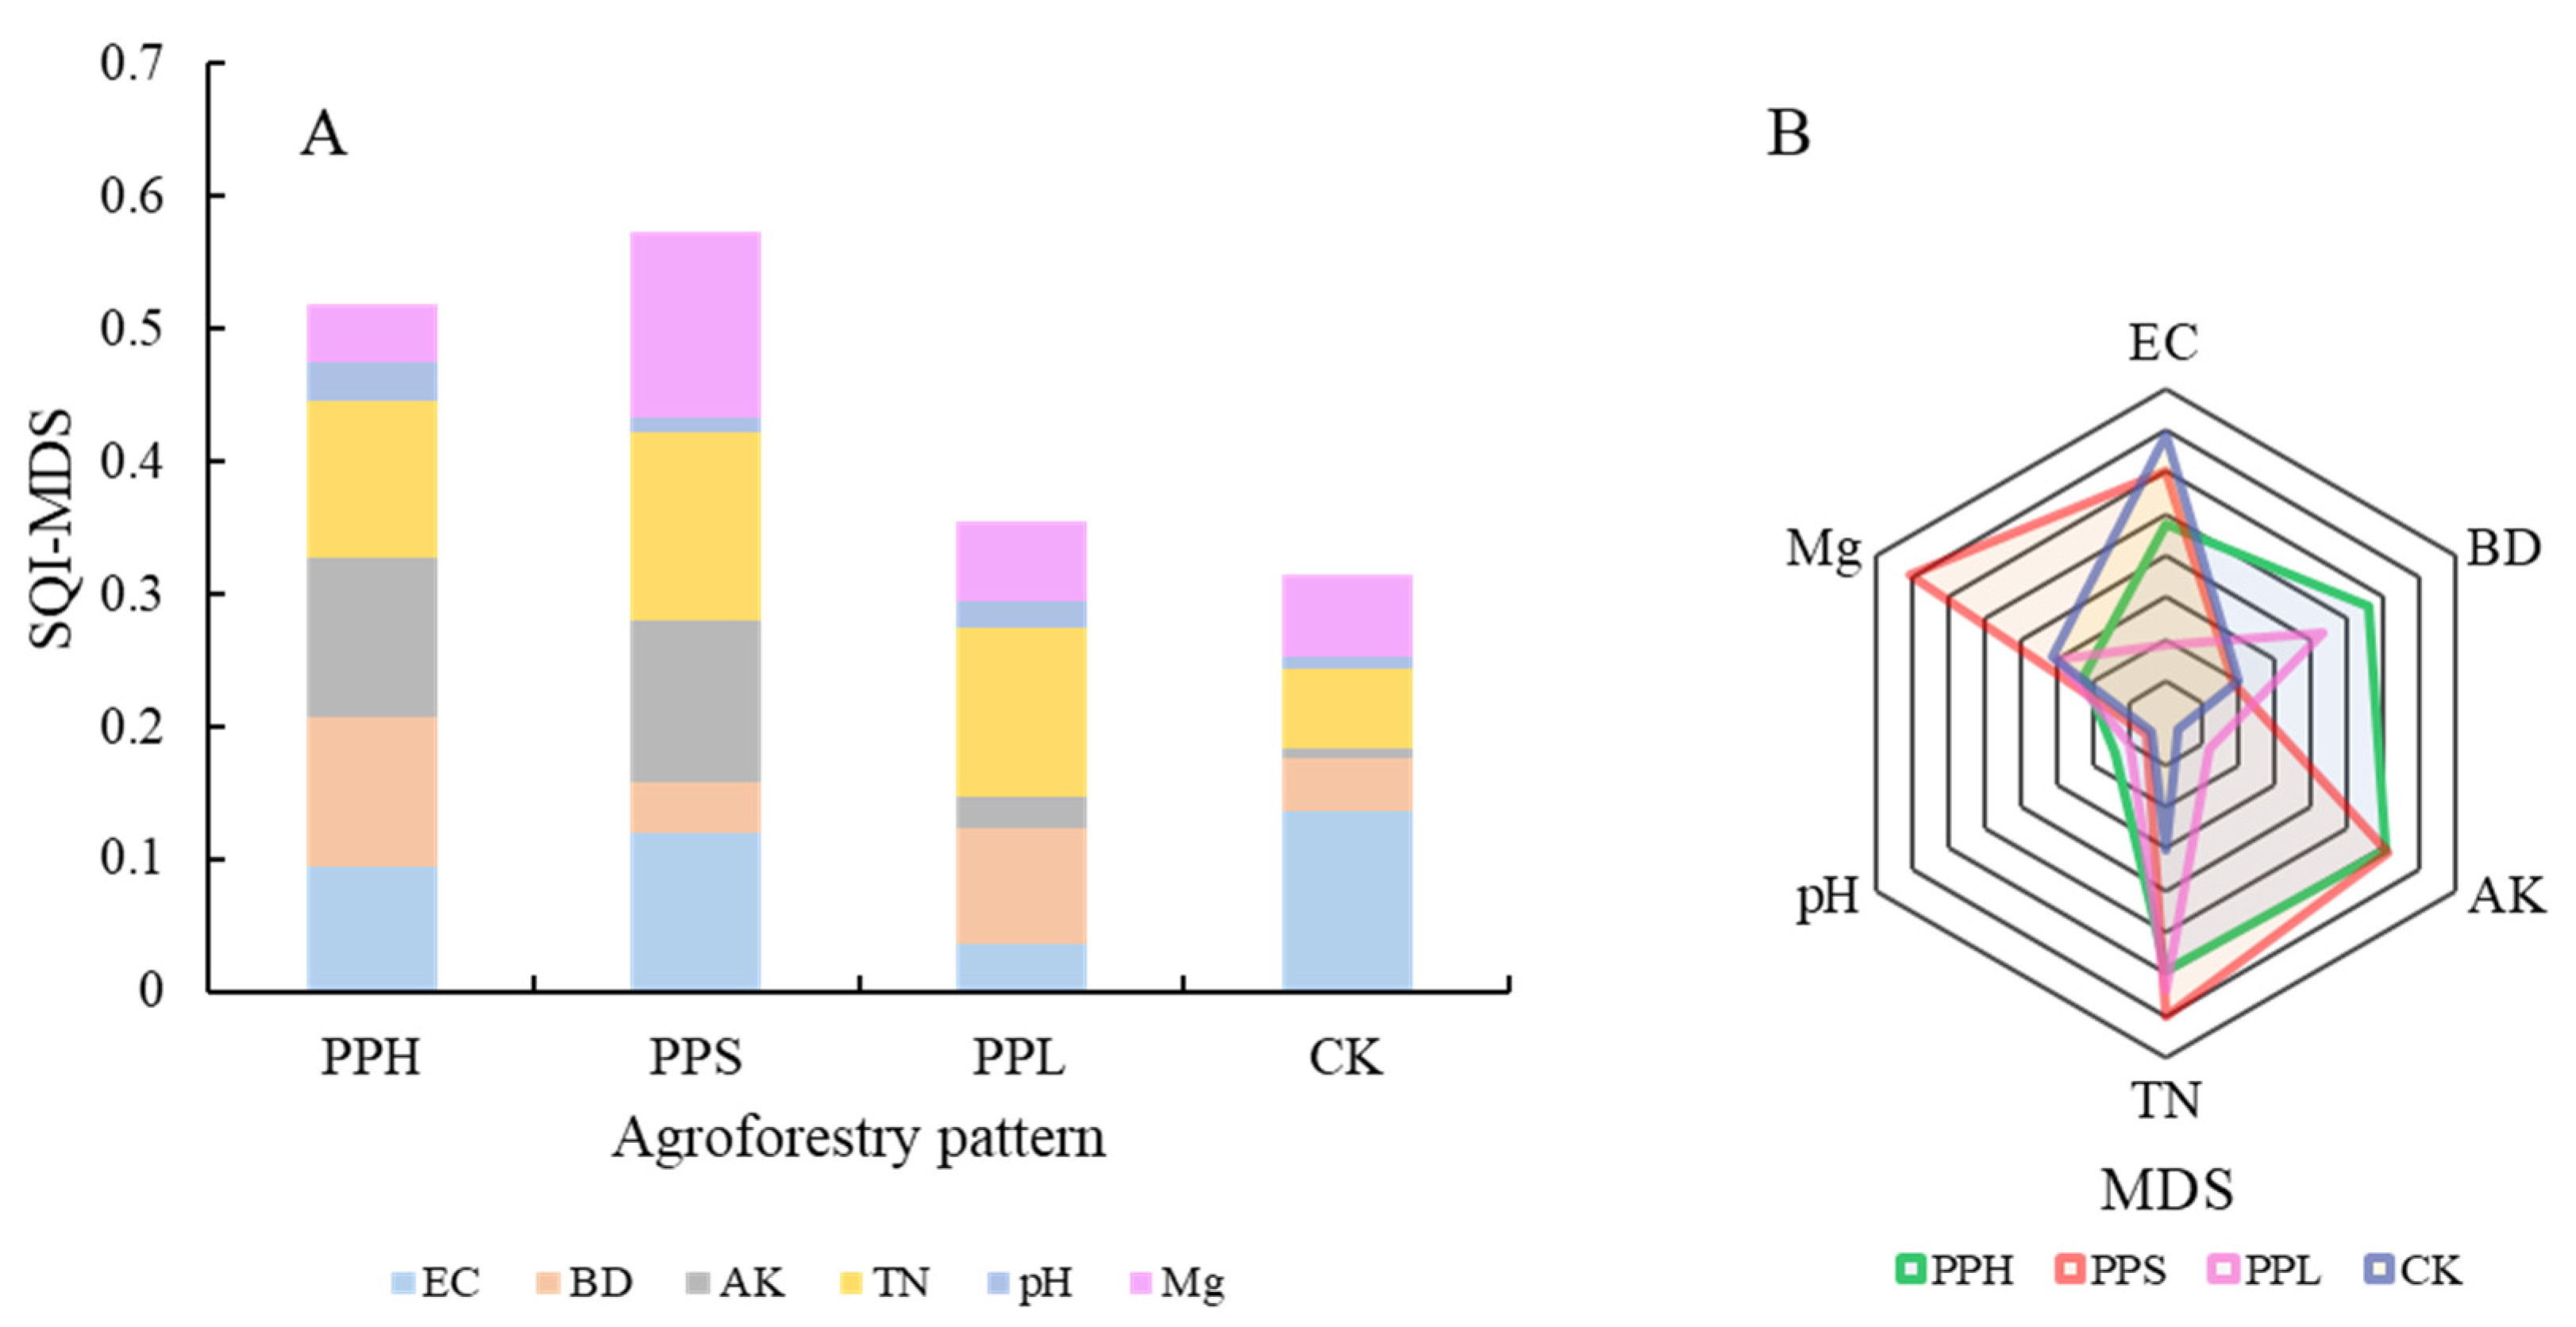
3.4. Evaluation of Soil Quality for Different Agroforestry Patterns Based on MDS

According to the membership function, the value of each index was calculated, while the average value of the soil quality index of pecan woodlands under the four agroforestry composite modes was plotted into stack and radar maps. To reflect the proportion of each index in the soil quality evaluation, a radar chart was employed for the comprehensive analysis of multiple indicators. The values of each point on the coordinate axis reflected the state of each indicator, where the closer to the origin the better the state of the indicator, and conversely, the worse the state of the indicator. The Soil Quality Index (SQI-MDS) of the four planting patterns, sorted from largest to smallest, were: PPS (0.573) > PPH (0.519) > PPL (0.355) > CK (0.315) (Figure 3).

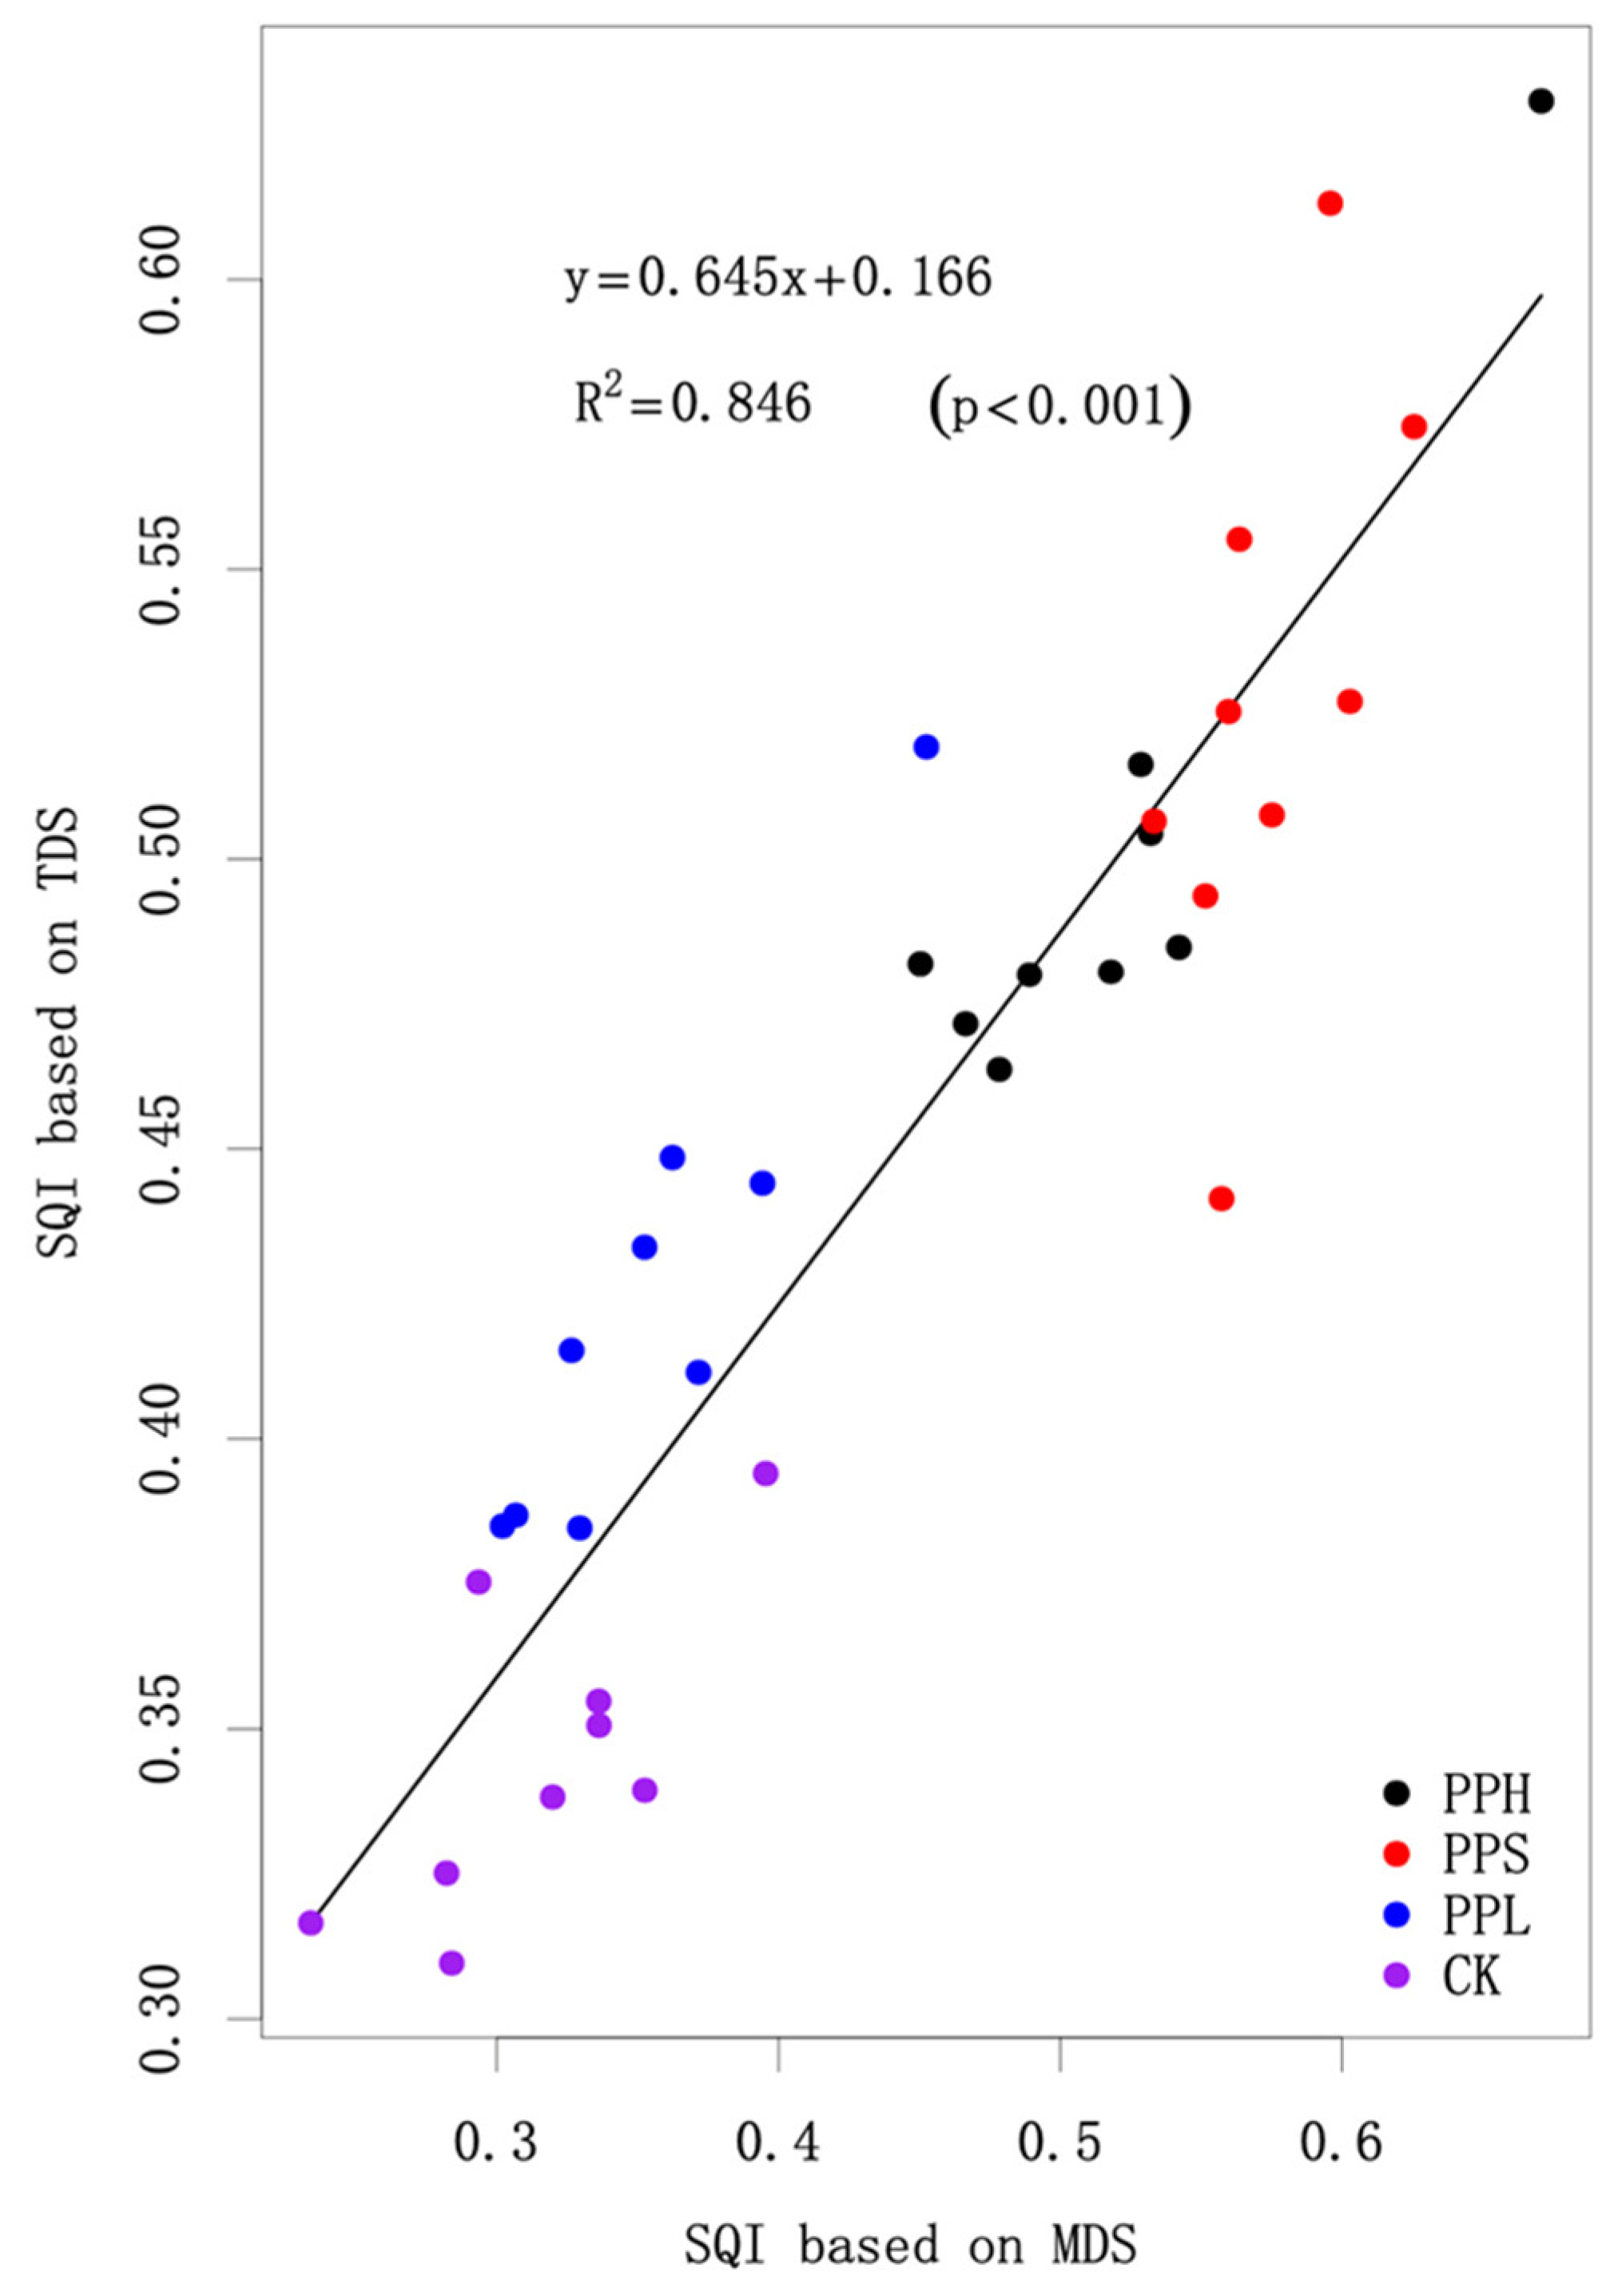
3.5. SQI Construction and Evaluation

To verify the accuracy of the minimum data set SQI, this study linearly fitted the TDS-SQI with MDS-SQI (Figure 3), with the results revealing a significant correlation between the TDS-SQI and MDS-SQI (p < 0.001), where the R2 of the linear fit equation was 0.846. This indicated that the selected MDS index system for the evaluation of soil quality in the study area was highly representative and could be used to characterize it more accurately.

4. Discussion

4.1. Effects of Agroforestry System on Physicochemical Soil Properties

Compared with the monocultivation of pecans, the two composite management modes (PPH and PPL) reduced BD and increased SP, and the water retention capacity of the soil was also improved under agroforestry complex management (Table 2). These phenomena may be attributed to the fact that the root systems of herbs or shrubs such as Paeonia suffruticosa, Hemerocallis citrina, and Paeonia lactiflora were interspersed in the soil to improve its structure; making it loose and increasing its breathability [20]. Furthermore, increased intermediate crops can reduce the surface-water runoff, increase the filtration in soil moisture, and enhance the amount of soil storage, such that the soil moisture status can be improved [7,24]. Under the four intercropping models, the soil pH changed significantly, which may have been due to the short operation time and the pH changes not being obvious [20]. Compared with CK, the EC of the three agroforestry composite systems was improved, where the increase in intermediate crops led to greater litter and accelerated mineral decomposition, thereby increasing the mineral ion content of the soil [16]. However, the soil EC is generally considered to be positively correlated with the soluble salt content [38,39]. In contrast to the single cultivation of pecans, the agroforestry composite system requires increased operational and management inputs such as fertilizers, herbicides, etc. Furthermore, long-term operation is associated with the risk of soil salinization, which needs to be continuously observed.
Early research suggests that agroforestry management can increase the systematic nutrient cycling process and reduce systematic nutrient loss while increasing the total nutrient concentrations of plant-soil systems [40,41]. Our research results confirmed this conclusion, and that the content of TP, TN, and TC in the topsoil was increased following multiplex agroforestry operations. Previous studies found that the soil TN, TP, AP, and organic matter content increased by 10–25% subsequent to tea-michelia intercropping [21]. Udawatta’s [42] study found that the soil TN content increased significantly after 12 years of Dalbergia sissoo and wheat intercropping, and suggested that the addition of intermediate crops improved the woodland microclimate, soil aggregate structure, and enhanced the binding capacity of soil nutrients to a certain extent. Furthermore, increased understory vegetation cover was observed to play an important role in reducing direct surface erosion by rainwater, which also reduced the loss of soil nutrients [24]. Compared with the mono-planting of pecans, the presence of more litter and dead roots in agroforestry composite systems enhanced organic matter inputs into the soil. We observed that the decomposition of soil microorganisms improved the availability of nutrients, whereas the AK, AP, and NH4+-N content of the soil was significantly higher than that of CK [10,20]. Overall, the physicochemical attributes of soil quality in agroforestry composite systems were superior to those of the monoculture pecan model, which was confirmed by the comparison of the soil quality index (Figure 3 and Figure 4).

4.2. MDS Index Screening and Evaluation of Soil Quality

The efficient and accurate evaluation of soil quality in agroforestry composite systems is key to assessing their ecological benefits. Although the SQI calculated by TDS can accurately assess soil quality, the acquisition of all evaluation indicators is a time-consuming and laborious task [15,17]. MDS is able to screen for the fewest number of soil indicators, which reflects the true picture of soil quality [8,16]. The selection of evaluation indicators is usually not fixed, where MDS indicators are intimately related to the target to be evaluated. Influencing factors of soil quality (e.g., soil type, land use mode, soil layer thickness, etc.) can directly alter the selection of evaluation indicators [9,43]. Consequently, the scope of use of MDS is typically specific and cannot be applied to evaluate all soils [8]. Nevertheless, it is still universally applicable within a certain range of plantation types.
In this study, through principal component analysis and the norm values of each index, the MDS indicators including EC, BD, AK, TN, pH, and Mg were screened, including soil aeration, soil nutrient, and soil acid-base properties. Bunemann [16] collected statistics on the selection of soil evaluation indicators from the extensive literature and proposed that the soil organic carbon content (SOM), pH, AP, AK, TN, EC, and BD, as well as other indicators, were selected as high-frequency indicators of MDS, which was consistent with those selected by the Institute. The obtained SQI results for soil quality based on MDS and TDS methods were similar (y = 0.645x + 0.166, R2 = 0.846, p < 0.001) (Figure 4), which objectively evaluated the soil quality of Pecan Farming and Forestry Complex Systems. From the results, the soil quality of a hickory agroforestry composite system was PPS > PPH > PPL > CK, which was consistent with previous research results. The outcome of another of our studies revealed that the soil enzyme activity of PPS was higher than that of PPH and PPL [20]. This may be attributed to the fact that the developed fleshy roots of Paeonia suffruticosa better improved the soil permeability and moisture, and enhanced the activities of soil microorganisms; thus, improving the status of soil nutrients [21,44]. The root systems of shrubs are quite extensive, which is conducive to the transformation of symbiotic nitrogen fixation and refractory nutrients, as it is easier to obtain nutrients from the deep soil and lift them to the topsoil [24]. The soil quality of PPH was superior to that of PPL and CK, which may have been affected by the complexity of agroforestry systems. This further illustrated that exclusive pecan management is not conducive to the maintenance of soil fertility. To a certain extent, intermediate crop species are positively correlated with soil quality [21]. However, the impacts of more complex agroforestry systems on soil quality will require further study.

5. Conclusions

In this study, the soil quality of different composite pecan agroforestry patterns was evaluated by SQI using TDS and MDS methods. Overall, our study revealed that complex pecan agroforestry systems improved the availability of soil nutrients and enhanced soil quality. Among these treatments, pecans—Paeonia suffruticosa peony achieved improved ecological benefits over other treatments, while monocultured pecan plantation soils underwent degradation with the long-term operation. Crops such as Paeonia suffruticosa, Hemerocallis citrina, and Paeonia lactiflora for oil in pecan forests are a viable strategy for achieving the sustainable management of pecan orchards, which can provide a double harvest for further ecological and economic benefits.

Author Contributions

Conceptualization, S.F. and H.L.; methodology, H.L.; software, C.H. and X.R.; validation, C.H., Z.W. and X.M.; formal analysis, M.Z.; investigation, C.H. and X.G.; writing—original draft preparation, C.H.; writing—review & editing, S.F.; visualization, X.M. All authors have read and agreed to the published version of the manuscript.

Funding

This research was funded by the Science and Technology Major Project of Anhui Province (202103a06020007), and the Forestry Science and Technology Promotion Demonstration Project of State (2021TG02).

Institutional Review Board Statement

Not applicable.

Informed Consent Statement

Not applicable.

Data Availability Statement

Not applicable.

Acknowledgments

The authors would like to thank Haoxin Ge and Longlong Li (Fuyang Xinfeng Seed Industry Company) and Xinxin Tian, Lei Wang, and Yinhao Tong (Anhui Agricultural University) for their support in the collection of field data and soil processing.

Conflicts of Interest

The authors declare no conflict of interest.

References

  1. Ponge, J.F. The soil as an ecosystem. Biol. Fertil. Soils 2015, 51, 645–648. [Google Scholar] [CrossRef]
  2. Nabiollahi, K.; Golmohamadi, F.; Taghizadeh-Mehrjardi, R.; Kerry, R.; Davari, M. Assessing the effects of slope gradient and land use change on soil quality degradation through digital mapping of soil quality indices and soil loss rate. Geoderma 2018, 318, 16–28. [Google Scholar] [CrossRef]
  3. Ranjbar, A.; Emami, H.; Khorassani, R.; Karouyeh, A.R.K. Soil Quality Assessments in Some Iranian Saffron Fields. J. Agric. Sci. Technol. 2016, 18, 865–878. [Google Scholar]
  4. McBratney, A.; Field, D.J.; Koch, A. The dimensions of soil security. Geoderma 2014, 213, 203–213. [Google Scholar] [CrossRef]
  5. Zhang, Y.; Xu, X.; Li, Z.; Xu, C.; Luo, W. Improvements in soil quality with vegetation succession in subtropical China karst. Sci. Total Environ. 2021, 775, 145876. [Google Scholar] [CrossRef] [PubMed]
  6. Guo, S.; Han, X.; Li, H.; Wang, T.; Tong, X.; Ren, G.; Feng, Y.; Yang, G. Evaluation of soil quality along two revegetation chronosequences on the Loess Hilly Region of China. Sci. Total Environ. 2018, 633, 808–815. [Google Scholar] [CrossRef]
  7. Govaerts, B.; Sayre, K.D.; Deckers, J. A minimum data set for soil quality assessment of wheat and maize cropping in the highlands of Mexico. Soil Tillage Res. 2006, 87, 163–174. [Google Scholar] [CrossRef]
  8. Abd-Elwahed, M.S. Effect of long-term wastewater irrigation on the quality of alluvial soil for agricultural sustainability. Ann. Agric. Sci. 2019, 64, 151–160. [Google Scholar] [CrossRef]
  9. Zhang, J.Q.; Zheng, F.L.; Li, Z.; Feng, Z.Z. A novel optimal data set approach for erosion-impacted soil quality assessments—A case-study of an agricultural catchment in the Chernozem region of Northeast China. Land Degrad. Dev. 2022, 33, 1062–1075. [Google Scholar] [CrossRef]
  10. Guo, J.; Wang, G.B.; Wu, Y.Q.; Geng, Q.Z.; Cao, F.L. Leaf litter and crop residue decomposition in ginkgo agroforestry systems in eastern China: Soil fauna diversity and abundance, microbial biomass and nutrient release. J. For. Res. 2019, 30, 1895–1902. [Google Scholar] [CrossRef]
  11. Vasu, D.; Tiwari, G.; Sahoo, S.; Dash, B.; Jangir, A.; Sharma, R.P.; Naitam, R.; Tiwary, P.; Karthikeyan, K.; Chandran, P. A minimum data set of soil morphological properties for quantifying soil quality in coastal agroecosystems. CATENA 2021, 198, 05042. [Google Scholar] [CrossRef]
  12. Carter, E.A.; Rummer, R.B.; Stokes, B.J. Evaluation of site impacts associated with three silvicultural prescriptions in an upland hardwood stand in northern Alabama, USA. Biomass Bioenergy 2006, 30, 1025–1034. [Google Scholar] [CrossRef]
  13. Han, X.; Li, Y.H.; Du, X.F.; Li, Y.B.; Wang, Z.W.; Jiang, S.W.; Li, Q. Effect of grassland degradation on soil quality and soil biotic community in a semi-arid temperate steppe. Ecol. Process 2020, 9, 63. [Google Scholar] [CrossRef]
  14. Swanepoel, P.A.; du Preez, C.C.; Botha, P.R.; Snyman, H.A.; Habig, J. Assessment of tillage effects on soil quality of pastures in South Africa with indexing methods. Soil Res. 2015, 53, 274–285. [Google Scholar] [CrossRef]
  15. Liu, Z.J.; Zhou, W.; Shen, J.B.; Li, S.T.; He, P.; Liang, G.Q. Soil quality assessment of Albic soils with different productivities for eastern China. Soil Tillage Res. 2014, 140, 74–81. [Google Scholar] [CrossRef]
  16. Bunemann, E.K.; Bongiorno, G.; Bai, Z.G.; Creamer, R.E.; De Deyn, G.; de Goede, R.; Fleskens, L.; Geissen, V.; Kuyper, T.W.; Mader, P.; et al. Soil quality—A critical review. Soil Biol. Biochem. 2018, 120, 105–125. [Google Scholar] [CrossRef]
  17. Thakur, P.; Paliyal, S.S.; Dev, P.; Datt, N. Methods and Approaches-Soil Quality Indexing, Minimum Data Set Selection & Interpretation—A Critical Review. Commun. Soil Sci. Plant Anal. 2022, 53, 1849–1864. [Google Scholar] [CrossRef]
  18. Sanchez-Navarro, A.; Gil-Vazquez, J.M.; Delgado-Iniesta, M.J.; Marin-Sanleandro, P.; Blanco-Bernardeau, A.; Ortiz-Silla, R. Establishing an index and identification of limiting parameters for characterizing soil quality in Mediterranean ecosystems. CATENA 2015, 131, 35–45. [Google Scholar] [CrossRef]
  19. Tian, K.; Zhang, B.E.; Zhang, H.D.; Huang, B.; Darilek, J.L.; Zhao, Y.C.; Yang, J. Evaluation of soil quality in major grain-producing region of the North China Plain: Integrating minimum data set and established critical limits. Ecol. Indic. 2020, 117, 106613. [Google Scholar] [CrossRef]
  20. Wang, Z.C.; Zhou, M.Y.; Liu, H.; Huang, C.; Ma, Y.H.; Ge, H.X.; Ge, X.; Fu, S. Pecan agroforestry systems improve soil quality by stimulating enzyme activity. PeerJ. 2022, 9, 19. [Google Scholar] [CrossRef]
  21. Zhang, G.L.; Chu, X.B.; Zhu, H.Y.; Zou, D.S.; Li, L.C.; Du, L.S. The Response of Soil Nutrients and Microbial Community Structures in Long-Term Tea Plantations and Diverse Agroforestry Intercropping Systems. Sustainability 2021, 13, 7799. [Google Scholar] [CrossRef]
  22. Xuan, D.T.; Guong, V.T.; Rosling, A.; Alstrom, S.; Chai, B.L.; Hogberg, N. Different crop rotation systems as drivers of change in soil bacterial community structure and yield of rice, Oryza sativa. Biol Fertil. Soils 2012, 48, 217–225. [Google Scholar] [CrossRef]
  23. Parkin, T.B.; Kaspar, T.C.; Singer, J.W. Cover crop effects on the fate of N following soil application of swine manure. Plant Soil 2006, 289, 141–152. [Google Scholar] [CrossRef]
  24. Ma, Y.H.; Fu, S.L.; Zhang, X.P.; Zhao, K.; Chen, H.Y.H. Intercropping improves soil nutrient availability, soil enzyme activity and tea quantity and quality. Appl. Soil Ecol. 2017, 119, 171–178. [Google Scholar] [CrossRef]
  25. Wang, Q.K.; Wang, S.L.; Liu, Y. Responses to N and P fertilization in a young Eucalyptus dunnii plantation: Microbial properties, enzyme activities and dissolved organic matter. Appl. Soil Ecol. 2008, 40, 484–490. [Google Scholar] [CrossRef]
  26. Pecan Production. 2021. Available online: https://www.nass.usda.gov/Publications/Todays_Reports/reports/pecnpr21.pdf (accessed on 19 August 2022).
  27. US Loses Top Pecan Production Spot to Mexico. 2019. Available online: https://www.proag.com/news/u-s-loses-top-pecan-production-spot-to-mexico/ (accessed on 20 August 2022).
  28. Pecan Nut Tree Plantings. 2021. Available online: https://www.sappa.za.org/industry-statistics/ (accessed on 20 August 2022).
  29. Zhang, R.; Peng, F.R.; Li, Y.R. Pecan production in China. Sci Hortic. 2015, 197, 719–727. [Google Scholar] [CrossRef]
  30. Manceur, A.M.; Boland, G.J.; Thevathasan, N.V.; Gordon, A.M. Dry matter partitions and specific leaf weight of soybean change with tree competition in an intercropping system. Agrofor. Syst. 2009, 76, 295–301. [Google Scholar] [CrossRef]
  31. Gao, P.X.; Zheng, X.F.; Wang, L.; Liu, B.; Zhang, S.X. Changes in the Soil Bacterial Community in a Chronosequence of Temperate Walnut-Based Intercropping Systems. Forests. 2019, 10, 299. [Google Scholar] [CrossRef]
  32. Yang, Y.H.; Wu, J.C.; Zhao, S.W.; Mao, Y.P.; Zhang, J.M.; Pan, X.Y.; He, F.; van der Ploeg, M. Impact of long-term sub-soiling tillage on soil porosity and soil physical properties in the soil profile. Land Degrad. Dev. 2021, 32, 2892–2905. [Google Scholar] [CrossRef]
  33. Yang, S.; Feng, C.; Ma, Y.; Wang, W.; Huang, C.; Qi, C.; Fu, S.; Chen, H.Y.H. Transition from N to P limited soil nutrients over time since restoration in degraded subtropical broadleaved mixed forests. For. Ecol. Manag. 2021, 494, 119298. [Google Scholar] [CrossRef]
  34. Ma, Y.H.; Feng, C.; Wang, Z.C.; Huang, C.; Huang, X.Z.; Wang, W.J.; Yang, S.; Fu, S.; Chen, H.Y.H. Restoration in degraded subtropical broadleaved forests induces changes in soil bacterial communities. Glob Ecol Conserv. 2021, 30, e01775. [Google Scholar] [CrossRef]
  35. Wang, C.; Lu, X.K.; Mori, T.; Mao, Q.G.; Zhou, K.J.; Zhou, G.Y.; Nie, Y.; Mo, J. Responses of soil microbial community to continuous experimental nitrogen additions for 13 years in a nitrogen-rich tropical forest. Soil Biol. Biochem. 2018, 121, 103–112. [Google Scholar] [CrossRef]
  36. Mei, W.; Yu, G.; Lai, J.; Rao, Q.; Umezawa, Y. basicTrendline: Add trendline and confidence interval of basic regression models to plot. In R Package Version; R Foundation for Statistical Computing: Vienna, Austria, 2018. [Google Scholar]
  37. Huang, C.; Feng, C.; Ma, Y.H.; Liu, H.; Wang, Z.C.; Yang, S.B.; Wang, W.; Fu, S.; Chen, H.Y.H. Allometric models for aboveground biomass of six common subtropical shrubs and small trees. J. For. Res. 2021, 33, 1317–1328. [Google Scholar] [CrossRef]
  38. Klopp, H.W.; Arriaga, F.; Bleam, W. Influence of exchangeable sodium and clay mineralogy on soil water retention and hydraulic conductivity. J. Soil Water Conserv. 2020, 75, 755–764. [Google Scholar] [CrossRef]
  39. Shi, Y.C.; Hu, Z.Y.; Haneklaus, S.; Long, W.G.; Xia, X.; Zhao, Y.W.; Lin, T.; Schnug, E. Suitability of soil electrical conductivity as an indicator of soil nitrate status in relation to vegetable cultivation practices in the Yangtze River Delta of China. Landbauforsch Volk 2009, 59, 151–158. [Google Scholar]
  40. Zhang, M.; Wang, N.; Zhang, J.; Hu, Y.; Cai, D.; Guo, J.; Wu, D.; Sun, G. Soil Physicochemical Properties and the Rhizosphere Soil Fungal Community in a Mulberry (Morus alba L.)/Alfalfa (Medicago sativa L.) Intercropping System. Forests 2019, 10, 167. [Google Scholar] [CrossRef]
  41. Karagatzides, J.D.; Wilton, M.J.; Tsuji, L.J.S. Soil Nutrient Supply in Cultivated Bush Bean–Potato Intercropping Grown in Subarctic Soil Managed with Agroforestry. Sustainability 2021, 13, 8185. [Google Scholar] [CrossRef]
  42. Udawatta, R.P.; Kremer, R.J.; Adamson, B.W.; Anderson, S.H. Variations in soil aggregate stability and enzyme activities in a temperate agroforestry practice. Appl. Soil Ecol. 2008, 39, 153–160. [Google Scholar] [CrossRef]
  43. Li, Y.X.; Yu, P.J.; Shen, L.C. Soil Quality Assessment of Crop Rotations and Management Practices Based on Minimum Data Set and Soil Quality Indices in the Northeast Plain, China. Fresenius Environ. Bull. 2021, 30, 8749–8757. [Google Scholar]
  44. Deng, P.; Fan, W.; Wang, H.; Ti, J.; Xu, X. Chinese Torreya agroforestry alters the rhizosphere soil bacterial communities and potential functions. Appl. Soil Ecol. 2022, 177, 104504. [Google Scholar] [CrossRef]
Figure 1. Location of the study area and experimental design: (A) The study site is located in the Yingquan District of Fuyang City of Anhui Province, China; (B) Experimental design of pecan plantation.
Sustainability 14 10665 g001
Figure 2. Correlation of soil indices. * Significance of p < 0.05. ** Significance of p < 0.01. *** Significance of p < 0.001.
Sustainability 14 10665 g002
Figure 3. Correlation of soil indices. (A) Soil SQI accumulation map under different pecan agroforestry system; (B) Radar map of average membership degree of soil physical and chemical indexes.
Sustainability 14 10665 g003
Figure 4. Linear relationship between SQI-TDS and SQI-MDS.
Sustainability 14 10665 g004
Table 1. Basic physiochemical soil properties of Carya illinoinensis plots.
IndicatorsTN (g/kg)TP (g/kg)TK (g/kg)AP (mg/kg)AK (mg/kg)PHBD (g/cm3)MC (%)
Xinfeng Agricultural Park0.891.273.128.79178.78.121.6118.73
Table 2. Soil quality parameter membership function types.
IndicatorMembership Function TypeMembership Function
MCS-type membership function
(Factor has a positive effect on soil quality)
N = X i X i m i n X i m a x X i m i n
SP
AP
TP
NH4+-N
NO3-N
T
AK
TN
TC
Ca
Mg
pHInverse S-type membership function
(Factor has a negative effect on soil quality)
N = 1 X i X i m i n X i m a x X i m i n
EC
BD
Table 3. Soil physicochemical properties under different agroforestry patterns.
IndicatorsAgroforestry PatternCV
PPHPPSPPLCK
EC (ds/m)1.34 ± 0.02 b1.28 ± 0.01 a1.50 ± 0.03 c1.23 ± 0.0.02 a8.84
MC (%)18.32 ± 0.22 a19.78 ± 0.22 c18.60 ± 0.27 ab19.42 ± 0.56 bc6.14
BD (g/cm3)1.37 ± 0.03 a1.56 ± 0.02 c1.43 ± 0.02 b1.56 ± 0.02 c7.09
SP (%)47.63 ± 0.91 c40.63 ± 0.79 a44.53 ± 1.25 b41.15 ± 0.65 a8.99
AP (mg/kg)10.10 ± 0.40 c9.70 ± 0.42 c8.89 ± 0.38 b7.18 ± 0.56 a19.07
TP (g/kg)1.69 ± 0.03 b1.45 ± 0.15 b1.50 ± 0.10 b1.08 ± 0.07 a20.02
NH4+-N (mg/kg)0.73 ± 0.03 b0.41 ± 0.15 a0.38 ± 0.10 a0.18 ± 0.07 a70.08
NO3-N (mg/kg)2.21 ± 0.29 ab1.67 ± 0.14 a7.42 ± 0.57 c2.73 ± 0.20 b71.85
TK (g/kg)2.64 ± 0.19 a3.84 ± 0.37 b4.02 ± 0.23 b3.80 ± 0.20 b25.82
AK (mg/kg)217.44 ± 11.68 c220.65 ± 10.96 c79.15 ± 4.96 b54.55 ± 2.63 a14.49
TN (g/kg)0.81 ± 0.04 b0.92 ± 0.02 c0.86 ± 0.01 bc0.52 ± 0.05 a23.73
TC (g/kg)15.78 ± 0.34 c16.12 ± 0.19 c14.67 ± 0.14 b13.52 ± 0.20 a4.54
pH8.09 ± 0.11 a8.23 ± 0.02 a8.15 ± 0.02 a8.25 ± 0.02 a2.13
Ca (g/kg)13.31 ± 0.31 a15.16 ± 0.25 b12.82 ± 0.16 a15.25 ± 0.27 b9.33
Mg (g/kg)4.38 ± 0.10 a5.44 ± 0.07 b4.55 ± 0.05 a4.57 ± 0.09 a10.13
Note: There were significant differences in the one-way ANOVA of different compound patterns with different letters (LSD, p < 0.05).
Table 4. Explanatory power of total variance for the four selected principal components.
IndicatorsPrincipal ComponentTeamNormTDS
1234
BD−0.7760.3620.265−0.34011.907Yes
Ca−0.7690.419−0.2560.04111.897
TP0.7470.2880.036−0.16211.738
SP0.717−0.322−0.3510.29411.783
AP0.6030.4930.0620.17911.634
NH4+-N0.5970.158−0.260−0.40311.458
MC−0.5280.3220.1160.41411.395
AK0.4640.813−0.1780.08221.862Yes
Mg−0.3390.7650.3840.00421.709Yes
TC0.5420.7390.1020.14721.849
NO3-N0.224−0.6530.6010.10621.565
TK−0.296−0.0440.592−0.21731.065
TN0.5260.5440.5490.03531.717Yes
EC0.526−0.4340.5440.25731.623Yes
pH−0.4860.093−0.0740.67641.315Yes
Eigenvalue4.8163.5791.8491.205
Contribution of variance (%)32.10623.85912.3288.035
Cumulative rate of accumulated variance (%)32.10655.96568.29376.328
Table 5. Weight values of soil fertility indexes in TDS and MDS.
IndicatorsW (TDS)W (MDS)
EC0.0720.16
MC0.05
BD0.080.188
AP0.056
TP0.058
NH4+-N0.053
MC0.074
TK0.043
AK0.080.184
TN0.0760.169
TC0.076
pH0.0620.13
Ca0.073
Mg0.0740.169
SP0.072
Publisher’s Note: MDPI stays neutral with regard to jurisdictional claims in published maps and institutional affiliations.

