Article

Assessment of the Urban Expansion and Its Impact on the Eco-Environment—A Case Study of Hefei Municipal Area

1
School of Architecture and Urban Planning, Anhui Jianzhu University, Hefei 230601, China
2
School of Foreign Languages, Shandong University of Science and Technology, Qingdao 266510, China
3
School of Biology and Food Engineering, Fuyang Normal University, Fuyang 236037, China
*
Authors to whom correspondence should be addressed.
These authors contributed equally to this work.
Sustainability 2022, 14(17), 10613; https://doi.org/10.3390/su141710613
Submission received: 13 July 2022 / Revised: 20 August 2022 / Accepted: 22 August 2022 / Published: 25 August 2022
(This article belongs to the Special Issue Urban Landscape Ecology and Sustainability)

Abstract

:
With the advancement of urbanization, the ecological environmental changes caused by the continuous expansion of cities have become a major concern. Thus, this study is based on a remote sensing image map of Hefei city from 1984 to 2020, which is now in the process of rapid development. We constructed an index system with ecological land, ecosystem service value, ecological environment quality, urban land expansion coefficient, urban heat island rate index, total pollutant emissions, ecological pressure, and ecological deficit, and then evaluated the ecological environment of Hefei city with the help of the entropy weight comprehensive evaluation method. The results show that (1) in the positive evaluation index, the ecological land area was reduced to half of the original area, the ecological service value was reduced by 0.37 times its initial value, and the eco-environmental index was <35 and still decreasing. (2) In the negative evaluation index, the urban heat island ratio index increased by nearly 10 times its initial value, the total emission of various pollutants increased by 6.64 times its initial value, the ecological deficit increased year by year after 1999, and the ecological pressure in 2020 increased to 3 times that in 1999. (3) The overall environmental score of the Hefei urban area has decreased by 48.6 times its initial value. The values of positive evaluation indexes are decreasing, whereas the values of negative evaluation indexes are increasing, and both these items are moving backward, leading to the decrease in the comprehensive ecological environmental score. It can be noticed that the urban expansion of Hefei has had a severe impact on the ecological environment, resulting in the continuous reduction in the ecological land area, a serious urban heat island effect, and continuous weakening of regional ecological service functions. The study results can be used for reference in alleviating the impacts of urban expansion on the environment, promoting the optimization of the urban landscape and the sustainable development of the social economy and environment.

1. Introduction

The continuous expansion of cities and the impact on the ecological environment has become an important element in the study of global environmental changes. Along with the significant spatial expansion of cities and the conversion of land types, the structure, function, and pattern of cities [1,2] change, which can lead to changes in the ecological environment. For example, some studies suggest that the expansion of cities leads to increased pollutant emissions and reduced ecosystem resilience [3,4], which are important factors leading to the poor ecological environment of cities in developing countries such as China, India, and Laos [5,6,7]. It is estimated that China’s urbanization rate will reach 70% in 2035 and 80% in 2050 [8]. By then, as urbanization continues, the impact of urban expansion on the ecological environment will continue, which is a more complex issue for most developing regions regarding how they should face this environmental degradation.
Research on the impact of urban spatial expansion on the ecological environment has received much attention. In previous studies, the evaluation was mainly based on unilateral index evaluation, such as the evaluation and analysis from the perspective of the landscape pattern index [9], land use change [10], and urban surface temperature [11] with the help of 3S technology; however, in reality, the impact of urban expansion on the ecological environment is very complex and strongly variable, and is difficult to evaluate by individual indexes. The international community has some comprehensive ecological evaluation models for the ecological environment, such as the remote sensing-based ecological index (RSEI) [12], eco-environmental effects of urban sprawl (EEUS) [13], and other models. Based on remote sensing and spatial analysis techniques, ecological environment quality evaluation indexes are selected and a comprehensive evaluation method is used to quantitatively evaluate the impact of urban spatial expansion on regional ecological environment changes. Some scholars have also constructed models to evaluate the impact of urban spatial expansion on regional natural geographic and environmental elements and natural disasters and the analysis and evaluation of their resource and energy effects with the help of officially released socioeconomic statistics [14,15]. However, these methods also have certain limitations and cannot highlight the impact of urban spatial expansion on the dynamics of the ecological environment, and these methods also ignore the ecological indicators with large differences in values. The entropy-weighted comprehensive evaluation method is a more widely used comprehensive evaluation method [16,17], and is more objective compared to other comprehensive evaluation methods because it determines the indicator weights based on the changes in the indicators. In addition, current research still focuses on cities that are already relatively developed, while less research has been conducted on rapidly expanding cities. If such urban expansion and environmental changes are evaluated and defined, it can help fast-growing cities such as Hefei, in China and Pushkar in India protect the local environment in their future development, constituting a reference value for future urban planning.
Therefore, taking as an example the Hefei municipal area in China, which has been rapidly urbanized in recent years, and combining eight remote sensing images from 1984 to 2020 and social development data from government statistics, the entropy weight method was used to construct a comprehensive evaluation index system, with ecological land, ecosystem service value, ecological environment quality, urban land expansion coefficient, urban heat island rate index, total pollutant emissions, ecological pressure, and ecological deficit as evaluation indexes. The analysis was conducted to ensure that the possible impacts of urban expansion on the urban environment of Hefei can be comprehensively analyzed in terms of resources, environment, ecosystem service capacity, ecological security, and other aspects. This study provides new evidence for the ecological and environmental changes caused by urban expansion, and provides a theoretical reference for ecological environment protection in developing countries such as China.

2. Materials and Methods

2.1. Study Area

As of 2020, Hefei has a total area of 11,445.1 km2 and a built-up area of 528.5 km2. Its total population is 8.189 million, and its urbanization rate is as high as 76.33% [18]. Hefei is located in the middle and lower reaches of the Yangtze River in China and belongs to the Jianghuai region, located northwest of Chaohu Lake, as shown in Figure 1. The Feixi River is around the center of the city, and the land has a subtropical humid monsoon climate [19]. Its economic development, political status, and education popularization occupy a leading position in Anhui Province, China. Hefei is also the main transportation and communication hub in the middle and lower reaches of the Yangtze River. With the growing demand for the economic development of the middle and lower reaches of the Yangtze River and Anhui Province in China in recent years, the urban space of Hefei keeps expanding, leading to some major changes in the urban land structure and certain impacts on the environment. Hefei is a relatively developed city in the middle and lower reaches of the Yangtze River, and it is also a sub-central city in the region [20], with an important position in the ecological aspect. Hence, the environmental situation of Hefei has an important impact on the environment of the middle and lower reaches of the Yangtze River and even China as a whole. The study of urban expansion and its ecological and environmental benefits is of great significance to regulate the blind expansion of urban construction land and safeguard the regional environment.

2.2. Data Source and Landscape Information Extraction

This study is based on the fall data of remote sensing images of the Landsat series, including the following years: 1984, 1989, 1994, 1999, 2004, 2009, 2014, and 2020. The remote sensing image data of the first six periods were recorded by Landsat 5, and 2014 and 2020 were recorded by Landsat 8, with resolutions of 30 and 15 m, respectively, meeting the research requirements. The analysis was also conducted with the help of relevant socioeconomic statistics and aided by software such as ArcGIS and ENVI.
According to the current land use classification system [21], the surface landscape types were classified into five categories—construction land, forest land, water area, cultivated land, grassland, and unused land—by combining the actual situation of regional land use and remote sensing image maps. The supervised classification results are shown in Figure 2. Several local high-definition image maps were selected for sampling and verification, and the kappa coefficient and image classification accuracy of the land use classification maps were >80% and 90%, respectively, meeting the classification accuracy requirements of this study.

2.3. Comprehensive Evaluation Method Based on Entropy Weight Method

The entropy method is determined according to the degree of variation of the index value, which is an objective empowerment method and avoids the bias caused by human factors [22]. The numerical gap between the various indicators in this study is large, so the entropy weight method was used.
Through the entropy weight method, we selected appropriate indicators and constructed an evaluation index system to comprehensively evaluate the urban ecological benefits of Hefei. The positive indicators of ecological benefits are ecological land area (ELA), ecosystem service value (ESV), and eco-environmental index (EI). The negative indicators include urban land expansion coefficient (K), urban heat island ratio index (URI), total pollutant emission (PE), ecological pressure (EP), and ecological deficit (ED), as shown in Figure 3.
The extreme value method was used to conduct dimensionless treatment of the data, and then the weight of each index was obtained through the entropy weight method. Finally, the contribution degree of each index was multiplied by the weight and summed to obtain the comprehensive score. The calculation formula is as follows:
(1)
Proportion
P ij = x ij i = 1 n xij
where Pij is the contribution degree, Xij is the dimensionless processed data, i is the year, and j is the index [23].
(2)
Information entropy of the system
e j = 1 ln   n i = 1 n P ij ln P ij
where ej is the information entropy of the system.
(3)
Weight of each index
w j = 1 ej n j = 1 n ej
where wj is weight value of index.
(4)
Comprehensive score of the eco-environment.
S = j = 1 m w j P ij
where S is the comprehensive score. According to Equations (1)–(3), the weight vector of m targets can be obtained. The weight values and proportion values of each index are shown in Table 1.

2.4. Calculation Method of the Positive Indicators

2.4.1. Ecosystem Service Value

Based on the equivalent coefficient table for ESV per unit area of terrestrial ecosystem in China [24,25], combined with the economic value of natural food production of farmland in Hefei, the ecosystem service value coefficients of each landscape type in Hefei were estimated: forest land 851,668/km2, grassland 282,011/km2, arable land 269,157/km2, water area 1,790,617/km2, and unused land 16,359/km2. Due to the special nature of construction land, its ecosystem service value is not estimated for the time being. The specific ecosystem service value coefficients are shown in Table 2.
The value of ecosystem services is calculated as follows:
ESV = i = 1 n ( D i × S i )
where ESV is the ecosystem service value; i and n are the landscape type and quantity in the region, respectively; Di is the ecosystem value coefficient of the ith landscape type; and Si is the area occupied by the ith landscape type [26,27,28].

2.4.2. Eco-Environmental Index

The eco-environmental index model is a standardized model proposed by the Chinese Environmental Protection Department to evaluate the ecological environmental status in China. According to the eco-environmental index model, the ecological environmental quality of Hefei is evaluated based on the ecological environmental status of the region [29]. The calculation formula is as follows:
EI = 0.25 × BI + 0.2 × VI + 0.2 × WI + 0.2 × 100 LI + 0.15 × PI
BI = 0.35 × S forest   land + 0.21 × S grassland + 0.28 × S water   area + 0.11 × S cultivated   land + 0.01 × S unused   land + 0.04 × S building   land / S Hefei
VI = 0.38 × S forest   land + 0.34 × S grassland + 0.19 × S cultivated   land + 0.07 × S building   land + 0.02 × S unused   land ) / S Hefei
WI = S water   area / S ( Hefei )
PI = 0.4 × 100 1.726 × EM SO 2 / S Hefei + 0.4 × 100 0.53 × EM COD / P + 0.2 × ( 100 2.425 × EM solid   waste / S Hefei )
LI = Aero × 0.05 × S mild   erosion + 0.25 × S moderate   erosion + 0.7 × S severe   erosion / S Hefei
EI is the eco-environmental index, BI is the biological abundance index, VI is the vegetation cover index, WI is the water density index, PI is the environmental quality index, LI is the land degradation index, S refers to an area, EM refers to emission, and P refers to annual precipitation.
Aero is the normalization coefficient of the land degradation index, and the degree of soil erosion [30] can be determined according to the soil erosion index table of the Ministry of Water Resources, that is, by overlaying the vegetation coverage map and slope map. According to the current situation of the study area, the fractional vegetation cover percentages are >75, 60–75, 45–60, 30–45, and <30, which are rated as 1, 2, 3, 4, and 5, respectively. The areas with slopes <5°, 5–8°, 8–15°, 15–25°, and >25° are graded as 1, 2, 3, 4, and 5, respectively. Then, the two maps after grading are added, and the obtained value is the basic data of soil erosion degree grading. The values of 2, 3, 4, 5, and 6 are classified as mild erosion; 7 and 8 are classified as moderate erosion; 9 and 10 are classified as heavy erosion. The soil erosion indicators are shown in Table 3.
According to the Technical Specification for Eco-environmental Quality Assessment [31], the index is divided into the following five grades, as shown in Table 4.

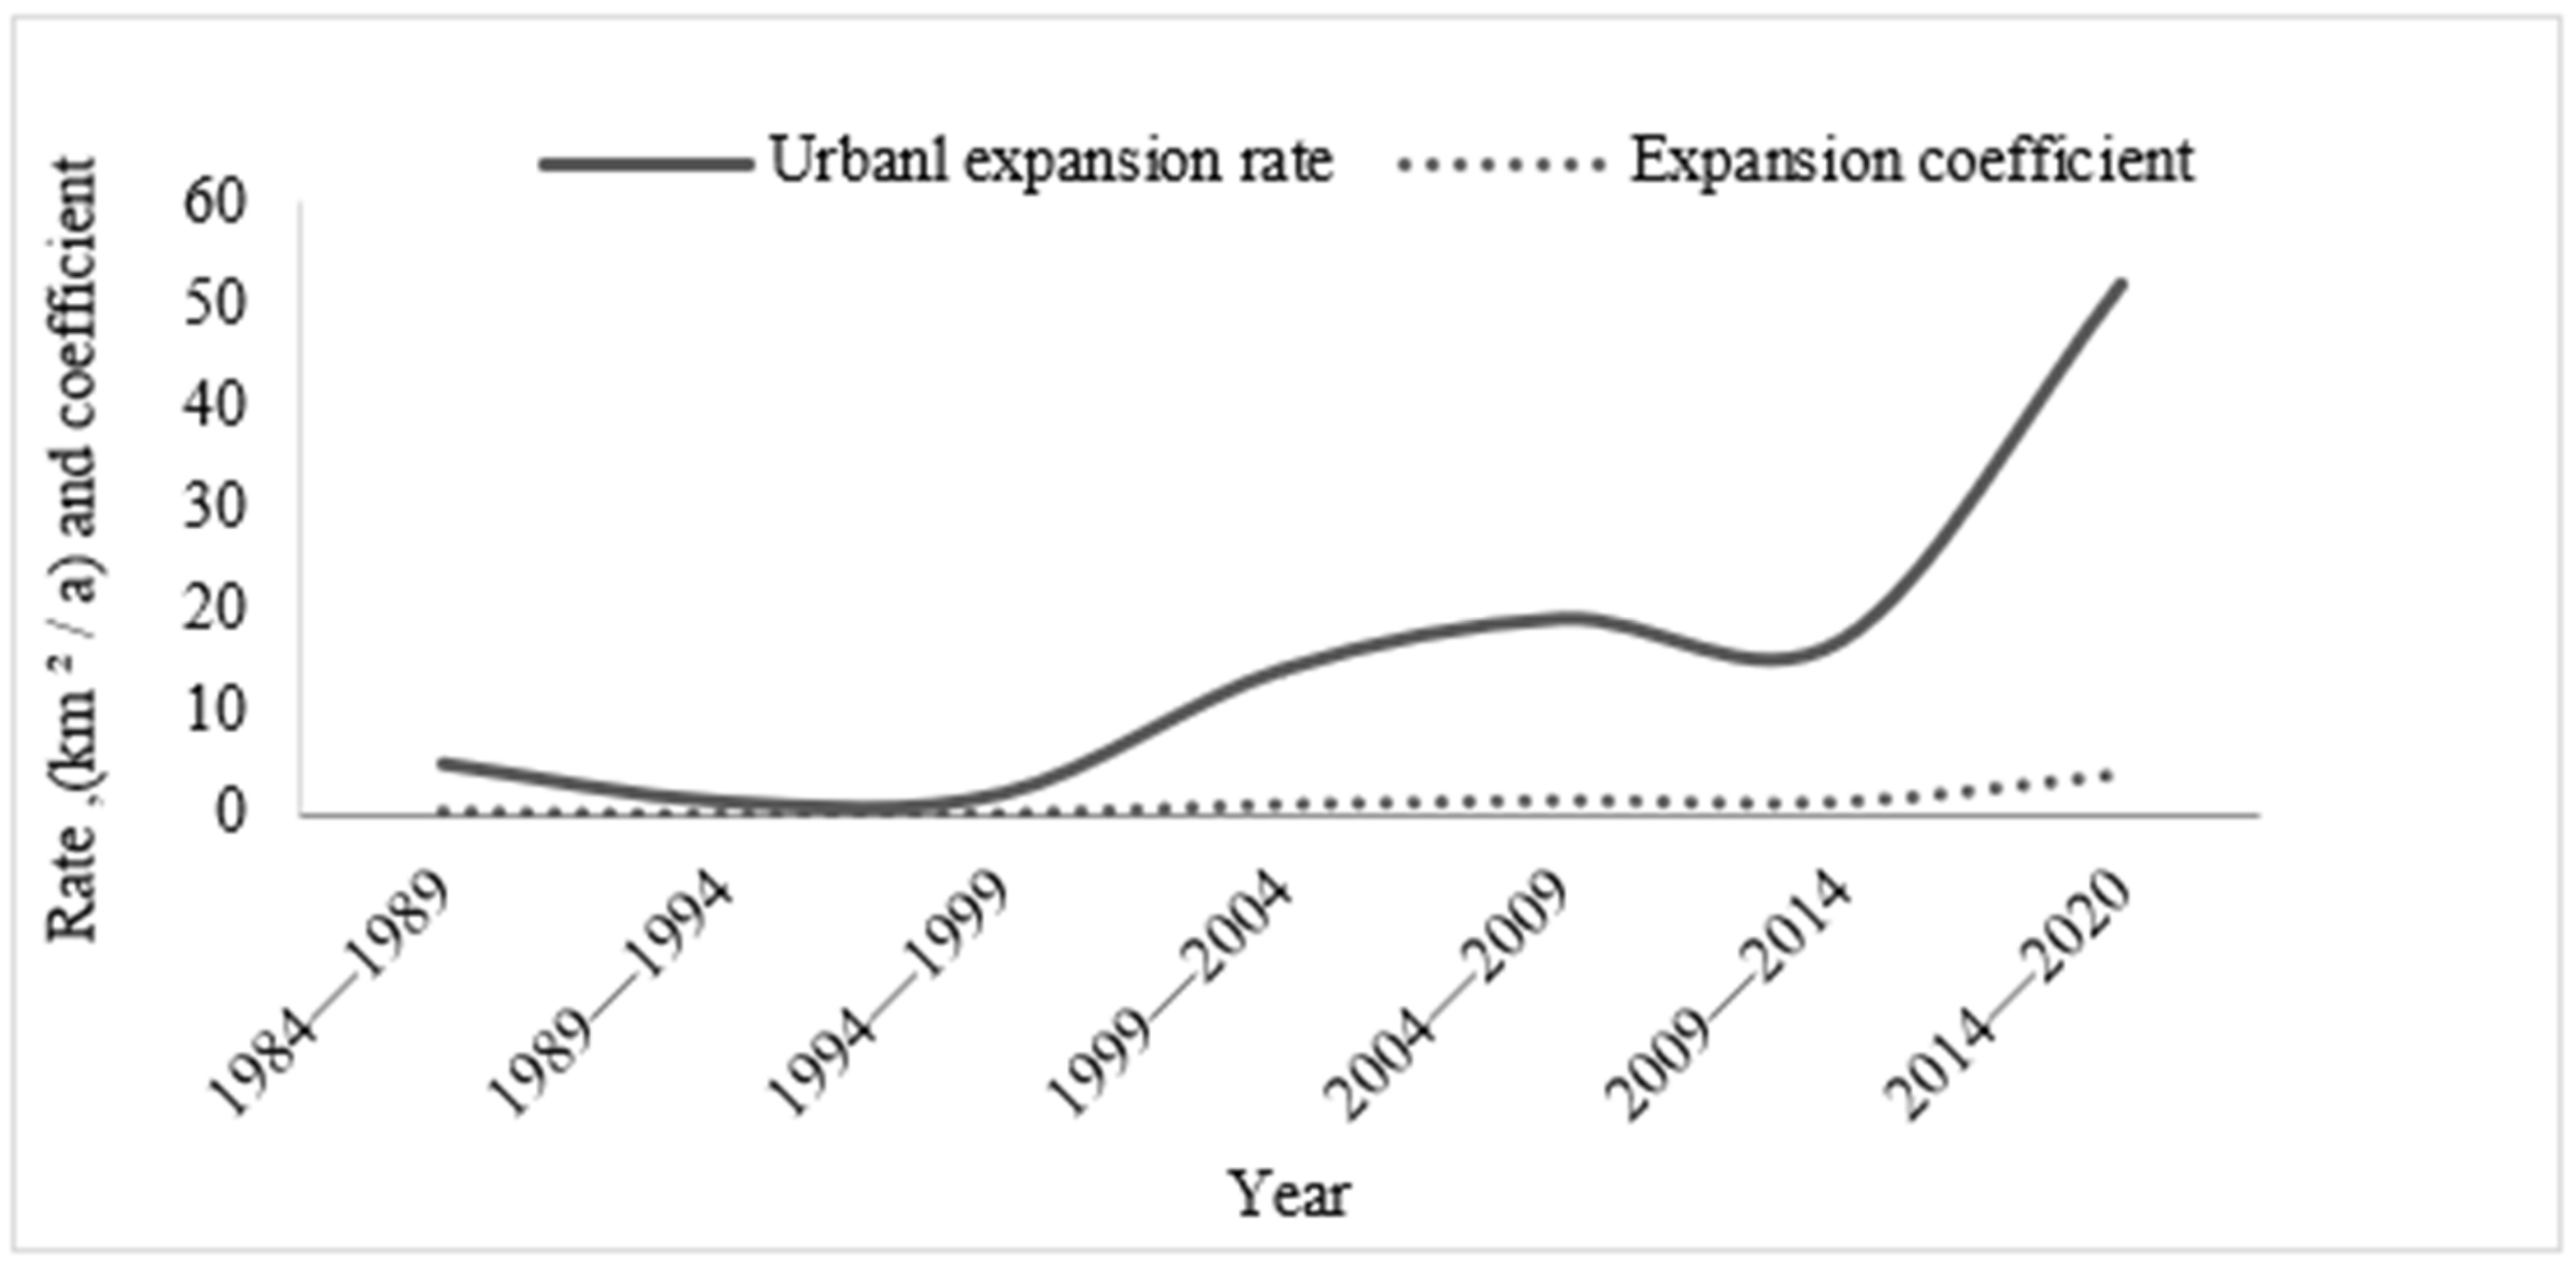
2.4.3. Urban Land Expansion Coefficient

The urban land expansion coefficient can be used to determine whether the expansion speed of the construction land within the city is reasonable.
K = V/UPR × 100%
V = Δ A / Δ t
K is the expansion coefficient of urban land, V is the urban expansion rate, and UPR is the average annual growth rate of the urban population. When the value of K is closer to 1.12, the urban land scale expansion tends to be more reasonable; when the value of K is greater than 1.12, the expansion is too fast; and when the value of K is <1.12, the expansion is too slow [32].

2.4.4. Urban Heat Island Ratio Index

The urban heat island ratio index shows the areas of the city that are affected by the heat island effect, which are significantly warmer than the rest of the region and seriously affect the quality of the ecological environment. The steps of urban surface temperature inversion are as follows.
With the help of thermal infrared band data in remote sensing images, the single window algorithm with high accuracy is used in the research [33,34]. At the same time, for Landsat TM and OLI remote sensing image data, the inversion formulas are different:
(TM) TS = K2/ln(K1/B(TS) + 1) − 273.15,
(OLI) TS = [a × (1 − C − D) + (b × (1 − C − D) + C + D) × T6-D × T 6]/C − 273.5.
For different types of image data, K1 and K2 values also vary (please refer to the data header file). B (TS) is the thermal infrared radiation brightness value, and a and b values are constants. For the specific case of the Hefei municipal area, a = −67.35535, b = 0.458606 [35], T6 is the satellite brightness temperature of TM6, Ta is the average atmospheric action temperature in the local actual situation, and C and D are the intermediate variables, calculated as follows.
T 6 = K 2 / ln 1 + K 1 / b 1 ,
B TS = b 1 lu τ   × 1 ε × ld / τ ε ,
C = τ × ε  
D = (1 − τ) × [1 + τ × (1 − ε)].
where b1 is the thermal infrared radiation calibration value, ε is the surface-specific radiation rate [36], lu is the radiant intensity of the upward atmosphere, τ is the atmospheric transmission, and ld is the radiant intensity of the downward atmosphere (data source: http://atmcorr.gsfc.nasa.gov/, accessed on 12 March 2021).
ε is closely related to the normalized difference vegetation index (NDVI), which is the normalized vegetation index.
Surface emissivity on the natural surfaces is calculated as follows:
ε = 0.9625 + 0.0614 × FVC0.0461 × FVC × FVC
Surface emissivity on the town surface is calculated as follows:
ε = 0.9589 + 0.086 × FVC−0.0671 × FVC × FVC
FVC = (NDVI − NDVIS) / (NDVIV − NDVIS)
The FVC indicates the fractional vegetation cover [37]. NDVIv represents the NDVI value when the site is completely covered by vegetation, whereas NDVIS represents the NDVI value when the site is bare. These two values need to be determined according to the actual situation of different years.
URI = 1 100   m i = 1 n w i × p i
where URI is the urban heat island ratio index [38]; m is the normalized grade index, the equal series of temperature classification; i and n are the target temperature grade and grades within the urban heat island, respectively; w i is the weight value, taking the grade i value; and p i is the percentage of grade i area.

2.4.5. Ecological Deficit and Ecological Pressure

Ecological deficit and ecological pressure can satisfactorily show the impact of human activity on the ecological environment in cities. The formulas are as follows:
EF = j = 1 6 r j × i = 1 n c i / p i
EC = J = 1 6 a j × r j × y j
ED = ed × N = ( EF EC ) × N
EP = EF / EC
where EF is the per-capita ecological footprint, j is an ecologically productive land type, i is the type of goods and inputs consumed,   r j is the equilibrium factor, c i ,   p i are the per-capita consumption of the ith consumer goods and its global average productivity, EC is the per-capita ecological carrying capacity, aj is the per-capita ecological productive land area, yj is the yield factor, the values of r j and y j refer to previous research results, ed is ecological deficit or profit, ED stands for the total ecological deficit, and EP is the ecological pressure [39,40].
ED is an important indicator to measure the level of the ecological carrying capacity of a region [35]. If ED > 0, it is an ecological deficit, indicating that the ecological trace of the region exceeds its ecological carrying capacity and the regional ecosystem is unsafe. If ED < 0, it is ecological profit and loss, which indicates that the ecological carrying capacity of the region exceeds the ecological footprint, and the regional ecosystem is relatively safe.
EP is an important index to observe regional ecological risk, which can quantitatively reveal the differences in regional ecological risk in time and space. The ecological risk is divided into the following five levels according to the range of T value: if the value is >1, the ecological risk is extremely high; 0.8–1.0, high risk; 0.6–0.8, medium risk; 0.4–0.6, low risk; <0.4, extremely low risk [41,42].

3. Results

3.1. Analysis of Positive Indicators of Eco-Efficiency

3.1.1. Ecological Land

Ecological land refers to the land type with an ecological service function. According to the specific situation of the study area and the existing classification methods of ecological land in China, the types of ecological land in the study area can be divided into forest land, cultivated land, water area, grassland, and unused land [43]. As shown in Figure 4, the ecological land within the jurisdiction of Hefei has decreased significantly from 1194 to 602 km2, of which grassland and cultivated land decreased the most by 318.71 and 258.42 km2, respectively. During this period, the area of construction land increased sharply until it exceeded the area of ecological land. In the past 36 years, a total of 592 km2 of ecological land was transformed into construction land. As shown in Figure 3, most of the construction land was originally cultivated land and grassland. The aforementioned situation made the ecological service function of the land in the urban area of Hefei decline sharply and the ecological regulation function weaken, which will inevitably threaten the urban environment and ecological security.

3.1.2. Ecosystem Service Value

As shown in Table 5, the value of ecosystem services in the Hefei municipal area fluctuated and decreased with time. During the study period, the value of ecosystem services decreased from USD 487.75 million to USD 309.42 million, with an average annual decrease of USD 4.95 million. At the same time, the service value of each landscape type also changes to some extent. Among them, the ecosystem service value of grassland decreased the most, by USD 59.73 million, and the proportion decreased from 25.4% to 6.98%, which indicates that the supply position of grassland ecosystem service value in the whole ecosystem is gradually declining. In addition, although the service value of forest land and water area is barely decreasing or changing, the proportion is increasing, from 7.24% and 34.26% to 11.85% and 47.30%, respectively, indicating that the supply position is improving and gradually tends to be dominant.
By observing the landscape distribution map, it can be noticed that the aforementioned changes are mainly caused by the following: ① in the process of urban expansion, a large number of cultivated land and grassland are occupied, resulting in the decline in the service value of cultivated land and grassland. ② The service value of forest land increased first and then decreased because the newly built Hefei Binhu National Forest Park and other wetland parks increased the area of forest land and then decreased the service value because of the continuous expansion of the city. ③ The supply of water service value increases and tends to dominate, mainly because the water area covers a large area in the jurisdiction of Hefei, and the area change is small during the study period. Therefore, when the overall ecological service value decreases, the proportion of water service value can rise.

3.1.3. Eco-Environmental Index

It can be observed from Table 6 that in the past 36 years, the biological abundance index and vegetation coverage index in the region have shown decreasing trends. The main reason is that the rapid expansion of construction land has occupied the grassland, forest land, and cultivated land that contribute greatly to the biological abundance and vegetation coverage, resulting in the reduction in the two indexes by 0.38 and 0.41 times their initial values; the rest of the indexes barely changed. The aforementioned index changes resulted in the continuous reduction in the eco-environmental index. As shown in Table 4, the Hefei municipal area is always at the bad level, which is not the best ecological quality for human habitation, mainly because the urban expansion occupies the land, resulting in the reduction in green space and land degradation, while the increase in population and the need for economic development lead to an increase in the emission of various pollutants.

3.2. Analysis of Negative Indicators of Eco-Efficiency

3.2.1. Urban Land Expansion Coefficient

According to Figure 5, it can be clearly seen that the expansion rate of urban space in Hefei city shows obvious phase characteristics, first slowly decreasing, then dramatically increasing, then having a slight decrease and finally a sudden increase, in chronological order: In the low-speed expansion phase from 1984 to 1989, the expansion rate was 5 km2/a; in the slow expansion phase from 1989 to 1999, the average expansion rate and expansion intensity index were 1.9 km2/a; in the rapid expansion period from 1999 to 2014, the average expansion rate of urban construction land was 18.1 km2/a; in the period from 2014 to 2020, the expansion reached 51.8 km2/a. The phase characteristics of the expansion coefficient and the expansion rate are relatively similar, and before 1994 are much smaller than the critical value of 1.12, indicating that the expansion of the Hefei city area is slow. Between 1994 and 1999, the expansion coefficient value is close to 1.12, which is more reasonable, after which the expansion rate accelerates, far exceeding 1.12, indicating that the expansion is too fast and unreasonable. In general, from 1984 to 2020, the construction land area of Hefei city expanded dramatically, from 90 km2 to 681 km2, which is 7.58 times that of the original area, with an average annual expansion rate of 16.42 km2/a and an expansion coefficient of 2.83, which are too fast and unreasonable.
Exploration has revealed that after Hefei broke through the 2005 master plan index, the preparation of the Hefei City Master Plan (2006–2020) [44] was completed, and in the subsequent period, according to the new master plan requirements, the Hefei city urban area has entered a state of rapid expansion.

3.2.2. Urban Heat Island Ratio Index

According to the actual situation of the surface temperature in the study scope, the surface temperature is divided into seven grades by the natural breakpoint method, as shown in Table 7.
The area of surface temperature and the proportion are calculated through the inversion data. The high-temperature area and highest-temperature area represent the range of the urban heat island, which is substituted into the formula to calculate the proportion index of the heat island, as shown in Table 6.
During the study period, the high-temperature area and highest-temperature area in the study area increased by 9 times their initial values, and the URI increased from 0.03 to 0.32, which is a 10-fold increase. The urban heat island effect was severe, and the regulation of surface temperature was out of balance.
According to Figure 6, comparing the landscape pattern map and surface temperature in the same year, it can be seen that different temperature zones and different landscape land types, such as the high-temperature zone and highest-temperature zone, are mainly distributed in the built-up area of Hefei. Moreover, the temperature difference in the suburban area is large, where the highest-temperature zone is mainly distributed in the Shushan Economic Development Zone, the Baohe Industrial Zone, etc., which have a large proportion of construction land and little green land and water. The lowest-temperature zone and low-temperature zone are mainly distributed in waters and woodlands, such as the area surrounding Chaohu Lake, Dashu Mountain, and cultivated land in suburban areas. In addition, it can also be found that the diffusion of construction land and surface temperature in Hefei has a certain consistency from the central city surrounded by the Inter River to the four sides, mainly to the southwest and southeast, and the city center shifts to the south, so it can be inferred that the urban heat island effect is positively related to the extent of urban construction land.

3.2.3. Urban Pollutant Discharge

The discharge of urban pollutants can more clearly reflect the impact of human activities and urban development on the ecological environment. To examine the relationship between urban expansion and ecological environmental changes, we used the area of construction land as the independent variable and the emission of pollutants as the dependent variable. During the period from 1999 to 2020, the emissions of urban pollutants showed a phase escalation with the continuous expansion of construction land. As shown in Figure 7, the emissions of ammonia nitrogen and industrial soot dust remained unchanged, but the emissions of urban domestic sewage increased to 2.77 times the original amount, and the emissions of industrial waste gas increased by 4 times the original amount. In addition, the emissions of sulfur dioxide show a decline, decreasing by 1.5 times the original amount. Meanwhile, according to the figure, the emission of pollutants has certain stages, and the stages of different pollutants have a high degree of similarity. For example, industrial solid emissions before the area reached 371 km2 increased rapidly with the increase in land area, reaching 29,300 tons/km2, after which the speed slowed down to 0.86 million tons/km, and the emissions of urban domestic sewage and industrial waste gas were highly similar. The reason is because Hefei proposed the Hefei City Air Pollution Prevention and Control Act Plan in late 2013 and established the Hefei Environmental Protection Committee in 2014 to study and develop major environmental protection measures and review the ecological master plan situation within the city. These policies or measures have aided in curtailing pollutant emissions in the area surrounding the city of Hefei after 14 years.

3.2.4. Ecological Pressure and Ecological Deficit

In Table 8, it can be observed that during the period from 1999 to 2020, the per-capita ecological footprint of the region increased by a total of 0.66 times its initial value, whereas the per-capita ecological carrying capacity decreased by half. The contradictory changes in these two indicators led to the rising per-capita ecological deficit and ecological stress index, which increased by 0.68 and 3 times their initial values, respectively. According to the evaluation criteria of ecological deficit and ecological stress index, during the study period, the ecological deficit was always greater than 0 and increased year by year, indicating the dangerous ecological situation of the Hefei municipal district. As the per-capita ecological stress index is much greater than 2, the ecological stress is too high, and the Hefei municipal district is at extremely high ecological risk. Because of the increasing population in the region, the total ecological footprint and ecological carrying capacity of the Hefei area have increased to 3.5 and 1.2 times their initial values, respectively, and the ecological deficit has increased from 1,854,513.1 to 7,108,753.3. The ecological risks of this region are also gradually increasing.

3.3. Comprehensive Evaluation Results

The evaluation system was constructed with the aforementioned indicators, the weight and proportion values of each indicator were obtained and calculated (29), and the comprehensive score for each year was calculated. The final results are shown in Table 9.
The comprehensive score of Hefei’s environment decreased from 0.397 to 0.008, a decrease of 48.6-fold, which indicates the continuous decline in Hefei’s environmental quality, and this decline is the largest from 2014 to 2020.

4. Discussion

4.1. Selection of Evaluation Index

In the study of urban expansion, many scholars are studying the structure of cities, such as Yu et al. (2022), who proposed a framework of an assessment process of polycentric structure based on spatial distribution and interaction [45], but did not propose how the development and change in urban structure caused changes in the local ecological environment. Camille et al. (2020) started to study the changes in the ecological environment with the change in urban structure [46], and found that the type of urban structure influences the environmental conditions of cities, especially the irrational expansion of cities, which may seriously lead to the deterioration of the urban ecological environment [47,48].
Therefore, we explored the changes in the ecological environment from the perspective of urban surface land-use type. To avoid the singularity of the experiment, the selection of indicators takes into account many aspects related to the urban environment, such as urban pollutant emissions, population, resource output, and urban surface temperature. In the study of positive indicators, not only land-use changes are taken into account, but also pollutant emissions, regional slope, regional consumption capacity, population, etc. For example, the urban expansion coefficient was chosen to determine the urban expansion by combining urban population and urban construction land, and the ecosystem service value coefficient was calculated by using the 2020 food prices and land types. The constructed evaluation system provides a reference basis for macroeconomic control of the urban environment and urban planning and makes the evaluation results more comprehensive and fairer.

4.2. Impact of Urban Expansion on the Ecological Environment

The study of the impact of urban expansion on the ecological environment highlights the impact of human development on the ecological environment. The continuous expansion of cities leads to the deteriorating condition of the urban environment year by year. During the study period, 592 km2 of ecological land was converted into construction land, the total value of regional ecosystem services decreased from USD 487.75 million to 309.42 million, and the eco-environmental index also kept decreasing, which shows that the situation of construction land encroaching on ecological land is critical, especially the decrease in grassland and arable land with high ecological functions [49], which make up the regional biodiversity. This is similar to the findings of Yang and Rotich et al., that urban expansion leads to a reduction in biodiversity and vegetation cover in the region, ultimately leading to a reduction in the supply of urban ecosystem services and a deterioration in the quality of the ecological environment [50].
At the same time, the increase in population, the decrease in ecological land, and the acceleration of urbanization have led to a 6.64-fold increase in total urban pollutant emissions, a 10-fold increase in the heat island ratio index, and an increase in ecological pressure and ecological deficit per capita to 35.685 and 2.444, respectively, in Hefei. The industrial wastewater, urban domestic sewage, industrial waste gas, and industrial solid waste emissions in the city increased 0.1, 1.77, 4, and 8 times their initial values, respectively, showing a positive correlation with the expansion of the construction land area, indicating that the expansion of the city and the increase in industrial land led to the intensification of environmental pollution. The comparison of the spatial distribution of surface temperature and the landscape classification map revealed the spread of construction land and the high-temperature zone. The spread shows a high similarity. The area of the construction site is too large for fertilization, and Dimitra, Mizbah, and other scholars mentioned that the main constituents in the construction land, such as concrete, asphalt, and other impermeable materials, absorb heat quickly and have a small specific heat capacity, and warm up faster than the natural sub-base [51,52]. Moreover, the green space system within the urban area is underdeveloped, and the distribution of green space is scattered within the jurisdiction of Hefei and cannot be systematically linked, making it difficult to mitigate the urban heat island effect. At the same time, the increasing ecological pressure and ecological deficit indicate that with the economic development and urbanization process, the human impact on the ecological environment is expanding, and the ecological carrying capacity is broken but decreasing. This results in the difficulty in regulating the impact caused by humans on the environment, giving rise to ecological security problems, excessive ecological pressure, and extremely high and rising ecological risk.

4.3. Importance of Hefei’s Development

The city of Hefei has urbanized at a fast pace and has been able to continuously absorb the population of the surrounding areas, making the urban population grow significantly, which has now exceeded 70% [53], as shown in Figure 8. This is still far from developed cities. Using the data of developed countries instead of the standard of developed cities, as of 2020, the data of GDP per capita, urbanization rate, and Engel coefficient of developed countries are >USD 46,350, >80%, and <30%, respectively, while those of Hefei are USD 18,784, 76.33%, and 33.8%.
The rapid urbanization of Hefei is related to its special position, as Hefei is located in the middle of China. The rise of central China is crucial to China, and Anhui Province needs a city as its representative, so the development of Hefei is fundamental to China’s development. For a provincial capital in an area such as Anhui Province, which does not have too many characteristics, the only way to create a “star city” is to implement a strong provincial capital strategy. This is the right choice for the capital of Anhui Province. Only through the implementation of the strategy of strengthening the provincial capital and creating a star city can the development of the prefecture-level cities in Anhui Province be stimulated. By studying the ecological impact of Hefei’s urban expansion and how to preserve the environment in the process of urbanization, we can guide other areas in the Yangtze River Delta region and even the rapidly expanding cities in the world [54].

4.4. Limiting Factors

This study has some limitations. Firstly, we examined a long period of time, and we can clearly see the evolution of urbanized Hefei, but this also leads to the low resolution of the obtained Landsat series remote sensing images, which has some influence on the land classification and surface temperature inversion. The second limitation is that some indicators that can adequately evaluate the state of the urban ecological environment are not available or cannot be described quantitatively due to some missing data, such as the carbon sequestration and humidification capacity of vegetation in the whole city, thus leading to some limitations of the study. Finally, this study only considered the rate of urban expansion, while the urban structure in the process of urban expansion was not included in the evaluation system because it could not be quantitatively described. However, the impact of urban structure on the ecological environment is not small, and it can be realized by regulating the distribution and size of various types of land. Future research would benefit from a comprehensive evaluation of the ecological environment of Hefei, China, for more in-depth studies, including the use of higher-resolution remote sensing imagery, and the use of more accessible indicators. We hope that in the future, there will be ways to quantify the urban structure and use it in research.

5. Conclusions and Outlook

In this study, we constructed an evaluation index system from ecological land area, ecosystem service value, eco-environmental index, urban land expansion coefficient, urban heat island proportion index, total pollutant emissions, ecological pressure, and ecological deficit and comprehensively evaluated the impact of urbanization expansion on the ecological environment with the help of the entropy weight method. The results show that the ecological land area in the positive indicators decreases from 1194 to 602 km2, the value of ecosystem services decreases from USD 487.75 million to 309.42 million, and the eco-environmental index decreases by 0.03. In the negative indicators, the urban expansion coefficient increases to nearly 10 times its initial value. The heat island ratio index also increases from 0.03 to 0.32, the pollutant emission increases by 6.64 times its initial value, and the ecological pressure and ecological deficit increase to 3.1 and 3.85 times their initial values, respectively. The decrease in positive indicators and the increase in negative indicators in the evaluation system finally lead to the decrease in the overall ecological environmental score of Hefei from 0.397 to 0.008.
As a subcenter city of the Yangtze River Delta urban agglomeration in China, Hefei city has been developing rapidly in recent years. This study can provide a quantitative basis for optimizing the existing urban construction pattern and future sustainable development construction, improving the ecological environment of urban green space, and effectively improving the quality of people’s living environment.

Author Contributions

Conceptualization, X.Y. (Xiaojie Yao) and C.O.; methodology, X.Y. (Xiamei Yao) and Y.C.; software, Y.C.; validation, Y.C.; formal analysis, Q.Z.; investigation, X.Y. (Xiamei Yao); data curation, X.Y. (Xiamei Yao); writing—original draft preparation, Y.C. and X.Y. (Xiamei Yao); writing—review and editing, C.O.; visualization, Z.M.; supervision, X.Y. (Xiaojie Yao). All authors have read and agreed to the published version of the manuscript.

Funding

This work was financially supported by the Key Project of Natural Science Research of Anhui Provincial education department (KJ2020A0519, KJ2020A0456), the Doctoral Research Foundation of Anhui Jianzhu University (2020QDZ15), the Social Science Innovation and Development Research Project in Anhui Province (2021CX182), the Youth Fund Project of Humanities and Social Sciences Research of Ministry of Education (18YJC760117), the Excellent Youth Talent Support Program of Universities in Anhui Province (gxyq2021197), and the peak discipline cultivation project of Anhui Province (2021-138, 2021-136).

Institutional Review Board Statement

Not applicable.

Informed Consent Statement

Not applicable.

Data Availability Statement

Not applicable.

Conflicts of Interest

The authors declare that they have no known competing financial interests or personal relationships that could have appeared to influence the work reported in this paper.

References

  1. Muhamad Nor, A.N.; Abdul Aziz, H.; Nawawi, S.A.; Muhammad Jamil, R.; Abas, M.A.; Hambali, K.A.; Yusoff, A.H.; Ibrahim, N.; Rafaai, N.H.; Corstanje, R.; et al. Evolution of Green Space under Rapid Urban Expansion in Southeast Asian Cities. Sustainability 2021, 13, 12024. [Google Scholar] [CrossRef]
  2. Ying, X.; Yun, C.; Fen, P.; Jingzhi, L.; Xiaojing, Y. Analog simulation of urban construction land supply and demand in Chang-Zhu-Tan Urban Agglomeration based on land intensive use. J. Geogr. Sci. 2019, 29, 1346–1362. [Google Scholar]
  3. Zhang, H. The Impact of Urban Sprawl on Environmental Pollution: Empirical Analysis from Large and Medium-Sized Cities of China. Int. J. Environ. Res. Public Health 2021, 18, 8650. [Google Scholar] [CrossRef] [PubMed]
  4. Yang, D.Y.; Ye, C.; Xu, J. Land-Use Change and Health Risks in the Process of Urbanization: A Spatiotemporal Interpretation of a Typical Case in Changzhou, China. Land 2021, 10, 820. [Google Scholar] [CrossRef]
  5. Jun, W.; Lichun, S.; Xiaomei, Y.; Zhihua, W.; Dazhuan, G.; Junmei, K.; Fengshuo, Y.; Yueming, L.; Bin, L. Economic Globali-zation Impacts on the Ecological Environment of Inland Developing Countries: A Case Study of Laos from the Perspective of the Land Use/Cover Change. Sustainability 2019, 11, 3940. [Google Scholar]
  6. De Jong, M. From Eco-Civilization to City Branding: A Neo-Marxist Perspective of Sustainable Urbanization in China. Sustainability 2019, 11, 5608. [Google Scholar] [CrossRef]
  7. Priyanka, M.; Naresh, K. Impact of Urban Sprawl on the Environment of Rohtak City. Appl. Ecol. Environ. Sci. 2021, 9, 336–339. [Google Scholar]
  8. Qiao, W.Y.; Li, Y.; Guan, W.H.; Wang, X.; Wang, X. Forecast of China’s urbanization level in 2016–2050. Econ. Geogr. 2018, 38, 51–58. [Google Scholar]
  9. Zubair, O.A. Investigating Urban Growth and the Dynamics of Urban Land Cover Change Using Remote Sensing Data and Landscape Metrics. Pap. Appl. Geogr. 2021, 7, 67–81. [Google Scholar] [CrossRef]
  10. Kim, J.-H.; Kwon, O.-S.; Ra, J.-H. Urban Type Classification and Characteristic Analysis through Time-Series Environmental Changes for Land Use Management for 31 Satellite Cities around Seoul, South Korea. Land 2021, 10, 799. [Google Scholar] [CrossRef]
  11. Ronald, C.E.; Yuji, M.; Soe, W.M. Effects of landscape composition and pattern on land surface temperature: An urban heat island study in the megacities of Southeast Asia. Sci. Total Environ. 2017, 577, 349–359. [Google Scholar]
  12. Hanqiu, X.; Yifan, W.; Huade, G.; Tingting, S.; Xisheng, H. Detecting Ecological Changes with a Remote Sensing Based Ecological Index (RSEI) Produced Time Series and Change Vector Analysis. Remote Sens. 2019, 11, 2345. [Google Scholar]
  13. Danling, C.; Xinhai, L.; Xu, L.; Xue, W. Measurement of the eco-environmental effects of urban sprawl: Theoretical mechanism and spatiotemporal differentiation. Ecol. Indic. 2019, 105, 6–15. [Google Scholar]
  14. Li, H.W.; Xu, E.; Zhang, H. Examining the coupling relationship between urbanization and natural disasters: A case study of the Pearl River Delta, China. Int. J. Disaster Risk Reduct. 2021, 55, 102057. [Google Scholar] [CrossRef]
  15. Kassouri, Y. Monitoring the spatial spillover effects of urbanization on water, built-up land and ecological footprints in sub-Saharan Africa. J. Environ. Manag. 2021, 300, 113690. [Google Scholar] [CrossRef]
  16. Cunha, Z.G.; Guidolini, J.F.; Branco, E.A.; Ometto, J.P. How sustainable is the nitrogen management in Brazil? A sustainability assessment using the Entropy Weight Method. J. Environ. Manag. 2022, 316, 115330. [Google Scholar] [CrossRef]
  17. Xianqi, Z.; Chenbo, W.; Enkuan, L.; Cundong, X. Assessment Model of Eco environmental Vulnerability Based on Improved Entropy Weight Method. Sci. World J. 2014, 2014, 797814. [Google Scholar]
  18. Hefei Bureau of statistics. Hefei Statistical Yearbook; Anhui people’s Statistics Press: Hefei, China, 1984–2020. [Google Scholar]
  19. Wu, J. Physical and geographical conditions and urban construction of Hefei. Res. Urban Constr. Arch. 1999, 4, 12–13. [Google Scholar]
  20. Zhu, D.; Sun, J.; Lu, L. Study on spatial correlation and temporal and spatial evolution of Hefei Economic Circle. Geoscience 2017, 37, 738–747. [Google Scholar]
  21. GB/T 21010-2017; Classification of Land Use Status. Department of Cadastral Management, China Standards Press: Beijing, China, 2007.
  22. Gzyl, H.; Mayoral, S.; Gomes-Gonçalves, E. Loss Data Analysis: The Maximum Entropy Approach; De Gruyter: Berlin, Germany, 2018. [Google Scholar]
  23. Yancang, L.; Lei, Z.; Juanjuan, S. Comprehensive Assessment on Sustainable Development of Highway Transportation Ca-pacity Based on Entropy Weight and TOPSIS. Sustainability 2014, 6, 4685–4693. [Google Scholar]
  24. Wei, X.; Zhao, L.; Cheng, P.; Xie, M.; Wang, H. Spatial-Temporal Dynamic Evaluation of Ecosystem Service Value and Its Driving Mechanisms in China. Land 2022, 11, 1000. [Google Scholar] [CrossRef]
  25. Minglei, R.; Yingfei, L.; Xiaodi, F.; Liuqian, D.; Gang, W.; Guangyuan, K.; Liping, Z.; YaFeng, Z. The changeable degree assessment of designed flood protection condition for designed unit of inter-basin water transfer project based on the entropy weight method and fuzzy comprehensive evaluation model. IOP Conf. Ser. Earth Environ. Sci. 2021, 826, 012029. [Google Scholar] [CrossRef]
  26. Peng, H.; Hua, L.; Zhang, X.; Yuan, X.Y.; Li, J.H. Evaluation of ESV Change under Urban Expansion Based on Ecological Sensi-tivity: A Case Study of Three Gorges Reservoir Area in China. Sustainability 2021, 13, 8490. [Google Scholar] [CrossRef]
  27. Xie, G.D.; Zhen, L.; Lu, C.; Xiao, Y.; Chen, C. A valuation method of ecosystem services based on expert knowledge. J. Nat. Resour. 2008, 5, 911–919. [Google Scholar]
  28. Binod, B.; Qiuhong, T.; Yadu, P.; Ximeng, X. Vegetation dynamics and ecosystem service values changes at national and provincial scales in Nepal from 1999 to 2017. Environ. Dev. 2019, 32, 100464. [Google Scholar]
  29. Yao, Y.; Wang, S.; Zhou, Y.; Liu, R.; Han, X. The Application of Ecological Environment Index Model on the National Evaluation of Ecological Environment Quality. Remote Sens. Inf. 2012, 27, 93–98. [Google Scholar]
  30. Lei, S.; Lin, Z.; Li, G.; Yao, H. Evaluation of Regional Ecological Environment Based on Landsat7 ETM+. Remote Sens. Data Beijing Surv. Mapp. 2014, 3, 69–72. [Google Scholar]
  31. Ministry of Environmental Protection. Technical Specification for Ecological Environment Assessment (Trial) (HJ/t192-2006); China Environmental Science Press: Beijing, China, 2006. [Google Scholar]
  32. Li, Z.; Kuang, W.; Zhang, S. Remote Sensing Monitoring and Spatiotemporal Pattern of Land Use/Cover Change in Built-up Area of Tianjin in the Past 70 Years. Remote Sens. Technol. Appl. 2020, 35, 527–536. [Google Scholar]
  33. Tasya, B.; Rokhmatuloh, A.W. Comparison Spatial Pattern of Land Surface Temperature with Mono Window Algorithm and Split Window Algorithm: A Case Study in South Tangerang, Indonesia. IOP Conf. Ser. Earth Environ. Sci. 2018, 149, 012066–012076. [Google Scholar]
  34. Qingyu, X.; Xiong, X.; Huan, X.; Xiaochun, Z.; Yuting, H. A New Strategy for Comparison of Land Surface Temperature Re-trieval Methods with Landsat Remote Sensing Images Considering Regional Consistency. IOP Conf. Ser. Earth Environ. Sci. 2021, 687, 012166. [Google Scholar] [CrossRef]
  35. Jiang, Y.; Lin, W. A Comparative Analysis of Retrieval Algorithms of Land Surface Temperature from Landsat-8 Data: A Case Study of Shanghai, China. Int. J. Environ. Res. Public Health 2021, 18, 5659. [Google Scholar] [CrossRef] [PubMed]
  36. Fei, W.; Zhihao, Q.; Caiying, S.; Lili, T.; Arnon, K.; Shuhe, Z. An Improved Mono-Window Algorithm for Land Surface Temperature Retrieval from Landsat 8 Thermal Infrared Sensor Data. Remote Sens. 2015, 7, 4268–4289. [Google Scholar]
  37. Mu, X.; Zhao, T.; Ruan, G.; Song, J.L.; Wang, J.D.; Yan, G.J.; Mcvicar, T.R.; Yan, K.; Gao Zhan, L.; Yao, K.; et al. High Spatial Resolution and High Temporal Frequency (30-m/15-day) Fractional Vegetation Cover Estimation over China Using Multiple Remote Sensing Datasets: Method Development and Validation. J. Meteorol. Res. 2021, 35, 128–147. [Google Scholar] [CrossRef]
  38. Han-qiu, X.; Ben-qing, C. Remote sensing of the urban heat island and its changes in Xiamen City of SE China. J. Environ. Sci. 2003, 16, 276–281. [Google Scholar]
  39. Lingna, L.; Yalin, L. Dynamic changes of the ecological footprint in the Beijing-Tianjin-Hebei region from 1996 to 2020. Ecol. Indic. 2020, 112, 106142. [Google Scholar]
  40. Girili, A.; Mubarek, A. Regional ecological security assessment on Central Asia based on ecological footprint analysis. Geogr. Res. 2008, 6, 1308–1320. [Google Scholar]
  41. Xia, Q. Study on Land Ecological Carrying Capacity of Hefei Based on Ecological Footprint Xia Qian. Master’s Thesis, Anhui Agricultural University, Hefei, China, 2019. [Google Scholar]
  42. Li, X.F.; Song, L.; Xie, Z.B.; Gao, T.; Wang, T.T.; Zheng, X.; Liu, J.; Liu, L. Assessment of Ecological Vulnerability on Northern Sand Prevention Belt of China Based on the Ecological Pressure–Sensibility–Resilience Model. Sustainability 2021, 13, 6078. [Google Scholar] [CrossRef]
  43. Li, Y.-Y.; Liu, Y.; Ranagalage, M.; Zhang, H.; Zhou, R. Examining Land Use/Land Cover Change and the Summertime Surface Urban Heat Island Effect in Fast-Growing Greater Hefei, China: Implications for Sustainable Land Development. ISPRS Int. J. Geo-Inf. 2020, 9, 568. [Google Scholar] [CrossRef]
  44. State Council. Reply of the State Council on the overall urban planning of Hefei. Bull. State Counc. People’s Repub. China 2016, 14, 49–51. [Google Scholar]
  45. Yu, H.S.; Yang, J.; Li, T.; Jin, Y.; Sun, D.Q. Morphological and functional polycentric structure assessment of megacity: An integrated approach with spatial distribution and interaction. Sustain. Cities Soc. 2022, 80, 103800. [Google Scholar] [CrossRef]
  46. Camille, R.; Sophie, L. Urban Structure and Environmental Externalities. Environ. Resour. Econ. 2018, 70, 31–52. [Google Scholar]
  47. Mukherjee, F. Environmental Impacts of Urban Sprawl in Surat, Gujarat: An Examination Using Landsat Data. J. Indian Soc. Remote Sens. 2022, 50, 1003–1020. [Google Scholar] [CrossRef]
  48. Zhao, Y.; Zhong, L.; Ma, Y.; Fu, Y.; Chen, M.; Ma, W.Q.; Zhao, C.; Huang, Z.; Zhou, K. WRF/UCM simulations of the impacts of urban expansion and future climate change on atmospheric thermal environment in a Chinese megacity. Clim. Chang. 2021, 169, 38. [Google Scholar] [CrossRef]
  49. Ma, S.; Huang, J.; Chai, Y.Y. Proposing a GEE-Based Spatiotemporally Adjusted Value Transfer Method to Assess Land-Use Changes and Their Impacts on Ecosystem Service Values in the Shenyang Metropolitan Area. Sustainability 2021, 13, 12694. [Google Scholar] [CrossRef]
  50. Rahman, M.M.; Szabó, G. Impact of Land Use and Land Cover Changes on Urban Ecosystem Service Value in Dhaka, Bangladesh. Land 2021, 10, 793. [Google Scholar] [CrossRef]
  51. Sresto, M.A.; Morshed, M.M.; Siddika, S.; Almohamad, H.; Al-Mutiry, M.; Abdo, H.G. Impact of COVID-19 Lockdown on Vegetation Indices and Heat Island Effect: A Remote Sensing Study of Dhaka City, Bangladesh. Sustainability 2022, 14, 7922. [Google Scholar] [CrossRef]
  52. Founda, D.; Katavoutas, G.; Pierros, F.; Mihalopoulos, N. The Extreme Heat Wave of Summer 2021 in Athens (Greece): Cu-mulative Heat and Exposure to Heat Stress. Sustainability 2022, 14, 7766. [Google Scholar] [CrossRef]
  53. National Bureau of Statistics. China Statistical Yearbook; China Statistics Press: Beijing, China, 2000–2020. [Google Scholar]
  54. Basu, T.; Das, A. Systematic review of how eco-environmental transformation due to urbanization can be investigated in the sustainable development of Indian Cities. Environ. Chall. 2021, 4, 100099. [Google Scholar] [CrossRef]
Figure 1. Hefei municipal area location map.
Sustainability 14 10613 g001
Figure 2. Land-use distribution of Hefei municipal area from 1984 to 2020.
Sustainability 14 10613 g002
Figure 3. Research design.
Sustainability 14 10613 g003
Figure 4. Area change in the construction land and ecological land in Hefei municipal area.
Sustainability 14 10613 g004
Figure 5. Characteristic values of construction land expansion.
Sustainability 14 10613 g005
Figure 6. Spatial distribution of land surface temperature.
Sustainability 14 10613 g006
Figure 7. Change in urban construction land and amount of various pollutant discharges.
Sustainability 14 10613 g007
Figure 8. Hefei urbanization rate progress.
Sustainability 14 10613 g008
Table 1. Proportion values and weights of each indicator.
Assessment IndexYearsELAESVEIKURIPEEPED
Indicator effect +++-----
Proportion value (Pij)19990.0290.0370.0280.0290.0320.0450.0690.127
20040.0260.0290.0280.0260.0250.0430.0530.075
20090.0210.020.0190.0210.0210.040.0250.02
20140.0170.0170.0190.0170.0170.0010.010.007
20200.0010.0010.0010.0010.0010.0080.0010.001
Weight value (wi) 0.0940.1030.0930.0940.0950.1360.1580.229
Note: ELA, ecological land area; ESV, ecosystem service value; EI, eco-environmental index; K, urban land expansion coefficient; URI, urban heat island ratio index; PE, total pollutant emission; EP, ecological pressure; ED, ecological deficit.
Table 2. Ecosystem service value coefficients of Hefei municipal area from 1984 to 2020 (USD).
Forest LandGrasslandCultivated LandWater AreaUnused Land
Gas regulation1362.79 311.50 194.68 0.00 0.00
Climatic regulation1051.30 350.43 346.54 179.11 0.00
Water conservation1245.98 311.50 233.62 7935.36 11.68
Soil formation and protection1518.54 759.27 568.48 3.89 7.79
Waste disposal510.07 510.07 638.57 7078.74 3.89
Biodiversity protection1269.35 424.41 276.45 969.53 132.39
Food production38.94 116.81 389.37 38.94 3.89
Raw and processed material1012.36 19.47 38.94 3.89 0.00
Entertainment culture498.39 15.57 3.89 1689.86 3.89
Total8507.73 2819.04 2690.55 17,899.33 163.53
Table 3. Table of soil erosion indicators.
FVC (%)Slope
<5°5–8°8–15°15–25°>25°
>75MiredMiredMiredMiredMired
60–75MiredMildMildMildModerate
45–60MiredMildMildModerateModerate
30–45MiredMildModerateModerateHeavy
<30MiredModerateModerateHeavyExtremely heavy
Note: FVC, fractional vegetation cover.
Table 4. Criteria for eco-environmental quality assessment.
RankExtremely BadBadModerateGoodExcellent
Index rangeEI < 2020 ≤ EI < 3535 ≤ EI < 5555 ≤ EI < 75EI ≥ 75
Table 5. Ecosystem services value (million USD).
Grassland Cultivated LandUnutilized Land Waters AreaForest LandTotal
1984123.81 161.19 0.36 167.11 35.32 487.75
1989106.93 161.56 0.81 144.71 42.05 456.11
1994109.77 153.90 0.93 151.43 48.40 464.41
199995.43 165.44 0.93 135.60 48.01 445.45
200485.13 147.16 0.82 138.14 43.01 414.14
200998.27 112.63 0.72 133.21 37.56 382.42
201481.84 93.73 0.70 159.35 36.65 372.19
202034.05 91.65 0.70 146.36 36.69 309.42
Table 6. EI in Hefei municipal area from 1984 to 2020.
YEARBIVIWILIPIEI
19840.160.220.0792.68
19890.150.210.0692.68
19940.150.210.0792.68
19990.140.210.0692.6899.9933.62
20040.130.190.0692.6899.9933.62
20090.130.180.0692.6899.9833.61
20140.120.160.0792.6899.9633.61
20200.100.130.0692.6899.9533.59
Table 7. Land surface temperature area statistics and URI (km2).
Year LowestLowMedium LowMediumMedium HighHighHighestURI
1984Area (km2)0.07125.8433.89485.46223.7945.70.010.03
PREC (%)0.01 12.91 33.77 32.34 17.42 3.56 0.01
1989Area (km2)3.43 168.13 417.93 377.95 241.64 69.72 5.91 0.05
PREC (%)0.27 11.53 32.53 30.98 18.81 5.43 0.46
1994Area (km2)2.32 140.87 376.89 395.30 267.74 83.22 18.62 0.07
PREC (%)0.18 10.97 29.34 30.77 20.84 6.48 1.45
1999Area (km2)0.10 125.79 351.13 385.54 282.14 95.89 44.12 0.1
PREC (%)0.01 9.79 27.33 30.01 21.96 7.46 3.43
2004Area (km2)2.96 186.05 352.06 335.50 195.18 172.14 40.81 0.15
PREC (%)0.23 14.48 27.40 26.11 15.19 13.40 3.18
2009Area (km2)7.22 121.05 228.63 352.71 325.06 178.30 71.70 0.17
PREC (%)0.56 9.42 17.80 27.45 25.30 13.88 5.58
2014Area (km2)1.19 116.16 221.59 346.55 305.36 236.08 57.37 0.2
PREC (%)0.09 9.04 17.25 26.97 23.77 18.38 4.47
2020Area (km2)4.12 89.87 184.90 228.25 304.12 405.25 67.82 0.32
PREC (%)0.32 7.00 14.39 17.77 23.67 31.54 5.28
Note: URI, urban heat island ratio index.
Table 8. EF, EC, ed, and EP in Hefei municipal area.
Years19992004200420142020
EF1.5871.9762.3802.4652.515
EC0.1370.1150.0880.0770.070
ed1.4501.8612.2922.3882.444
EP11.57617.19026.97032.17935.685
Note: EF, per-capita ecological footprint; EC, per-capita ecological carrying capacity; ed, ecological deficit or profit; EP, ecological pressure.
Table 9. The comprehensive scores.
YearsComprehensive Scores (S)
19990.397
20040.305
20090.187
20140.104
20200.008
Publisher’s Note: MDPI stays neutral with regard to jurisdictional claims in published maps and institutional affiliations.

