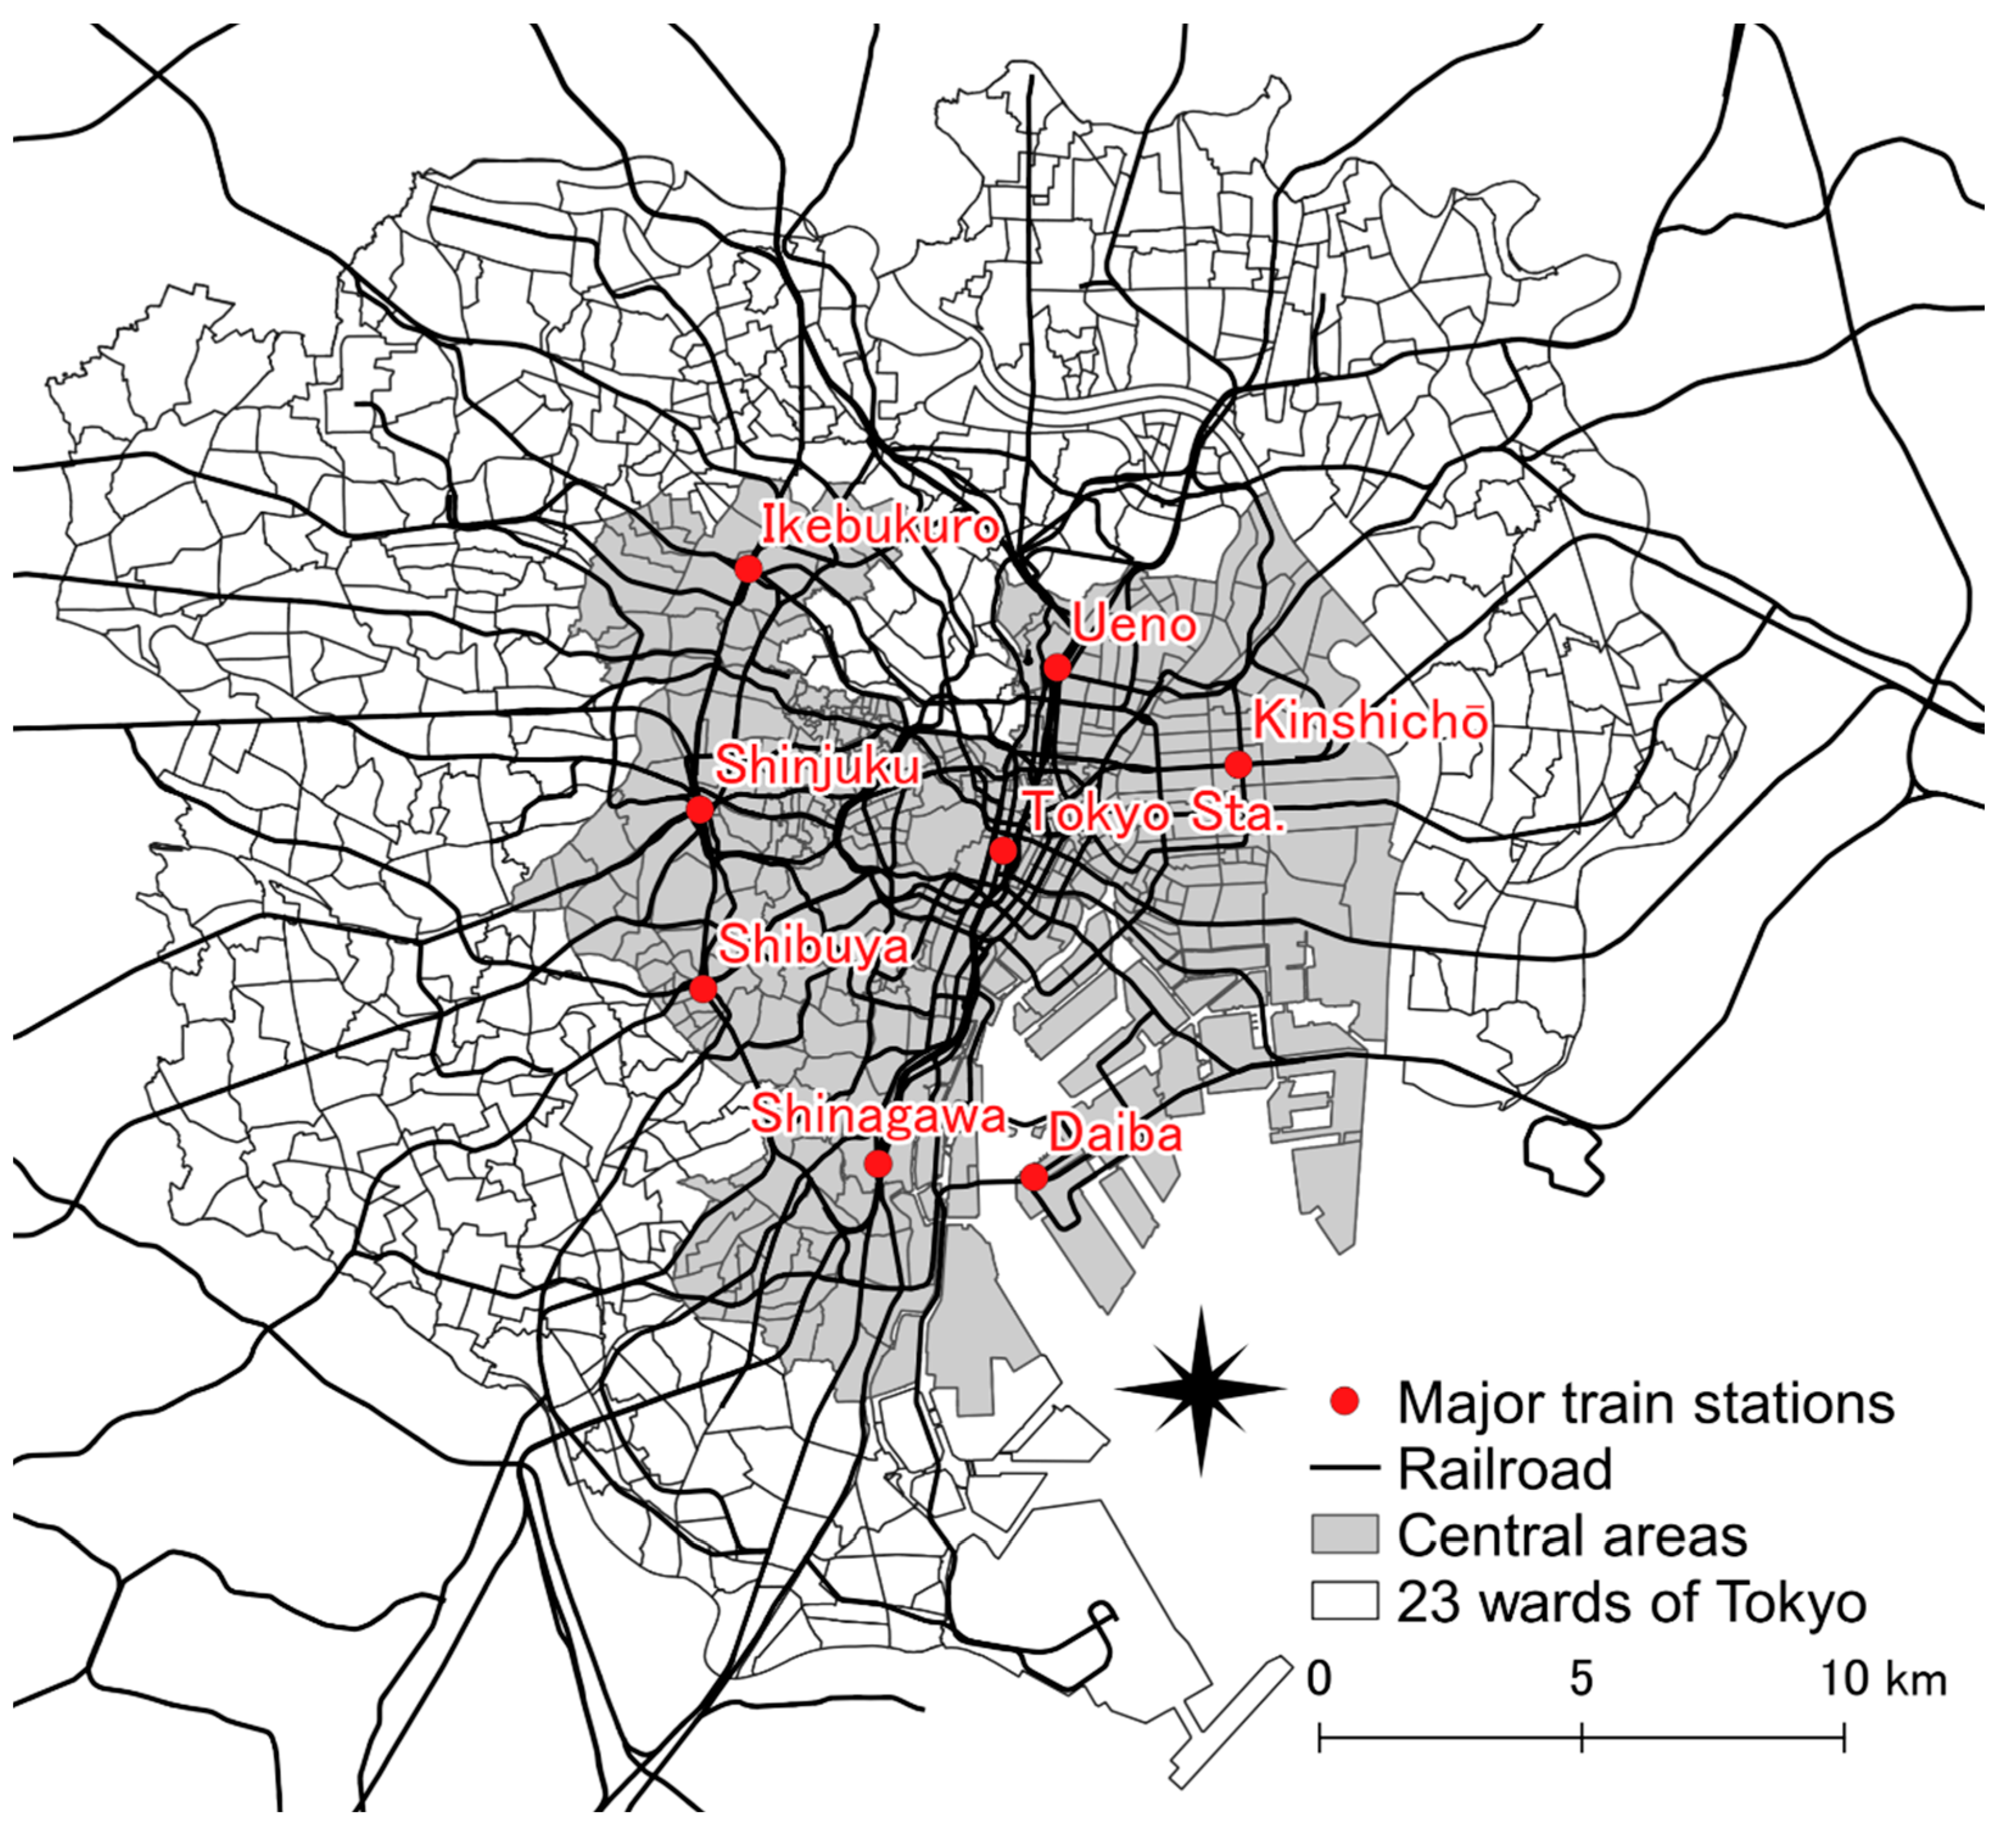
Article

The Relationship between Geographic Accessibility to Neighborhood Facilities, Remote Work, and Changes in Neighborhood Satisfaction after the Emergence of the COVID-19 Pandemic

1
Center for Real Estate Innovation, The University of Tokyo, Bunkyo, Tokyo 113-8656, Japan
2
Center for the Promotion of Social Data Science Education and Research, Hitotsubashi University, Kunitachi 186-8601, Japan
*
Author to whom correspondence should be addressed.
Sustainability 2022, 14(17), 10588; https://doi.org/10.3390/su141710588
Submission received: 20 July 2022 / Revised: 9 August 2022 / Accepted: 22 August 2022 / Published: 25 August 2022
(This article belongs to the Special Issue Sustainable Property Markets)

Abstract

:
The emergence of the COVID-19 pandemic and working remotely may decrease the advantages of residing in populated areas. This study aims to test the relationship between remote work and changes in neighborhood satisfaction and to discern the difference according to both the status of remote work and the centrality of areas where people live in the relationships between geographic accessibility to neighborhood facilities and changes in neighborhood satisfaction. By using an ordinal logistic regression, we analyzed data from a questionnaire completed by residents of the 23 wards of Tokyo. Working remotely was found to increase neighborhood satisfaction of people living in a central (OR = 1.31) and a noncentral area (OR = 1.50). Remote workers living in single-family homes were found to be less satisfied with their neighborhoods. Less decrease (or increase) in geographic accessibility to eating facilities was found to be related to increase in neighborhood satisfaction for both remote and nonremote workers regardless of the centrality of areas where they live. The findings suggest that populated areas continue to provide benefits which will improve neighborhood satisfaction even after the start of a pandemic; however, there could be a shift of demand for facilities in central areas to noncentral areas beyond the emergence of the pandemic.

1. Introduction

Many studies have shown that satisfaction with the neighborhood where people reside is related to residents’ subjective well-being [1,2,3,4] and intentions to move [5,6]. Neighborhood satisfaction is defined as the subjective evaluation of the physical and social environment characteristics of the neighborhood where an individual resides [1,7,8]. Therefore, neighborhood satisfaction can be used as a subjective indicator of neighborhoods’ social sustainability and livability [9,10,11], and development that increases residents’ neighborhood satisfaction can be a strategy for a sustainable neighborhood. Neighborhood satisfaction measures the gaps between residents’ actual and desired neighborhood circumstances [12,13,14], and it decreases with an increase in the gaps.
Previous studies [15,16] have shown that distance to workplace is related to neighborhood satisfaction. Close distance from individuals’ homes to their workplace enables them to lessen their time-related travel costs and to spend more time for other purposes (such as leisure activities in their neighborhoods). Remote work, which enables people to work from home, is an example of the distance to workplaces being extremely close. Similar to the case of the proximity to workplaces, working remotely may lessen time-related costs. The temporal and geographical flexibility with respect to individuals’ work schedules provide benefits for workers by enabling them to spend more time with their family members and friends [17,18], not just by reducing the time-related costs. This enables remote workers to gain benefits from the neighborhood amenities and to be satisfied with their neighborhoods, by conducting leisure activities in their neighborhoods with their family members and friends, for example. After the spread of COVID-19 in early 2020, people have been spending more time in their homes than prepandemic, and remote work has been promoted as a working style for the postpandemic world. Therefore, an environment around their homes that is amenable to remote and nonremote workers after the pandemic should be discussed for effective policies to develop sustainable and livable neighborhoods.
Many studies [19,20,21,22,23] have shown that neighborhood characteristics—such as socioeconomic status, safety, availability of public transportation, overcrowding, proximity to neighborhood facilities, and social interaction—are related to neighborhood satisfaction. Among the neighborhood characteristics, neighborhood facilities (e.g., cafes, restaurants, bars, and sports facilities) are essential and fundamental components of the urban structure; they are relatively easy to control through urban planning in contrast to the social environment or public transportation. Cafes, restaurants, bars, and sports facilities are representative facilities of third places, which are leisure facilities where people interact socially [24,25]. Geographic accessibility is defined as the closeness of residents to specific destinations [26]. Therefore, an area with good geographic accessibility to those facilities has been considered a neighborhood amenable to leisure activities given that the area can provide greater opportunities for social interaction [27,28] and physical activity [29,30]. On the other hand, areas with high geographic accessibility to facilities are generally crowded. Given that the COVID-19 outbreak has negatively changed people’s perception regarding populated places, conceptualized as social scarring [31], high geographic accessibility could have a negative effect on increased neighborhood satisfaction after the pandemic if one cannot gain benefits from the high geographic accessibility to a certain type of facility. Therefore, the relationship between geographic accessibility and neighborhood satisfaction should be tested, as well as the difference between remote workers and nonremote workers.
Scholars of regional and urban studies immediately offered opinions after the start of the pandemic and questioned whether or not an agglomerated population in big cities would continue to provide benefits to residents, including remote workers [31,32,33,34]. The issue regarding density after the emergence of the COVID-19 pandemic has made it difficult for policymakers in populated areas to decide upon a direction for urban development. Therefore, an assessment of densely developed cities from their residents’ perspective (remote and nonremote workers’ neighborhood satisfaction) at the point of about a year after the pandemic should be conducted; this will provide hints for policymakers when considering sustainable neighborhood development as people keep working remotely.
In summary, the purpose of this study was to test whether remote work is related to an increase in neighborhood satisfaction for residents living in populated areas. This study also tested how geographic accessibility to neighborhood facilities is related to an increase in neighborhood satisfaction. It was hypothesized that there is a difference between remote and nonremote workers, as well as the centrality of areas where they live, in the types of neighborhood facilities that have significant relationships with increases in neighborhood satisfaction.

2. Lockdown Policies and Remote Work in Tokyo after the Pandemic

The emergence of the COVID-19 pandemic put a strain on socioeconomic activities, especially in densely developed areas. To reduce the risk of COVID-19 transmission, the Japanese government temporarily restricted socioeconomic activities by means of limiting foot traffic, or a so-called lockdown [35]. The government requested businesses, such as retail facilities and shops where people conduct socioeconomic activities, to limit their business hours and the goods and services they provide. For example, eating facilities were asked to close by 8:00 p.m. while also limiting the number of patrons. Limitations on serving of liquor and holding of events (such as sports matches and concerts) were also present under these restrictions. The lockdown in Tokyo occurred twice in the year following the emergence of the pandemic, in accordance with the status of COVID-19 transmission (first lockdown: from 7 April 2020 to 25 May 2020; second lockdown: from 8 January 2021 to 21 March 2021). The lockdown policy did not directly limit individual travel, but restrictions were focused on places where people conduct socioeconomic activities and indirectly decreased foot traffic in densely developed areas [35].
The restrictions on where people conduct socioeconomic activities can be a factor that increases the cost of consuming goods and services in central areas for those living in noncentral areas [36]. For example, limited business hours can act as a fixed cost of traveling to central areas. The increased costs may cause people living in noncentral areas to reduce their demand for socioeconomic activities in central areas, choosing instead to engage in activities in their neighborhoods. As a result, facilities in central areas may find it difficult to continue their operations. In contrast, facilities in noncentral areas may not decrease or even increase as more people living in the noncentral areas engage in socioeconomic activities around their homes. Indeed, studies conducted in the European countries have shown that lower neighborhood density and proximity to facilities are positively related to well-being and health during COVID-19 [37,38]. A positive relationship between proximity to the city center and neighborhood satisfaction after the pandemic has also been reported [39]. In other words, people living in noncentral areas could possibly perceive good geographic accessibility to facilities as an important factor which increases their neighborhood satisfaction after the pandemic. However, the relationship depends on the local context [39]. Therefore, we measured changes in geographic accessibility to neighborhood facilities by central and noncentral areas and tested the relationship between the changes and increase in neighborhood satisfaction within the Japanese context.
On the other hand, central business districts where many offices are concentrated were the places where workers conducted socioeconomic activities before the pandemic (e.g., going for dinner with coworkers after work). With the emergence of the pandemic, the government requested people to work remotely to reduce foot traffic in central business districts [40]. According to a survey regarding the status of remote work [41], 17.8% of people in the 23 wards of Tokyo (which are the most populated areas in Japan) worked remotely before the pandemic (December 2019), and the proportion increased up to 53.5% about a year into the pandemic (April 2021). In other words, opportunities for socioeconomic activities in central business districts decreased owing to the increase in remote workers following the emergence of the pandemic. This possibly caused a decrease in consuming behavior in central business districts. In contrast, given that the proportion of remote workers increased, the location of consuming behavior could possibly shift from central business districts to neighborhoods.
The ability of individual workers to shift to remote work could possibly depend on their socioeconomic status. For example, blue-collar and low-income workers may have barriers to shifting to remote work. In contrast, high-income knowledge workers can shift easily [42,43,44]. Older workers may also perceive that it is difficult to convert their working style to remote work [45]. This could possibly cause disparities in the residential location according to the status of remote work, owing to there being a possible difference in the residential preferences between remote and nonremote workers. Reducing the inequality—along with increasing social interaction and neighborhood satisfaction—has been considered an important aim of social sustainability development [46,47,48]. Therefore, neighborhoods amenable to both remote and nonremote workers are important for social sustainability. This highlights the importance of testing how geographic accessibility to neighborhood facilities is related to an increase in neighborhood satisfaction by remote and nonremote workers.

3. Materials and Methods

3.1. Data Sources

This study analyzed data collected by Recruit Co., Ltd. using an online questionnaire survey service (provided by Intage Inc., Tokyo, Japan) from 14 January 2021 to 1 February 2021. We selected 23 wards of Tokyo as the study area, owing that this study was to test the changes in neighborhood satisfaction of residents living in populated areas with central business districts. The area is densely populated and close to the city centers. The area comprises the 841 postal code areas that were used as neighborhood units in this study. The targeted samples of the survey were people (aged ≥20 years) who live in the study area. With the online survey, 13,225 respondents completed all the questions excluding items regarding incomes and the nearest station to workplaces. Among them, some responses were omitted owing to the respondents being nonworkers (3024 samples), and others reported unclear addresses of workplaces (835 samples). Some minor household types (e.g., single parents) were also excluded owing to their small sample number (243 samples). After the sample selection, only the item regarding incomes contained missing values. This was included in the analysis as missing values. Consequently, the analytic sample consisted of 9123 respondents.
Facility data from telephone directory data with associated location information (Zenrin Co. Ltd., Fukuoka, Japan, Telepoint Pack!) in February 2019 and August 2020, along with location data of city parks in 2010 from the Ministry of Land, Infrastructure, Transport, and Tourism were linked to the questionnaire responses in order to assess geographic accessibility to facilities in the neighborhood and its change. The facility data from telephone directory data are updated once every three months and reflect the facility location at the time. Neighborhood facilities were grouped into (1) eating facilities (cafés, restaurants, and pubs), (2) parks, and (3) gyms and fitness clubs. The eating facilities are the representative facilities of third places, which are places outside the home where people feel comfortable and socially interact. The eating facilities, particularly cafés, may also serve as places where people work remotely. Gyms and fitness clubs are facilities for indoor exercise; city parks are destinations for outdoor recreational activities. Those places for indoor/outdoor recreational activities within residents’ neighborhoods may enable them to achieve work–life balance, especially for those who work remotely at homes, owing that the remote workers have geographical and temporal flexibility regarding their working time; this probably increased neighborhood satisfaction after the spread of COVID-19.

3.2. Variable Descriptions

Table 1 shows the summary of respondents’ characteristics. Respondents were grouped into 4 subgroups according to their status of remote work and centrality of areas where they reside. The questionnaire included an item asking the nearest station to workplaces, signifying the places where most people had worked before the pandemic, and the distance from respondents’ homes to the workplaces was measured using Cartesian distance. The most frequently used travel modes in daily life were included in the questionnaire, and the response options were walking, bicycle, public transport, and automobile. Sex, income, housing tenure, house types (single-family and multifamily houses), and household types (single households, couple households, and nuclear families) were also included in the questionnaire and served as control variables.
Subjective changes in neighborhood satisfaction after the emergence of the COVID-19 pandemic were assessed with a 5-level Likert scale by asking a question phrased as, “How much do you feel that your neighborhood satisfaction has changed after the start of the pandemic?” In order to secure a certain number of samples, the changes were reclassified into 3 categories: (1) decreased, (2) unchanged, and (3) increased. Similar to the subjective changes, respondents’ satisfaction levels were also assessed (by asking a question phrased as, “How much were you satisfied with your neighborhood before the pandemic?”) and considered, owing to the fact that there could possibly be differences in the increase and/or decrease among the levels of neighborhood satisfaction.
Neighborhood-level variables—population density, geographic accessibility, and changes in geographic accessibility—were assessed within neighborhoods. Areas with higher population density are more mixed and more interconnected [49,50]. In addition, intersection density may not be an index of walkability in a city with high intersection density, such as the 23 wards of Tokyo [51]. Therefore, population density was included to adjust land-use diversity and street connectivity. Regarding the areas where people lived, 10 wards (among 23 wards of Tokyo), which included central business districts, were considered central areas (Figure 1). Given that the areas included central business districts, those had relatively higher land prices than other areas, and many offices (workplaces) were concentrated in the areas.
The geographic accessibility to each type of facility was measured using spatial kernel density with a quartic distance–decay function by each neighborhood. The accessibility to facilities was defined as the sum of the predicted density at points included in a district divided by the area (square kilometers) of the district. The neighborhood-level accessibility was linked to the address where each respondent lives. The bandwidth of the spatial kernel was set at 1200 m, which corresponds to about a 15-minute walk; this was the average walking distance to neighborhood destinations [52]. Changes in geographic accessibility by each type of facility were measured by comparing the geographic accessibility between the two time points (before and after the emergence of the COVID-19 pandemic; February 2019 and August 2020, respectively). Private facilities, such as eating facilities and gyms and fitness clubs, could possibly open and close for years. Meanwhile, city parks are publicly managed, and their geographical distribution rarely changes. Therefore, we considered the changes in geographic accessibility only for the eating facilities and gyms and fitness clubs.

3.3. Analytic Method

An ordinal logistic regression was used. The dependent variable was the changes in neighborhood satisfaction. Both geographic accessibility and its change according to each type of facility were standardized (Z-scores) at the neighborhood level; the model was set to estimate their odds ratios indicating the likelihood of change with a 0.1-unit increase. Population density by each neighborhood was also standardized (Z-scores) and included to adjust for the degree of urbanization. Age, sex, income, housing tenure, household type, the most frequently used travel mode, and levels of neighborhood satisfaction were adjusted. Distance to workplace was included in the model as a form of a natural logarithmic scale.
We estimated three models as follows:
  • Model 1: models testing the relationship between remote work and an increase in neighborhood satisfaction by central and noncentral areas;
  • Model 2-1: models testing the relationship of living in single-family home, distance to workplace, and population density with an increase in neighborhood satisfaction by subgroups (remote and nonremote workers living in a central/noncentral area);
  • Model 2-2: models testing the relationship between geographic accessibility to neighborhood facilities and an increase in neighborhood satisfaction by subgroups (remote and nonremote workers living in a central/noncentral area).
We initially estimated models by centrality (Model 1) to test the relationship between remote work and an increase in neighborhood satisfaction. This enabled us to clarify whether the direction of the relationship differed according to the centrality of areas where people live. We estimated models by remote and nonremote workers living in a central/noncentral area (Model 2-1) to clarify the difference in the relationship of living in single-family home, distance to workplace, and population density with an increase in neighborhood satisfaction by the subgroups. We also estimated models by each subgroup (Model 2-2) to test how geographic accessibility to neighborhood facilities is related to an increase in neighborhood satisfaction. Considering the Model 2-1 as the base model, we separately included each of variables regarding the geographic accessibility and its change because of multicollinearity among them (Table 2). The results of the models enabled us to discern which types of neighborhood facilities have significant relationships with increase in neighborhood satisfaction of remote and nonremote workers (considering a possible relationship between the centrality and the geographic accessibility).

4. Results

4.1. Changes in Neighborhood Satisfaction by Each Subgroup

Table 3 shows changes in neighborhood satisfaction by each level of neighborhood satisfaction. Even though about 89% of the respondents in total reported that their neighborhood satisfaction did not change, more people reported that their neighborhood satisfaction increased after the emergence of the pandemic (8.1% for increase; 2.7% for decrease). Comparing each subgroup, 11.6% of remote workers living in a central area and 10.3% of remote workers living in a noncentral area reported that their neighborhood satisfaction increased; 6.8% and 5.1% of nonremote workers for those living in a central and noncentral area, respectively.
Figure 2 shows the spatial distribution of neighborhood satisfaction level and changes in the level among respondents. It illustrates which direction at the neighborhood level more respondents reported their neighborhood satisfaction level and change in the level: more/less satisfied and increased/decreased. Regarding the neighborhood satisfaction level, respondents living in the southwestern side among the 23 wards of Tokyo reported that they were satisfied with their neighborhoods before the start of the COVID-19 pandemic. The southwestern area of the 23 wards is a place where many high-income earners reside and is considered as an amenable residential area [53]. Areas where more respondents reported that their neighborhood satisfaction increased (than those who reported decreased satisfaction) were distributed alongside the railroads of the 23 wards.

4.2. Neighborhood-Level Variables and Those by Centrality

Table 4 summarizes the neighborhood-level variables of central and noncentral areas. Central areas had a lower level of geographic accessibility to city parks than noncentral areas; in contrast, they had a higher geographic accessibility in the case of eating facilities, gyms, and fitness clubs. The central areas with a high geographic accessibility to eating and sports facilities showed more decrease in geographic accessibility on average after the emergence of the pandemic (see Figure 3 for more details on the spatial distribution regarding geographic accessibility and its change by each neighborhood). Less decrease (or increase) in geographic accessibility to eating facilities and gyms and fitness clubs was observed in noncentral areas than central areas (Figure 3). Indeed, geographic accessibility and its change were negatively correlated in accordance with eating facilities and gyms and fitness clubs (Table 2).

4.3. Results from the Models

Table 5 and Table 6 present the results of the models for those living in a central and noncentral area (Model 1) and those of the models by subgroups (Model 2-1), respectively. Among people living in a central area, working remotely was positively related to an increase in neighborhood satisfaction after the emergence of the COVID-19 pandemic (Table 5, OR = 1.31); this relationship could also be observed in the case of people living in a noncentral area (Table 5, OR = 1.50). Living in a single-family home was negatively related to the likelihood of an increase in neighborhood satisfaction among people living in a central area (Table 5, OR = 0.68); this was also observed in the case of remote workers (Table 6, OR = 0.59). However, the relationship was not significant in the case of nonremote workers living in a noncentral area. Proximity to workplace was positively related to an increase in neighborhood satisfaction only in the case of remote workers living in a noncentral area (Table 6, OR = 0.93). Population density was slightly related to an increase in neighborhood satisfaction. Proximity to workplace, high population density, and living in a multifamily home indicate a larger number of amenities in the neighborhood. The results indicate that people continue to be satisfied with a neighborhood with a larger number of amenities even after the pandemic; this is in line with the findings from a European study [39].
Table 7 presents the results of the models testing the relationship between geographic accessibility to neighborhood facilities and an increase in neighborhood satisfaction by subgroups (Model 2-2). In terms of geographic accessibility, high geographic accessibility to eating facilities was negatively related to the likelihood of an increase in neighborhood satisfaction for remote workers living in a noncentral area (OR = 0.97) and nonremote workers (for those living in a central area, OR = 0.98; those living in a noncentral area, OR = 0.95). High geographic accessibility to gyms and fitness clubs was negatively related to an increase in neighborhood satisfaction in the case of nonremote workers living in a central area (OR = 0.98). These negative relationships were attributable to the fact that greater decrease in geographic accessibility was observed in areas with high geographic accessibility (i.e., the geographic accessibility level could possibly be a surrogate variable of its change). Geographic accessibility to city parks did not show a significant relationship in all the cases.
Changes in geographic accessibility also showed significant relationships. Less decrease (or increase) in geographic accessibility to eating facilities was positively related to the likelihood of an increase in neighborhood satisfaction regardless of the centrality of areas where workers live in both the cases of remote workers (for those living in a central area, OR = 1.01; those living in a noncentral area, OR = 1.04) and nonremote workers (for those living in a central area, OR = 1.02; those living in a noncentral area, OR = 1.06). On the other hand, increase in geographic accessibility to gyms and fitness clubs did not show a significant relationship in all the cases.

5. Discussion

5.1. Main Findings

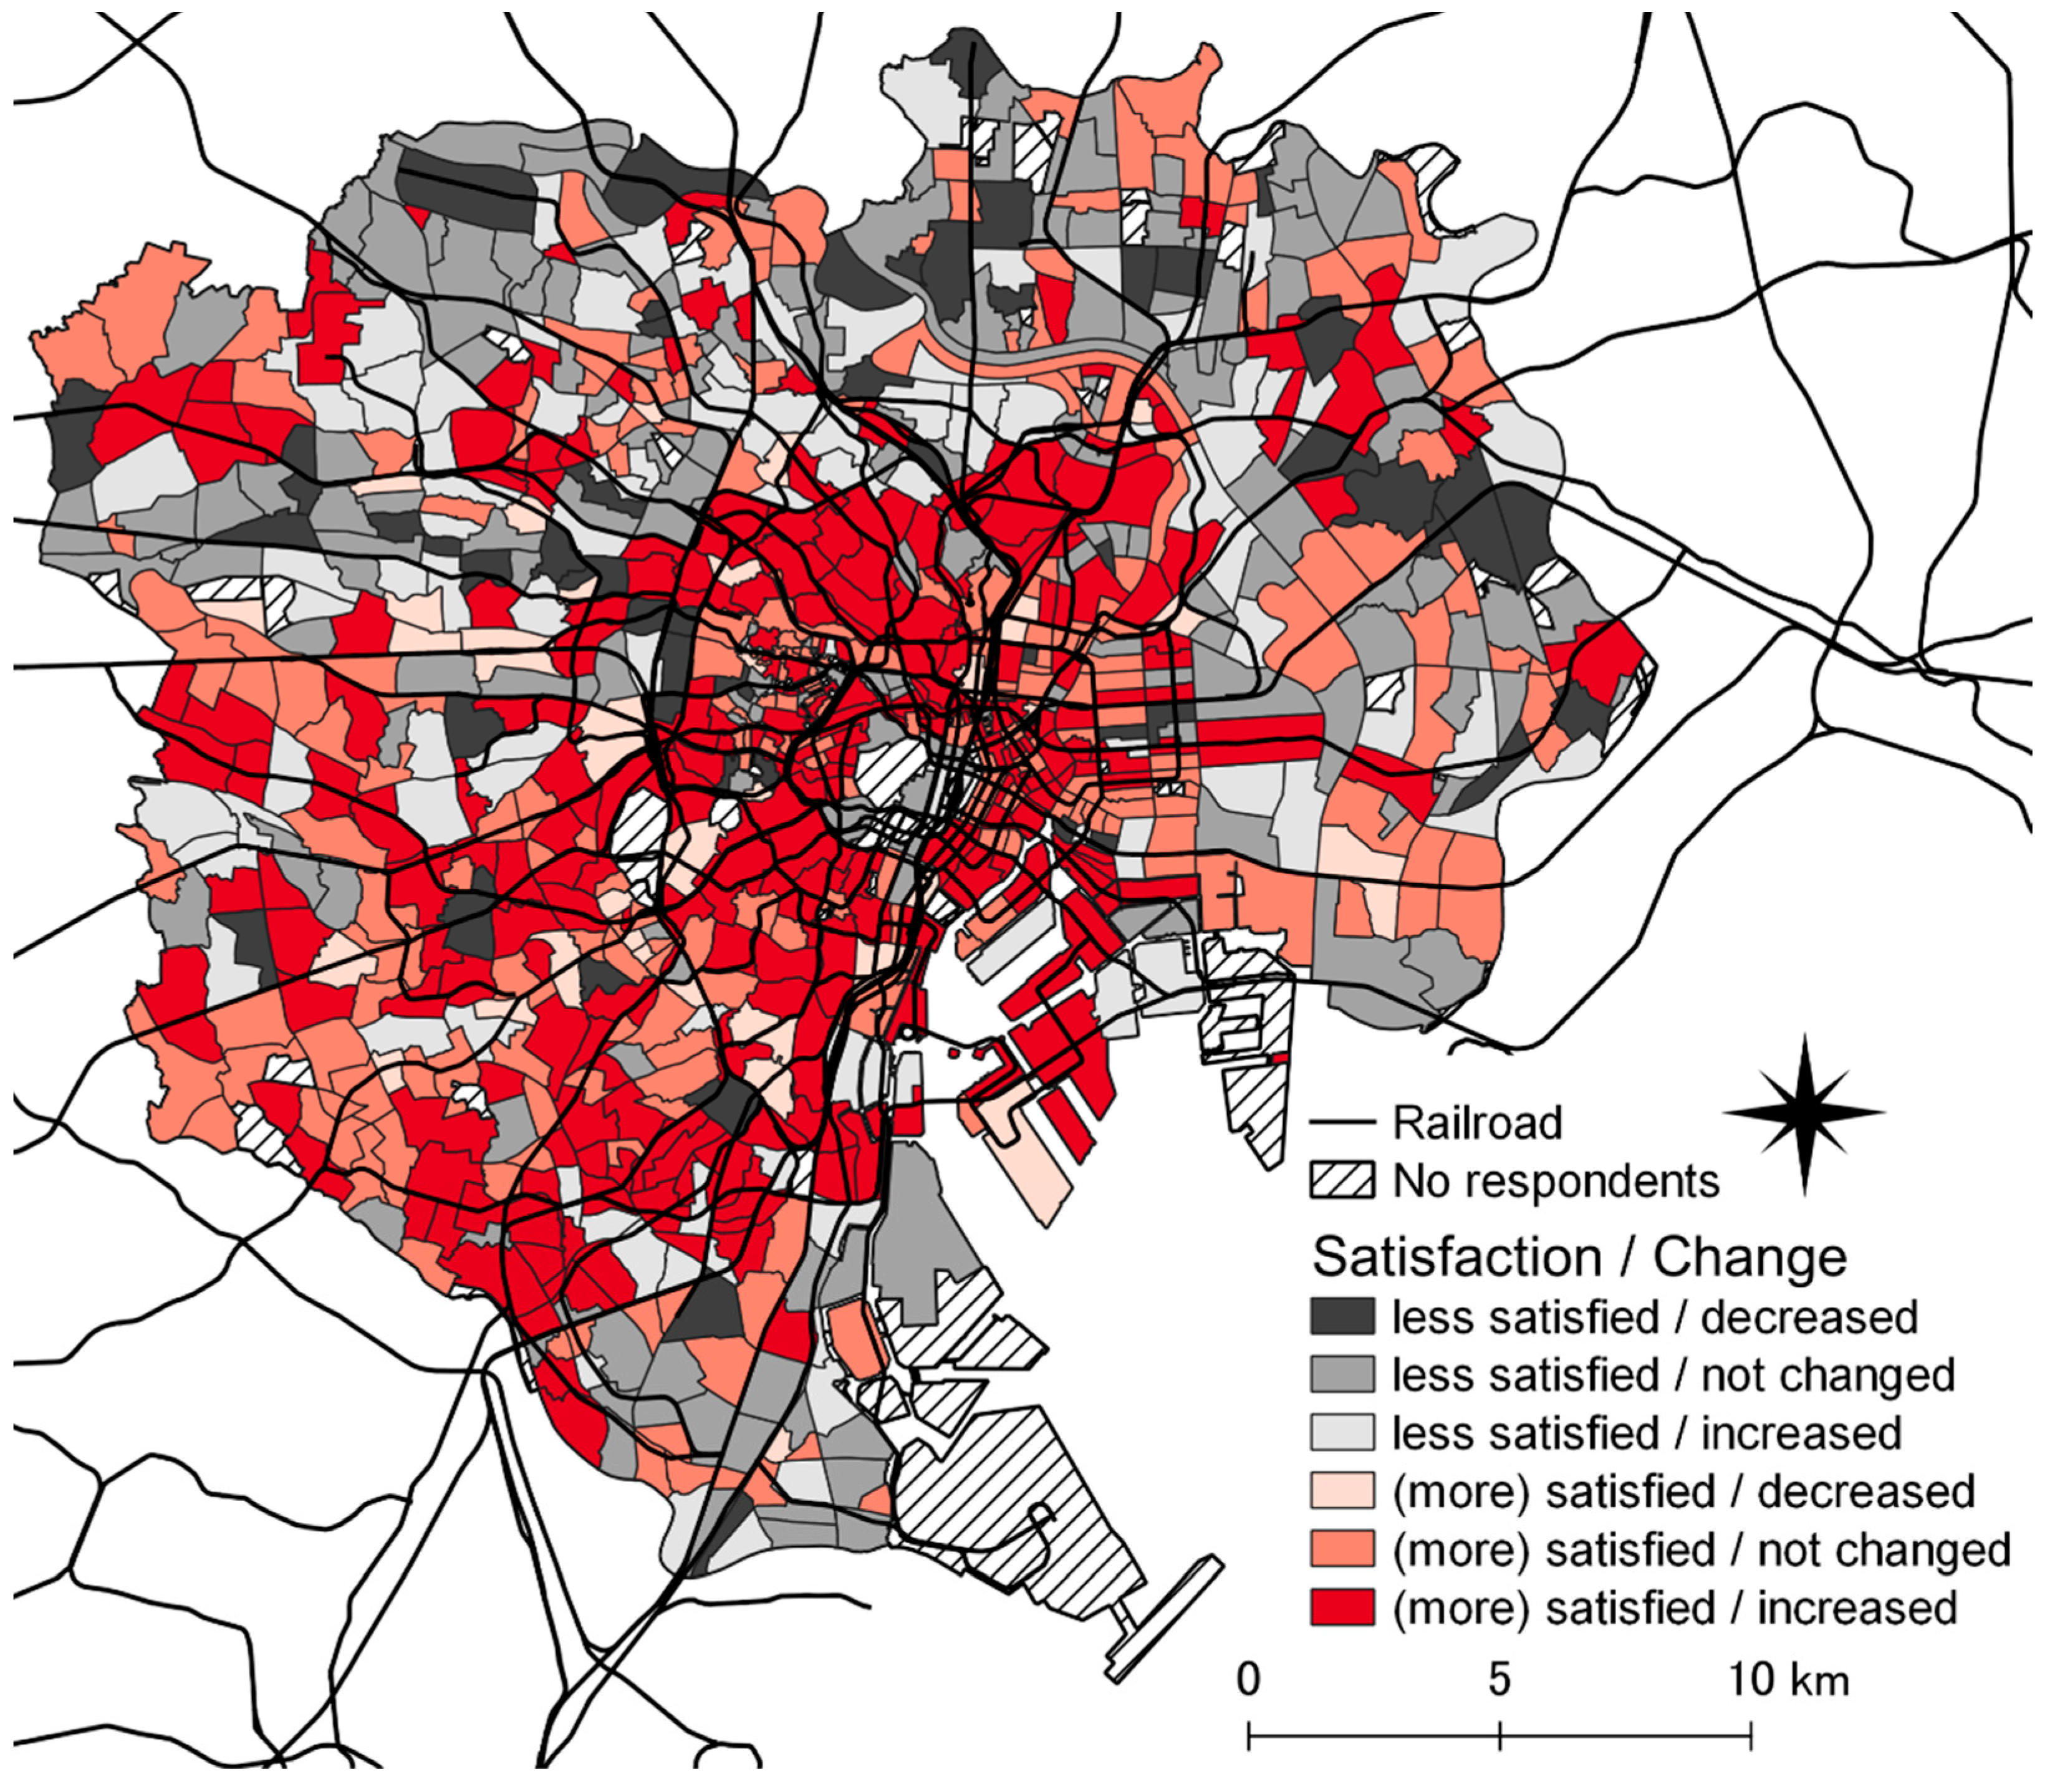
This study demonstrated that remote work is positively related to an increase in neighborhood satisfaction after the COVID-19 pandemic. We also observed that less decrease (or increase) in geographic accessibility to eating facilities is positively related to increase in neighborhood satisfaction of both remote and nonremote workers. Major findings from the relationships were threefold. The emergence of the COVID-19 pandemic impacted urban dwellers’ lifestyles with decreased face-to-face interactions, for example. Owing to the limited opportunities for face-to-face interactions, less decreased (or increased) geographic accessibility to the facilities that continue to provide opportunities near homes was found to be related to an increase in neighborhood satisfaction; possibly, this implies the realization of potential demand. Second, the pandemic possibly changed the places where people engage in activities from areas around workplaces to their neighborhoods, owing to the lockdown policy that limited activities in populated areas after the pandemic. Indeed, there were changes in the location of facilities for leisure activities (such as eating facilities, gyms, and fitness clubs) in central areas to areas that were not densely developed. In this case, those living in areas that continue to have a low level of geographic accessibility to those facilities (even after the pandemic) may not be satisfied with their neighborhoods. Third, the pandemic also possibly brought new demand, which was not considered important for daily life; in other words, there could be a shift in demand in neighborhoods—geographic accessibility to amenities and floor space workers prefer, for example. A detailed discussion of this follows.
Working remotely was found to be related to an increase in neighborhood satisfaction regardless of the centrality of areas where people live. It was found to exhibit a greater positive relationship in the case of people living in a noncentral area. This indicates that working remotely provides more benefits by reducing the time-related travel costs for those who should travel longer distance to workplaces (given that those living in noncentral areas travel longer distance to workplace; Table 1). Furthermore, people can manage their work schedule when they work remotely [17,18]. This enables remote workers to visit neighborhood facilities for social interaction and to conduct leisure activities with their family members and friends, despite the limited business hours of the facilities during the pandemic [35]. Even with the limited social interactions during the pandemic [54,55], working remotely enables people to spend more time for social interactions and leisure activities in their neighborhoods. Therefore, their neighborhood satisfaction increased.
Meanwhile, for those living in a noncentral area, the proximity to workplace was also found to exhibit a positive relationship with the increase. This could possibly link to the results of the relationship with remote work, indicating that the reduced time-related travel costs enable workers to spend more time within their neighborhoods. This is consistent with the results of the previous studies conducted before the pandemic [15,16]. On the other hand, a positive relationship between the proximity to workplace and an increase in neighborhood satisfaction was also found for remote workers living in a noncentral area but not for nonremote workers. Remote workers living in a noncentral area travel longer distances to their workplace on average than nonremote workers (Table 1). This is possibly attributable to nonremote workers’ residential preferences to lessen their time-related travel costs to their workplace. Despite the possible difference in preference for distance to workplace, there could be an acceptable level of distance to workplace from the perspective of neighborhood satisfaction; this is true for remote workers. Ultimately, reducing time-related travel costs to workplaces—by means of both working remotely and a closer distance to the workplace—remains an important factor of increasing neighborhood satisfaction even after the emergence of the pandemic.
In terms of house types, people living in single-family homes located in central areas were found to exhibit less likelihood of increase in neighborhood satisfaction. Central areas have high land prices, which force residents to choose among components of a satisfying environment according to theories of residential location choice regarding a trade-off between geographic accessibility and floor space [56,57]. Therefore, those living in single-family homes located in central areas may have sacrificed some of the required components after the pandemic began (e.g., safe open places for social interactions on the weekend).
On the other hand, living in a single-family home was also found to be negatively related to an increase in neighborhood satisfaction in the case of remote workers regardless of the centrality of areas where they live. According to a nationwide survey of residents [58], people living in single-family homes are more likely to consider their neighborhood community to be an important component of a satisfying environment and to be satisfied with the neighborhood community than those living in multifamily homes. Even though remote workers spend more time at and around their homes, limited relationships with neighbors after the emergence of the pandemic [54,55] could possibly be a barrier to increasing their neighborhood satisfaction. This highlights the importance of social interaction for an increase in the neighborhood satisfaction of remote workers. Another possible reason is the high preference of remote workers for neighborhood amenities [59,60]. Multifamily houses are more likely to be located near local centers; however, single-family houses have greater floor space. The lack of necessity to have extensive floor space could possibly make them prioritize neighborhood amenities over the size of floor space when working remotely and spending more time around their homes; this implies a shift in demand regarding the living environment after the pandemic. Further studies should be conducted to examine why the remote workers living in single-family homes exhibit less likelihood of increase in neighborhood satisfaction; those studies will help policymakers to determine which factors—social interactions or geographic accessibility to neighborhood amenities, for example—should be prioritized in the postpandemic world for efficient strategies to increase neighborhood satisfaction.
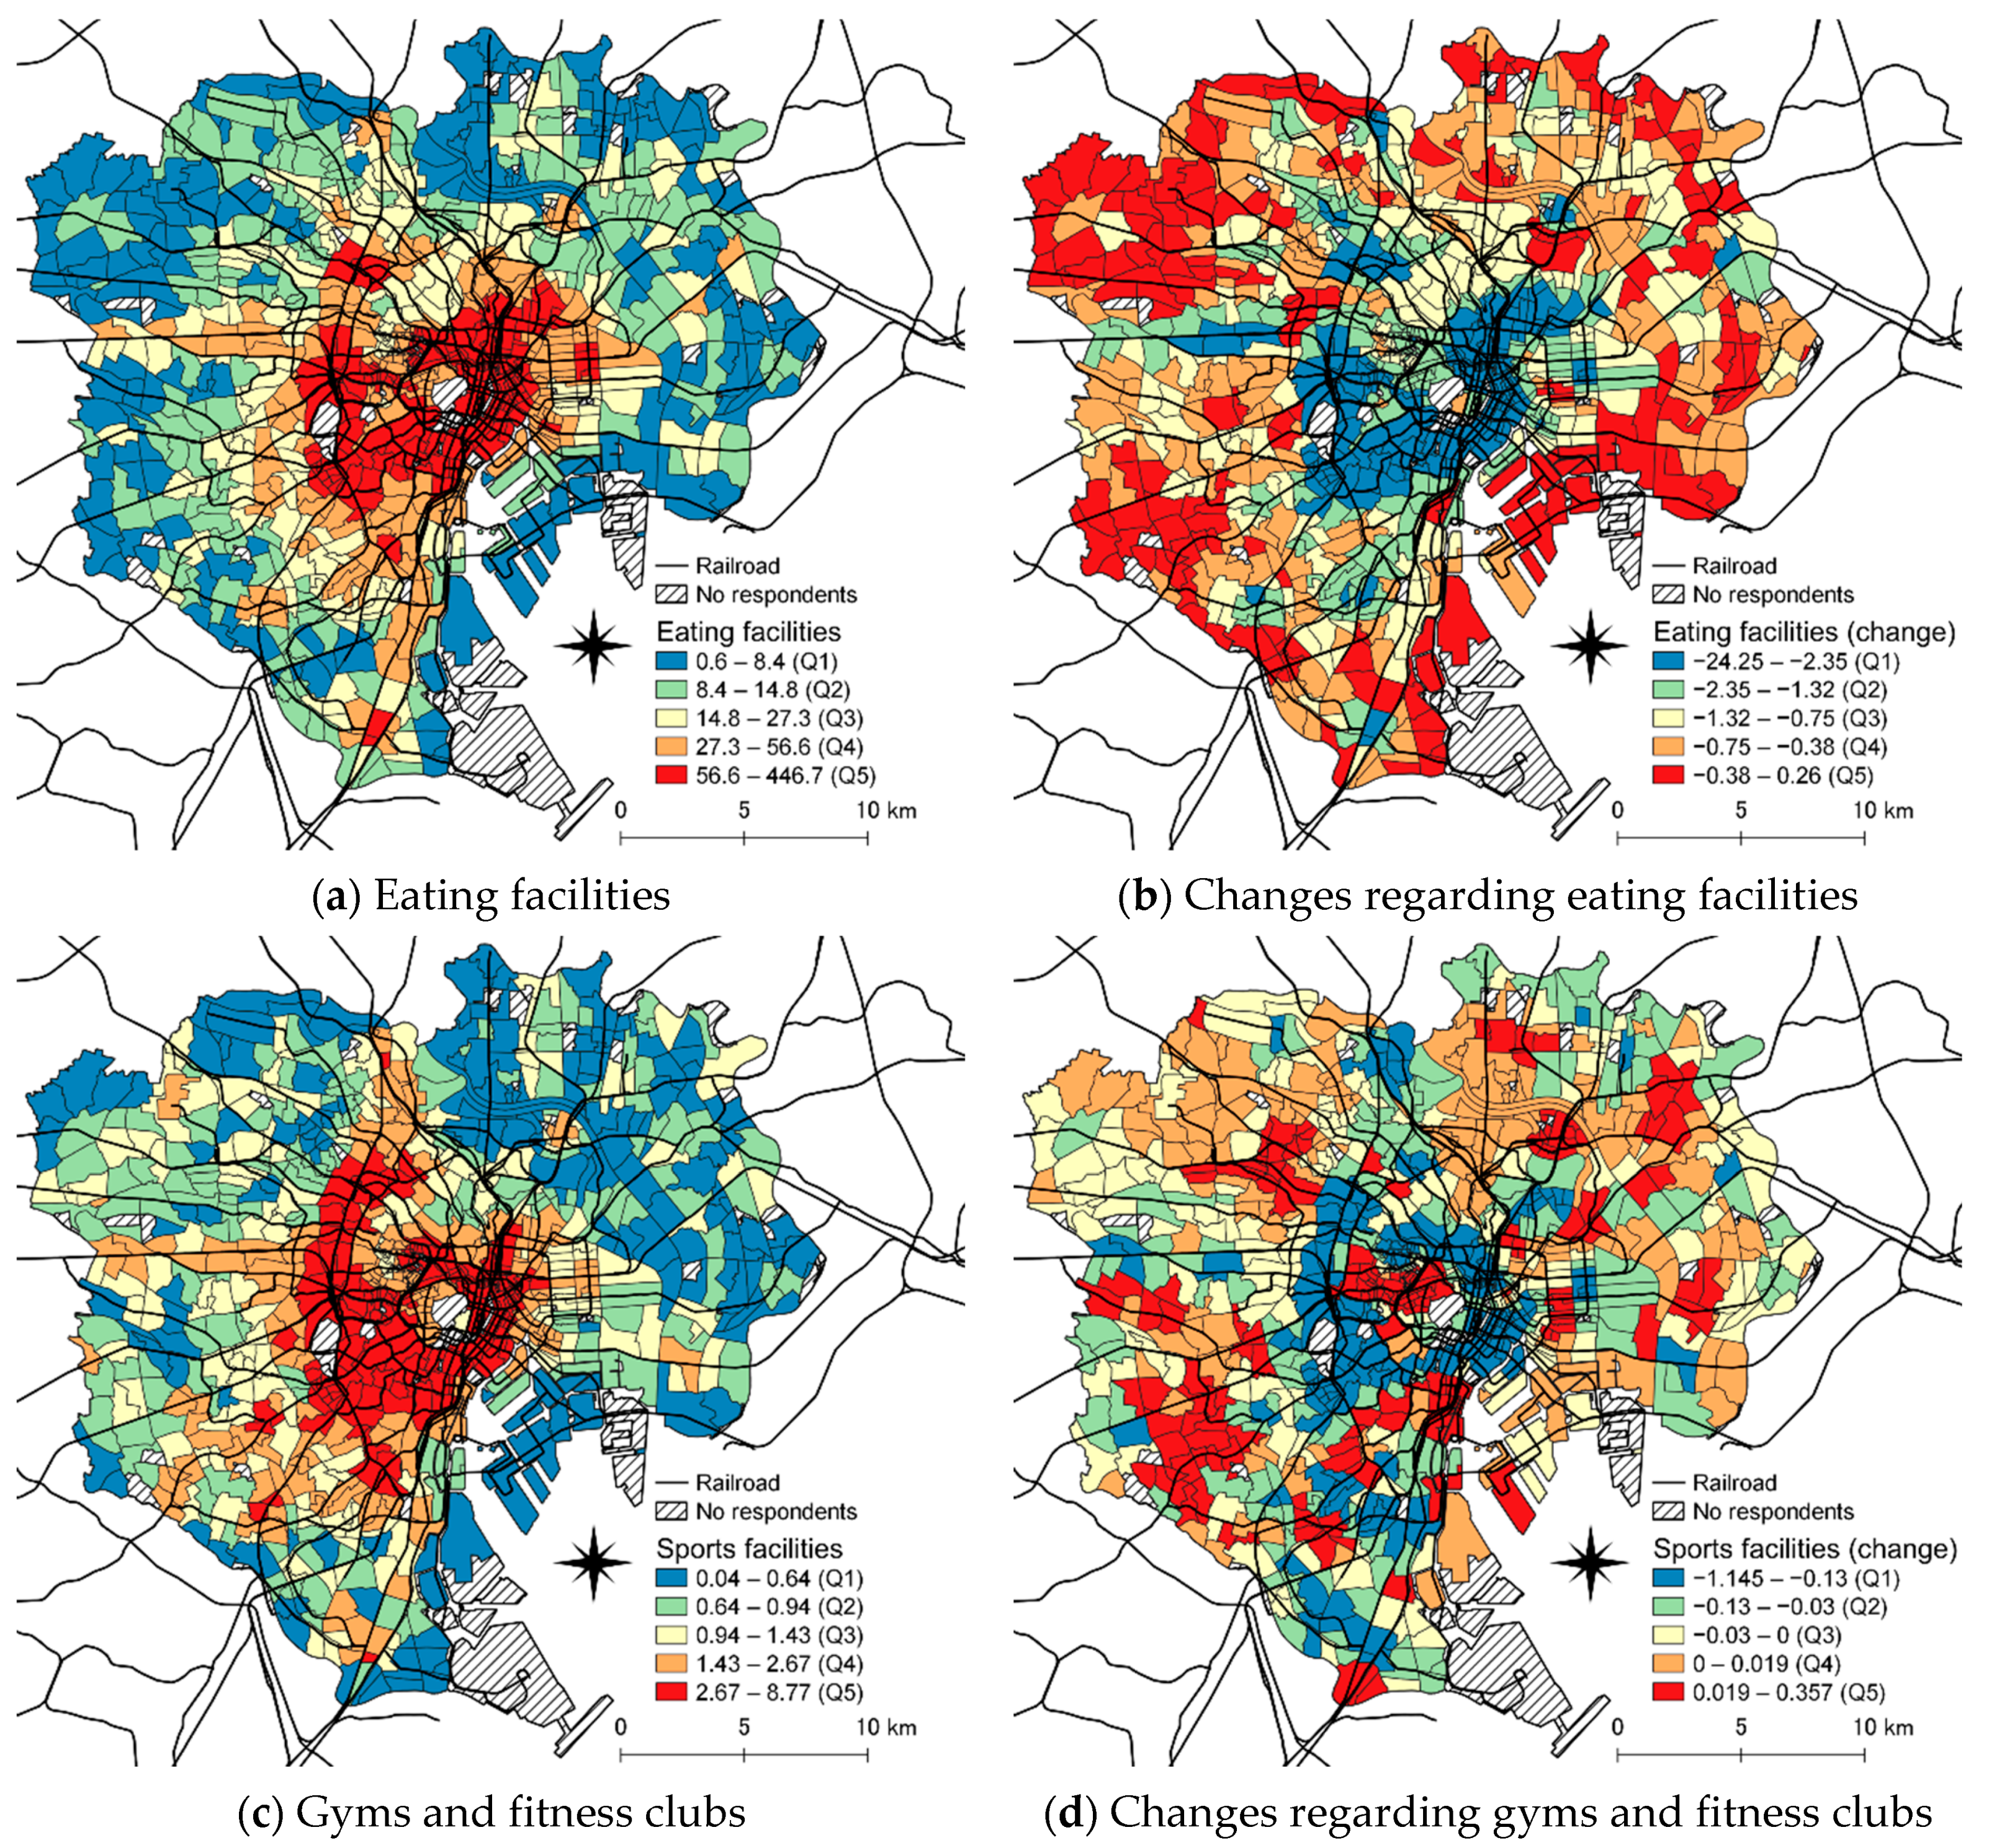
People could possibly have a negative perception of the areas with high geographic accessibility to neighborhood facilities owing to the spread of COVID-19 [31]. On the other hand, one may continue to need places for social interaction around one’s home as in prepandemic times, owing to the limited social interactions after the start of the pandemic [54,55]. Living in homes close to the third places—such as cafés, restaurants, and bars—provides opportunities to maintain residents’ social networks and reduce loneliness [27,61]; this could possibly be true even after the emergence of the COVID-19 pandemic. In other words, there could be a definite gap between the need for socializing and the actual engagement of urban residents. Therefore, the opinions of people living in neighborhoods where the geographic accessibility to eating facilities was less decreased (or increased)—which provides opportunities to continue to be socially engaged—could possibly be positively related to increase in neighborhood satisfaction. These new demands of residents, including both remote and nonremote workers, can lead to the benefits of high geographic accessibility. If the benefits of geographic accessibility are greater than the negative perception of populated places, the neighborhoods where geographic accessibility is less decreased (or increased) may lead to an increase in residents’ satisfaction. Indeed, residents who live in neighborhoods where the geographic accessibility to eating facilities was less decreased (or increased) were found to show increased neighborhood satisfaction after the pandemic started.
Unlike for eating facilities, increase in geographic accessibility to gyms and fitness clubs was found to exhibit a nonsignificant relationship with the likelihood of increase in neighborhood satisfaction. People’s physical activity has tended to decrease since the pandemic [62,63]. On the other hand, the emergence of the COVID-19 pandemic may stimulate people’s health consciousness [64,65] and motivate physical activity even after the pandemic [66]. However, the result of the nonsignificant relationship with increase in geographic accessibility to gyms and fitness clubs implies that some people are reluctant to visit those facilities and opt for exercising at their homes, for example. Indeed, home exercise has been recommended as a way of maintaining physical activities after the emergence of the pandemic [67]. In other words, there are substitute services for the facilities for exercising. In contrast, it is relatively difficult to substitute facilities for social interactions, such as eating facilities; therefore, less decrease (or increase) in geographic accessibility was found to exhibit a positive relationship with increase in neighborhood satisfaction for both remote and nonremote workers. This emphasizes the importance of social connections, and the social connections should be considered as an important factor of making residents—including both remote and nonremote workers—more satisfied with their neighborhoods even after the emergence of the pandemic.
The restrictions on facilities where people conduct socioeconomic activities increase the cost of conducting the activities [36]. As a result, the increased costs after the pandemic possibly caused the shift in places where people living in noncentral areas engage in activities from areas around their workplace to their neighborhoods. Indeed, our study revealed that there was more decrease in geographic accessibility to amenities in central areas after the start of the pandemic. This implies that demand for some facilities in central areas has shifted to noncentral areas since the pandemic and facility location (supply) has changed according to demand. On the other hand, this study considered the average walking distance when measuring the geographic accessibility to facilities. Our study revealed that residents who live in neighborhoods where the geographic accessibility to amenities (e.g., eating facilities) was less decreased (or increased) show increased neighborhood satisfaction after the pandemic started. This implies that people still prefer walkable neighborhoods with a higher geographic accessibility to amenities among the noncentral areas, and those living in areas with a low level of geographic accessibility may not be satisfied with their neighborhoods even after the pandemic. However, further studies should be conducted to better understand the relationship between neighborhood walkability and neighborhood satisfaction after the pandemic.
In the prepandemic world, compact and densely developed cities were the places which residents considered more livable [68]. The findings from this study suggest that populated cities continued to provide prepandemic benefits for their residents—even for the remote workers—by means of their large variety in urban services; this empirical evidence supports the claim that the pandemic may not alter the advantages of dense development [31,69]. This is in line with findings from countries outside Japan [39,70,71,72] and highlights the importance of geographic accessibility to neighborhood facilities during COVID-19 even in densely developed cities. Therefore, development that improves geographic accessibility to neighborhood services can be a strategy for sustainable neighborhoods during and after the pandemic. Policymakers in densely developed areas may be able to weigh the risk of COVID-19 transmission, the benefits of social interaction, and neighborhood facilities’ geographic accessibility when discussing policies for sustainable neighborhood development. However, it is also true that the pandemic has changed the lifestyle of people living in populated cities. Even with an assumption that remote work continues to be promoted as a new way of working, neighborhood amenities (not concentrated in central areas) possibly continue to be a factor for satisfying residents. Given that it is difficult to change the neighborhood environment and working style which people are satisfied with, the postpandemic urban structure may not become the same as that of the prepandemic world (such as strong concentration in central areas). Therefore, it is necessary to continue monitoring residents’ neighborhood satisfaction to discuss the direction of urban development for the postpandemic world.

5.2. Limitations

This study tested the relationships between geographic accessibility to neighborhood facilities and neighborhood satisfaction according to both the status of remote work and the centrality of areas where workers live, but it has several limitations. First, there could be self-selection bias regarding the status of remote work, preferred neighborhood surroundings, and the area where people live. In other words, it is possible that the relationships observed in this study are a tendency according to individual differences rather than a causal mechanism. Further research is required to consider factors such as experience regarding remote work, self-efficacy, and changes in attitudes toward COVID-19, remote work, and neighborhood environments and determine which factors may differ according to socioeconomic status, occupational status, and industry type. Those factors could possibly mediate the relationships between neighborhood environment and satisfaction.
Another limitation is the possible difference between stated preferences and revealed preferences. Given that this study employed a cross-sectional survey to analyze residents’ subjective changes in neighborhood satisfaction (stated preference), it is hard to conclude that remote workers will keep living at their current address in the long term. Even though residents who are satisfied with their neighborhood are more likely to continue to live at their current address, longitudinal surveys which track residents’ homes addresses (revealed preference) are necessary to test whether the remote work changes the location where they live.
This study observed that remote workers living in populated areas reported increases in neighborhood satisfaction after the emergence of the pandemic. However, there may be differences on the city scale in terms of the relationships between working remotely and neighborhood satisfaction. Comparisons between those who live in urban, suburban, rural areas, and areas in other countries should be conducted in further studies.
In addition, there is imbalance regarding the neighborhood satisfaction change (i.e., most of the respondents reported that their neighborhood satisfaction is unchanged; more respondents reported increase in neighborhood satisfaction than decrease). Therefore, the results of this study could possibly be biased toward the relationships with increase in neighborhood satisfaction and miss some factors related to decrease. Considering that the changes were for about a year after the emergence of the COVID-19 pandemic, this study still contributes to discussing the direction of urban development during the pandemic. However, further trajectory surveys should be conducted to track the changes in neighborhood satisfaction after several years beyond the emergence of the pandemic and to test the relationship with the changes in the status of remote work.

6. Conclusions

This study tested the relationship between remote work and changes in neighborhood satisfaction after the emergence of the pandemic and discerned the difference between remote and nonremote workers, as well as the centrality of areas where they live, in the relationships between geographic accessibility to neighborhood facilities and related changes. Working remotely was associated with an increase in residents’ neighborhood satisfaction regardless of the centrality of areas where they live. Remote workers living in single-family homes were found to be less satisfied with their neighborhoods. Less decrease (or increase) in geographic accessibility to eating facilities was related to increased neighborhood satisfaction for both remote and nonremote workers regardless of the centrality of areas where they live. The findings suggest that geographic accessibility to neighborhood facilities has remained a factor in improving neighborhood satisfaction even after the emergence of the pandemic. However, there could be a shift of demand for facilities in central areas to noncentral areas since the pandemic.

Author Contributions

Conceptualization, H.K.; formal analysis, H.K.; investigation, H.K.; resources, C.S.; writing—original draft preparation, H.K.; writing—review and editing, H.K. and C.S.; supervision, C.S. All authors have read and agreed to the published version of the manuscript.

Funding

This research received no external funding.

Institutional Review Board Statement

Not applicable.

Informed Consent Statement

Not applicable.

Data Availability Statement

Data are not publicly available, though the data may be made available on request from the authors.

Acknowledgments

We thank Recruit Co., Ltd. For their cooperation.

Conflicts of Interest

The authors declare no conflict of interest.

References

  1. Campbell, A.; Converse, P.; Rodgers, W. The Quality of American Life: Perceptions, Evaluations and Satisfactions; Russell Sage Foundation: New York, NY, USA, 1976. [Google Scholar]
  2. Cao, X. How does neighborhood design affect life satisfaction? Evidence from Twin Cities. Travel Behav. Soc. 2016, 5, 68–76. [Google Scholar] [CrossRef]
  3. Dong, H.; Qin, B. Exploring the link between neighborhood environment and mental wellbeing: A case study in Beijing, China. Landsc. Urban Plan. 2017, 164, 71–80. [Google Scholar] [CrossRef]
  4. Ma, J.; Dong, G.; Chen, Y.; Zhang, W. Does satisfactory neighbourhood environment lead to a satisfying life? An investigation of the association between neighbourhood environment and life satisfaction in Beijing. Cities 2018, 74, 229–239. [Google Scholar] [CrossRef]
  5. Jiang, W.; Feng, T.; Timmermans, H.; Li, H. A gap-theoretical path model of residential satisfaction and intention to move house applied to renovated historical blocks in two Chinese cities. Cities 2017, 71, 19–29. [Google Scholar] [CrossRef]
  6. Oh, J.-H. Social Bonds and the Migration Intentions of Elderly Urban Residents: The Mediating Effect of Residential Satisfaction. Popul. Res. Policy Rev. 2003, 22, 127–146. [Google Scholar] [CrossRef]
  7. Lovejoy, K.; Handy, S.; Mokhtarian, P. Neighborhood satisfaction in suburban versus traditional environments: An evaluation of contributing characteristics in eight California neighborhoods. Landsc. Urban Plan. 2010, 97, 37–48. [Google Scholar] [CrossRef]
  8. Marans, R.W.; Rodgers, S.W. Toward an understanding of community satisfaction. In Metropolitan America in Contemporary Perspective; Hawley, A., Rock, V., Eds.; Halstead Press: New York, NY, USA, 1975. [Google Scholar]
  9. Cloutier, S.; Pfeiffer, D. Sustainability through Happiness: A Framework for Sustainable Development. Sustain. Dev. 2015, 23, 317–327. [Google Scholar] [CrossRef]
  10. Mouratidis, K. Commute satisfaction, neighborhood satisfaction, and housing satisfaction as predictors of subjective well-being and indicators of urban livability. Travel Behav. Soc. 2020, 21, 265–278. [Google Scholar] [CrossRef]
  11. Zhan, D.; Kwan, M.-P.; Zhang, W.; Fan, J.; Yu, J.; Dang, Y. Assessment and determinants of satisfaction with urban livability in China. Cities 2018, 79, 92–101. [Google Scholar] [CrossRef]
  12. Amérigo, M.; Aragones, J.I. A theoretical and methodological approach to the study of residential satisfaction. J. Environ. Psychol. 1997, 17, 47–57. [Google Scholar] [CrossRef]
  13. Galster, G. Identifying the correlates of dwelling satisfaction: An empirical critique. Environ. Behav. 1987, 19, 539–568. [Google Scholar]
  14. Jansen, S. The impact of the have–want discrepancy on residential satisfaction. J. Environ. Psychol. 2014, 40, 26–38. [Google Scholar] [CrossRef]
  15. Cao, X.J.; Wang, D. Environmental correlates of residential satisfaction: An exploration of mismatched neighborhood characteristics in the Twin Cities. Landsc. Urban Plan. 2016, 150, 26–35. [Google Scholar] [CrossRef]
  16. Hur, M.; Morrow-Jones, H. Factors That Influence Residents' Satisfaction with Neighborhoods. Environ. Behav. 2008, 40, 619–635. [Google Scholar] [CrossRef]
  17. Anderson, S.E.; Coffey, B.S.; Byerly, R.T. Formal organizational initiatives and informal workplace practices: Links to work-family conflict and job-related outcomes. J. Manag. 2002, 28, 787–810. [Google Scholar]
  18. Dockery, M.; Bawa, S. Working from Home in the COVID-19 Lockdown. BCEC: Bentley, WA, Australian, 2020; Volume 19, pp. 1–5. Available online: https://bcec.edu.au/assets/2020/05/BCEC-COVID19-Brief-4_Working-from-home.pdf (accessed on 20 August 2022).
  19. Baum, S.; Arthurson, K.; Rickson, K. Happy People in Mixed-up Places: The Association between the Degree and Type of Local Socioeconomic Mix and Expressions of Neighbourhood Satisfaction. Urban Stud. 2010, 47, 467–485. [Google Scholar] [CrossRef]
  20. Howley, P.; Scott, M.; Redmond, D. Sustainability versus liveability: An investigation of neighbourhood satisfaction. J. Environ. Plan. Manag. 2009, 52, 847–864. [Google Scholar] [CrossRef]
  21. Ibem, E.O.; Opoko, P.A.; Aduwo, E.B. Satisfaction with Neighbourhood Environments in Public Housing: Evidence from Ogun State, Nigeria. Soc. Indic. Res. 2017, 130, 733–757. [Google Scholar] [CrossRef]
  22. Leslie, E.; Cerin, E. Are perceptions of the local environment related to neighbourhood satisfaction and mental health in adults? Prev. Med. 2008, 47, 273–278. [Google Scholar] [CrossRef]
  23. Parkes, A.; Kearns, A.; Atkinson, R. What makes people dissatisfied with their neighbourhoods? Urban Stud. 2002, 39, 2413–2438. [Google Scholar] [CrossRef]
  24. Jeffres, L.W.; Bracken, C.C.; Jian, G.; Casey, M.F. The Impact of Third Places on Community Quality of Life. Appl. Res. Qual. Life 2009, 4, 333–345. [Google Scholar] [CrossRef]
  25. Oldenburg, R. The Great Good Place: Cafes, Coffee Shops, Bookstores, Bars, Hair Salons, and Other Hangouts at the Heart of a Community; Marlowe & Company: New York, NY, USA, 1999. [Google Scholar]
  26. Talen, E. Neighborhoods as Service Providers: A Methodology for Evaluating Pedestrian Access. Environ. Plan. B Plan. Des. 2003, 30, 181–200. [Google Scholar] [CrossRef]
  27. Cabrera, J.F.; Najarian, J.C. How the Built Environment Shapes Spatial Bridging Ties and Social Capital. Environ. Behav. 2015, 47, 239–267. [Google Scholar] [CrossRef]
  28. Mouratidis, K. Built environment and social well-being: How does urban form affect social life and personal relationships? Cities 2018, 74, 7–20. [Google Scholar] [CrossRef]
  29. Ewing, R.; Cervero, R. Travel and the built environment: A meta-analysis. J. Am. Plan. Assoc. 2010, 76, 1491–1500. [Google Scholar] [CrossRef]
  30. Gidlow, C.; Cerin, E.; Sugiyama, T.; Adams, M.A.; Mitáš, J.; Akram, M.; Reis, R.S.; Davey, R.; Troelsen, J.; Schofield, G.; et al. Objectively measured access to recreational destinations and leisure-time physical activity: Associations and demographic moderators in a six-country study. Health Place 2019, 59, 102196. [Google Scholar] [CrossRef]
  31. Florida, R.; Rodríguez-Pose, A.; Storper, M. Cities in a post-COVID world. Urban Stud. 2021, 1–23. [Google Scholar] [CrossRef]
  32. Batty, M. The Coronavirus crisis: What will the post-pandemic city look like? Environ. Plan. B Urban Anal. City Sci. 2020, 47, 547–552. [Google Scholar] [CrossRef]
  33. Couclelis, H. There will be no Post-COVID city. Environ. Plan. B Urban Anal. City Sci. 2020, 47, 1121–1123. [Google Scholar] [CrossRef]
  34. Nathan, M.; Overman, H. Will coronavirus cause a big city exodus? Environ. Plan. B Urban Anal. City Sci. 2020, 47, 1537–1542. [Google Scholar] [CrossRef]
  35. Ministry of Land, Infrastructure, Transport and Tourism. Summary of the White Paper on Land, Infrastructure, Transport and Tourism in Japan; 2021. Available online: https://www.mlit.go.jp/en/statistics/content/001442571.pdf (accessed on 30 March 2022).
  36. Diewert, W.E.; Fox, K.J. Measuring Real Consumption and CPI Bias under Lockdown Conditions. Available online: https://www.nber.org/papers/w27144 (accessed on 29 March 2022).
  37. Mouratidis, K. COVID-19 and the compact city: Implications for well-being and sustainable urban planning. Sci. Total Environ. 2022, 811, 152332. [Google Scholar] [CrossRef] [PubMed]
  38. Mouratidis, K.; Yiannakou, A. COVID-19 and urban planning: Built environment, health, and well-being in Greek cities before and during the pandemic. Cities 2022, 121, 103491. [Google Scholar] [CrossRef] [PubMed]
  39. Mouratidis, K.; Yiannakou, A. What makes cities livable? Determinants of neighborhood satisfaction and neighborhood happiness in different contexts. Land Use Policy 2022, 112, 105855. [Google Scholar] [CrossRef]
  40. Ministry of Health, Labour and Welfare. Annual Health, Labour and Welfare Report 2020. Available online: https://www.mhlw.go.jp/english/wp/wp-hw13/index.html (accessed on 30 March 2022).
  41. Cabinet Office. Survey on Changes in Attitudes and Behaviors under the Influence of Coronavirus Infections. Available online: https://www5.cao.go.jp/keizai2/wellbeing/covid/pdf/result3_covid.pdf (accessed on 29 March 2022).
  42. Bailey, D.E.; Kurland, N.B. A Review of telework research: Findings, new directions, and lessons for the study of modern work. J. Organ. Behav. 2002, 23, 383–400. [Google Scholar] [CrossRef]
  43. Organisation for Economic Co-operation and Development. Productivity Gains from Teleworking in the Post COVID-19 Era: How Can Public Policies Make It Happen? Available online: https://read.oecd-ilibrary.org/view/?ref=135_135250-u15liwp4jd&title=Productivity-gains-from-teleworking-in-the-post-COVID-19-era (accessed on 17 August 2021).
  44. Sostero, M.; Milasi, S.; Hurley, J.; Fernández-Macías, E.; Bisello, M. Teleworkability and the COVID-19 Crisis: A New Digital Divide? Available online:https://ec.europa.eu/jrc/sites/default/files/jrc121193.pdf (accessed on 17 August 2021).
  45. Ministry of Land, Infrastructure, Transport and Tourism. Survey on Teleworking Population. Available online: https://www.mlit.go.jp/toshi/daisei/content/001471979.pdf (accessed on 15 July 2022).
  46. Dempsey, N.; Bramley, G.; Power, S.; Brown, C. The social dimension of sustainable development: Defining urban social sustainability. Sustain. Dev. 2011, 19, 289–300. [Google Scholar] [CrossRef]
  47. Eizenberg, E.; Jabareen, Y. Social Sustainability: A New Conceptual Framework. Sustainability 2017, 9, 68. [Google Scholar] [CrossRef]
  48. Larimian, T.; Sadeghi, A. Measuring urban social sustainability: Scale development and validation. Environ. Plan. B Urban Anal. City Sci. 2021, 48, 621–637. [Google Scholar] [CrossRef]
  49. Cervero, R.; Kockelman, K. Travel demand and the 3Ds: Density, diversity, and design. Transp. Res. Part D Transp. Environ. 1997, 2, 199–219. [Google Scholar] [CrossRef]
  50. Frank, L.D. Land Use and Transportation Interaction: Implications on Public Health and Quality of Life. J. Plan. Educ. Res. 2000, 20, 6–22. [Google Scholar] [CrossRef]
  51. Hino, K.; Usui, H.; Hanazato, M. Three-Year Longitudinal Association Between Built Environmental Factors and Decline in Older Adults’ Step Count: Gaining insights for Age-Friendly Urban Planning and Design. Int. J. Environ. Res. Public Health 2020, 17, 4247. [Google Scholar] [CrossRef]
  52. Yang, Y.; Diez-Roux, A.V. Walking Distance by Trip Purpose and Population Subgroups. Am. J. Prev. Med. 2012, 43, 11–19. [Google Scholar] [CrossRef] [PubMed]
  53. Ministry of Internal Affairs and Communications. Survey on Housing and Land. Available online: https://www.e-stat.go.jp/stat-search/files?page=1&layout=datalist&toukei=00200522&tstat=000001127155&cycle=0&year=20180&month=0&tclass1=000001129435&tclass2=000001129436 (accessed on 28 March 2022).
  54. Macdonald, B.; Hülür, G. Well-Being and Loneliness in Swiss Older Adults During the COVID-19 Pandemic: The Role of Social Relationships. Gerontologist 2021, 61, 240–250. [Google Scholar] [CrossRef] [PubMed]
  55. Philpot, L.M.; Ramar, P.; Roellinger, D.L.; Barry, B.A.; Sharma, P.; Ebbert, J.O. Changes in social relationships during an initial “stay-at-home” phase of the COVID-19 pandemic: A longitudinal survey study in the US. Soc. Sci. Med. 2021, 274, 113779. [Google Scholar] [CrossRef] [PubMed]
  56. Alonso, W. Location and Land-Use; Harvard University Press: Cambridge, MA, USA, 1964. [Google Scholar]
  57. Kim, J.H.; Pagliara, F.; Preston, J. The Intention to Move and Residential Location Choice Behaviour. Urban Stud. 2005, 42, 1621–1636. [Google Scholar] [CrossRef]
  58. Ministry of Land, Infrastructure, Transport and Tourism. Comprehensive Survey on Housing Life. Available online: https://www.e-stat.go.jp/stat-search/files?page=1&layout=datalist&toukei=00600650&kikan=00600&tstat=000001136639&cycle=0&tclass1=000001136640&tclass2val=0 (accessed on 22 August 2021).
  59. Frenkel, A.; Bendit, E.; Kaplan, S. Residential location choice of knowledge-workers: The role of amenities, workplace and lifestyle. Cities 2013, 35, 33–41. [Google Scholar] [CrossRef]
  60. Lawton, P.; Murphy, E.; Redmond, D. Residential preferences of the ‘creative class’? Cities 2013, 31, 47–56. [Google Scholar] [CrossRef]
  61. Lund, H. Testing the claims of new urbanism: Local access, pedestrian travel, and neighboring behaviors. J. Am. Plan. Assoc. 2003, 69, 414–429. [Google Scholar] [CrossRef]
  62. Hall, G.; Laddu, D.R.; Phillips, S.A.; Lavie, C.J.; Arena, R. A tale of two pandemics: How will COVID-19 and global trends in physical inactivity and sedentary behavior affect one another? Prog. Cardiovasc. Dis. 2021, 64, 108–110. [Google Scholar] [CrossRef]
  63. Lesser, I.A.; Nienhuis, C.P. The Impact of COVID-19 on Physical Activity Behavior and Well-Being of Canadians. Int. J. Environ. Res. Public Health 2020, 17, 3899. [Google Scholar] [CrossRef]
  64. Qi, X.; Ploeger, A. Explaining Chinese Consumers’ Green Food Purchase Intentions during the COVID-19 Pandemic: An Extended Theory of Planned Behaviour. Foods 2021, 10, 1200. [Google Scholar] [CrossRef]
  65. Westbrook, G.; Angus, A. Top 10 Global Consumer Trends 2021. Available online: https://www.nourishingafrica.com/documents/1620054622wpGCT21EN-v0.8.pdf (accessed on 25 August 2021).
  66. Pu, B.; Zhang, L.; Tang, Z.; Qiu, Y. The Relationship between Health Consciousness and Home-Based Exercise in China during the COVID-19 Pandemic. Int. J. Environ. Res. Public Health 2020, 17, 5693. [Google Scholar] [CrossRef] [PubMed]
  67. Wilke, J.; Mohr, L.; Tenforde, A.; Edouard, P.; Fossati, C.; González-Gross, M.; Ramirez, C.; Laiño, F.; Tan, B.; Pillay, J.; et al. Restrictercise! Preferences Regarding Digital Home Training Programs during Confinements Associated with the COVID-19 Pandemic. Int. J. Environ. Res. Public Health 2020, 17, 6515. [Google Scholar] [CrossRef] [PubMed]
  68. Mouratidis, K. Is compact city livable? The impact of compact versus sprawled neighbourhoods on neighbourhood satisfaction. Urban Stud. 2017, 55, 2408–2430. [Google Scholar] [CrossRef]
  69. Hamidi, S.; Sabouri, S.; Ewing, R. Does density aggravate the COVID-19 pandemic? Early findings and lessons for planners. J. Am. Plan. Assoc. 2020, 86, 495–509. [Google Scholar] [CrossRef]
  70. Crossley, A.J.; Russo, A. Has the pandemic altered public perception of how local green spaces affect quality of life in the United Kingdom? Sustainability 2022, 14, 7946. [Google Scholar] [CrossRef]
  71. Pipitone, J.M.; Jović, S. Urban green equity and COVID-19: Effects on park use and sense of belonging in New York City. Urban For. Urban Green. 2021, 65, 127338. [Google Scholar] [CrossRef]
  72. Segev-Jacubovski, O.; Shapiro, E. Role of Participation in Activities and Perceived Accessibility on Quality of Life among Nondisabled Older Adults and Those with Disabilities in Israel during COVID-19. Int. J. Environ. Res. Public Health 2022, 19, 5878. [Google Scholar] [CrossRef]
Figure 1. Location of the target area and central areas. Major stations were the train stations near the central business districts of Tokyo, Japan.
Sustainability 14 10588 g001
Figure 2. Spatial distribution of neighborhood satisfaction level among respondents and its changes after the emergence of the COVID-19 pandemic. Neighborhood satisfaction and its change at the neighborhood level were measured by the mean scores of individuals living in each area (for neighborhood satisfaction level, 1: less satisfied, 2: satisfied, and 3: more satisfied; for changes in neighborhood satisfaction, 1: decreased, 2: unchanged, and 3: increased). Values between 1 and 2 indicate that more respondents reported decreased neighborhood satisfaction for the areas where they live, i.e., more respondents who reported increased neighborhood satisfaction for the values between 2 and 3. This figure shows that areas where more respondents reported that their neighborhood satisfaction increased (than those who reported decreased satisfaction) were distributed alongside the railroads.
Sustainability 14 10588 g002
Figure 3. Spatial distribution of geographic accessibility and its changes after the emergence of the COVID-19 pandemic. This figure reports that geographic accessibility to facilities decreased more in the central areas. The central areas show high geographic accessibility to (a) eating facilities and (c) sports facilities. The noncentral areas show less decrease (or increase) in geographic accessibility to (b) eating facilities and (d) sports facilities than central areas.
Sustainability 14 10588 g003
Table 1. Respondents’ characteristics by each subgroup (N = 9123).
CharacteristicsRemote WorkersNonremote Workers
Living in a Central AreaLiving in a Noncentral AreaLiving in a Central AreaLiving in a Noncentral Area
Age47.3 ± 10.547.9 ± 11.049.9 ± 11.249.4 ± 11.3
Sex
 Male1260 (65.9)1546 (68.3)1140 (58.0)1664 (55.8)
 Female652 (34.1)719 (31.7)826 (42.0)1316 (44.2)
Income (million JPY/year)
 0–358 (3.0)94 (4.2)207 (10.5)299 (10.0)
 3–6268 (14.0)326 (14.4)446 (22.7)758 (25.4)
 6–9291 (15.2)336 (14.8)255 (13.0)407 (13.7)
 9–12224 (11.7)289 (12.8)156 (7.9)224 (7.5)
 ≥12329 (17.2)324 (14.3)141 (7.2)117 (3.9)
 Missing742 (38.8)896 (39.6)761 (38.7)1115 (37.4)
Housing tenure
 Owned992 (51.9)1272 (56.2)993 (50.5)1599 (53.7)
 Rent920 (48.1)993 (43.8)973 (49.5)1381 (46.3)
Household type
 Single household819 (42.8)868 (38.3)918 (46.7)1285 (43.1)
 Couple household516 (27.0)568 (25.1)476 (24.2)731 (24.5)
 Nuclear family577 (30.2)829 (36.6)572 (29.1)964 (32.3)
 Housing type
 Living in a single-family home291 (15.2)746 (32.9)442 (22.5)1071 (35.9)
 Living in a multifamily home1621 (84.8)1519 (67.1)1524 (77.5)1909 (64.1)
The most frequently used travel mode in daily living
 Walking913 (47.8)882 (38.9)719 (36.6)859 (28.8)
 Bicycle288 (15.1)434 (19.2)496 (25.2)872 (29.3)
 Public transportation500 (26.2)576 (25.4)521 (26.5)718 (24.1)
 Automobile211 (11.0)373 (16.5)230 (11.7)531 (17.8)
Neighborhood satisfaction level
 Less satisfied303 (15.8)475 (21.0)400 (20.3)847 (28.4)
 Satisfied997 (52.1)1251 (55.2)1018 (51.8)1549 (52.0)
 More satisfied612 (32.0)539 (23.8)548 (27.9)584 (19.6)
Changes in neighborhood satisfaction
 Decreased58 (3.0)59 (2.6)60 (3.1)66 (2.2)
 Unchanged1632 (85.4)1972 (87.1)1773 (90.2)2763 (92.7)
 Increased222 (11.6)234 (10.3)133 (6.8)151 (5.1)
Distance to workplace (km)5.10 ± 7.208.05 ± 7.904.60 ± 7.116.16 ± 7.80
n1912226519662980
Note: Mean and standard deviation (SD) were displayed (Mean ± SD) for the continuous variables, i.e., the number of samples for the binary and categorical variables.
Table 2. The correlation among neighborhood characteristics (841 postal code areas).
(a)(b)(c)(d)(e)(f)
 (a) Population density1.00
Geographic accessibility
 (b) City parks0.35 ***1.00
 (c) Eating facilities−0.17 ***−0.23 ***1.00
 (d) Gyms and fitness clubs−0.09 ***−0.21 ***0.83 ***1.00
Changes in geographic accessibility
 (e) Eating facilities0.13 ***0.20 ***−0.92 ***−0.72 ***1.00
 (f) Gyms and fitness clubs0.07 *0.09 ***−0.44 ***−0.57 **0.47 ***1.00
Note: This table reports that geographic accessibility and its changes were negatively correlated in accordance with eating facilities, gyms, and fitness clubs. * <0.05, ** <0.01, *** <0.001.
Table 3. Changes in neighborhood satisfaction by each subgroup after the emergence of the COVID-19 pandemic (N = 9123).
DecreasedUnchangedIncreased
Remote workers living in a central area (n = 1912)
 Neighborhood satisfaction level
  Less satisfied32 (1.7)265 (13.9)6 (0.3)
  Satisfied21 (1.1)883 (46.2)93 (4.9)
  More satisfied5 (0.3)484 (25.3)123 (6.4)
 Subtotal58 (3.0)1632 (85.4)222 (11.6)
Remote workers living in a noncentral area (n = 2265)
 Neighborhood satisfaction level
  Less satisfied35 (1.5)423 (18.7)17 (0.8)
  Satisfied18 (0.8)1119 (49.4)114 (5.0)
  More satisfied6 (0.3)430 (19.0)103 (4.5)
 Subtotal59 (2.6)1972 (87.1)234 (10.3)
Nonremote workers living in a central area (n = 1966)
 Neighborhood satisfaction level
  Less satisfied40 (2.0)354 (18.0)6 (0.3)
  Satisfied16 (0.8)948 (48.2)54 (2.7)
  More satisfied4 (0.2)471 (24.0)73 (3.7)
 Subtotal60 (3.1)1773 (90.2)133 (6.8)
Nonremote workers living in a noncentral area (n = 2980)
 Neighborhood satisfaction level
  Less satisfied50 (1.7)781 (26.2)16 (0.5)
  Satisfied16 (0.5)1466 (49.2)67 (2.2)
  More satisfied0 (0.0)516 (17.3)68 (2.3)
 Subtotal66 (2.2)2763 (92.7)151 (5.1)
Total243 (2.7)8140 (89.2)740 (8.1)
Note: The percentage in brackets is the number for samples by each subgroup.
Table 4. Differences in neighborhood characteristics between central and noncentral areas (841 postal code areas).
CharacteristicsCentral AreasNoncentral Areas
Population density (people per ha)1.82 ± 0.941.73 ± 0.53
Geographic accessibility
 City parks1.61 ± 0.791.91 ± 0.90
 Eating facilities68.0 ± 60.315.5 ± 12.9
 Gyms and fitness clubs2.64 ± 1.680.99 ± 0.62
Changes in geographic accessibility
 Eating facilities−2.95 ± 3.11−0.83 ± 0.75
 Gyms and fitness clubs−0.103 ± 0.20−0.02 ± 0.09
Number of areas354487
Note: This table reports that central areas with a high geographic accessibility to eating facilities, gyms, and fitness clubs showed more decrease in geographic accessibility on average after the start of the COVID-19 pandemic.
Table 5. Estimates for the odds ratio (and 95% Confidential Intervals) of increase in neighborhood satisfaction by centrality after the emergence of COVID-19 pandemic (N = 9123).
Variables(a) Living in a Central Area(b) Living in a Noncentral Area
Intercepts
Decreased to Unchanged0.10 (0.05–0.20) ***0.04 (0.02–0.07) ***
Unchanged to Increased68.4 (32.0–146) ***39.4 (20.5–75.6) ***
 Male0.95 (0.77–1.18)1.04 (0.85–1.28)
 Age0.99 (0.98–1.00) 0.98 (0.97–0.99) ***
Income (Ref.: 0–3 million JPY/year)
 3–61.54 (0.97–2.44) 1.12 (0.74–1.70)
 6–91.44 (0.88–2.34)1.31 (0.84–2.05)
 9–121.62 (0.96–2.74) 1.64 (1.02–2.64) *
 ≥121.91 (1.15–3.18) *1.00 (0.61–1.64)
Missing1.59 (1.02–2.46) *1.20 (0.81–1.79)
Homeowner1.05 (0.84–1.31)1.02 (0.80–1.29)
Household type (Ref.: single household)
 Couple household1.07 (0.83–1.38)1.20 (0.94–1.55)
 Nuclear family0.97 (0.75–1.26)1.14 (0.90–1.46)
The most frequently used travel mode (Ref.: Automobile)
 Walking1.02 (0.73–1.42)1.27 (0.95–1.70)
 Bicycle0.99 (0.68–1.43)1.32 (0.98–1.79)
 Public transportation0.87 (0.60–1.24)1.03 (0.76–1.42)
Neighborhood satisfaction level (Ref: less satisfied)
 Satisfied5.44 (3.88–7.62) ***3.82 (2.86–5.09) ***
 More satisfied13.5 (9.38–19.5) ***9.27 (6.71–12.8) ***
Working remotely1.31 (1.07–1.62) *1.50 (1.23–1.83) ***
Living in a single-family home0.68 (0.51–0.91) **0.96 (0.76–1.22)
Distance to workplace (km) a0.95 (0.89–1.02)0.95 (0.89–1.01)
Population density b1.05 (0.96–1.15)1.08 (0.93–1.25)
AIC3160.6463660.323
n38785245
Note: This table reports a positive relationship between remote work and increase in neighborhood satisfaction regardless of the centrality of areas where people live. a Distance to workplace was transformed into a natural logarithmic scale. b Density was standardized (Z-scores) at the neighborhood level. <0.10, * <0.05, ** <0.01, *** <0.001.
Table 6. Estimates for the odds ratio (and 95% Confidential Intervals) of increase in neighborhood satisfaction by each subgroup after the emergence of COVID-19 pandemic (N = 9123).
Variables(a) Remote Workers(b) Nonremote Workers
(1) Living in a Central Area(2) Living in a Noncentral Area(1) Living in a Central Area(2) Living in a Noncentral Area
Intercepts
 Decreased to Unchanged0.18 (0.06–0.54) **0.02 (0.01–0.06)0.10 (0.04–0.27)0.06 (0.02–0.14)
 Unchanged to Increased92.4 (28.0–306) ***12.5 (4.95–31.8)98.0 (33.7–285)104 (39.5–272)
Male0.84 (0.63–1.13)0.95 (0.70–1.28)1.07 (0.78–1.47)1.14 (0.85–1.54)
Age0.98 (0.97–1.00) *0.98 (0.97–0.99) **1.00 (0.98–1.01)0.98 (0.97–1.00) *
Income (Ref.: 0–3 million JPY/year)
 3–63.85 (1.63–9.10) **0.84 (0.42–1.68)1.29 (0.73–2.29)1.31 (0.75–2.28)
 6–93.76 (1.59–8.89) **1.06 (0.53–2.13)1.33 (0.69–2.55)1.57 (0.84–2.92)
 9–125.12 (2.11–12.4) ***1.35 (0.67–2.74)1.04 (0.49–2.18)1.97 (0.98–3.97)
 ≥125.40 (2.27–12.9) ***1.07 (0.52–2.18)1.59 (0.76–3.32)0.69 (0.31–1.52)
 Missing5.14 (2.25–11.7) ***1.00 (0.53–1.89)1.00 (0.58–1.73)1.38 (0.80–2.36)
Homeowner1.08 (0.81–1.46)0.92 (0.67–1.25)1.00 (0.70–1.43)1.15 (0.79–1.67)
Household type (Ref.: single household)
 Couple household0.97 (0.69–1.36)1.07 (0.76–1.51)1.18 (0.79–1.75)1.40 (0.96–2.04)
 Nuclear family1.08 (0.76–1.52)1.14 (0.82–1.59)0.83 (0.56–1.24)1.15 (0.80–1.91)
The most frequently used travel mode (Ref.: Automobile)
 Walking0.93 (0.59–1.45)1.26 (0.86–1.85)1.13 (0.67–1.90)1.21 (0.77–1.91)
 Bicycle0.97 (0.58–1.64)1.06 (0.69–1.63)1.02 (0.59–1.75)1.70 (1.10–2.65) *
 Public transportation0.81 (0.50–1.31)0.79 (0.51–1.21)0.93 (0.54–1.62)1.44 (0.90–2.31)
Neighborhood satisfaction level (Ref: less satisfied)
 Satisfied5.25 (3.28–8.41) ***3.81 (2.55–5.70) ***5.87 (3.59–9.59) ***3.98 (2.61–6.08) ***
 More satisfied12.7 (7.67–21.0) ***8.47 (5.43–13.2) ***15.4 (8.93–26.7) ***11.5 (7.07–18.6) ***
Living in a single-family home0.59 (0.39–0.90) *0.75 (0.55–1.04) 0.80 (0.53–1.21)1.26 (0.88–1.82)
Distance to workplace (km) a0.97 (0.88–1.06)0.93 (0.85–1.01) 0.92 (0.83–1.02)0.98 (0.89–1.08)
Population density b1.05 (0.93–1.18)1.04 (0.86–1.27)1.07 (0.93–1.24)1.12 (0.90–1.40)
AIC1754.4041937.7721411.3081708.503
n1912226519662980
Note: a Distance to workplace was transformed into a natural logarithmic scale. b Density was standardized (Z-scores) at the neighborhood level. <0.10, * <0.05, ** <0.01, *** <0.001.
Table 7. The results (odds ratio and 95% Confidential Intervals) of the models testing the relationship between geographic accessibility to neighborhood facilities and an increase in neighborhood satisfaction by subgroups after the emergence of COVID-19 pandemic (N = 9123).
Variables(a) Remote Workers(b) Nonremote Workers
(1) Living in a Central Area(2) Living in a Noncentral Area(1) Living in a Central Area(2) Living in a Noncentral Area
Geographic accessibility
 City parks0.99 (0.98–1.01)0.99 (0.98–1.01)1.00 (0.98–1.01))1.00 (0.99–1.02)
 Eating facilities0.99 (0.98–1.00)0.97 (0.93–1.01) 0.98 (0.98–1.00) *0.95 (0.90–0.99) *
 Gyms and fitness clubs0.99 (0.98–1.00)0.99 (0.96–1.02)0.98 (0.96–0.99) **0.97 (0.94–1.01)
Changes in geographic accessibility
 Eating facilities1.01 (1.00–1.02) 1.04 (1.01–1.08) *1.02 (1.01–1.03) **1.06 (1.01–1.10) *
 Gyms and fitness clubs1.01 (0.99–1.02)1.01 (0.99–1.03)1.00 (0.99–1.02)1.01 (0.99–1.04)
n1912226519662980
Note: This table reports a positive relationship between increase in geographic accessibility to eating facilities and increase in neighborhood satisfaction across the subgroups. Age, sex, income, housing tenure, household type, housing type, distance to workplace, the most frequently used travel mode, levels of neighborhood satisfaction, and population density were adjusted. Geographic accessibility, and changes in geographic accessibility were standardized (Z-scores) at the neighborhood level. Variables were included separately by facility types and by accessibility and its change. Odds ratios of the variables are from a 0.1-unit change in each variable. <0.10, * <0.05, ** <0.01.
Publisher’s Note: MDPI stays neutral with regard to jurisdictional claims in published maps and institutional affiliations.

