Article

Analysis of NEV Power Battery Recycling under Different Government Reward-Penalty Mechanisms

1
School of Economics and Management, Shanxi University, Taiyuan 030006, China
2
Institute of Management and Decision, Shanxi University, Taiyuan 030006, China
*
Author to whom correspondence should be addressed.
Sustainability 2022, 14(17), 10538; https://doi.org/10.3390/su141710538
Submission received: 27 June 2022 / Revised: 12 August 2022 / Accepted: 19 August 2022 / Published: 24 August 2022
(This article belongs to the Section Waste and Recycling)

Abstract

:
As a valuable reuse resource, the efficient recycling of retired power batteries is of great significance to the sustainable development of the new energy vehicle (NEV) industry. With the arrival of the NEV power battery decommissioning tide in China, how the government promotes the relevant responsible subject to improve the recovery rate is becoming urgent. Current studies have not considered the policy role of a government reward-penalty mechanism (RPM) in power battery recycling. Therefore, based on the extended producer responsibility (EPR) system, this paper constructs three models under the government RPM: the government implements the RPM only for vehicle enterprises; the government implements the RPM only for power battery manufacturers, and the government implements the RPM for both vehicle enterprises and power battery manufacturers. The results of the study show that: on the one hand, when the government implements the RPM only for vehicle enterprises, the recovery rate is the highest, and the total profit of the closed-loop supply chain is also the highest. Therefore, it is suggested that the government should set a target recycling rate according to the actual situation of each region and implement the RPM only for vehicle enterprises. On the other hand: when the government implements the RPM only for vehicle enterprises, they can implement the strategy of small profit and quick turnover to improve the recovery rate and their own profits. When the government implements the RPM only for power battery manufacturers, they should adopt the strategy of reducing the wholesale price of power battery to increase their profits by increasing sales. When the government implements the RPM for both vehicle enterprises and power battery manufacturers, if the vehicle enterprises share a large responsibility, all members of the closed-loop supply chain can benefit from the RPM.

1. Introduction

With the growing environmental concerns in modern society, new energy vehicles (NEVs) have become an increasingly popular transportation option worldwide. Under the dual effects of policy promotion and market demand traction, China’s NEV industry has developed by leaps and bounds, and the production and sales volume has ranked first in the world for six consecutive years. However, compared with excellent vehicle manufacturing capacity and power battery production capacity, a power battery recycling system has just started [1]. If a large number of retired power batteries cannot be effectively recycled and reused, it will cause a great waste of resources. At the same time, the toxic electrolyte and heavy metals of batteries will also cause great pollution to the environment [2]. To this end, China’s regulatory authorities have issued a number of power battery recycling policies. As early as 2018, seven departments, including the ministry of industry and information technology, jointly carried out a pilot work of recycling NEV power batteries, and clearly put forward an EPR system for interim measures for the administration of recycling NEV power batteries [3]. Because the power battery performance index of NEVs requires high performance, the batteries must be retired if their capacity attenuation exceeds 20%. Therefore, many retired power batteries can still be utilized in echelons and re-resourced. Therefore, in order to further improve the level of comprehensive utilization of resources, five departments, including the ministry of industry and information technology, jointly formulated management measures for echelon utilization of power batteries of NEVs in 2021 [4]. However, up to now, the recycling of power batteries has not formed a complete system, and the participating enterprises lack reasonable guidance, so it is difficult to achieve efficient battery recycling [5].
With the continuous retirement of NEV power batteries, more and more scholars have begun to pay attention to the recycling of retired power batteries in the NEV industry. At present, research on the recycling of retired power batteries is mainly focused on research into the recycling channel of the battery. Xie et al. coordinated a closed-loop supply chain led by battery manufacturers under different recycling modes and built a multi-level supply chain network for NEV sales and power battery recycling [6]. Hao et al. studied and compared the advantages and disadvantages of four recycling channels with NEV manufacturers, power battery manufacturers, third-party comprehensive utilization enterprises and industrial alliance as the main recycling body, by constructing a recycling cost model [7]. Zhu et al. studied optimal battery recycling channel selection and battery capacity allocation strategies of electric vehicle manufacturers, and determined the main factors affecting the profits of electric vehicle manufacturers [8]. Ma et al. found that the implementation of a cost sharing contract and liability sharing contract recycling model could increase the battery recovery rate and the profits of supply chain members by constructing a two-channel battery recycling game model between NEV manufacturers and retailers [9]. Hong et al. set up a Stackelberg game model to study a centralized and decentralized closed-loop supply. Through the comparison and analysis of three collection models including manufacturer collection, retailer collection and third-party collection, it was concluded that the recycling efficiency was lower than that of centralized recycling, although retailer recycling can increase corporate profits [10]. The above studies are purely on the selection of power battery recycling channels and their impact on the profits of supply chain members, without considering the macro-control mechanism of the government. However, the sales and recycling network of the NEV power battery supply chain is different from conventional waste. It is particularly important to design relevant policy mechanisms for guiding the behavior of supply chain members in order to promote the sustainable development of the NEV industry.
With the development of research into the recycling of retired power batteries, the recycling rate has become a common concern. As a management system that can effectively improve waste recycling, EPR has been widely studies by scholars in the field of waste product recycling. Bai and Liu established a principal-agent incentive contract model of manufacturer and retailer under an EPR system by introducing the influence of waste product recycling on product sales [11]. Ma and Zhong discussed the selection of recycling subjects of waste electrical and electronic products under EPR and concluded that a win-win situation of supply chain members could be achieved by establishing a reasonable responsibility sharing system through game model analysis [12]. In order to effectively manage the recycling and utilization of waste goods, Zhao et al. established a producer-led closed-loop supply chain evolutionary game model and analyzed the effectiveness of the RPM under the EPR system [13]. Therefore, EPR in the decommissioning power battery recycling system has also received attention from scholars at home and abroad. Xie et al. studied the pareto equilibrium of NEV power battery recovery based on EPR, and the results show that different market environment factors have different effects on the strategic choice of each enterprise, and the strategic choice of vehicle enterprises largely determines the enthusiasm of battery manufacturers to undertake extended responsibility [14]. Huang and Ma considered enterprises’ participation in gradient utilization and social responsibility behavior and observed the mutual influence among decision-makers when battery manufacturers and automobile brands assumed extended responsibility, respectively, under the constraint of EPR [15]. Based on the actual situation in China, Yao et al. designed the recycling mode of the power battery of NEVs in China under the EPR system and provided relevant policy suggestions to ensure the smooth operation of this mode [16]. Turner et al. pointed out that the effective implementation of an EPR system is conducive to promoting the recycling and utilization of power batteries by analyzing the effects of the EPR system on the recovery rate, recovery efficiency and management cost of power batteries [17]. Based on the game theory method, He et al. discussed the EPR mechanism of power battery recovery from the perspective of the supply side and established a system dynamics evolution model [18]. Most of these studies focus on the influence of the EPR system on the selection of recovery mode and recovery rate, and almost no studies combine the EPR system with government policies. Moreover, previous studies focused on a wider range of recycling, and few studies have combined it with power battery recycling.
Most of the existing studies on retired power battery recycling tend to focus on government subsidies, and there are few studies on government RPM. By establishing an evolutionary game model, Qiu et al. discussed the game equilibrium strategy of battery recycling subsidy investment between vehicle enterprises and 4S stores and concluded that the revenue increase rate after both sides of the subsidy was the key factor affecting the recycling subsidy strategy of vehicle enterprises and 4S stores [19]. Liu et al. considered the influence of the scale effect of recyclers and the combination of government subsidies on a closed-loop supply chain of power batteries, providing a direction for government departments to implement the subsidy mechanism [20]. Gu et al. studied the optimal production strategy of energy vehicle manufacturers under a government subsidy mechanism, and the results showed that battery recycling would improve the production enthusiasm of energy vehicle manufacturers [21]. Ma et al. compared and analyzed the behaviors of members of a closed-loop supply chain before and after government incentive measures were implemented and concluded that all members of the closed-loop supply chain would benefit from government consumption subsidy policies to varying degrees [22]. Mitra and Webster analyzed two models of manufacturers’ production and sales of new products, and believed that the government should subsidize part of the products to remanufacturers, and the government subsidy would play an incentive role in the recovery pricing of manufacturers and remanufacturers in the closed-loop supply chain [23]. Lyu et al. established an evolutionary game model of competition and cooperation by combining battery recycling and cascade utilization and concluded that the government should adopt a combination of a subsidy mechanism and a supervision mechanism to promote stable cooperation among supply chain members [24]. Tang et al. analyzed the impact of government RPM on power battery recycling by establishing a Stackelberg game theory model; the results showed that it was crucial to set a reasonable minimum recovery rate as the benchmark of the RPM [25].
Compared with the recycling of retired power batteries, government RPM has been extensively studied in the field of recycling waste products. Li et al. studied the influence of government RPM on the optimal decision-making of members of a closed-loop supply chain and showed that government RPM could effectively improve the recovery rate of waste products and the total profit of the closed-loop supply chain [26]. From the perspective of responsibility sharing, Wang et al. studied the influence of a government incentive mechanism and RPM on waste product recovery, and the results showed that increasing the intensity of reward and punishment could improve the recovery rate of waste products [27]. Wang et al. studied the influence of government RPM on the recovery rate of two manufacturers of a competitive nature [28]. Chen and Ulya studied the optimal recycling strategy of supply chain members under the government RPM under the premise of considering consumers’ environmental awareness [29]. Chen et al. established a dual-channel closed-loop supply chain model under a government punishment mechanism. By analyzing the influence of government RPM on optimal decision-making and profit of the supply chain system, they concluded that government RPM could not only improve the stability of a dual-channel supply chain, but also effectively improved the recovery rate of waste products [30].
In addition, many scholars also compared and analyzed the government RPM with the government subsidy mechanism and concluded that the government RPM was more conducive to improving the recovery enthusiasm and recovery rate of supply chain members. Yang et al. analyzed and compared the optimal decisions of supply chain members in a recycling supply chain composed of battery factory, main engine factory and consumers under the three situations of no government intervention, government subsidy mechanism and government RPM. The research showed that the RPM could urge the main engine factory to fulfill recycling responsibility and achieve a higher recovery rate than the subsidy mechanism [31]. Wang compared and analyzed a reverse supply chain decision under the government RPM and government subsidy mechanism and concluded that government RPM was more beneficial to mobilize the recycling initiative of reverse supply chain members [32]. Zhou et al. made a comparative analysis of the influence of government subsidy mechanism and government RPM on the reverse supply chain model, and showed that the government RPM could effectively improve the battery recovery rate and the overall profit of the supply chain [33]. Ma et al. discussed a closed-loop supply chain model of electronic and electrical product recycling under government regulation, and showed that the government’s implementation of RPM was conducive to improving the profits of supply chain members and increasing consumer surplus and social welfare [34]. It can be seen from the above research that the government’s RPM has a great impact on the recycling of waste products, and that recycling efficiency is higher, which is more conducive to promoting environmentally friendly development and sustainable social development.
To sum up, although scholars at home and abroad have conducted in-depth studies on the government RPM, there are few specific studies on the recycling of retired power batteries in the NEV industry. Moreover, through comparative analysis, scholars have concluded that government RPM is more conducive to improving the enthusiasm and recovery rate of supply chain members. However, few scholars have designed a closed-loop supply chain recovery mode that further seeks for the optimal reward and punishment subject under the condition that the government RPM is better. To solve the above problems, based on the perspective of a closed-loop supply chain, this study built a game model of power battery recycling under different government RPMs with the concept of EPR. This study compares and analyzes the influence of the government’s selection of different reward and punishment subjects on the recovery rate and profit of the main body. We aim to explore which member enterprises of the closed-loop supply chain to implement the RPM is the most effective in improving the recovery rate of power batteries (that is, how to allocate the responsibility of recovery between the member enterprises), and provide a scientific basis for the government to improve policies and enterprise decision-making.

2. Model Description and Basic Assumptions

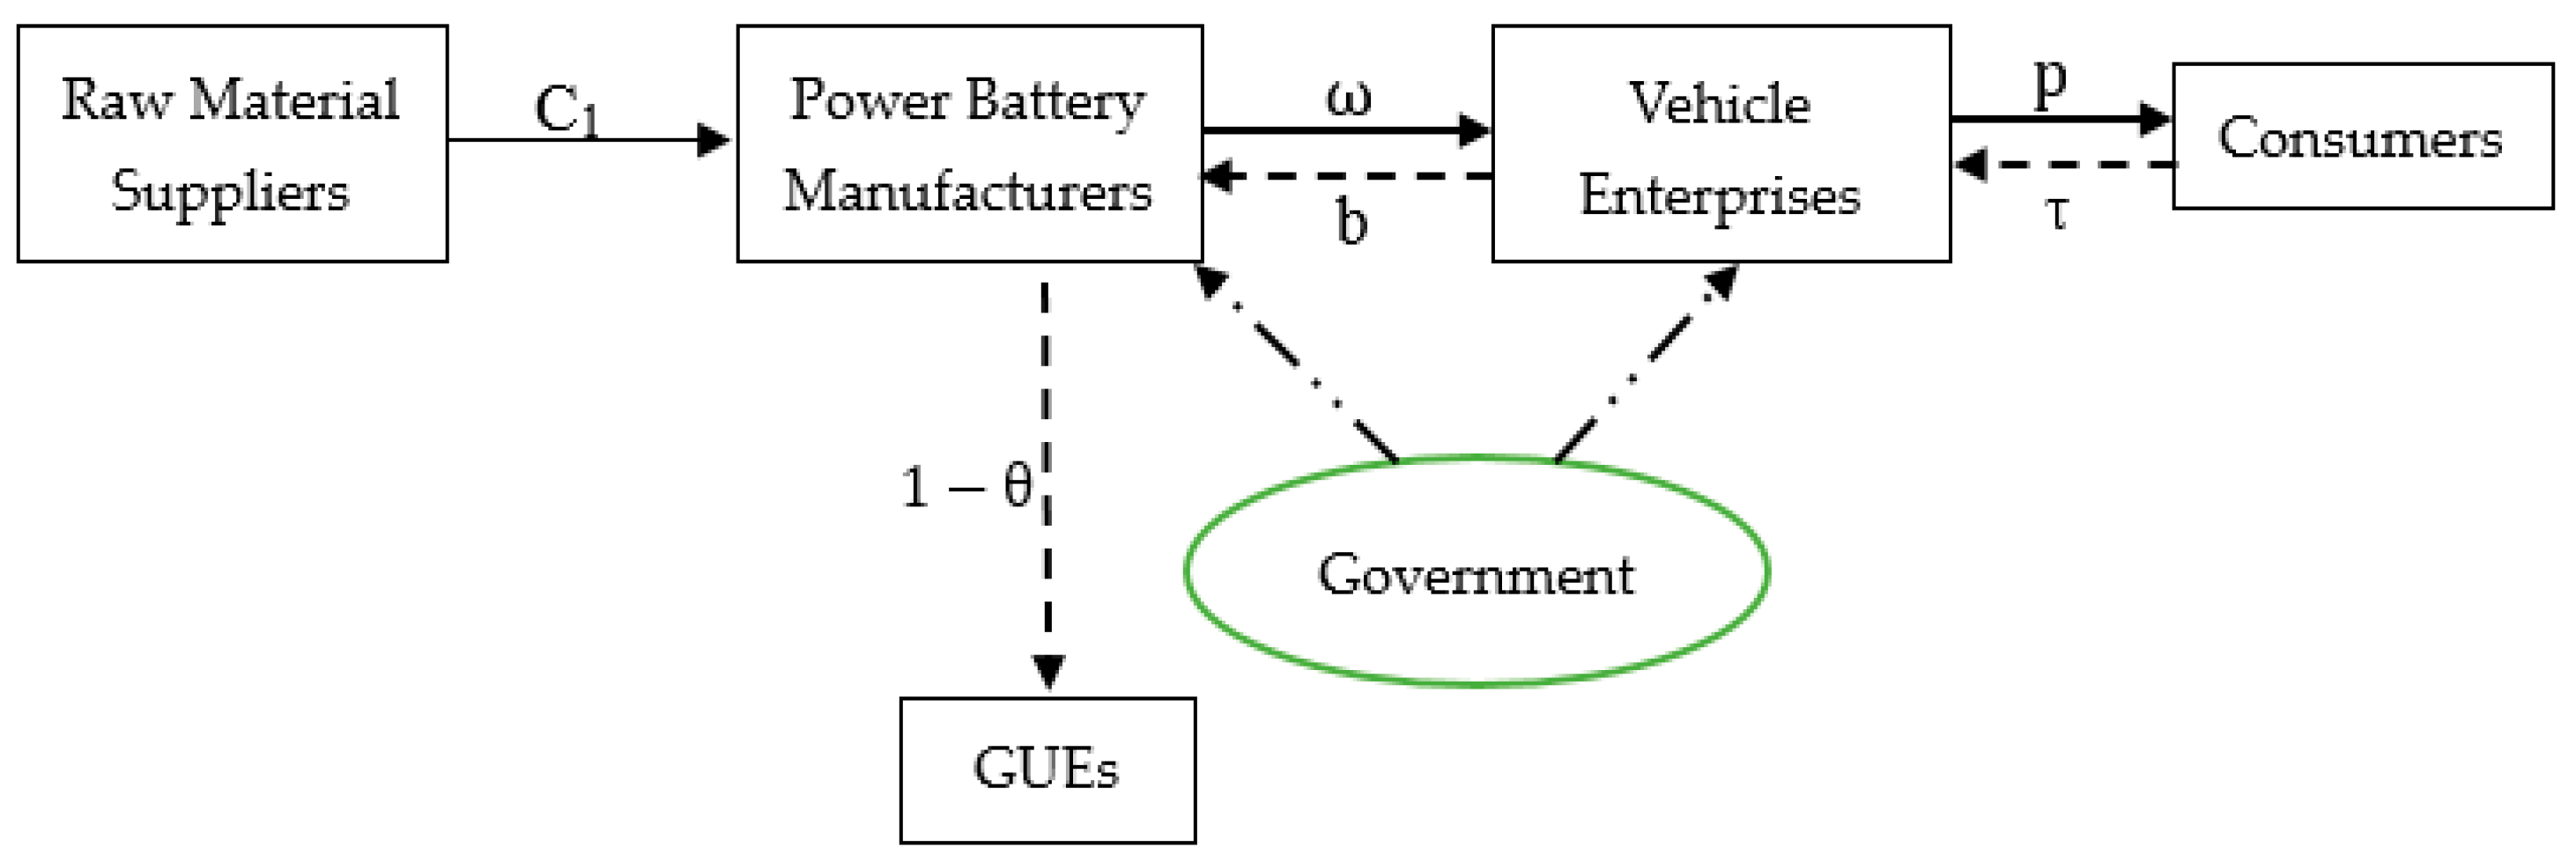
2.1. Model Description

Power battery manufacturers, vehicle enterprises, gradient utilization enterprises (GUEs) and consumers constitute a closed-loop supply chain system, as shown in Figure 1. First of all, the unit cost of the power battery manufacturer purchasing raw materials from the raw material supplier for production is c 1 ; the unit cost of a power battery manufacturer producing new batteries from recycled retired power battery materials is c 2 ; power battery manufacturers sell batteries to vehicle enterprises by wholesale prices ω ; vehicle enterprises sell batteries to consumers by retail prices p ; when the use of NEVs reaches a certain level, the power battery is scrapped. At this time, the vehicle enterprises recycle the retired battery from the users of NEVs. With the efforts of vehicle enterprises, the recovery rate of retired power battery is τ . At the same time, the vehicle enterprise returns the recycled retired power battery to the power battery manufacturer at the recycling transfer price b ; the power battery manufacturer tests and disassembles the retired power battery, and the unit processing cost is c . In the testing process, the power battery manufacturers pass screening. Finally, the retired power battery materials with θ units are reused by power battery manufacturers. The rest of the retired power battery flows to the GUEs, and the revenue per unit is π .
According to the above analysis, the following variables are set in this paper to build the game model, as depicted in Table 1.
We set the government’s reward and punishment intensity to the members of the closed-loop supply chain as k and the target recovery rate as τ 0 . When τ > τ 0 ( τ τ 0 ), the members get government rewards (punishments) for k | τ τ 0 | [35,36,37].

2.2. Basic Assumptions

(1)
In economics, the most common type of demand function is a linear function: D = a b p . To simplify, let b = 1 in this study, so the market demand function for power battery is assumed to be D = a p , where a represents the market size [37,38].
(2)
The fixed investment required by vehicle enterprises to recycle retired power batteries is I , assuming that I = 1 2 h τ 2 and h is the recovery difficulty coefficient [39].
(3)
The products remanufactured with recycled products are homogeneous with the products manufactured with new parts, denoted Δ = c 1 c 2 . In order to ensure the significance of the model, it needs to satisfy Δ > c [40].
(4)
We assume that the unit cost of recycling retired power batteries from consumers is δ , and b > δ . Otherwise, vehicle enterprises have no motivation to recycle retired power batteries. Meanwhile, in order to simplify the research process, we set δ = 0 [9].
(5)
Power battery manufacturers are Stackelberg leaders in the closed-loop supply chain [41].
(6)
Scrapped power batteries are only recovered through the original forward supply chain channel [42].
(7)
Batteries recovered by vehicle enterprises are all recovered by power battery manufacturers [43].

3. Model Development

According to the model description and basic assumptions in Section 2, the profit function of each member enterprise in the closed-loop supply chain can be obtained. The profit function of the vehicle enterprise is:
π r = b τ ( a p ) + ( p ω ) ( a p ) 1 2 h τ 2 = ( τ b + p ω ) ( a p ) 1 2 h τ 2
The profit function of power battery manufacturers is:
π m = ω ( a p ) + ( 1 θ ) ( a p ) τ π + Δ τ θ ( a p ) b τ ( a p ) c 1 ( a p ) c τ ( a p ) = [ ω + ( 1 θ ) τ π + Δ τ θ τ b c 1 c τ ] ( a p )
Next, several representative cases of closed-loop supply chain decision-making are studied in this paper. Among them, the benchmark case is the centralized decision-making case of closed-loop supply chain.

3.1. Centralized Decision-Making Case

In the case of centralized decision-making in the closed-loop supply chain, the closed-loop supply chain is an ideal “organization” in which a centralized decision maker makes decisions in all aspects. The problem of profit maximization can be expressed as:
max π = [ p + ( 1 θ ) τ π + Δ τ θ c 1 c τ ] ( a p ) 1 2 h τ 2
Theorem 1.
When 2 h ( c π + π θ Δ θ ) 2 > 0 , there is an equilibrium solution for centralized decision-making, which is as follows:
p c = a ( c π + π θ Δ θ ) 2 h ( a + c 1 ) 2 h ( c π + π θ Δ θ ) 2
τ c = ( c π + π θ Δ θ ) ( a c 1 ) 2 h + ( c π + π θ Δ θ ) 2
Proof. 
The Hessian matrix of Equation (3) is: H = | 2 c π + π θ Δ θ c π + π θ Δ θ h | . Among them H 11 = 2 < 0 , det ( H ) = 2 h ( c π + π θ Δ θ ) 2 , When 2 h ( c π + π θ Δ θ ) 2 > 0 , H negative definite, this function has a maximum. p c and τ c are obtained from the first order conditions. Proof completed. □
By substituting p c and τ c into Equation (3), the total profit of the supply chain under centralized decision π c = h ( a c 1 ) 2 4 h 2 ( c π + π θ Δ θ ) 2 .
In all the cases studied in this article, only centralized decision making is the ideal case of the closed-loop supply chain, and the total profit is the highest. In this model, the power battery manufacturer plays the role of producers in the forward supply chain and the reproducer in the reverse supply chain. The vehicle enterprise plays the role of retailer in the forward supply chain and recycler in the reverse supply chain. Then we study the three cases of distributed decision making, and the three cases have the same game order. The power battery manufacturer is the dominant player, so the power battery manufacturer decides the wholesale price first, and then the vehicle enterprise decides the retail price and recovery rate according to the wholesale price of the power battery manufacturer.

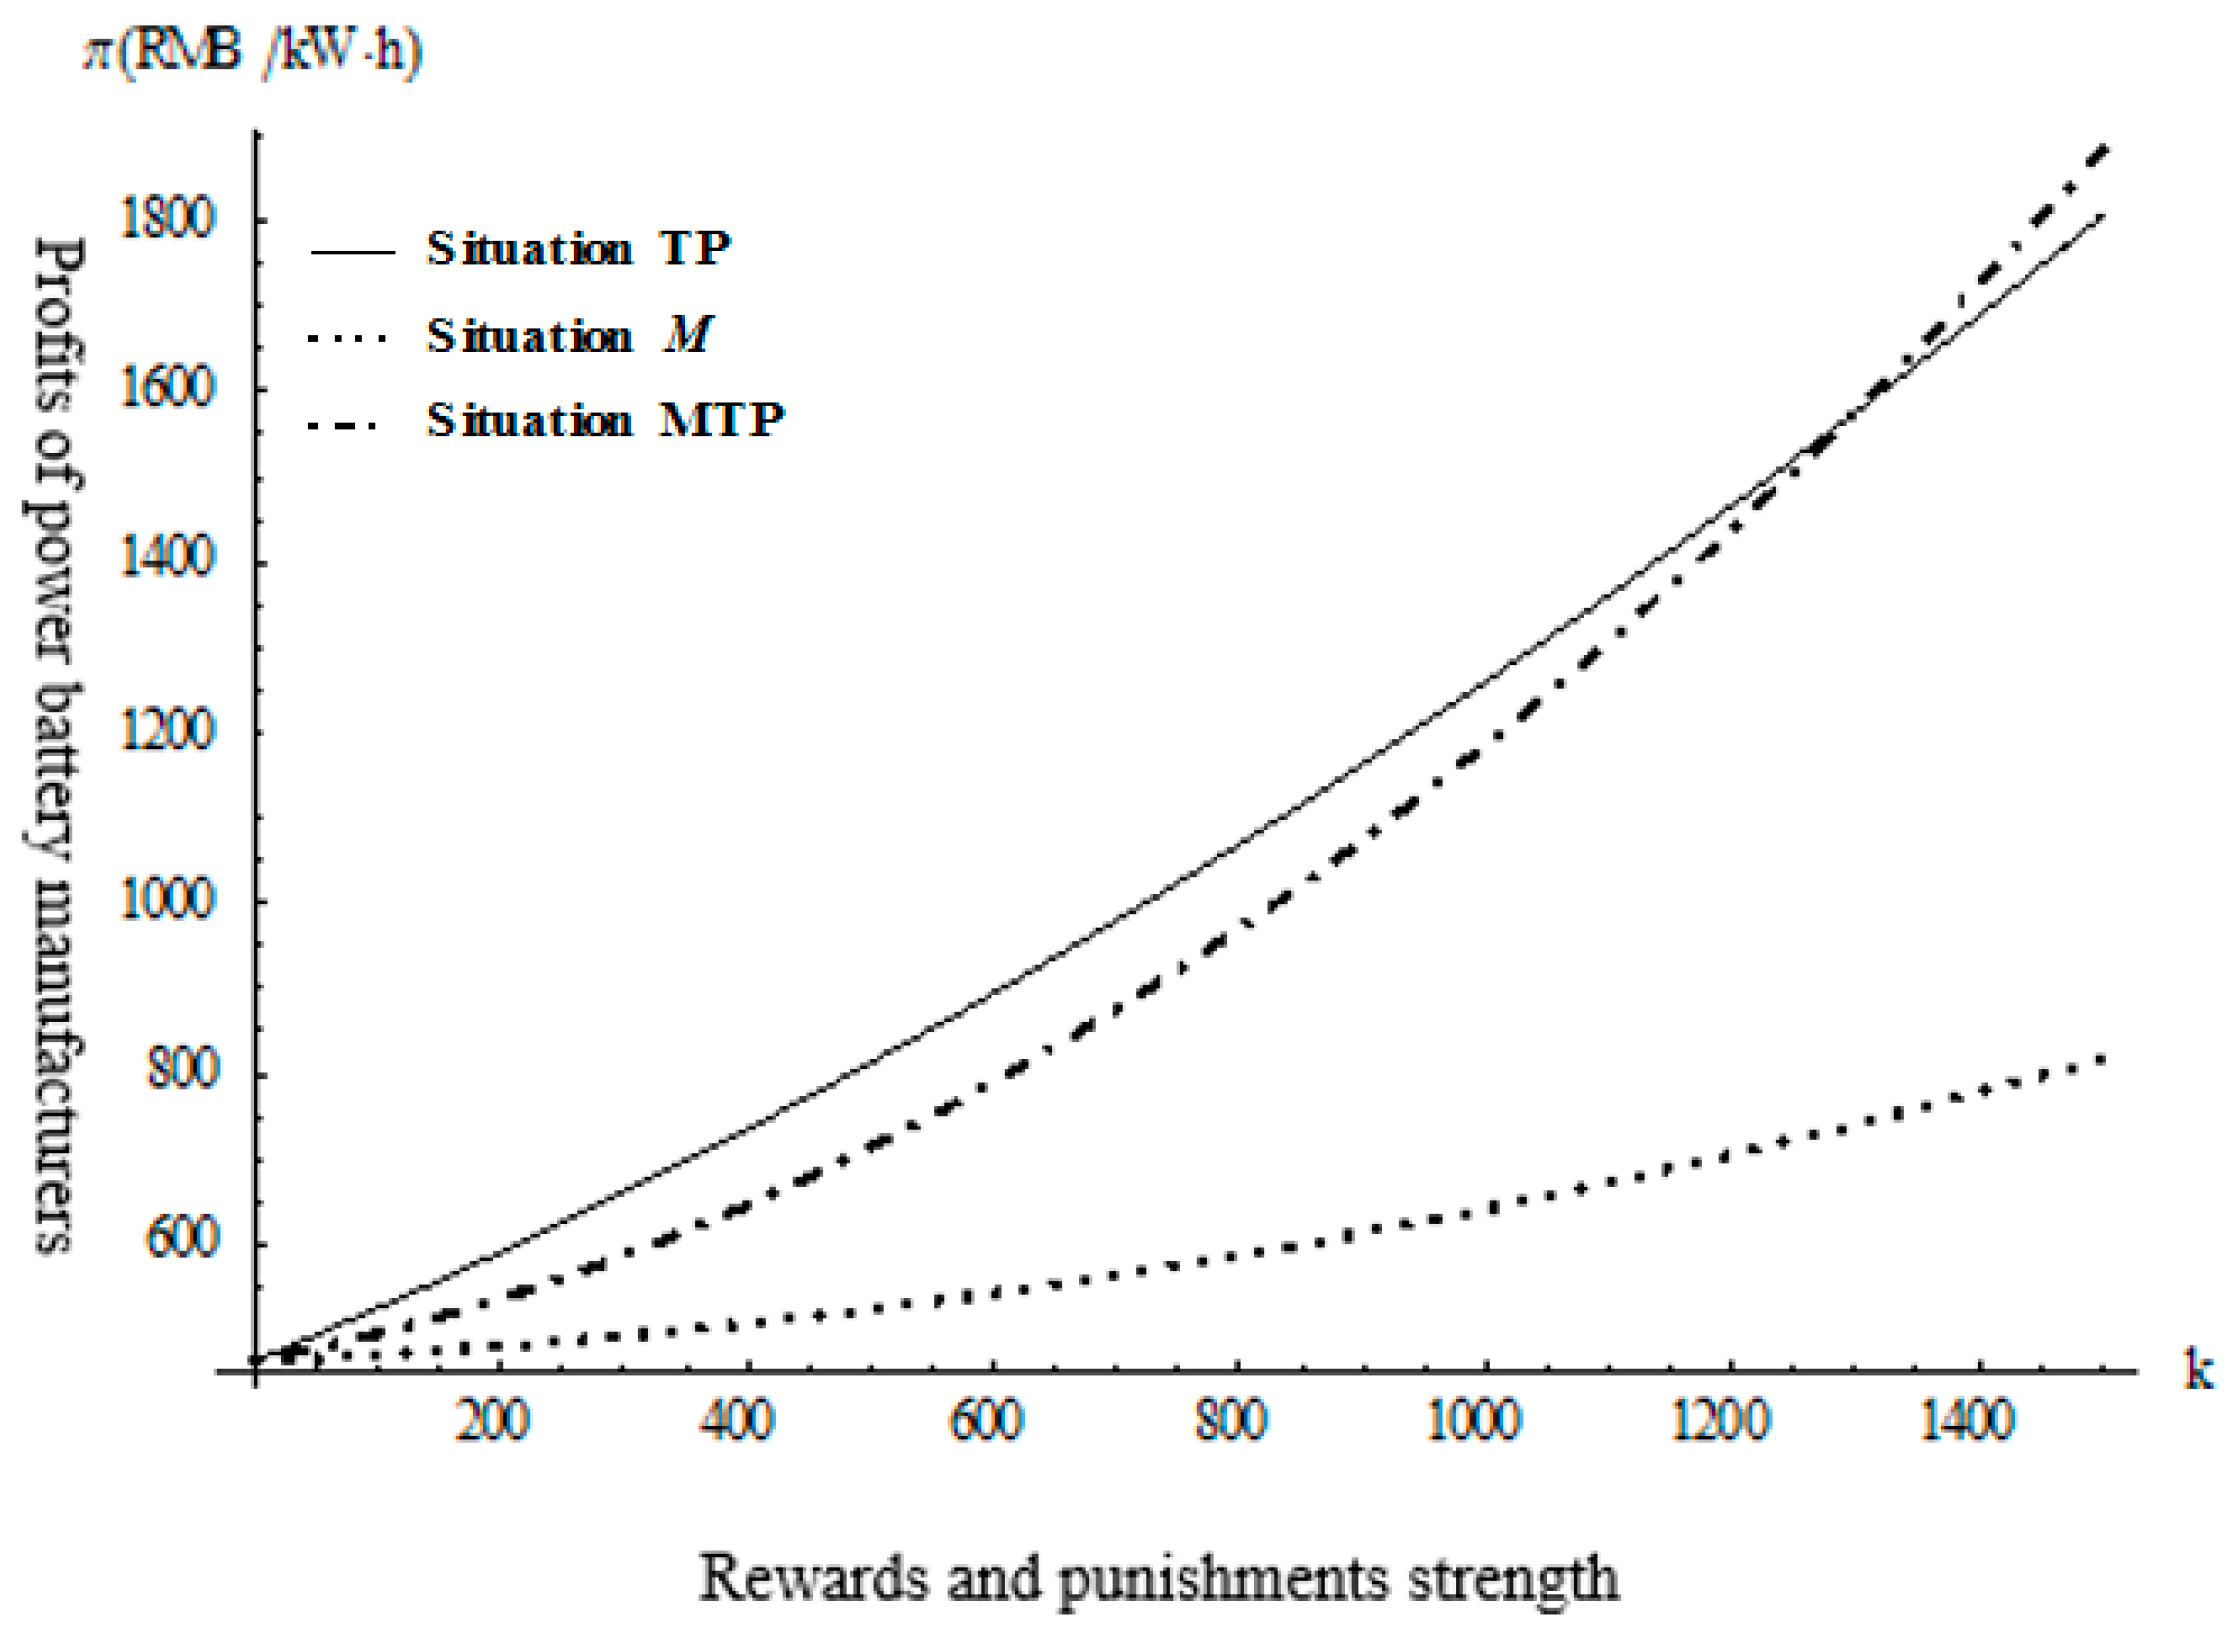
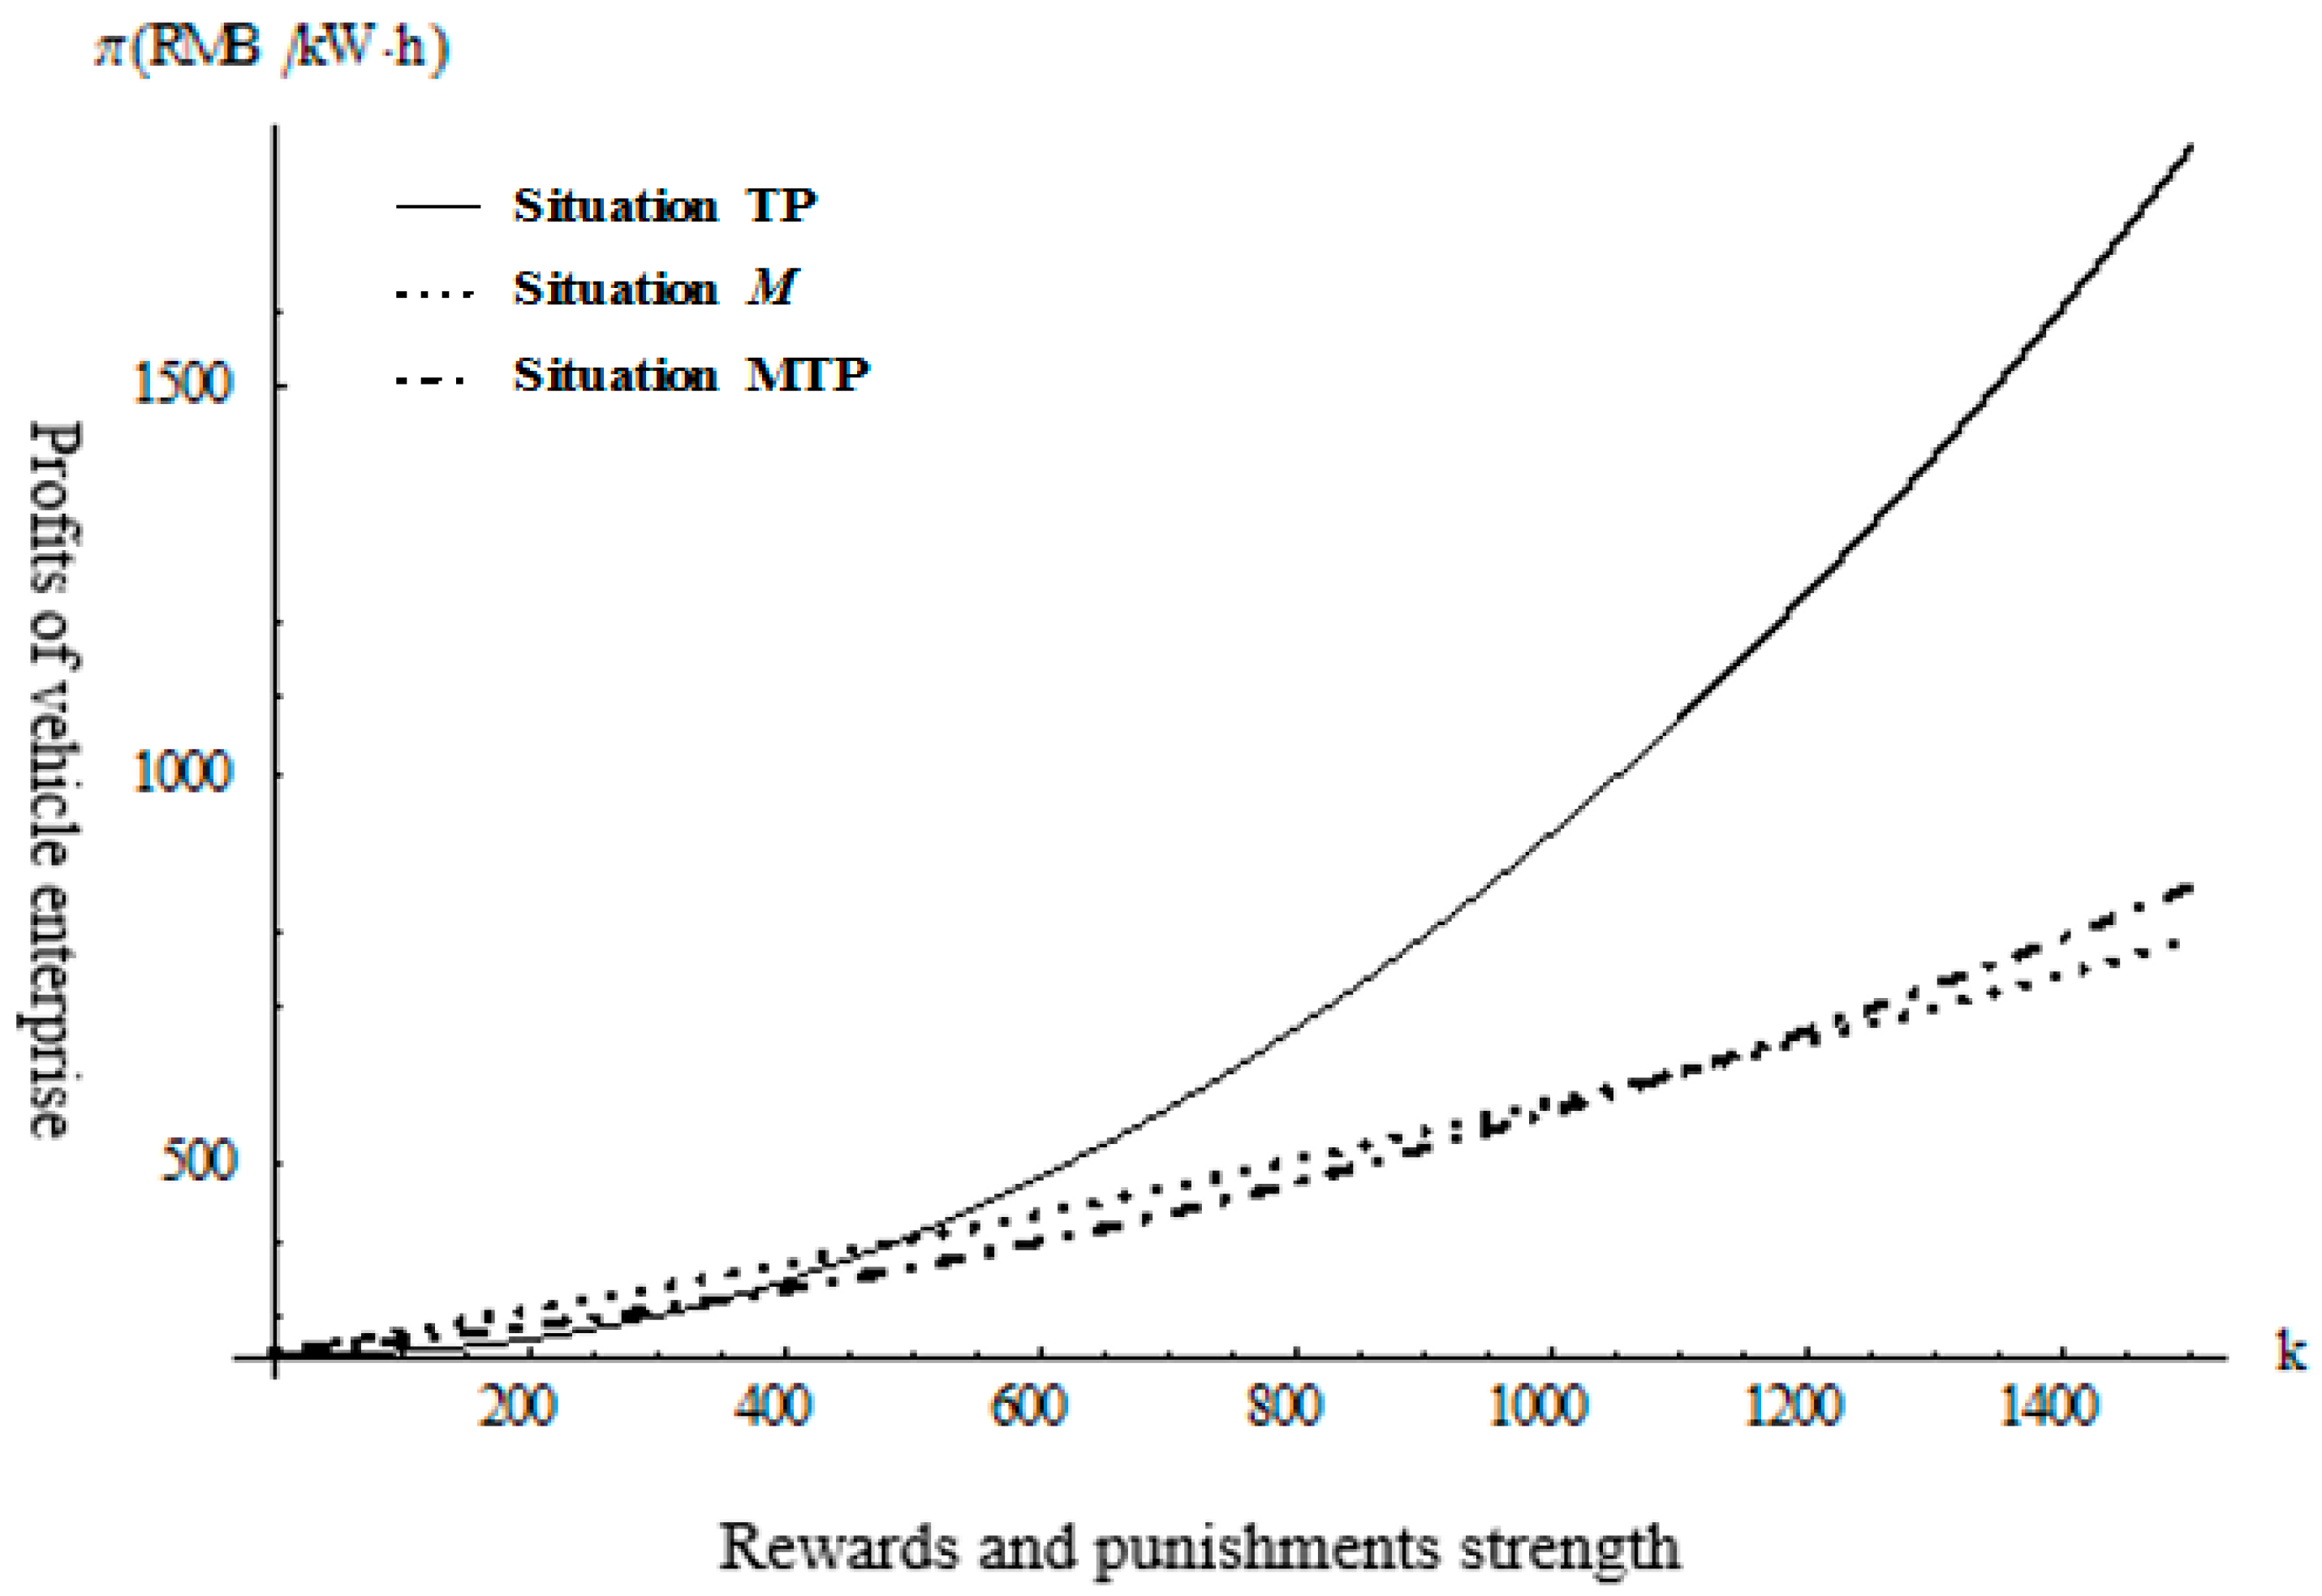
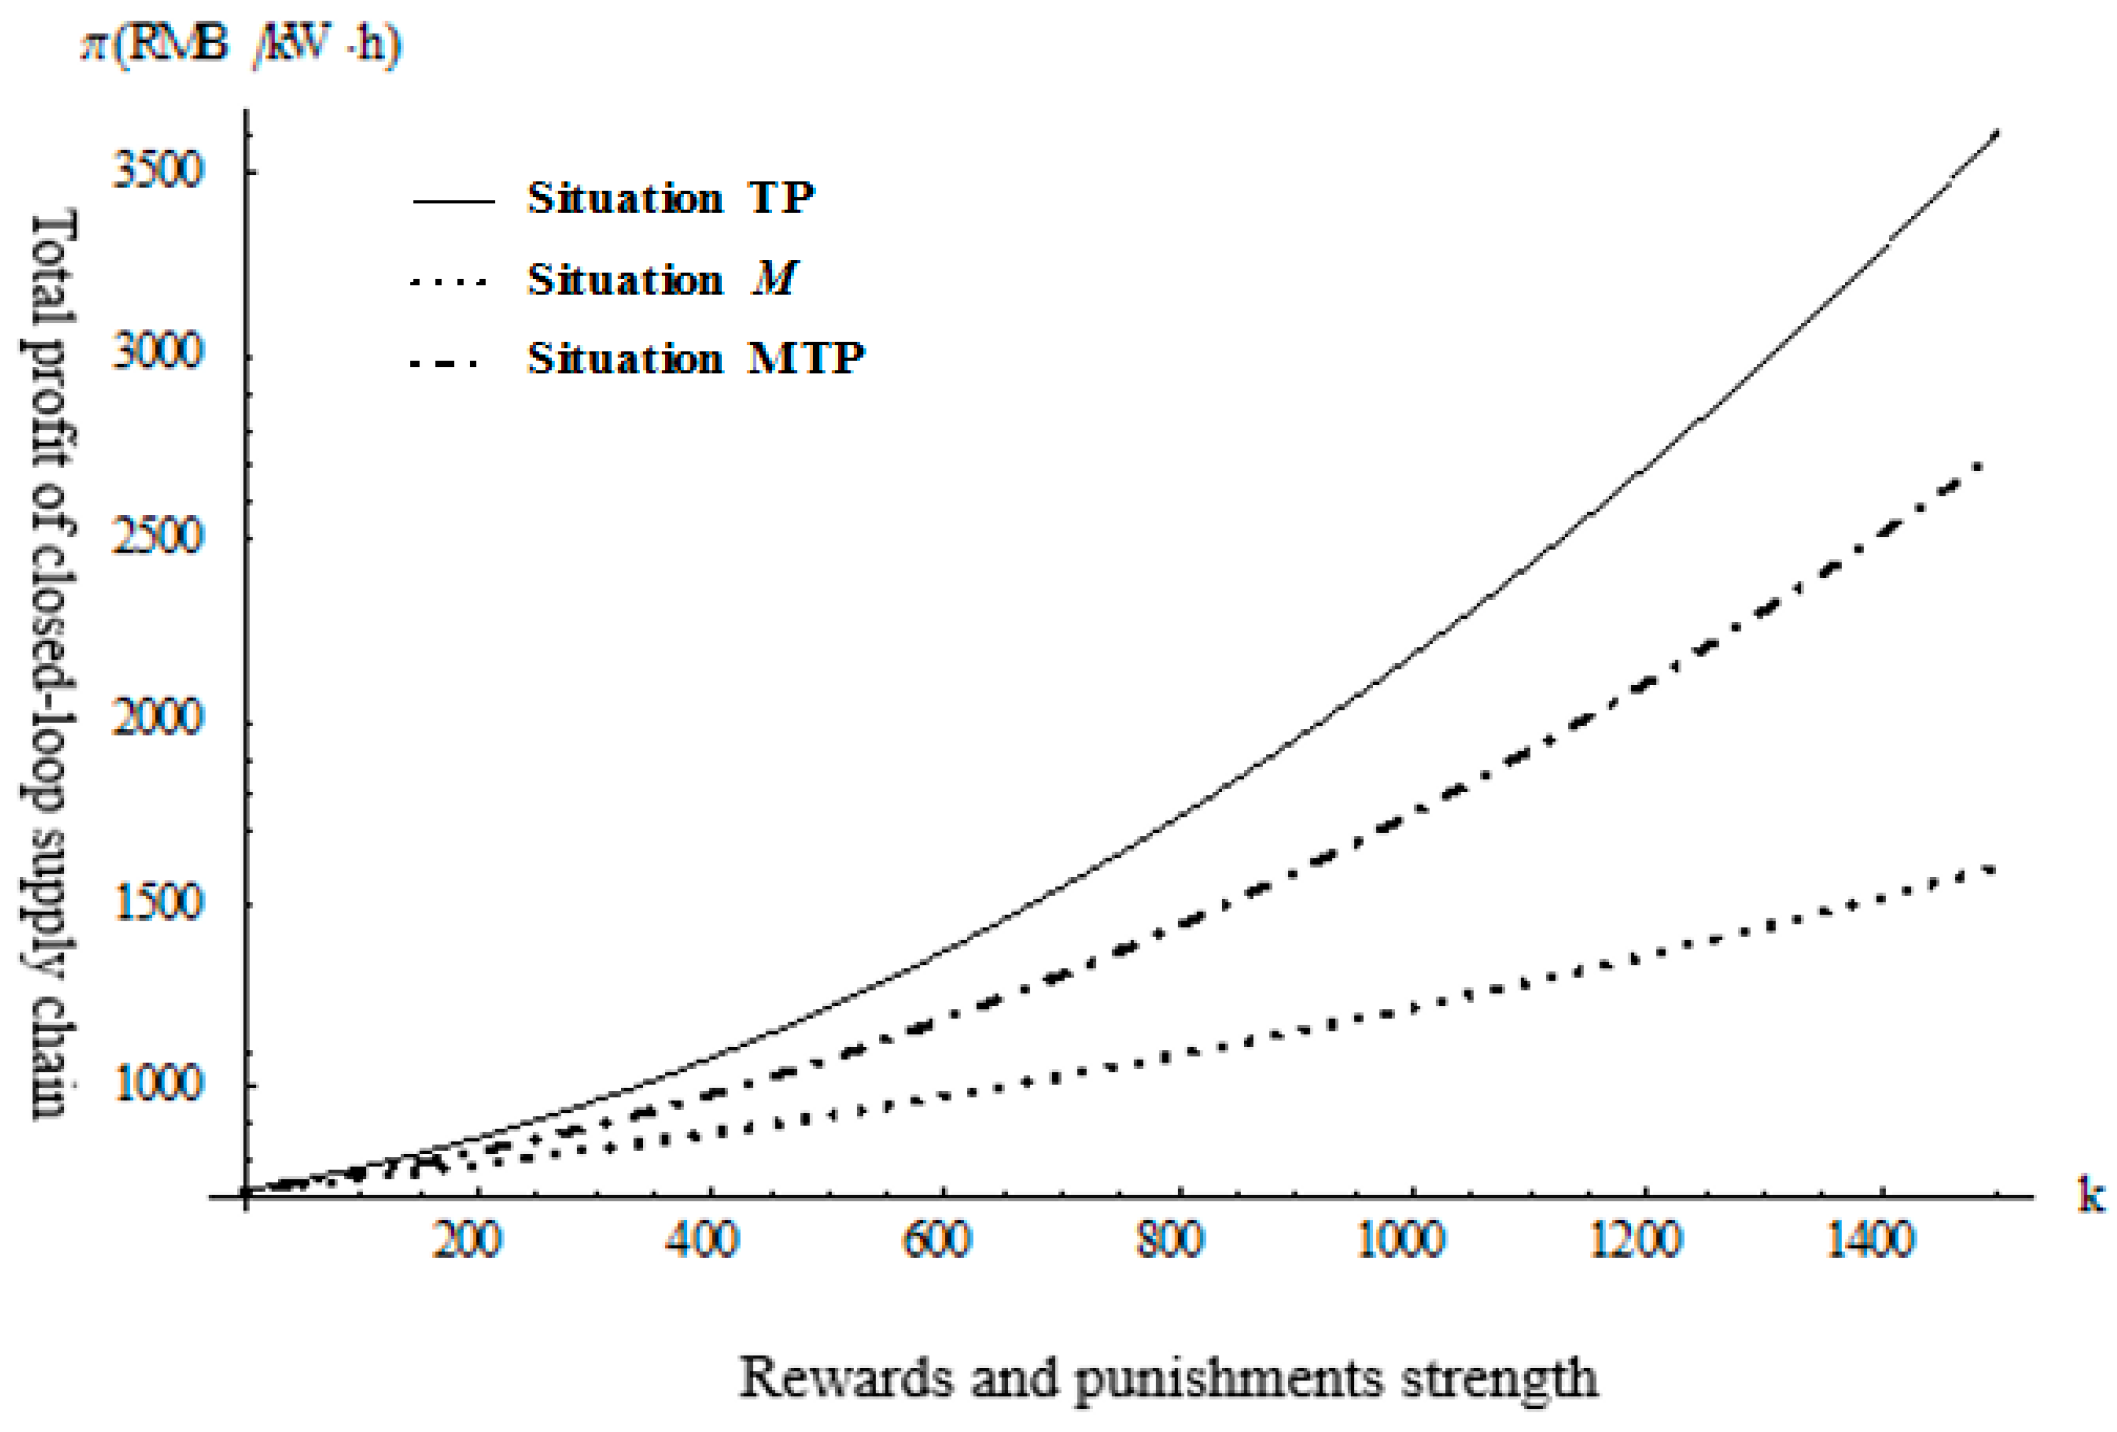
3.2. Implementing RPM Only for Vehicle Enterprises (Situation TP)

The document “NEV power battery recycling management interim measures” announced by the Ministry of Industry and Information Technology emphasizes that vehicle enterprises take responsibility for power battery recycling; the government often only implements incentive mechanism for vehicle enterprises. Therefore, in this case, the government only implements RPM for the vehicle enterprises. At this point, the profit objective function of the vehicle enterprises and the power battery manufacturers are as follows:
max π r = ( τ b + p ω ) ( a p ) 1 2 h τ 2 + k ( τ τ 0 )
max π m = [ ω + ( 1 θ ) τ π + Δ τ θ τ b c 1 c τ ] ( a p )
Theorem 2.
When the government only implements RPM for vehicle enterprises, there is an equilibrium solution between power battery manufacturers and vehicle enterprises in the decision-making process. The equilibrium solution is as follows:
τ T P = a b h + k [ 4 h + b ( c π + π θ Δ θ ) ] b h c 1 2 h [ 2 h + b ( c π + π θ Δ θ ) ]
p T P = 2 a b c + 3 a h + c k 2 a b π k π + ( 2 a b + k ) ( π Δ ) θ + h c 1 2 h [ 2 h + b ( c π + π θ Δ θ ) ]
ω T P = k [ 4 b h + ( b 2 + 2 h ) ( c π + π θ Δ θ ) ] + a h [ 2 h + b 2 + 2 b ( c π + π θ Δ θ ) ] + h c 1 ( 2 h b 2 ) 2 h [ 2 h + b ( c π + π θ Δ θ ) ]
Proof. 
According to the game order described in Section 3.1, the calculation is carried out by backward induction (the order of backward induction is the opposite of the order of game). For Equation (4), the Hessian matrix of p and τ is | 2 b b h | . When 2 h b 2 > 0 , there is an optimal decision variable. The first partial derivatives of Equation (4) with respect to p and τ are equal to zero, expressions for p and τ can be obtained. At this time p = a b 2 + a h b k + h ω b 2 2 h , τ = a b + 2 k b ω b 2 2 h . Then we substitute p and τ into Equation (5) and take the partial derivative with respect to ω to get
ω T P = k [ 4 b h + ( b 2 + 2 h ) ( c π + π θ Δ θ ) ] + a h [ 2 h + b 2 + 2 b ( c π + π θ Δ θ ) ] + h c 1 ( 2 h b 2 ) 2 h [ 2 h + b ( c π + π θ Δ θ ) ]
Finally, p T P and τ T P can be obtained by substituting ω T P into p and τ respectively. Proof completed. □
By substituting the decision equilibrium solution in Theorem 2 into Equations (4) and (5), the profits of power battery manufacturers and vehicle enterprises can be obtained as follows:
π m T P = [ a h + k ( c + π π θ + Δ θ ) h c 1 ] 2 4 h [ 2 h + b ( c π + π θ Δ θ ) ]
π r T P = 1 8 h [ 2 h + b ( c π + π θ Δ θ ) ] 2 { ( 2 h b 2 ) [ a 2 h 2 2 a h k ( c π + π θ Δ θ ) ] + k [ 16 k h 2 + ( 2 h k + 3 b 2 k 8 h τ 0 b 2 ) ( c π + π θ Δ θ ) 2 32 h 3 τ 0 16 b h ( c π + π θ Δ θ ) ( 2 h τ 0 k ) ] + h c 1 ( b 2 2 h ) [ 2 a h 2 k ( c π + π θ Δ θ ) h c 1 ] }

3.3. Implementing RPM Only for Power Battery Manufacturers (Situation M)

As one of the important members of the closed-loop supply chain, the power battery manufacturer undertakes the important responsibility of recycling and remanufacturing. Based on this situation, this section discusses that the government only applies RPM to power battery manufacturers. At this point, the profit objective function of the vehicle enterprises and the power battery manufacturers is as follows:
max π r = ( τ b + p ω ) ( a p ) 1 2 h τ 2
max π m = [ ω + ( 1 θ ) τ π + Δ τ θ τ b c 1 c τ ] ( a p ) + k ( τ τ 0 )
Theorem 3.
In the case that the government only implements RPM for power battery manufacturers, the decision-making equilibrium solution of power battery manufacturers and vehicle enterprises is as follows:
τ M = b ( a h + b k h c 1 ) 2 h [ 2 h + b ( c π + π θ Δ θ ) ]
p M = b k + a [ 3 h + 2 b ( c π + π θ Δ θ ) ] + h c 1 2 h [ 2 h + b ( c π + π θ Δ θ ) ]
ω M = b k ( b 2 2 h ) + a h [ 2 h + b 2 + 2 b ( c π + π θ Δ θ ) ] + h c 1 ( 2 h b 2 ) 2 h [ 2 h + b ( c π + π θ Δ θ ) ]
The proof of this theorem is similar to the proof of Theorem 2 and will not be repeated here. By substituting the equilibrium solution of Theorem 3 into Equations (6) and (7), the profits of power battery manufacturers and vehicle enterprises can be obtained as follows:
π m M = ( a h + b k ) 2 4 h k [ 2 h + b τ 0 ( c π + π θ Δ θ ) ] + h c 1 ( 2 a h 2 b k + h c 1 ) 4 h [ 2 h + b ( c π + π θ Δ θ ) ]
π r M = ( b 2 2 h ) ( a h + b k h c 1 ) 2 8 h [ 2 h + b ( c π + π θ Δ θ ) ] 2

3.4. Implementing RPM for Both Vehicle Enterprises and Power Battery Manufacturers (Situation MTP)

The power battery manufacturer will recover the retired power battery from the vehicle enterprise, and the retired power battery will be remanufactured. To facilitate the recycling process, the recycling process shares a channel with the sales process. During this process, the power battery manufacturer and the vehicle enterprise cooperate, so it is reasonable for them to share the responsibility of recycling. Therefore, this section discusses the government to implement RPM for both vehicle enterprises and power battery manufacturers. We assume that the reward and punishment quota allocated by the vehicle enterprise is u , then the reward and punishment quota allocated by the power battery manufacturer is 1 u . At this point, the profit objective function of the vehicle enterprises and the power battery manufacturers are as follows:
max π r = ( τ b + p ω ) ( a p ) 1 2 h τ 2 + u k ( τ τ 0 )
max π m = [ ω + ( 1 θ ) τ π + Δ τ θ τ b c 1 c τ ] ( a p ) + ( 1 u ) k ( τ τ 0 )
Theorem 4.
Vehicle enterprises and power battery manufacturers share the amount of rewards and punishments, that is, the government simultaneously implements RPM to both. The decision-making equilibrium solution of power battery manufacturers and vehicle enterprises is as follows:
τ M T P = a b h + k [ b 2 + b 2 u + 4 h u + b u ( c π + π θ Δ θ ) ] b h c 1 2 h [ 2 h + b ( c π + π θ Δ θ ) ]
p M T P = a [ 3 h + 2 b ( c π + π θ Δ θ ) ] + k [ b + b u + u ( c π + π θ Δ θ ) ] + h c 1 2 h [ 2 h + b ( c π + π θ Δ θ ) ]
ω M T P = k [ b 3 b 3 u 2 b h + 6 u b h + ( b 2 u + 2 h u ) ( c π + π θ Δ θ ) ] 2 h [ 2 h + b ( c π + π θ Δ θ ) ] + a h [ 2 h + b 2 + 2 b ( c π + π θ Δ θ ) ] + h c 1 ( 2 h b 2 ) ] 2 h [ 2 h + b ( c π + π θ Δ θ ) ]
The proof of this theorem is similar to the proof of Theorem 2. By substituting the equilibrium solution of Theorem 4 into Equations (8) and (9), the profits of power battery manufacturers and vehicle enterprises can be obtained as follows:
π m M T P = 1 4 h [ 2 h + b ( c π + π θ Δ θ ) ] { a 2 h 2 + 2 a h k [ b b u u ( c π + π θ Δ θ ) ] + k { k b 2 ( u 1 ) 2 + ku [ 8 h ( 1 u ) + u ( c π + π θ Δ θ ) 2 ] + 8 h 2 ( u 1 ) τ 0 2 b ( u 1 ) ( c π + π θ Δ θ ) ( k u 2 h τ 0 ) } + h c 1 { 2 a h 2 k [ b b u u ( c π + π θ Δ θ ) ] } }
π r M T P = { a h + k [ b b u u ( c π + π θ Δ θ ) ] h c 1 } 2 4 [ 2 h + b ( c π + π θ Δ θ ) ] 2 { a b h + k [ ( b 2 b 2 u ) + 4 h u ( c π + π θ Δ θ ) ] h b c 1 } 2 8 h [ 2 h + b ( c π + π θ Δ θ ) ] 2 + k u { τ 0 + a b h + k [ ( b 2 b 2 u ) + 4 h u + b u ( c π + π θ Δ θ ) ] h b c 1 2 h [ 2 h + b ( c π + π θ Δ θ ) ] }

4. Model Comparison and Management Significance Analysis

4.1. Comparative Analysis of Equilibrium Solutions

By analyzing and comparing three different cases of distributed decision making, the equilibrium solutions of different cases are obtained. The following propositions can be obtained by comparing the decision equilibrium solutions of the above situations.
Proposition 1.
τ M < τ M T P < τ T P .
Proof. 
τ T P τ M T P = k ( u 1 ) [ 4 h + b ( b c + π π θ + θ Δ ) ] 2 h [ 2 h + b ( c π + π θ θ Δ ) ] , in Section 3.1, we know 2 h ( c π + π θ θ Δ ) 2 > 0 , in Section 3.2, we know 2 h b 2 > 0 , so 2 h [ 2 h + b ( c π + π θ θ Δ ) ] > 0 and 4 h + b ( b c + π π θ + θ Δ ) < 0 are always true. Since 0 < u < 1 , u 1 < 0 , so the numerator k ( u 1 ) [ 4 h + b ( b c + π π θ + θ Δ ) ] > 0 is constant, so τ M T P < τ T P . Likewise, τ M < τ M T P , so τ M < τ M T P < τ T P . □
Proposition 1 shows that scenario TP has the highest recovery rate in terms of recovery rates, followed by scenario MTP, and scenario M has the lowest recovery rate. All the recovery rates increased with the increase in reward and punishment. The analysis shows that the recycling rate of retired power batteries is related to the recycling transfer price, and the recycling rate of retired power batteries is directly proportional to the recycling transfer price. In the reverse supply chain process, power battery manufacturers remanufacture retired batteries without being directly involved in the recycling process. Vehicle enterprises are direct participants in the recycling process, not only recycling retired power batteries directly from consumers, but also selling the remanufactured power battery. It is more effective for the government to adopt the RPM only for vehicle enterprises than only for power battery manufacturers and for both vehicle and power battery manufacturers. Although power battery manufacturers dominate the closed-loop supply chain, power battery manufacturers are not directly involved in the recycling process, and then it is difficult for RPM to work. As a result, the entire closed-loop supply chain has the lowest recovery rate under scenario M.
Proposition 2.
p T P < p M T P < p M .
Proof. 
p T P p M T P = k ( u 1 ) ( b + c π + π θ θ Δ ) 2 h [ 2 h + b ( c π + π θ θ Δ ) ] , in Section 3.1, we know 2 h ( c π + π θ θ Δ ) 2 > 0 , in Section 3.2, we know 2 h b 2 > 0 , so 2 h [ 2 h + b ( c π + π θ θ Δ ) ] > 0 is always true. Since 0 < u < 1 , u 1 < 0 , according to the profit objective function model of the power battery manufacturer in part III, the benefits arising from the recycling process of the power battery manufacturer is ( b c + π π θ + θ Δ ) τ ( a p ) . To ensure that the model makes sense ( b c + π π θ + θ Δ ) > 0 , so k ( u 1 ) ( b + c π + π θ θ Δ ) < 0 , so p T P < p M T P . In the same way, p M T P < p M , so p T P < p M T P < p M . □
Proposition 2 shows that scenario M has the highest retail price, followed by scenario MTP, and scenario TP has the lowest retail price. It is clear from the analysis that the retail price decreases as the reward and punishment increases. Proposition 1 shows that scenario M has the highest retail price and the lowest recovery rate, and scenario TP has the lowest retail price and the highest recovery rate.
Proposition 3.
ω M < ω M T P < ω T P .
Proof. 
ω T P ω M T P = k ( u 1 ) [ b 3 6 b h + ( b 2 + 2 h ) ( c + π π θ + θ Δ ) ] 2 h [ 2 h + b ( c π + π θ θ Δ ) ] , in Section 3.1, we know 2 h ( c π + π θ θ Δ ) 2 > 0 , in Section 3.2, we know 2 h b 2 > 0 , so 2 h [ 2 h + b ( c π + π θ θ Δ ) ] > 0 and b 3 6 b h + ( b 2 + 2 h ) ( c + π π θ + θ Δ ) < 0 are always true. Since 0 < u < 1 , u 1 < 0 , the numerator k ( u 1 ) [ b 3 6 b h + ( b 2 + 2 h ) ( c + π π θ + θ Δ ) ] > 0 is constant, so ω M T P < ω T P . In the same way, ω M < ω M T P , so ω M < ω M T P < ω T P . □
Proposition 3 shows that scenario TP has the highest wholesale price, followed by scenario MTP, and scenario M has the lowest wholesale price. The analysis shows that the wholesale price increases as the reward and punishment increases under scenario TP. Under scenario M and scenario MTP, the wholesale price decreases as the reward and punishment increases. It can be deduced from Proposition 2 that the retail price is the highest, and therefore the market demand is the lowest, in case M. It can be deduced from Proposition 1 that the recycling rate is lowest under scenario M. Therefore, the power battery manufacturer may face financial penalties from the government, and power battery manufacturers can lower the wholesale price to promote the purchase of power batteries by vehicle enterprises and increase sales volume, thus increasing profits.
In summary, scenario M has a lower recovery rate and wholesale price, but a higher retail price than the other two scenarios. Scenario TP has a higher recovery rate and wholesale price, but a lower retail price compared to the other two scenarios. In the case of MTP, the recovery rate, retail price and wholesale price are between the other two.

4.2. Closed-Loop Supply Chain Coordination Based on Recovery Rates

4.2.1. Closed-Loop Supply Chain Coordination under Scenario TP

From Section 3, it is clear that the centralized decision-making scenario τ c = ( c π + π θ Δ θ ) ( a c 1 ) 2 h + ( c π + π θ Δ θ ) 2 . In the case of TP, τ T P = a b h + k [ 4 h + b ( c π + π θ Δ θ ) ] b h c 1 2 h [ 2 h + b ( c π + π θ Δ θ ) ] . Therefore, to make the reverse supply chain recovery rate under scenario TP reach the level of centralized decision making, achieving reverse supply chain coordination based on recovery rate, it is necessary to satisfy τ T P = τ c , at this point the reward and punishment k T P = h [ 2 h + b ( c π + π θ Δ θ ) ] [ a b b c 1 4 h + 2 b ( c π + π θ Δ θ ) ( c π + π θ Δ θ ) ( a c 1 ) 2 h + ( c π + π θ Δ θ ) 2 ] 4 h + b ( c π + π θ Δ θ ) . That is, the recovery rate reaches a centralized decision level at a reward and punishment level of k T P under scenario TP.
It is known from k T P h < 0 that government reward and punishment will decrease as the difficulty factor for vehicle enterprises to recycle retired power batteries continues to increase. This phenomenon can be explained by the fact that the cost of recovery for the whole vehicle enterprise will increase when the recovery difficulty factor is high, leading to a corresponding reduction in profits, and the government will not invest too much in it at this time, and the reward and punishment will be reduced.
Let c π + π θ Δ θ = t , then k T P = h [ 4 h t b ( 2 h + t 2 ) ] ( a c 1 ) ( 4 h b t ) + ( 2 h t 2 ) , at this point the partial derivative of t with respect to k T P gives k T P t > 0 . ( c + π π θ + Δ θ ) denotes the sum of the remanufacturing cost and the benefit of step-up recycling for a unit of retired power battery recovered by the power battery manufacturer. This indicates that as the sum of the remanufacturing costs of retired power battery recycling units by power battery manufacturers and the benefits of secondary use increases, government reward and punishment will also increase, and the government will increase its efforts to guide the recycling of retired power batteries in the reverse supply chain.
It is known from k T P b < 0 that government reward and punishment will decrease as the price of transferring retired power battery recycling b continues to increase. The phenomenon can be explained by the fact that the whole vehicle enterprises will increase their own profits through the transfer price of retired power batteries when the recycling transfer price of retired power batteries is large, further stimulating the recycling enthusiasm of the whole vehicle enterprises, prompting an increase in the recycling rate and accordingly reducing the reward and punishment.

4.2.2. Closed-Loop Supply Chain Coordination under Scenario M

It can be seen from Section 3 that the recovery rate under scenario M is τ M = b ( a h + b k h c 1 ) 2 h [ 2 h + b ( c π + π θ Δ θ ) ] . Therefore, in order to make the recovery rate under scenario M reach the level of centralized decision making, it needs to satisfy τ M = τ c , at this point the rewards and penalties k M = h [ 2 h + b ( c π + π θ Δ θ ) ] [ a b b c 1 4 h + 2 b ( c π + π θ Δ θ ) ( c π + π θ Δ θ ) ( a c 1 ) 2 h + ( c π + π θ Δ θ ) 2 ] b 2 , that is, the recovery rate reaches a centralized decision level for a reward and punishment level of k M under scenario TP.
It is known from k M h < 0 that government reward and punishment will decrease with the increasing difficulty factor for vehicle enterprises to recycle retired power batteries.
Let c π + π θ Δ θ = t , then k M = h [ 4 h t b ( 2 h + t 2 ) ] ( a c 1 ) b 2 ( 2 h t 2 ) , at this point the partial derivative of t with respect to k M gives k M t > 0 . ( c + π π θ + Δ θ ) denotes the sum of the remanufacturing cost and the benefit of step-up recycling for a unit of retired power battery recovered by the power battery manufacturer. This indicates that government reward and punishment will also increase as the sum of the remanufacturing costs of retired power battery recycling units by power battery manufacturers and the benefits of secondary use increases, and the government will increase its efforts to guide the recycling of retired power batteries in the reverse supply chain.
It is known from k M b < 0 that government reward and punishment will decrease as the price of transferring retired power battery recycling b continues to increase. This can be explained by the fact that the recycling costs of power battery manufacturers will increase when the recycling transfer price of retired power batteries is larger, leading to a corresponding reduction in profits and a natural reduction in reward and punishment.

4.2.3. Closed-Loop Supply Chain Coordination under Scenario MTP

It is known from Section 3 that the recovery rate under scenario MTP τ M T P = a b h + k [ b 2 + b 2 u + 4 h u + b u ( c π + π θ Δ θ ) ] b h c 1 2 h [ 2 h + b ( c π + π θ Δ θ ) ] . Therefore, in order to make the recovery rate under scenario MTP reach the level of centralized decision making, it needs to satisfy τ M T P = τ c . At this point, with respect to rewards and penalties k M T P = h [ 2 h + b ( c π + π θ Δ θ ) ] [ a b b c 1 2 h + b ( c π + π θ Δ θ ) 2 ( c π + π θ Δ θ ) ( a c 1 ) 2 h + ( c π + π θ Δ θ ) 2 ] b 2 ( u 1 ) + 4 h u + b u ( c π + π θ Δ θ ) , i.e., the recovery rate reaches a centralized decision level for a reward and punishment level of k M T P under scenario MTP.
It is known from k M T P h < 0 that government reward and punishment will decrease with the increasing difficulty factor for vehicle enterprises to recycle retired power batteries. It is known from k M T P u < 0 that the government’s reward and punishment gradually decrease as the recycling responsibility of the whole vehicle enterprise in the scenario MTP increases.
Let c π + π θ Δ θ = t , then k M T P = h [ 4 h t b ( 2 h + t 2 ) ] ( a c 1 ) [ b 2 ( 4 h + b 2 + b t ) u ] ( 2 h t 2 ) . At this point the partial derivative of t with respect to k M T P gives k M T P t > 0 . ( c + π π θ + Δ θ ) denotes the sum of the remanufacturing cost and the benefit of step-up recycling for a unit of retired power battery recovered by the power battery manufacturer. This indicates that government reward and punishment will increase as the sum of the remanufacturing costs of retired power battery recycling units by power battery manufacturers and the benefits of secondary use increases, and the government will increase its efforts to guide the recycling of retired power batteries in the reverse supply chain.
It is known from k M T P b < 0 that the recycling costs of power battery manufacturers will also increase as the recycling transfer price b for retired power batteries continues to increase, and government reward and punishment will naturally decrease as a result.

5. Numerical Analysis

In order to better observe the impact of each variable on the profitability of each member of the closed-loop supply chain under different scenarios, this is further verified by numerical simulations in this section, with the parameter values of each model set as shown in Table 2.
According to the equilibrium solution comparison in Section 4, combined with the values of each parameter, it is calculated that when the reward and punishment strength k 346 , the recycling rate under scenario TP is the highest and close to 100%, when the wholesale price of power battery is the highest at about 74.6 RMB/kW∙h. The recycling rate under scenario M is the lowest at about 54%, when the wholesale price of power battery is the lowest and about 67.4 RMB/kW∙h.
It can be seen from Figure 2 that the profits of power battery manufacturers increase with the increase of the reward and punishment k in all three cases including scenario TP, scenario M, and scenario MTP, while scenario M has the slowest growth rate and is less profitable than the other two scenarios. That is, when power battery manufacturers share the responsibility for recycling, their own profits are reduced. It is clear from Figure 2 that the profits of the power battery manufacturers under scenario TP and scenario MTP are equal when the reward and punishment reaches a certain amount, which is calculated to be k = 1295.49 at this point.
It can be seen from Figure 3 that the profit of the whole vehicle enterprise increases with the increase of the incentive and punishment k in all three cases including scenario TP, scenario M, and scenario MTP, and it is the fastest under scenario TP. When the reward and punishment are small, the profits of the vehicle enterprises is higher under scenario M and scenario MTP than under scenario TP. However, with the increase in reward and punishment, the profits of the vehicle enterprises under scenario TP increase sharply and are greater than the other two. This shows that it will greatly increase the incentive of vehicle enterprises to recycle and thus increase their profits when the government implements an RPM for vehicle enterprises.
As can be seen from Figure 4, the total profit of the closed-loop supply chain increases with the increase of the reward and punishment k in all three cases, including scenario TP, scenario M, and scenario MTP. The total profit of the supply chain is the greatest under scenario TP, followed by scenario MTP and least under scenario M. This also shows that when vehicle enterprises take responsibility for recycling this has a positive impact on the entire closed-loop supply chain, which affects the profitability of the entire closed-loop supply chain in turn.
As shown in Figure 2, Figure 3 and Figure 4, in the case of a closed-loop supply chain dominated by power battery producers, if power battery manufacturers were to take on the responsibility of recycling alone, it would not only make their own profits lower, but would also make the entire closed-loop supply chain less profitable. However, when power battery manufacturers and vehicle enterprises jointly take responsibility for recycling, the profits of the power battery manufacturers increase with the increase in reward and punishment and are optimal, while the total profits of the supply chain are also increased.
As can be seen in Figure 5, under the scenario MTP, the profit of the vehicle enterprise decreases and then increases as the vehicle enterprise’s share of the recycling responsibility increases. On the other hand, the profit of power battery manufacturers increases first and then decreases with the increase of vehicle enterprises sharing the responsibility of recycling. When u 0.67 , the profit of the power battery manufacturer reaches the maximum; when u 1 , the profit of the power battery manufacturer is equal to that of the vehicle enterprise; when u = 1 , that is, when the government implements the reward and punishment mechanism only for vehicle enterprises, the profit of the whole supply chain is the largest. When vehicle enterprises share more responsibility for recycling, both vehicle companies and power battery manufacturers make more profit.

6. Conclusions and Future Research

This paper considers centralized decision-making and decentralized decision-making models in which the government implements RPM only for vehicle enterprises, only for power battery manufacturers and for both vehicle enterprises and power battery manufacturers, and analyses the problem of RPM for the closed-loop supply chain of NEV retired power battery recycling, providing a reference suggestion for the sustainable development of the NEV industry. By comparing and analyzing variation of the equilibrium solution with reward and punishment under different scenarios, and the variation of the equilibrium solution with the recycling responsibility sharing coefficient, a closed-loop supply chain is finally coordinated based on the recycling rate. The main conclusions are as follows:
(1) When the government implements the RPM only for vehicle enterprises, the recovery rate is the highest, and the total profit of the closed-loop supply chain is also the highest. Therefore, it is suggested that the government should set a target recycling rate according to the actual situation of each region and implement a separate RPM for vehicle enterprises. At the same time, the government should adjust its rewards and punishments strength according to the real situation when implementing the RPM, and when the difficulty factor of recycling for vehicle enterprises increases or the transfer price of used power batteries from vehicle enterprises to power battery manufacturers increases, the government should appropriately reduce the rewards and punishments strength.
(2) The profits of the vehicle enterprises increase in all three scenarios as government RPM increases. When the government implements the RPM only for the vehicle enterprises, the retail price of power batteries of the vehicle enterprises is reduced with the increase of the RPM. When the government implements the RPM only for vehicle enterprises, the retail price of power batteries of vehicle enterprises decreases with the increase of the RPM, and then the market demand increases, prompting their own profits to increase, which will increase the recycling rate in turn. At this time, the implementation of the thin profit strategy of the vehicle enterprises can improve the recycling rate of retired power batteries as well as their own profits.
(3) The profits of power battery manufacturers increase in all three scenarios as government RPM increase. When the government implements the RPM only for power battery manufacturers, the recycling rate is low, and then the power battery manufacturers may face financial penalties from the government. Therefore, power battery manufacturers should adopt the strategy of reducing wholesale prices to promote the purchase of power batteries by vehicle enterprises and increase their own profits by improving sales.
(4) When the government implements the RPM for both vehicle enterprise and power battery manufacturer, if the vehicle enterprise shares a larger responsibility, all members of the closed-loop supply chain can benefit from the RPM and the total profit of the closed-loop supply chain increases.
The shortcoming of this paper is that it only considers the issue of a single-channel closed-loop supply chain government RPM for the recycling of retired power batteries by vehicle enterprises. The scenario of multiple recycling channels has not been considered and this will be the direction in the further research. This study mainly analyses the process and destination of new energy vehicle power battery recycling; however, the battery system is also a worthy focus of research, so the analysis of the battery system (Li-Ion battery) will also be the direction of our future research efforts.

Author Contributions

Z.Z. presented the idea. M.G. wrote the first draft of this paper. W.Y. revised the first draft. Z.Z. participated in literature review and model building along with M.G. and W.Y. Computational analysis was performed by M.G. All authors have read and agreed to the published version of the manuscript.

Funding

This research was funded by the National Natural Science Foundation of China (NSFC) under Grant no. 71971131; Research Project Supported by Shanxi Scholarship Council of China under Grant no. 2022-027; the MOE (Ministry of Education in China) Youth Project of Humanities and Social Sciences Fund under grant number 17YJC630121; the Program for the Philosophy and Social Sciences Research of Higher Learning Institutions of Shanxi, grant number 2020W013.

Institutional Review Board Statement

Not applicable.

Informed Consent Statement

Not applicable.

Data Availability Statement

Not applicable.

Conflicts of Interest

The authors declare that they have no conflict of interest.

References

  1. Yuan, B. Research on the Development of China’s New Energy Vehicle Industry in the Post Subsidy Era. Reg. Econ. Rev. 2020, 3, 58–64. [Google Scholar]
  2. Kang, D.H.P.; Chen, M.; Ogunseitan, O.A. Potential environmental and human health impacts of rechargeable lithium batteries in electronic waste. Environ. Sci. Technol. 2013, 47, 5495–5503. [Google Scholar] [CrossRef] [PubMed]
  3. Pan, X.; Zhao, J.; Jiang, J. Interpretation of China’s new energy vehicle power battery recycling policy and related suggestions. World Environ. 2020, 3, 33–36. [Google Scholar]
  4. Wang, M. Discussion on echelon utilization of power batteries of new energy vehicles. Intern. Combust. Engine Parts 2021, 22, 231–232. [Google Scholar]
  5. Yang, J.; Guan, J.; Liang, B.; Li, Y. Research on Recycling of the Scrap Lithium Iron Phosphath Batteries in China. Environ. Eng. 2017, 35, 127–132. [Google Scholar]
  6. Xie, J.; Li, J.; Yang, F.; Liang, L. Decision-making and coordination optimized for multi-stage closed-loop supply chain of new energy vehicle. J. Ind. Eng. Eng. Manag. 2020, 34, 180–193. [Google Scholar]
  7. Hao, S.; Dong, Q.; Li, J. Analysis and tendency on the recycling mode of used EV batteries based on cost accounting. China Environ. Sci. 2021, 41, 4745–4755. [Google Scholar]
  8. Zhu, M.; Liu, Z.; Li, J.; Zhu, S. Electric vehicle battery capacity allocation and recycling with downstream competition. Eur. J. Oper. Res. 2020, 283, 365–379. [Google Scholar] [CrossRef]
  9. Ma, L.; Liu, Y.; Zhu, H. Design of Dual-channel Recycling Contract for New Energy Vehicle Batteries from the Perspective of Closed-loop Supply Chain. Sci. Technol. Manag. Res. 2021, 41, 184–193. [Google Scholar]
  10. Hong, X.P.; Xu, L.; Du, P.; Wang, W. Joint advertising, pricing and collection decisions in a closed-loop supply chain. Int. J. Prod. Econ. 2015, 167, 12–22. [Google Scholar] [CrossRef]
  11. Bai, S.; Liu, H. Incentive Contract between Manufacturer and Dealers with EPR. Chin. J. Manag. Sci. 2012, 20, 122–130. [Google Scholar]
  12. Ma, J.; Zhong, Y. Research on Participation Strategy Choices of Multiple Stakeholders in WEEE Recycling Under Extended Producer Responsibility. Soft Sci. 2021, 35, 122–129. [Google Scholar]
  13. Zhao, Y.; Wang, W.; Ni, Y. EPR system based on a reward and punishment mechanism: Producer-led product recycling channels. Waste Manag. 2020, 103, 198–207. [Google Scholar] [CrossRef] [PubMed]
  14. Xie, J.; Le, W.; Guo, B. Pareto Equilibrium of New Energy Vehicle Power Battery Recycling Based on Extended Producer Responsibility. Chin. J. Manag. Sci. 2020, 1–12. [Google Scholar] [CrossRef]
  15. Huang, M.; Ma, H. Recycling Strategy of Power Battery Supply Chain Considering the Effect of CSR and Gradien g the Effect of CSR and Gradient Utilization under EPR. Logist. Sci.-Tech. 2021, 44, 144–149. [Google Scholar]
  16. Yao, H.; Wang, C.; Huang, J. Mode of New Energy Automotive Battery Reclamation with Restriction of Extended Producer Responsibility. Sci. Technol. Manag. Res. 2015, 35, 84–89. [Google Scholar]
  17. Turner, J.M.; Nugent, L.M. Charging up battery recycling policies extended producer responsibility for single-use batteries in the European Union, Canada, and the United States. J. Ind. Ecol. 2016, 20, 1148–1158. [Google Scholar] [CrossRef]
  18. He, L.; Sun, B. Exploring the EPR system for power battery recycling from a supply-side perspective: An evolutionary game analysis. Waste Manag. 2021, 140, 204–212. [Google Scholar] [CrossRef]
  19. Qiu, Z.; Zheng, Y.; Xu, Y. Closed-Loop Supply Chain Recycling Subsidy Strategy of New Energy Vehicle Power Battery: An Analysis based on Evolutionary Games. Commer. Res. 2020, 8, 28–36. [Google Scholar]
  20. Liu, J.; Ma, J. Research on Reverse Subsidy Mechanism of Power Battery Closed-loop Supply Chain Considering Cascade Utilization. Ind. Eng. Manag. 2021, 26, 80–88. [Google Scholar]
  21. Gu, H.; Liu, Z.; Qing, Q. Optimal electric vehicle production strategy under subsidy and battery recycling. Energ. Policy 2017, 109, 579–589. [Google Scholar] [CrossRef]
  22. Ma, W.-M.; Zhao, Z.; Ke, H. Dual-channel closed-loop supply chain with government consumption-subsidy. Eur. J. Oper. Res. 2013, 226, 221–227. [Google Scholar] [CrossRef]
  23. Mitra, S.; Webster, S. Competition in remanufacturing and the effects of government subsidies. Int. J. Prod. Econ. 2007, 111, 287–298. [Google Scholar] [CrossRef]
  24. Lyu, X.; Xu, Y.; Sun, D. An Evolutionary Game Research on Cooperation Mode of the NEV Power Battery Recycling and Gradient Utilization Alliance in the Context of China’s NEV Power Battery Retired Tide. Sustainability 2021, 13, 4165. [Google Scholar] [CrossRef]
  25. Tang, Y.; Zhang, Q.; Li, Y.; Wang, G.; Li, Y. Recycling Mechanisms and Policy Suggestions for Spent Electric Vehicles’ Power Battery-A Case of Beijing. J. Clean. Prod. 2018, 186, 388–406. [Google Scholar] [CrossRef]
  26. Li, Q.; Zhang, H.; Liu, K. Research on Closed-Loop Supply Chain Decision-Making in Different Cooperation Modes with Government’s Reward-Penalty Mechanism. Sustainability 2021, 13, 6425. [Google Scholar] [CrossRef]
  27. Wang, W.; Zhang, Y.; Zhang, K.; Bai, T.; Shang, J. Reward-Penalty Mechanism for Closed-Loop Supply Chains under Responsibility-Sharing and Different Power Structures. Int. J. Prod. Econ. 2015, 170, 178–190. [Google Scholar] [CrossRef]
  28. Wang, W.; Fan, L.; Ma, P.; Zhang, P.; Lu, Z. Reward-Penalty Mechanism in a Closed-Loop Supply Chain with Sequential Manufacturers’ Price Competition. J. Clean. Prod. 2017, 168, 118–130. [Google Scholar] [CrossRef]
  29. Chen, C.K.; Ulya, M.A. Analyses of the Reward-Penalty Mechanism in Green Closed-Loop Supply Chains with Product Remanufacturing. Int. J. Prod. Econ. 2019, 210, 211–223. [Google Scholar] [CrossRef]
  30. Chen, H.; Dong, Z.; Li, G. Government Reward-Penalty Mechanism in Dual-Channel Closed-Loop Supply Chain. Sustainability 2020, 12, 8602. [Google Scholar] [CrossRef]
  31. Yang, K.; Zhang, W.; Zhang, Q. Incentive Policy of Power Battery Recycling Considering Ladder Utilization. Ind. Eng. Manag. 2022, 27, 1–8. [Google Scholar]
  32. Wang, W.; Deng, W. Comparison between the Reward-penalty Mechanism with the Tax-subsidy Mechanism for Reverse Supply Chains. Chin. J. Manag. Sci. 2016, 24, 102–110. [Google Scholar]
  33. Zhou, R.; Wang, X.; Yu, F. A Comparative Study of Government Subsidy and Reward-penalty Mechanism based on Third-party Recycling. Sci. Technol. Manag. Res. 2018, 38, 253–257. [Google Scholar]
  34. Ma, Z.; Hu, S.; Dai, Y. Decision Models for a Closed-loop Supply Chain with Hybrid Sale/Collection Channels for Electrical Equipment under Covernment Regulations. Chin. J. Manag. Sci. 2016, 24, 82–90. [Google Scholar]
  35. Wang, W.; Zhang, Y.; Li, Y.; Zhao, X.; Cheng, M. Closed-loop supply chains under reward-penalty mechanism: Retailer collection and asymmetric information. J. Clean. Prod. 2017, 142, 3938–3955. [Google Scholar] [CrossRef] [Green Version]
  36. Li, G.; Ren, M.; Zhou, H. Observably Boosted Electrochemical Performances of Roughened Graphite Sheet/Polyaniline Electrodes for Use in Flexible Supercapacitors. Surf. Interfaces. 2022, 30, 101874. [Google Scholar] [CrossRef]
  37. Wang, W.; Ding, J.; Wang, Z.; Da, Q. Reward-penalty Mechanism of Government for Retailer-led Clased-loop Supply Chain under Collection Responsibility Sharing. Chin. J. Manag. Sci. 2019, 27, 127–136. [Google Scholar]
  38. Li, X.; Cai, H.; Mu, Z. Research onthe decision of closed-loop supply chain under the government premium and penalty based on different power structure. Sci. Res. Manag. 2014, 35, 134–144. [Google Scholar]
  39. Wang, W.; Zhang, M.; Zhao, L.; Zhou, S. Decision-making model of closed-loop supply chain based on third-party collector’s fairness concern. J. Syst. Eng. 2019, 34, 409–421. [Google Scholar]
  40. Wang, W.; Da, Q. The Decision and Coordination Under the Premium and Penalty Mechanism for Closed-loop Supply Chain. Chin. J. Manag. Sci. 2011, 19, 36–41. [Google Scholar] [CrossRef]
  41. Guo, M.; Shu, M.; Zhang, Z. A Research on Optimal Differential Pricing Decision under Electric Vehicle Batteries Gradient Utilization. Ind. Eng. J. 2020, 23, 109–116. [Google Scholar]
  42. Zhao, X.; Shuai, P.; Lin, Y. Research Progress of Supply Chain Management for Product Recovery Systems: A Review. J. Ind. Eng. Eng. Manag. 2009, 23, 128–138. [Google Scholar]
  43. Zhang, K.; Hou, S.; Zhou, G. Pricing Strategy in the Closed-loop Supply Chain with Fairness Concerns. J. Syst. Manag. 2013, 22, 841–849. [Google Scholar]
Figure 1. Basic structure of a closed-loop supply chain dominated by power battery manufacturers. Sustainability 14 10538 i001 indicates a positive supply chain; Sustainability 14 10538 i002 indicates reverse supply chain; Sustainability 14 10538 i003 indicates that the government implements RPM for vehicle enterprises and power battery manufacturers, respectively.
Sustainability 14 10538 g001
Figure 2. Variation of profits of power battery manufacturers with reward and punishment k under decentralized decision making.
Sustainability 14 10538 g002
Figure 3. Variation of profit with reward and punishment k for a complete vehicle enterprise under decentralized decision-making.
Sustainability 14 10538 g003
Figure 4. Variation of total profit with reward and punishment k for a closed-loop supply chain under decentralized decision making.
Sustainability 14 10538 g004
Figure 5. Variation of profit with u for power battery manufacturers, vehicle enterprises and the entire closed-loop supply chain under scenario MTP.
Sustainability 14 10538 g005
Table 1. Model symbol definitions.
CategorySymbolDefinition
Market parameters c 1 Unit cost of production using new raw materials.
c 2 The unit cost of a power battery manufacturer producing new batteries from recycled retired power battery materials.
Δ Unit cost savings.
c Unit recycling treatment cost.
b Unit recovery transfer price.
h Recovery difficulty factor.
π The unit profit obtained by power battery manufacturers from GUEs.
θ Proportion of retired power batteries reused by power battery manufacturers.
τ 0 Target recovery rate.
a Market size.
p Retail price of NEV power batteries.
ω Wholesale prices of NEV power batteries.
Government
parameters
k Rewards and punishments strength. (The rewards and punishments strength established by government for each unit collection rate deviating from the target)
u Allocation ratio of RPM. (The share of recycling responsibility borne by the vehicle enterprises)
Table 2. Numerical analysis parameter settings.
Symbol c 1 c 2 Δ c b h π θ τ 0 k u a
Value5020301020800400.40.415000.4100
Publisher’s Note: MDPI stays neutral with regard to jurisdictional claims in published maps and institutional affiliations.

