Green Financial Instruments of Cleaner Production Technologies

 ,
,  , and
, and
Abstract
:1. Introduction
2. Theoretical Analysis of Green Financial Instruments in Stimulating Corporate Technologies of Decarbonization
2.1. Green Financial Instruments in Stimulating Research Aimed at Developing Low-Carbon Technologies for Enterprises
2.2. Analysis of the Impact of Green Financial Instruments on Decarbonization
2.3. Hybrid Green Financial Instruments in Support of Decarbonization
3. Theoretical Analysis and Formulation of Hypotheses
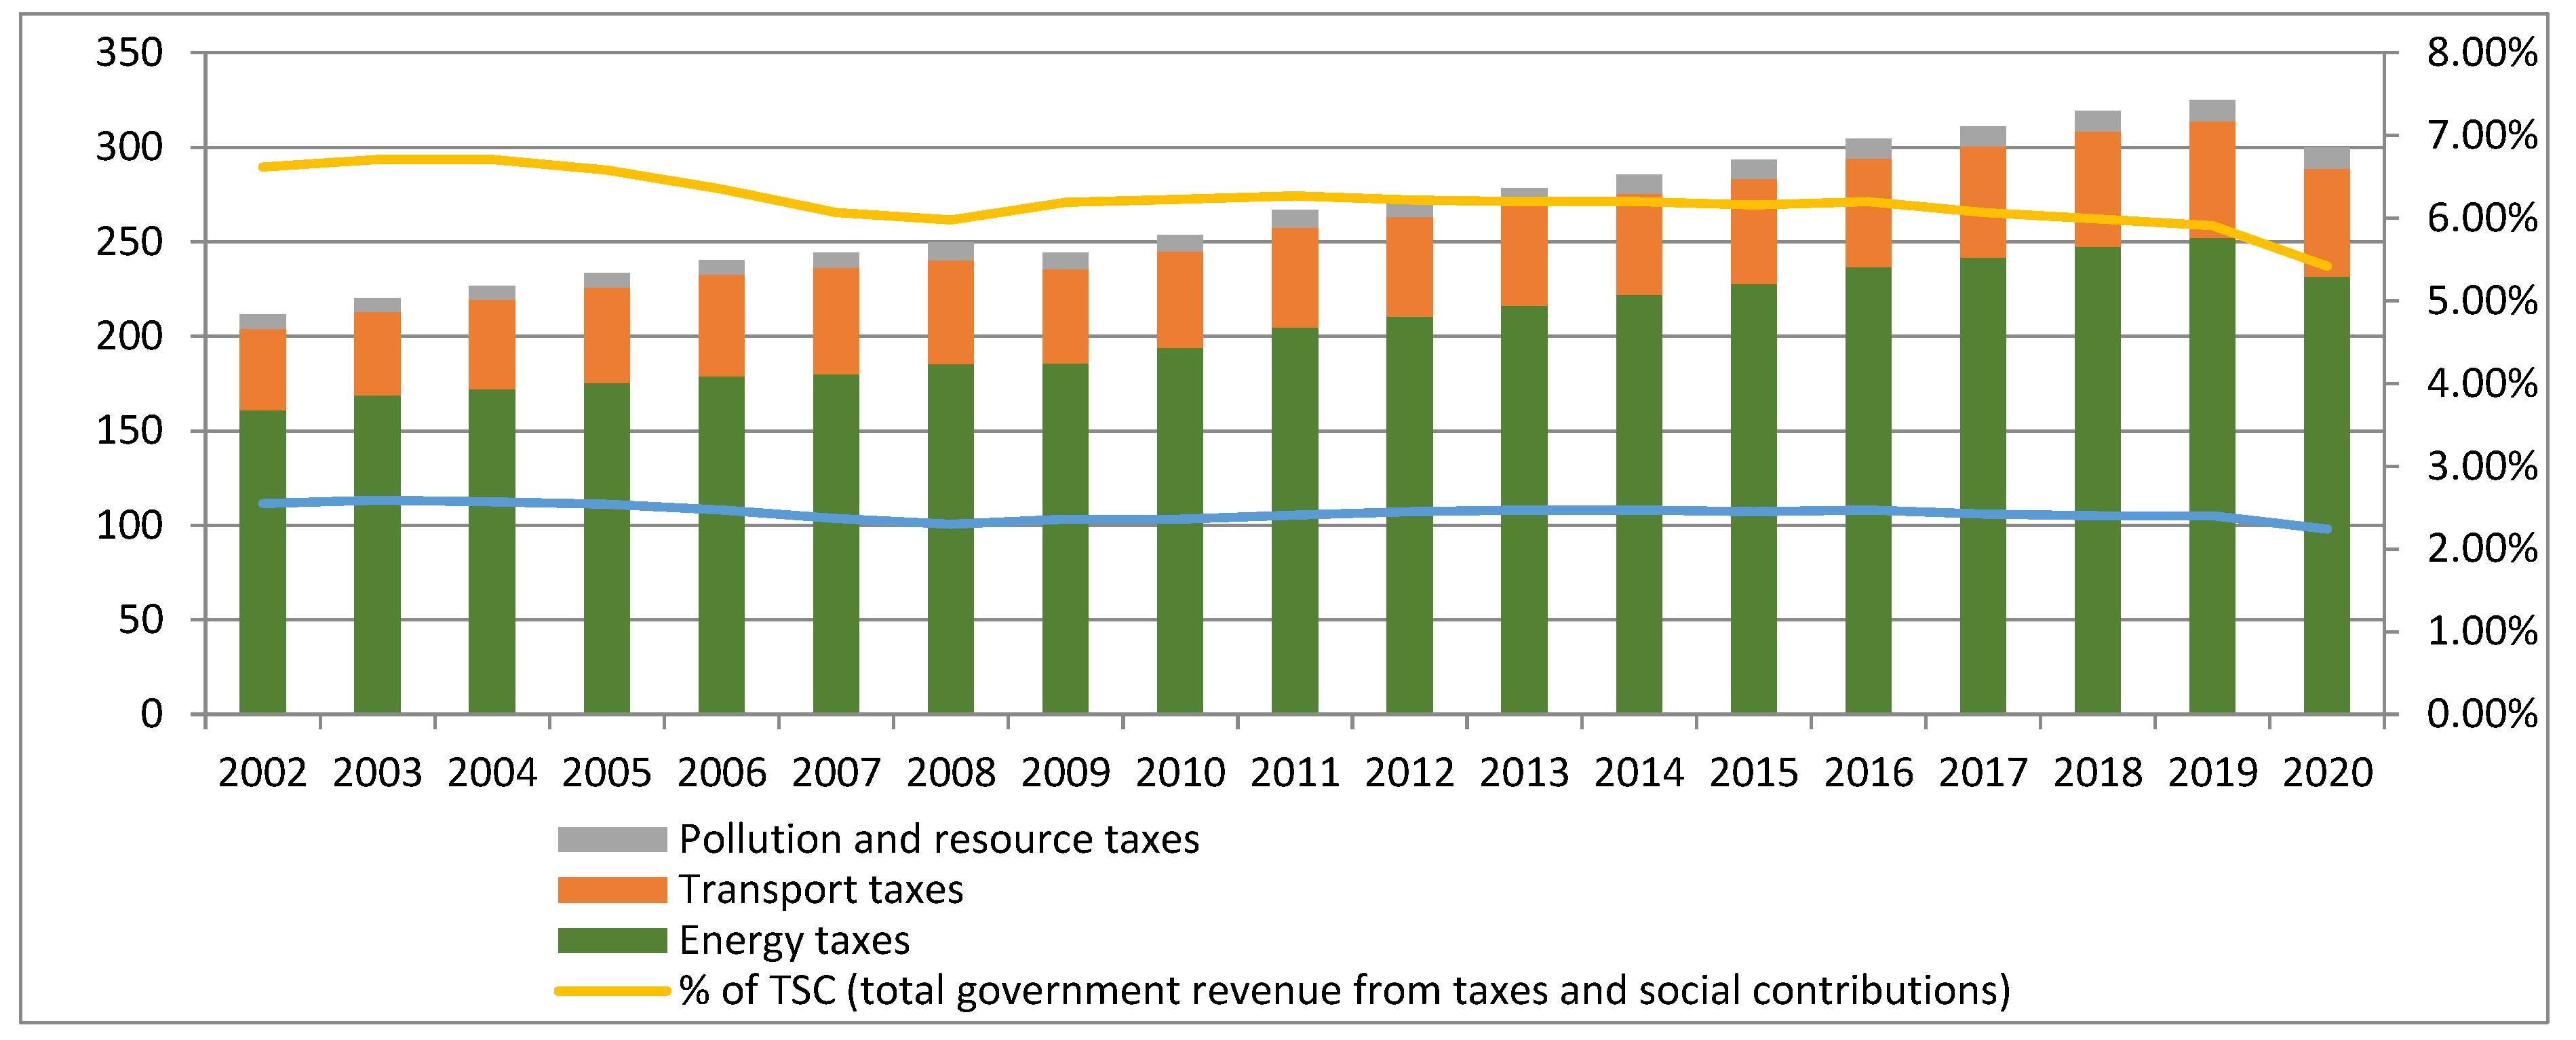
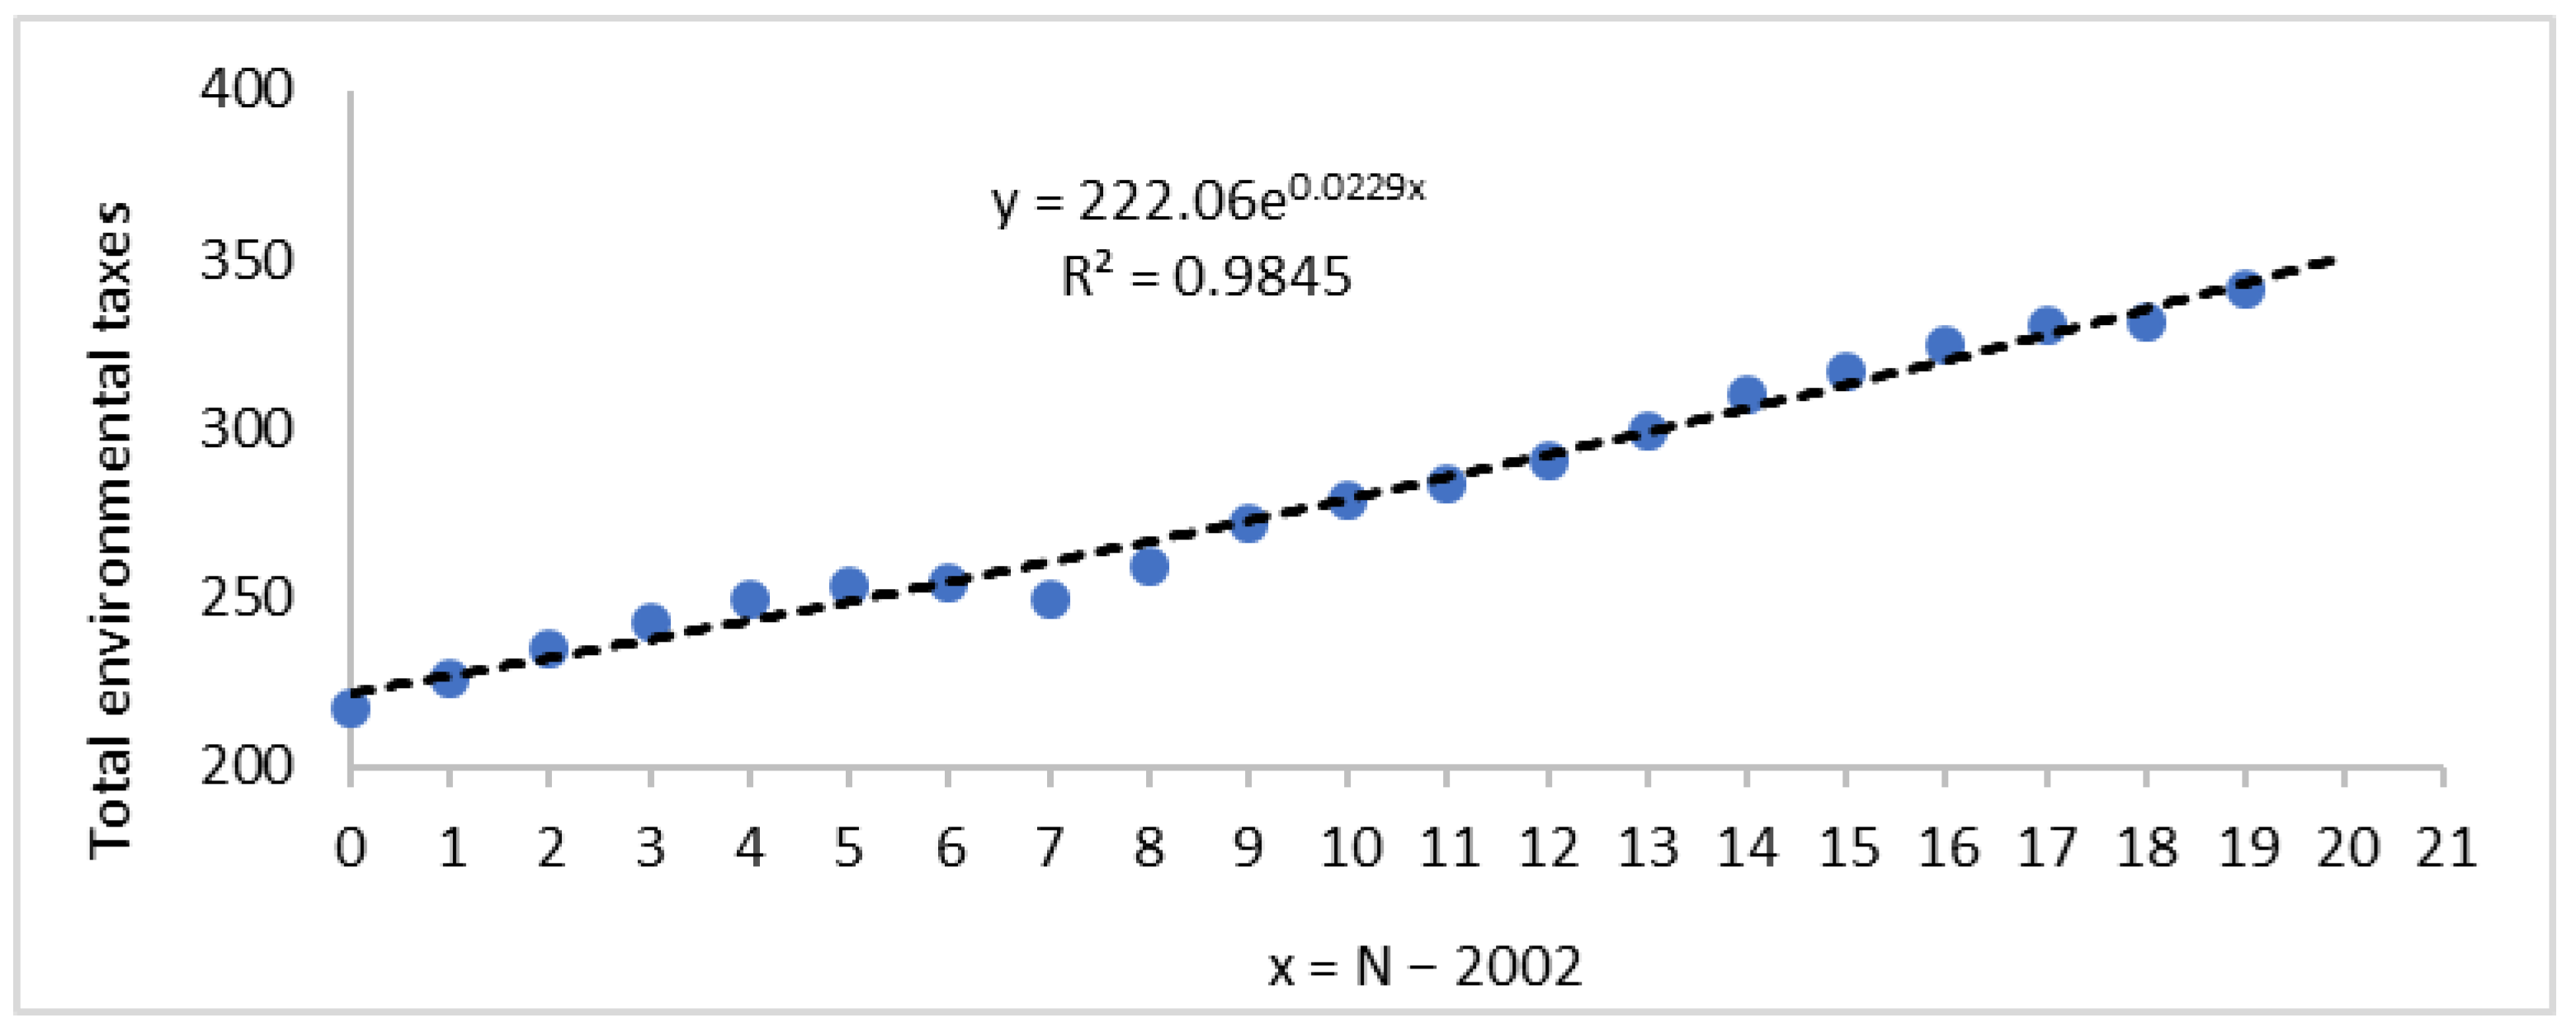
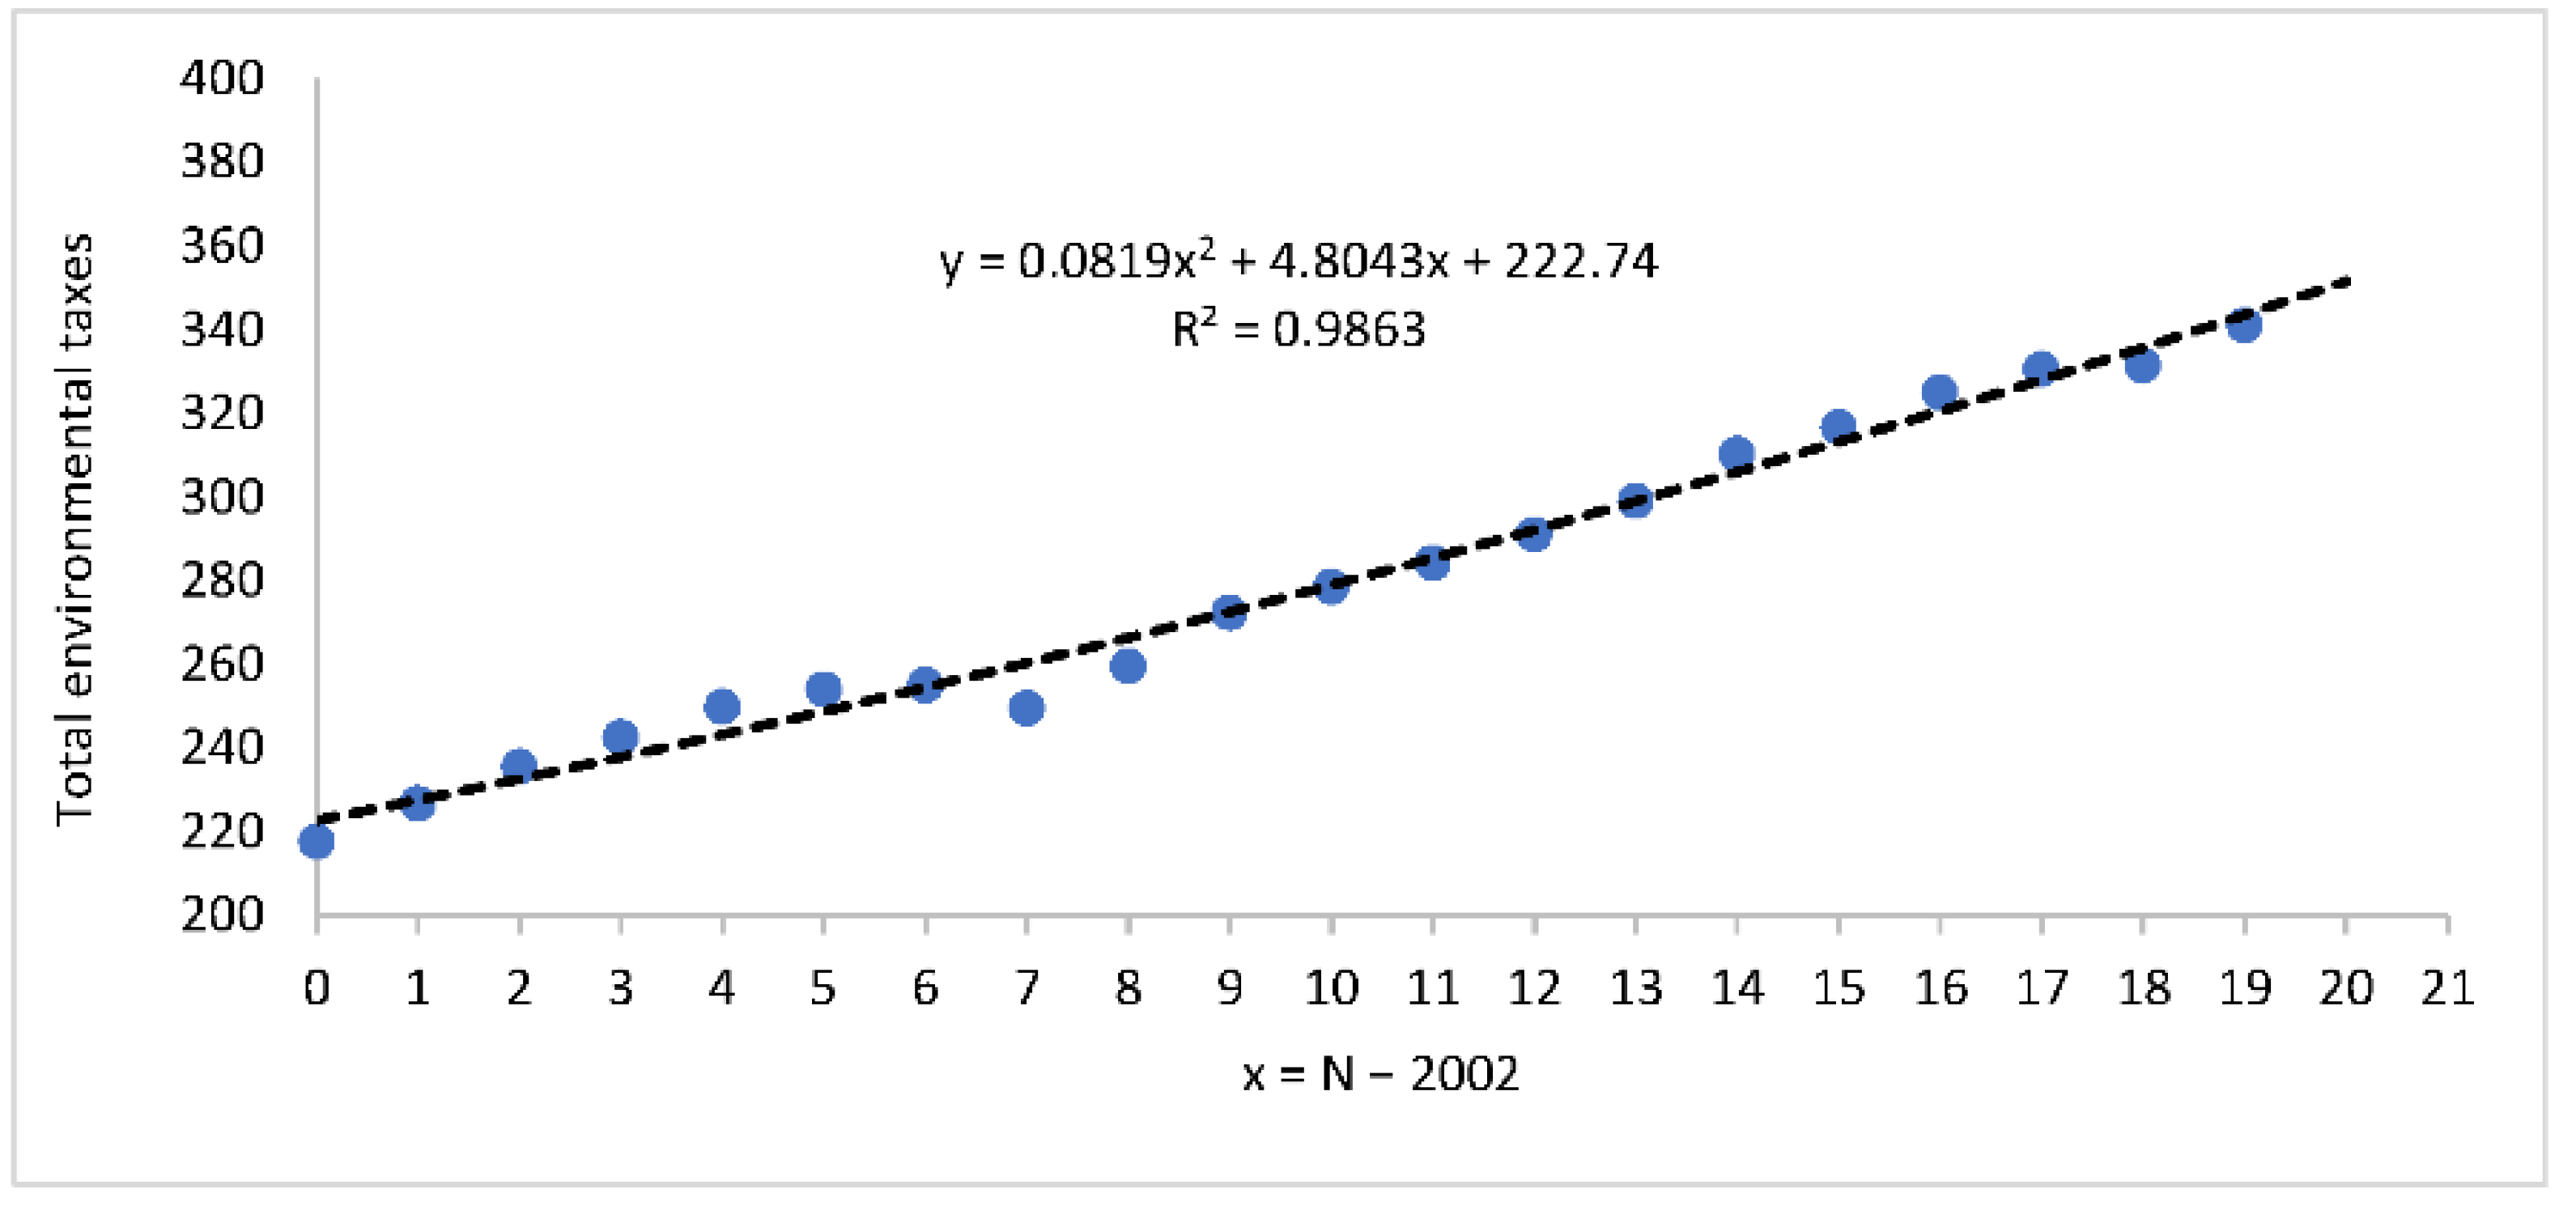
4. Empirical Data of Environmental Taxes
5. Results
6. Discussion
7. Conclusions
Author Contributions
Funding
Institutional Review Board Statement
Informed Consent Statement
Data Availability Statement
Conflicts of Interest
References
- Zhang, Y.; Qi, L.; Lin, X.; Pan, H.; Sharp, B. Synergistic Effect of Carbon ETS and Carbon Tax under China’s Peak Emission Target: A Dynamic CGE Analysis. Sci. Total Environ. 2022, 825, 154076. [Google Scholar] [CrossRef] [PubMed]
- AbdulRafiu, A.; Sovacool, B.K.; Daniels, C. The Dynamics of Global Public Research Funding on Climate Change, Energy, Transport, and Industrial Decarbonisation. Renew. Sustain. Energy Rev. 2022, 162, 112420. [Google Scholar] [CrossRef]
- Wen, S.; Jia, Z. The Energy, Environment and Economy Impact of Coal Resource Tax, Renewable Investment, and Total Factor Productivity Growth. Resour. Policy 2022, 77, 102742. [Google Scholar] [CrossRef]
- Fan, J.; Teo, T. Will China’s R&D Investment Improve Green Innovation Performance? An Empirical Study. Environ. Sci. Pollut. Res. 2022, 29, 39331–39344. [Google Scholar] [CrossRef]
- Zhang, D. Green credit regulation, induced R&D and green productivity. Revisiting the Porter Hypothesis. Int. Rev. Financ. Anal. 2021, 75, 101723. [Google Scholar]
- Yi, M.; Wang, Y.; Yan, M.; Fu, L.; Zhang, Y. Government R&D Subsidies, Environmental Regulations, and Their Effect on Green Innovation Efficiency of Manufacturing Industry: Evidence from the Yangtze River Economic Belt of China. Int. J. Environ. Res. Public Health 2020, 17, 1330. [Google Scholar] [CrossRef]
- Bai, Y.; Song, S.; Jiao, J.; Yang, R. The Impacts of Government R&D Subsidies on Green Innovation: Evidence from Chinese Energy-Intensive Firms. J. Clean. Prod. 2019, 233, 819–829. [Google Scholar] [CrossRef]
- Al Mamun, M.; Boubaker, S.; Nguyen, D.K. Green Finance and Decarbonization: Evidence from around the World. Financ. Res. Lett. 2022, 46, 102807. [Google Scholar] [CrossRef]
- Zhang, S.; Wu, Z.; Wang, Y.; Hao, Y. Fostering Green Development with Green Finance: An Empirical Study on the Environmental Effect of Green Credit Policy in China. J. Environ. Manag. 2021, 296, 113159. [Google Scholar] [CrossRef]
- Zhao, H. How Does Digital Finance Affect Carbon Emissions? Evidence from an Emerging Market. Sustainability 2021, 13, 12303. [Google Scholar] [CrossRef]
- Ahmadi, Y. How Do Carbon Taxes Affect Emissions? Plant-Level Evidence from Manufacturing. Environ. Resour. Econ. 2022, 82, 285–325. [Google Scholar] [CrossRef] [PubMed]
- Ahmad, M.; Ahmed, Z.; Bai, Y.; Qiao, G.; Popp, J.; Oláh, J. Financial inclusion technological Innovation and Environmental Quality Analyzing the Role of Green Openness. Front. Environ. Sci. 2022, 80, 851263. [Google Scholar] [CrossRef]
- Ma, J. Does the low-carbon city pilot policy promote green technology innovation? Based on green patent data of chinese a-share listed companies. Int. J. Environ. Res. Public Health 2022, 18, 3695. [Google Scholar] [CrossRef] [PubMed]
- Fan, L.; Xu, J. Authority–enterprise equilibrium based mixed subsidy mechanism for carbon reduction and energy utilization in the coalbed methane industry. Energy Policy 2020, 147, 111828. [Google Scholar] [CrossRef]
- Ahmad, M.; Ahmed, Z.; Gavurova, B.; Oláh, J. Financial Risk, Renewable Energy Technology Budgets, and Environmental Sustainability: Is Going Green Possible? Front. Environ. Sci. 2022, 10, 909190. [Google Scholar] [CrossRef]
- Lu, Y.; Guo, J.; Ahmad, M.; Zhang, H. Can Sci-Tech Finance Pilot Policies Reduce Carbon Emissions? Evidence from 252 Cities in China. Front. Environ. Sci. 2022, 10, 933162. [Google Scholar] [CrossRef]
- Xu, D.; Sheraz, M.; Hassan, A.; Sinha, A.; Ullah, S. Financial Development, Renewable Energy and CO2 Emission in G7 Countries: New Evidence from Non-Linear and Asymmetric Analysis. Energy Econ. 2022, 109, 105994. [Google Scholar] [CrossRef]
- Yu, W.; Zhan, Q.; Ameer, W.; Li, L.; Tarczyński, W.; Mentel, U. Effects of Heterogeneity of Financialization on Firm Innovation: Evidence in Context of Energy Transition in Lens of Research and Development. Front. Energy Res. 2022, 10, 930974. [Google Scholar] [CrossRef]
- Zhou, Y.; Du, Y.; Lei, F.; Su, Z.; Feng, Y.; Li, J. Influence of Financialization of Heavily Polluting Enterprises on Technological Innovation under the Background of Environmental Pollution Control. Int. J. Environ. Res. Public Health 2021, 18, 13330. [Google Scholar] [CrossRef]
- Prokopenko, O.; Mishenin, Y.; Mura, L.; Yarova, I. Environmental and Economic Regulation of Sustainable Spatial Agroforestry. Int. J. Glob. Environ. Issues 2020, 19, 109. [Google Scholar] [CrossRef]
- Lee, C.C.; Wang, F. How does digital inclusive finance affect carbon intensity? Econ. Anal. Policy 2022, 75, 174–190. [Google Scholar] [CrossRef]
- Zhong, Q.; Wen, H.; Lee, C.-C. How Does Economic Growth Target Affect Corporate Environmental Investment? Evidence from Heavy-Polluting Industries in China. Environ. Impact Assess. Rev. 2022, 95, 106799. [Google Scholar] [CrossRef]
- Zhang, D. Credit policy, uncertainty, and firm R&D investment, A quasi-natural experiment based on the Green Credit Guidelines. Pac. Basin Financ. J. 2022, 73, 101751. [Google Scholar] [CrossRef]
- Yu, E.P. Greenwashing in environmental, social and governance disclosures. Res. Int. Bus. Financ. 2022, 52, 101192. [Google Scholar] [CrossRef]
- He, W.; Liu, P.; Lin, B.; Zhou, H.; Chen, X. Green Finance Support for Development of Green Buildings in China: Effect, Mechanism, and Policy Implications. Energy Policy 2022, 165, 112973. [Google Scholar] [CrossRef]
- Ren, X.; Shao, Q.; Zhong, R. Nexus between Green Finance, Non-Fossil Energy Use, and Carbon Intensity: Empirical Evidence from China Based on a Vector Error Correction Model. J. Clean. Prod. 2020, 277, 122844. [Google Scholar] [CrossRef]
- Li, X.; Yang, Y. Does Green Finance Contribute to Corporate Technological Innovation? The Moderating Role of Corporate Social Responsibility. Sustainability 2022, 14, 5648. [Google Scholar] [CrossRef]
- Zhang, A.; Deng, R.; Wu, Y. Does the Green Credit Policy Reduce the Carbon Emission Intensity of Heavily Polluting Industries? -Evidence from China’s Industrial Sectors. J. Environ. Manag. 2022, 311, 114815. [Google Scholar] [CrossRef]
- Wang, Y.; Lei, X.; Zhao, D.; Long, R.; Wu, M. The Dual Impacts of Green Credit on Economy and Environment: Evidence from China. Sustainability 2021, 13, 4574. [Google Scholar] [CrossRef]
- Shi, J.; Yu, C.; Li, Y.; Wang, T. Does Green Financial Policy Affect Debt-Financing Cost of Heavy-Polluting Enterprises? An Empirical Evidence Based on Chinese Pilot Zones for Green Finance Reform and Innovations. Technol. Forecast. Soc. Chang. 2022, 179, 121678. [Google Scholar] [CrossRef]
- Böhringer, C.; Schneider, J.; Springmann, M. Economic and Environmental Impacts of Raising Revenues for Climate Finance from Public Sources. Clim. Policy 2020, 21, 546–562. [Google Scholar] [CrossRef]
- Lukšić, I.; Bošković, B.; Novikova, A.; Vrbensky, R. Innovative Financing of the Sustainable Development Goals in the Countries of the Western Balkans. Energy Sustain. Soc. 2022, 12, 15. [Google Scholar] [CrossRef] [PubMed]
- Nie, P.-Y.; Wen, H.-X.; Wang, C. Cooperative green innovation. Environ. Sci. Pollut. Res. 2022, 29, 30150–30158. [Google Scholar] [CrossRef] [PubMed]
- Khurshid, A.; Qayyum, S.; Calin, A.C.; Saleem, S.F.; Nazir, N. The Role of Pricing Strategies, Clean Technologies, and Ecological Regulation on the Objectives of the UN 2030 Agenda. Environ. Sci. Pollut. Res. 2022, 29, 31943–31956. [Google Scholar] [CrossRef] [PubMed]
- Hussain, M.; Ye, C.; Ye, C.; Wang, Y. Impact of Financial Inclusion and Infrastructure on Ecological Footprint in OECD Economies. Environ. Sci. Pollut. Res. 2021, 29, 21891–21898. [Google Scholar] [CrossRef]
- Chen, X.; Xu, J. Estimation of the shadow price of pollutants in chemical enterprises—Based on parameterized directional distance function. J. Peking Univ. 2021, 57, 341–350. [Google Scholar] [CrossRef]
- Ma, N. The short-term price effects and transmission mechanism of CO2 cost pass-through in China: A partial transmission model. Resour. Policy 2021, 70, 101972. [Google Scholar] [CrossRef]
- Traviesa, L.; Vigil Berrocal, M.; Ortega Fernández, F.; Martínez Huerta, G.M. The importance of the carbon footprint for the evaluation of investments: Use of heat pipes for the production of STEAM. In Proceedings of the 25th International Congress on Project Management and Engineering, Alcoi, Spain, 6–9 July 2021; pp. 1690–1700. [Google Scholar]
- Duan, Y.; Han, Z.; Zhang, H.; Wang, H. Research on the Applicability and Impact of CO2 Emission Reduction Policies on China’s Steel Industry. Int. J. Clim. Chang. Strateg. Manag. 2021, 13, 352–374. [Google Scholar] [CrossRef]
- Aleluia, J.; Tharakan, P.; Chikkatur, A.P.; Shrimali, G.; Chen, X. Accelerating a Clean Energy Transition in Southeast Asia: Role of Governments and Public Policy. Renew. Sustain. Energy Rev. 2022, 159, 112226. [Google Scholar] [CrossRef]
- Laktionova, O.; Harbar, Z.; Melikhov, A.; Slobodianiuk, O.; Gevko, V.; Desiatskyi, S. Financing the greening of enterprises in industrial regions of ukraine in the context of sustainable development. Manag. Theory Stud. Rural. Bus. Infrastruct. Dev. 2022, 43, 574–584. [Google Scholar] [CrossRef]
- Arsawan, I.W.E.; Koval, V.; Duginets, G.; Kalinin, O.; Korostova, I. The Impact of Green Innovation on Environmental Performance of SMEs in an Emerging Economy. E3S Web Conf. 2021, 255, 01012. [Google Scholar] [CrossRef]
- Howaniec, H. Knowledge and Perception of Corporate Social Responsibility Among Polish Customers. Responsib. Sustain. 2015, 3, 37–44. [Google Scholar]
- Pimonenko, T.; Prokopenko, O.; Dado, J. Net zero house: EU experience in Ukrainian conditions. Int. J. Ecol. Econ. Stat. 2017, 38, 46–57. [Google Scholar]
- Mazur, A.; Kubai, O. Scientific-methodological and practical principles of regional economic systems integration. Balt. J. Econ. Stud. 2019, 5, 117. [Google Scholar] [CrossRef]
- Harbar, Z.; Selezneva, O.; Litvinov, O.; Kaptalan, S.; Gonchar, V. Strategic Marketing Management of Innovative Activities In Ensuring Enterprise Economic Security. REICE Rev. Electrón. Investig. Cienc. Econ. 2020, 8, 298–313. [Google Scholar] [CrossRef]
- Eurostat. Statistics Database. Available online: https://ec.europa.eu/eurostat/data/database (accessed on 10 June 2022).
- Mavlutova, I.; Fomins, A.; Spilbergs, A.; Atstaja, D.; Brizga, J. Opportunities to Increase Financial Well-Being by Investing in Environmental, Social and Governance with Respect to Improving Financial Literacy under COVID-19: The Case of Latvia. Sustainability 2021, 14, 339. [Google Scholar] [CrossRef]
- Shkola, V.; Prokopenko, O.; Stoyka, A.; Nersesov, V.; Sapiński, A. Green Project Assessment within the Advanced Innovative Development Concept. Stud. Appl. Econ. 2021, 39. [Google Scholar] [CrossRef]
- Bazaluk, O.; Havrysh, V.; Nitsenko, V.; Baležentis, T.; Streimikiene, D.; Tarkhanova, E.A. Assessment of Green Methanol Production Potential and Related Economic and Environmental Benefits: The Case of China. Energies 2020, 13, 3113. [Google Scholar] [CrossRef]
- Howaniec, H.; Kasiński, P. How to communicate CSR activities? Should companies communicate their social commitment? In Proceedings of the 38th International Business Information Management Association, Seville, Spain, 23–24 November 2021; pp. 7214–7227. [Google Scholar]
- Atstaja, D.; Koval, V.; Grasis, J.; Kalina, I.; Kryshtal, H.; Mikhno, I. Sharing Model in Circular Economy towards Rational Use in Sustainable Production. Energies 2022, 15, 939. [Google Scholar] [CrossRef]
- Trachenko, L.; Lazorenko, L.; Maslennikov, Y.; Hrinchenko, Y.; Arsawan, I.W.E.; Koval, V. Optimization Modeling of Business Processes of Engineering Service Enterprises in the National Economy. Nauk. Visnyk Natsionalnoho Hirnychoho Universytetu 2021, 4, 165–171. [Google Scholar] [CrossRef]
- Lohosha, R.; Mykhalchyshyna, L.; Prylutskyi, A.; Kubai, O. Institutionalization of the Agrarian Market in Ukraine and European Economic Community: Genesis, Evaluation and Analysis. Indep. J. Manag. Prod. 2020, 11, 727. [Google Scholar] [CrossRef]
- Zhen, L.; Huang, L.; Wang, W. Green and sustainable closed-loop supply chain network design under uncertainty. J. Clean. Prod. 2019, 227, 1195–1209. [Google Scholar] [CrossRef]
- Suryantini, N.P.S.; Arsawan, I.W.E.; Darmayanti, N.P.A.; Moskalenko, S.; Gorokhova, T. Circular Economy: Barrier and Opportunities for SMEs. E3S Web Conf. 2021, 255, 01017. [Google Scholar] [CrossRef]
- Sybir, A.; Hubynskyi, M.; Fedorov, S.; Hubynskyi, S.; Vvedenska, T.; Bezuglyi, V. Effect of heat shock on graphitization of Donbass anthracite. Min. Miner. Depos. 2020, 14, 43–49. [Google Scholar] [CrossRef]
- Matkivskyi, S. Increasing hydrocarbon recovery of Hadiach field by means of CO2 injection as a part of the decarbonization process of the energy sector in Ukraine. Min. Miner. Depos. 2022, 16, 114–120. [Google Scholar] [CrossRef]


| TAX/TIME | 2002 | 2003 | 2004 | 2005 | 2006 | 2007 | 2008 |
| TET, BI | 217.62 | 226.68 | 235.46 | 249.79 | 254.04 | 255.00 | |
| ET, BI | 167.25 | 175.56 | 179.06 | 182.47 | 186.39 | 187.34 | 189.35 |
| TT, BI | 42.46 | 43.33 | 48.53 | 52.05 | 54.87 | 57.78 | 56.28 |
| TP/R | 7.90 | 7.78 | 7.86 | 7.97 | 8.51 | 8.90 | 9.36 |
| % of TSG | 6.62 | 6.71 | 6.71 | 6.58 | 6.35 | 6.07 | 5.98 |
| % of GDP | 2.55 | 2.59 | 2.57 | 2.54 | 2.47 | 2.37 | 2.3 |
| TAX/TIME | 2009 | 2010 | 2011 | 2012 | 2013 | 2014 | 2015 |
| TET, BI | 249.48 | 259.60 | 272.35 | 278.48 | 284.17 | 290.97 | 299.06 |
| ET, BI | 189.75 | 198.63 | 209.37 | 215.34 | 220.85 | 226.24 | 231.76 |
| TT, BI | 50.92 | 52.03 | 53.64 | 53.41 | 53.61 | 54.66 | 56.73 |
| TP/R | 8.87 | 8.93 | 9.33 | 9.72 | 9.70 | 10.07 | 10.56 |
| % of TSG | 6.19 | 6.23 | 6.27 | 6.22 | 6.2 | 6.2 | 6.16 |
| % of GDP | 2.36 | 2.36 | 2.41 | 2.45 | 2.47 | 2.47 | 2.45 |
| TAX/TIME | 2016 | 2017 | 2018 | 2019 | 2020 | 2021 | 2022 |
| TET, BI | 310.17 | 316.63 | 324.95 | 330.57 | 331.45 | 341.000 | 351.26 |
| ET, BI | 241.21 | 246.04 | 252.40 | 257.53 | 256.76 | 258.35 | 260.23 |
| TT, BI | 58.42 | 59.93 | 61.94 | 62.43 | 62.53 | 62.98 | 62.99 |
| TP/R, BI | 10.53 | 10.65 | 10.60 | 10.61 | 10.76 | 10.98 | 10.87 |
| % of TSG | 6.2 | 6.07 | 5.99 | 5.91 | 5.90 | 5.92 | 5.94 |
| % of GDP | 2.47 | 2.42 | 2.4 | 2.37 | 2.36 | 2.37 | 2.38 |
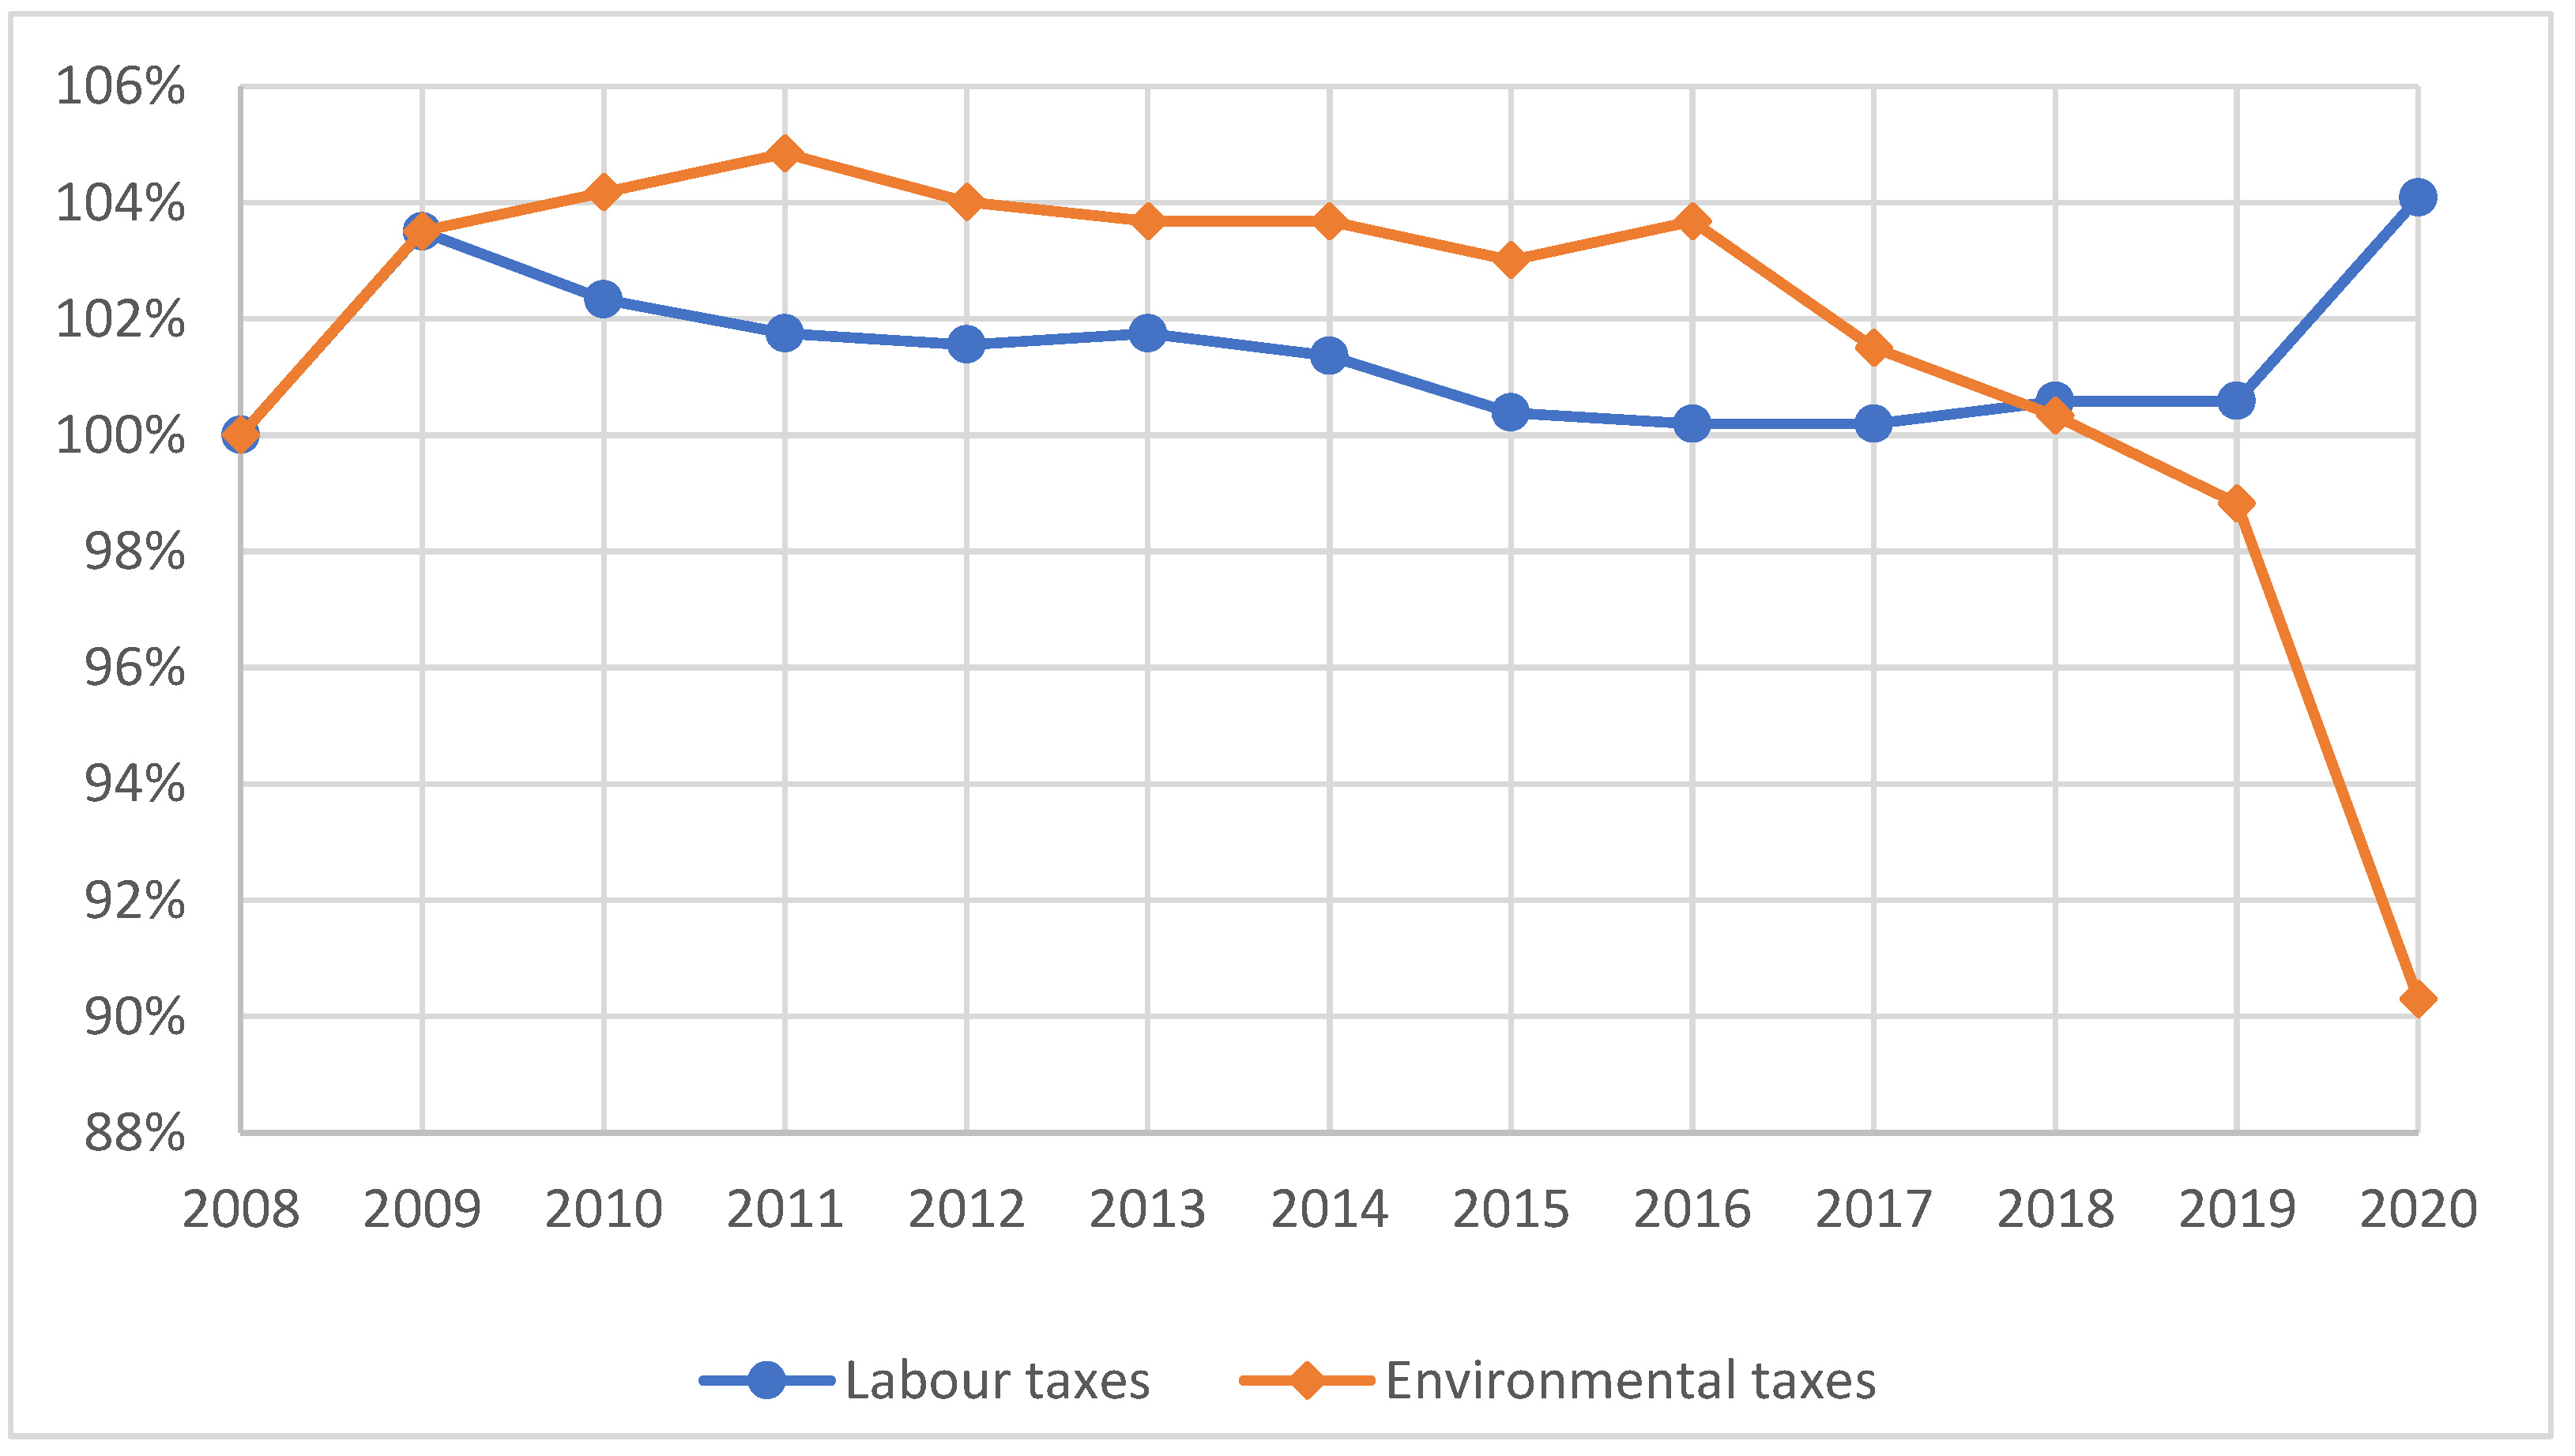
| Year | |||||
|---|---|---|---|---|---|
| 2008 | 0 | 51.4 | 5.98 | 100 | 100 |
| 2009 | 1 | 53.2 | 6.19 | 104 | 104 |
| 2010 | 2 | 52.6 | 6.23 | 102 | 104 |
| 2011 | 3 | 52.3 | 6.27 | 102 | 105 |
| 2012 | 4 | 52.2 | 6.22 | 102 | 104 |
| 2013 | 5 | 52.3 | 6.2 | 102 | 104 |
| 2014 | 6 | 52.1 | 6.2 | 101 | 104 |
| 2015 | 7 | 51.6 | 6.16 | 100 | 103 |
| 2016 | 8 | 51.5 | 6.2 | 100 | 104 |
| 2017 | 9 | 51.5 | 6.07 | 100 | 102 |
| 2018 | 10 | 51.7 | 6 | 101 | 100 |
| 2019 | 11 | 51.7 | 5.91 | 101 | 99 |
| 2020 | 12 | 53.5 | 5.4 | 104 | 90 |
Publisher’s Note: MDPI stays neutral with regard to jurisdictional claims in published maps and institutional affiliations. |
© 2022 by the authors. Licensee MDPI, Basel, Switzerland. This article is an open access article distributed under the terms and conditions of the Creative Commons Attribution (CC BY) license (https://creativecommons.org/licenses/by/4.0/).
Share and Cite
Koval, V.; Laktionova, O.; Atstāja, D.; Grasis, J.; Lomachynska, I.; Shchur, R. Green Financial Instruments of Cleaner Production Technologies. Sustainability 2022, 14, 10536. https://doi.org/10.3390/su141710536
Koval V, Laktionova O, Atstāja D, Grasis J, Lomachynska I, Shchur R. Green Financial Instruments of Cleaner Production Technologies. Sustainability. 2022; 14(17):10536. https://doi.org/10.3390/su141710536
Chicago/Turabian StyleKoval, Viktor, Olga Laktionova, Dzintra Atstāja, Janis Grasis, Iryna Lomachynska, and Roman Shchur. 2022. "Green Financial Instruments of Cleaner Production Technologies" Sustainability 14, no. 17: 10536. https://doi.org/10.3390/su141710536