Article

Investigation into the Effect of Multi-Component Coal Blends on Properties of Metallurgical Coke via Petrographic Analysis under Industrial Conditions

1
Energy Systems and Energy Management Chair, National Metallurgical Academy of Ukraine, 49600 Dnipro, Ukraine
2
Ferrous Metallurgy Chair, Montanuniversität Leoben, 8700 Leoben, Austria
3
Department of Chemistry, Dnipro University of Technology, 49005 Dnipro, Ukraine
4
Mining and Metallurgical Institute Named after O.A. Baikonurov, Satbayev University, Almaty 50013, Kazakhstan
5
Department of Mining Engineering and Education, Dnipro University of Technology, 49005 Dnipro, Ukraine
6
Department of Development of Mineral Deposits, Non-Profit Joint-Stock Company, Abylkas Sagimov Karaganda Technical University, Karaganda 100012, Kazakhstan
*
Author to whom correspondence should be addressed.
Sustainability 2022, 14(16), 9947; https://doi.org/10.3390/su14169947
Submission received: 3 July 2022 / Revised: 2 August 2022 / Accepted: 9 August 2022 / Published: 11 August 2022
(This article belongs to the Special Issue Sustainable Development and Utilization of Coal Measures Resources)

Abstract

:
The coalification rank of the coal blend components and their caking properties initially impact the coke’s quality. In part, the quality of coke depends on the technological parameters of the coke production technology, such as the method of blend preparation, the coking condition, the design features of the coke ovens, and the technique used for post-oven treatment. Therefore, to improve the coke quality, the main attention is paid to the quality of the coal blend. The petrographic analysis is the simplest and most reliable way to control coal quality indicators under industrial conditions. In this paper, the effect of nine industrial blends on coke quality using petrographic analysis has been studied. Additionally, this paper addresses the efficient use of coals and the preparation of coal mixtures under industrial conditions, which contributes to the sustainability of cokemaking. For the preparation of blends, 17 coals were used, for which, in addition to petrographic and proximate analyzes, the maximum thickness of the plastic layer was determined. Industrially produced cokes were analyzed for coke reactivity index (CRI), coke strength after reaction with CO2 (CSR), and Micum indices (M25 and M10). It has been established that the petrographic properties of coal blends are reliable parameters for assessing the quality of coke under conditions of an unstable raw material base, multi-component blends, and changes in coking regimes. Moreover, the research results have shown that to ensure the rational use of coals in the preparation of coal blends to achieve the required coke quality and consequently the sustainability of cokemaking, it is necessary to consider not only the mean reflectance of vitrinite but the proximate and caking properties of coals.

1. Introduction

Efficient use of coals to prepare coal blends and obtain coke with good properties is essential to achieving sustainable cokemaking under changing industrial conditions. In turn, achieving carbon neutrality and rational use of non-renewable fuel in the coming decades for metallurgical production is the focus of many studies. However, at present, existing technologies do not allow completely abandoning the use of coal and coke and there is still a great need to use this fuel and reducing agent.
The main consumers of coke are blast furnace ironmaking units, and therefore the cokemaking technology is aimed at producing coke which can meet the requirements of the blast furnace process. The operation of the blast furnace is determined by the stability of the technological parameters of smelting and the consistency of the quality of charge materials. The quality of the coke plays a key role since the coke in the blast furnace performs an indispensable function that ensures the maintenance of the skeleton of the charging column and the gas permeability of the charge. Coke is the only solid material in the blast furnace that reaches the tuyere zone, ensuring the movement of gases up the furnace and the flow of iron and slag into the blast-furnace hearth. In addition, coke functions as a fuel and reducing agent, as a filter for entrained particles from the race way, delivers chemical energy to melt the burden, and provides the carbon for the carburization [1,2,3].
For the good performance of a blast furnace, coke should have high mechanical strength, be uniform in size, and have relatively low reactivity [4]. Moreover, blast furnace coke should possess a minimum of harmful components, such as moisture, mineral impurities, and sulfur [5,6,7,8,9]. Requirements for the quality of coke are being tightened due to the requirement to reduce consumption and improve blast furnaces’ technical and economic performance. Improving coke quality is especially important in connection to intensifying blast furnace production. Advanced technologies, such as injection of pulverized solid fuel (coal, biomass, plastic, etc.), liquid (oil, tar), gas (hydrogen, coke oven gas), increase in the volume of blast furnaces, and the use of metallics such as DRI [10] can also intensify the blast furnace smelting process and reduce coke consumption.
The quality of coke is crucially determined by the composition and quality of the coal blend [11]. A coal blend is a mixture of coal concentrates with required coal rank, coalification, caking and coking properties, and parameter values of proximate analysis. Practically, to improve the quality of coke, primary attention is paid to the raw material used for coking, namely the optimization of the composition and quality of the coal blend.
Coals differ in properties as they are inhomogeneous substances [12,13]. Therefore, for the preparation of coal blends, with the subsequent production of coke of the required quality, it is necessary to consider a set of parameters of coal properties and their cost. Under Ukrainian industrial conditions, the coal blend is prepared based on proximate analysis indicators (moisture, ash yield, volatiles, sulfur). It uses one or more methods for determining caking and/or coking ability. The most commonly used method is Sapozhnikov’s method for determining plastic layer thickness [14,15], the less commonly used methods are Gieseler [16], the Audibert-Arnu dilatometer [17], and the Roga index [18]. In addition, the laboratory coking installation Karbotest is used to study the blend’s properties and the coke quality [19,20]. When preparing the blend, carrying out a petrographic analysis of the blend components is required.
Petrographic analysis plays an important role in choosing the rational use of coal, particularly in preparing coking coal blends. The petrographic analysis of coal focuses on maceral composition and reflectance analysis. Three main groups of macerals are classified into vitrinite, liptinite, and inertinite [21,22,23]. Moreover, they can be divided based on their different fusibility qualities into fusibles (some of the inertinite macerals as well as the vitrinite and liptinite macerals) and infusibles (the remaining inertinite macerals and minerals) [24,25,26,27,28].
There are known papers devoted to establishing the relationship between the parameters of petrographic analysis and indicators of proximate and ultimate analyses and the relationship with the thermoplastic properties of coals. Thus, for example, the relationship between the content of volatile substances or carbon content and the reflectance of vitrinite for single coal has been studied in [29,30]. A strong negative correlation was observed between the volatile matter content and the reflectance of vitrinite. Additionally, Ref. [31] reported a positive dependence of the reflectance of vitrinite upon the carbon content. It has been observed [30] that the vitrinite maceral group and its sub-macerals have the strongest positive relationship with coal plasticity. Wang et al. [31] studied coal samples with the reflectance of vitrinite within the range of 0.35 to 4.26%. The authors showed a good negative correlation between the reflectance of vitrinite and the volatile matters. It has also been noted that due to aliphatic polyester degradation and aromatization occurring during coalification, fixed carbon has a high positive correlation with the reflectance of vitrinite. Antoshchenko et al. [32,33] developed an industrial coal rank classification to determine hazardous characteristics of workable beds.
Vitrinite is the main active ingredient of coking coal, forming a non-volatile plastic layer during pyrolysis. When heated, and softened, reactive macerals become plastic, function as a binder, and contribute to forming a fused coke residue. Inerts generally remain structurally unchanged and inert during the coking [30,34,35]. According to Jing et al. [36], coal with a high inertinite content is more aromatic and polycondensed, and has a high cross-linkage [30]. In turn, coal with a high content of liptinite usually has the lowest aromaticity. The vitrinite group of macerals has higher thermoplastic characteristics and contains more volatile matters (no more than liptinite), and has a lower degree of shrinkage of aromatic compounds and a greater amount of hydroxyl groups [37]. Therefore, the controlling factor in the quality of the coal blend and, subsequently, the coke quality is the requirement for the correct preparation of multi-component coal blends, which consist of individual coals with different ratios of fusibles and infusibles of petrographic components.
Regarding the influence of the petrographic properties of coal on coke quality, it is important to study the effect of coal macerals on coke’s properties and establish the relationship between petrographic parameters and parameters characterizing the properties of the coke [38,39,40]. Gupta et al. [41] suggested using a combined coal index obtained by combining two types of modifications in the original full phase maceral reflectance parameters. The proposed index can better correlate coke strength both cold and after reaction with CO2. Several papers [42,43,44] show the relationship between petrographic properties and the physicomechanical (coke strength) [45] and physicochemical (coke reactivity) [45,46] properties of coke. However, the parameters of CSR and CRI depend not only on coal composition (organic or inorganic inerts) but also on coal rheology, coal rank, and coking conditions [45]. Kumar et al. [47] studied 14 cokes and found that the cokes with preferential CSR (>58%) were produced from coals with Rmax of 1.1–1.2%, which confirms the relationship between the reflectance of vitrinite and coke strength. It was also found that vitrinite and liptinite form plastic substances that bind the structure of coke, which leads to the high strength of the coke [47], and inertinite reduces the strength of the coke [48]. In papers [49,50] in-depth reviews of methods and models for predicting coke quality in terms of CRI and CSR, as well as Micum indices, have been analyzed and discussed. The authors concluded that there is a limited range of applicability of the models beyond the specific coal range for which each model was obtained.
The literature analysis shows a lack of studies that consider the relationship between the petrographic properties of currently used multi-component industrial blends and the properties of cokes obtained under industrial conditions. This paper aims to establish these relationships, which allow determining the features of using petrographic indicators of coal blends to assess the quality of industrial cokes. Under frequently changing the blend composition and using multi-component coal blends, the relationship between petrographic parameters and coke quality is of great practical significance for optimizing the blend composition and coking conditions. Additionally, this paper addresses the efficient use of coals and the composition of coal blends under industrial conditions, contributing to sustainable cokemaking. The relationships obtained are of practical value for cokemaking plants that use multi-component coal blends and frequently change the blend composition. This leads to changes in the petrographic composition, caking properties, and parameters of the proximate analysis of the blends and is also of great importance under conditions of an unstable final temperature of coking.

2. Materials and Methods

2.1. Preparation of Coal Blends

Preparation and coking of coal blends were carried out at the coke production of Dnipro Metallurgical Plant (Ukraine). For the study, 17 kinds of coal (A to Q) concentrates were used to prepare 9 kinds of blends. Each coal blend consisted of 6 to 8 different coals, corresponding to those currently used at the plant. The composition of the coal blend depended on the availability of coal at the plant and the expected quality requirements for the resulting coke. It should be noted that the properties of the same coal concentrates from one supplier may vary since the coals arrived at different times. Proximate analysis of coals and cokes hereinafter was carried out according to ISO 7404-2:2009 [51].

2.2. Petrographic Analysis of Coking Coals

Preparation of coal samples, coal maceral composition determination, and reflectance of vitrinite determination were carried out based on ISO 7404-2:2009, ISO 7404-3:2009, and ISO 7404-5:2009, respectively, [52,53,54]. Mean reflectance was measured on vitrinite or altered vitrinite using Lucia petrographic complex. The LECO PR-32 automatic press (LECO Instruments, St. Joseph, MO, USA), the LECO GPX- 300 grinding machine (LECO Instruments, St. Joseph, MO, USA), and a polishing machine were used to prepare samples for observation. Reflectance was measured on a polished sample surface under oil immersion with Refractive Index 1.515 using an Olympus microscope (Olimpus Corporation, Tokyo, Japan) at a magnification of 50×, and analyzed by Lucia Vitrinite 7.13 software. Measurements of the reflectance of vitrinite were performed at a mean of 200 points for each sample. Maceral analysis was based on the measurements of at least 500 points.

2.3. Maximum Thickness of the Plastic Layer of Coals

The parameter of maximum thickness of the coal plastic layer is the maximum value measured by the thickness of the layer with a special plastometric needle according to ISO/DTS 4699 [14]. First, 100 ± 1 g of coal with a particle size of less than 1.6 mm was heated at a 3 °C/min heating rate within the range from 250 to 730 °C. Meanwhile, the maximum thickness of the plastic layer (y, mm) was determined. Coal was under load and heated from the bottom at a metal glass placed above a silicon carbide heater. The weight and location of the load were calculated so that the pressure on the coal load could be fixed as 9.1 MPa. At different distances from the heating surface in testing, the coal reached varying stages of thermal destruction. During heating, a layer of coke and semi-coke, a layer of plastic coal mass can be formed in the glass simultaneously, and above the plastic layer, there is coal that has not yet turned into a plastic state.
Maximum thickness of the plastic layer, proximate and petrographic analyzes for coal blends are calculated using the additivity, i.e., through weighted averages of individual parent coals (Equation (1)), [55].
P = i = 1 n P i · d i ,
where Pi is the value of the i-th component within the blend, wt.%; di is the proportion of the i-th component within the blend.

2.4. Coking Conditions

Coking of coal blends was carried out in a coke oven at the cokemaking production of the metallurgical plant Dnipro Metallurgical Plant. The coke oven batteries are equipped with a PVR system which has twin vertical flues with recirculation of waste gases. The characteristics of the coke oven battery are shown in Table 1. The coking time was 18 h. Coke ovens are heated with coke oven gas.
A pyrometer determined the final coking temperature from the coke side after the door was removed and was in the range of 1060 to 1085 °C. After coke discharge, it was quenched in a wet way. A sampling of coke to determine the quality is carried out after sorting into sizes. Metallurgical coke with a more than 40 mm particle size was selected for the study.

2.5. Characterization of Coke Samples

The determination of the CO2 reactivity index and CSR was carried out according to ISO 18894:2018 [56]. The ‘cold’ strength of coke was determined by different tumbler tests and characterized by correspondent indices. In this study, Micum indices M25 characterized the percentage of coke with particle size >25 mm after rotating 50 kg of coke 100 times, and M10 characterized the percentage of coke with particle size <10 mm after rotating 50 kg of coke 100 times in a drum 1 × 1 m for 4 min according to ISO 556:2020 [57].

3. Results and Discussion

3.1. Coking Coals and Coal Blends Properties

Table 2, Table 3, Table 4, Table 5, Table 6, Table 7, Table 8, Table 9 and Table 10 present the compositions of coal blends and the characteristics of coals and blends. Blends are presented in rising order of Rom from 0.94 to 1.11 wt.%. The volatile matters of the components of coal blends vary between 17.4 and 37.6 wt.%. In turn, the values of the volatiles decrease from blend 1 to blend 9 and are in the range of 31.8–29.2 wt.%. Concerning the maceral contents of the coals, they display a moderate or high vitrinite content from 58.00 to 93.00 wt.%, low to moderate liptinite content from 0.2 to 5.4 wt.%, and a low or moderate amount of inertinite macerals from 7.0 to 41.0 wt.%. The maximum thickness of the plastic layer for coals ranges from 8.5 to 29.0 mm, and for blends from 14.5 to 16.3 mm.
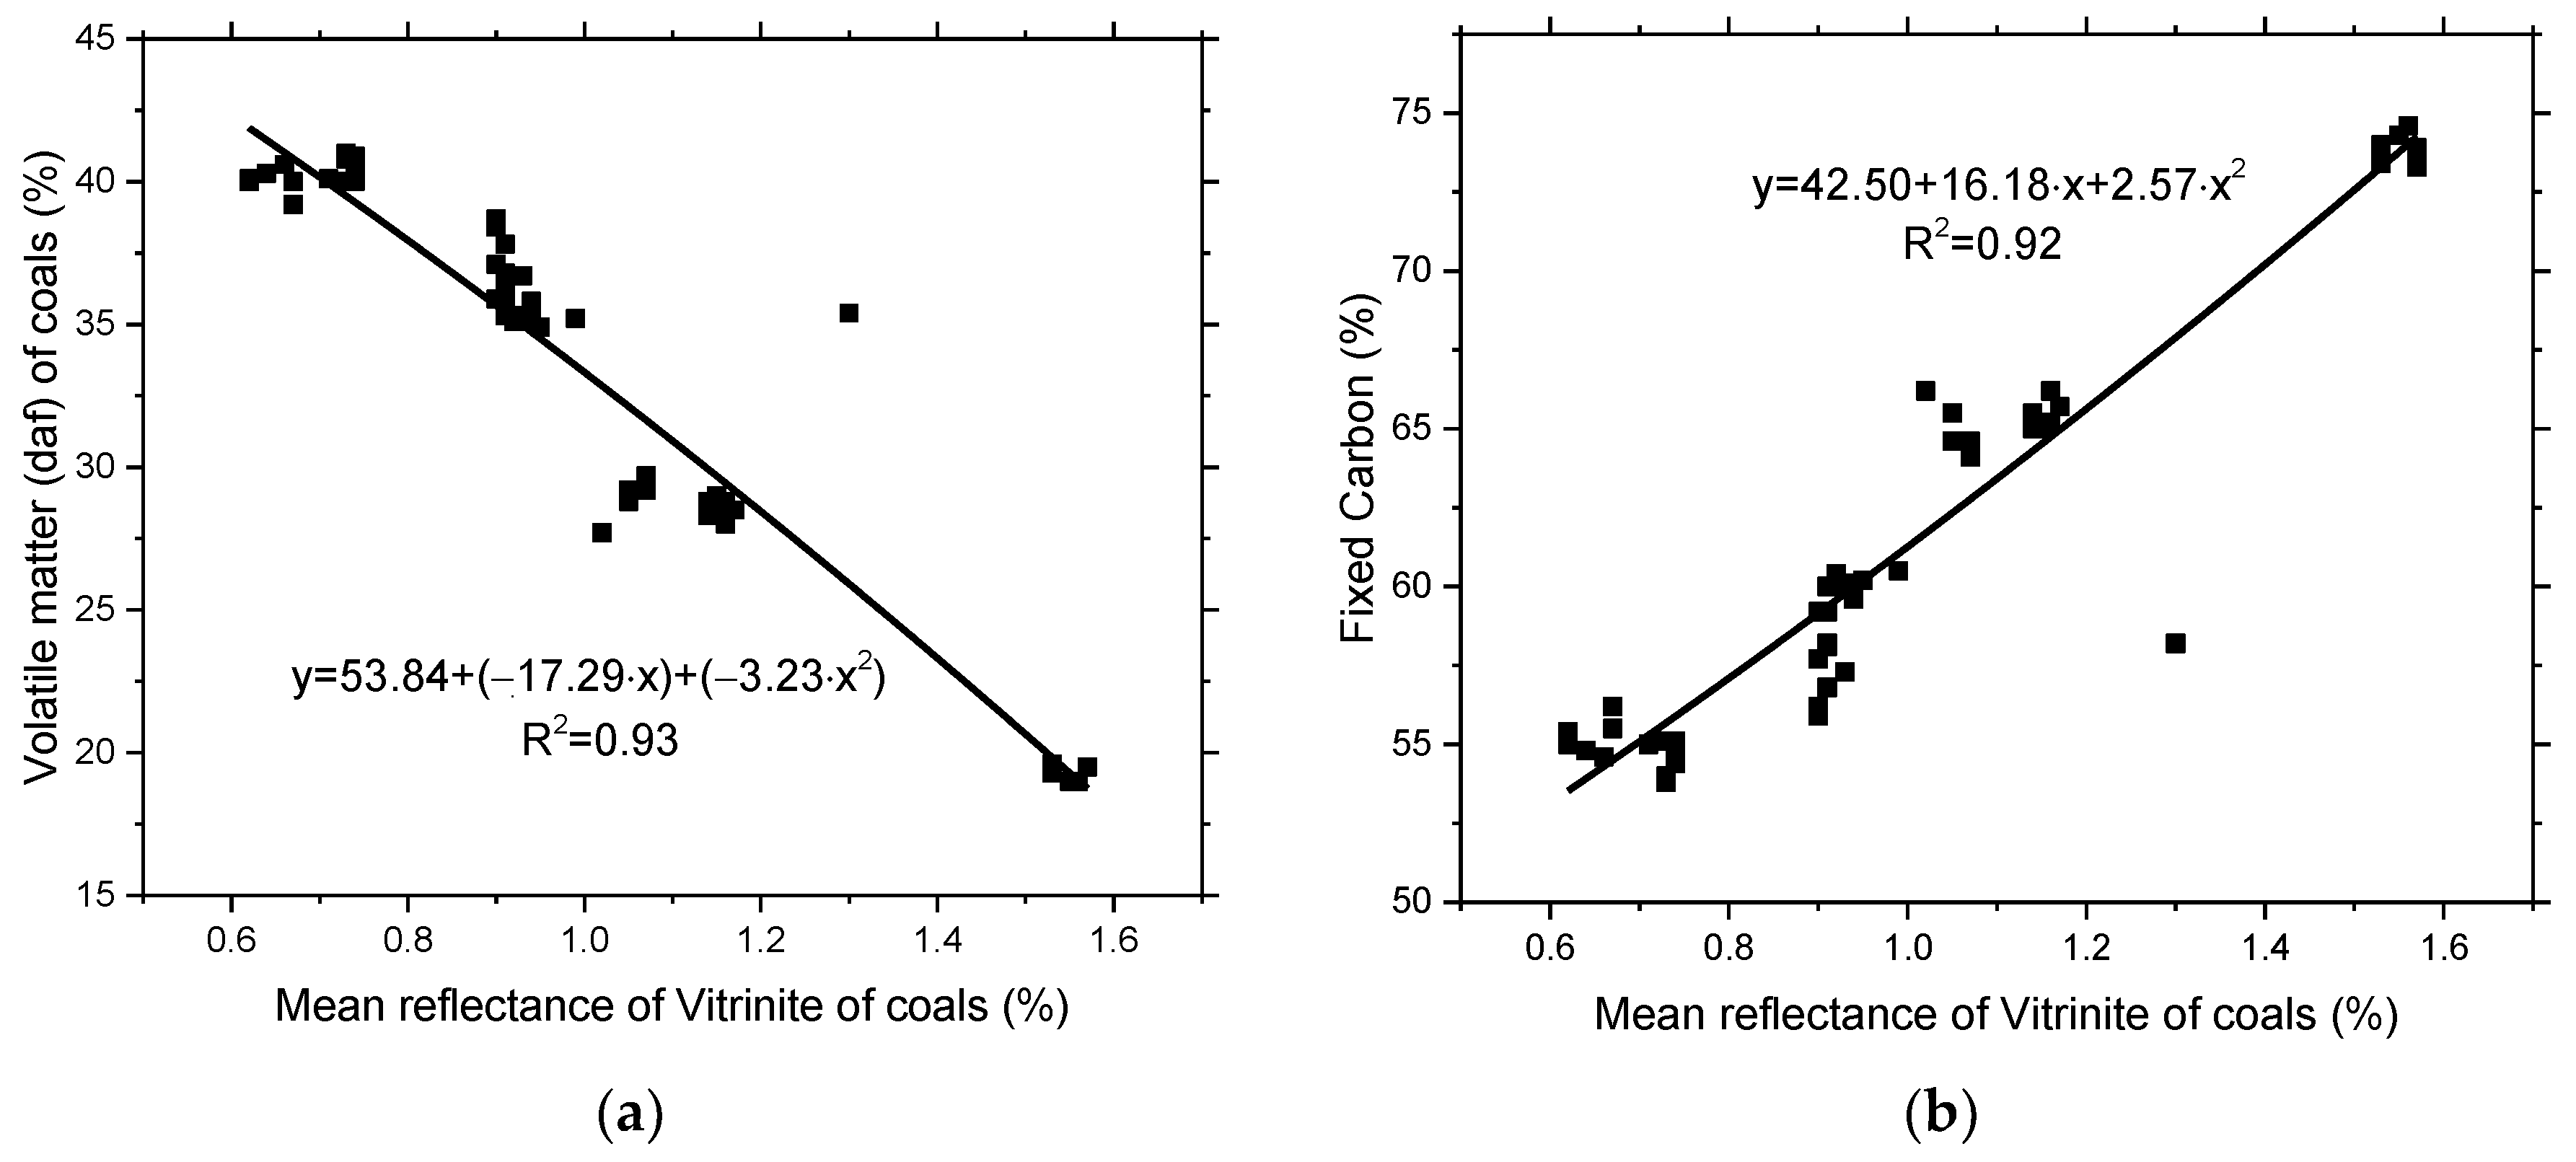
Figure 1a shows the dependence between the Rom and VM of all coals used for coal blend preparation from which it follows that the values of VM decrease with increasing values of Rom. At the same time, the values of FC increase with increasing values of Rom, as follows from Figure 1b. As the Rom increase of the coals, the VM decreases significantly (R2 = 0.93), and the FC content increases significantly (R2 = 0.92), consistent with the general law of the coalification [58].
Figure 1a,b show a clear separation of the coals that are used to compose the coal blends into four groups, which correspond to gas coals (Rom = 0.50–0.89%) fat coals (Rom = 0.80–1.19%), coking coals (Rom = 1.0–1.29%) and lean coals (Rom = 1.30–1.80%).
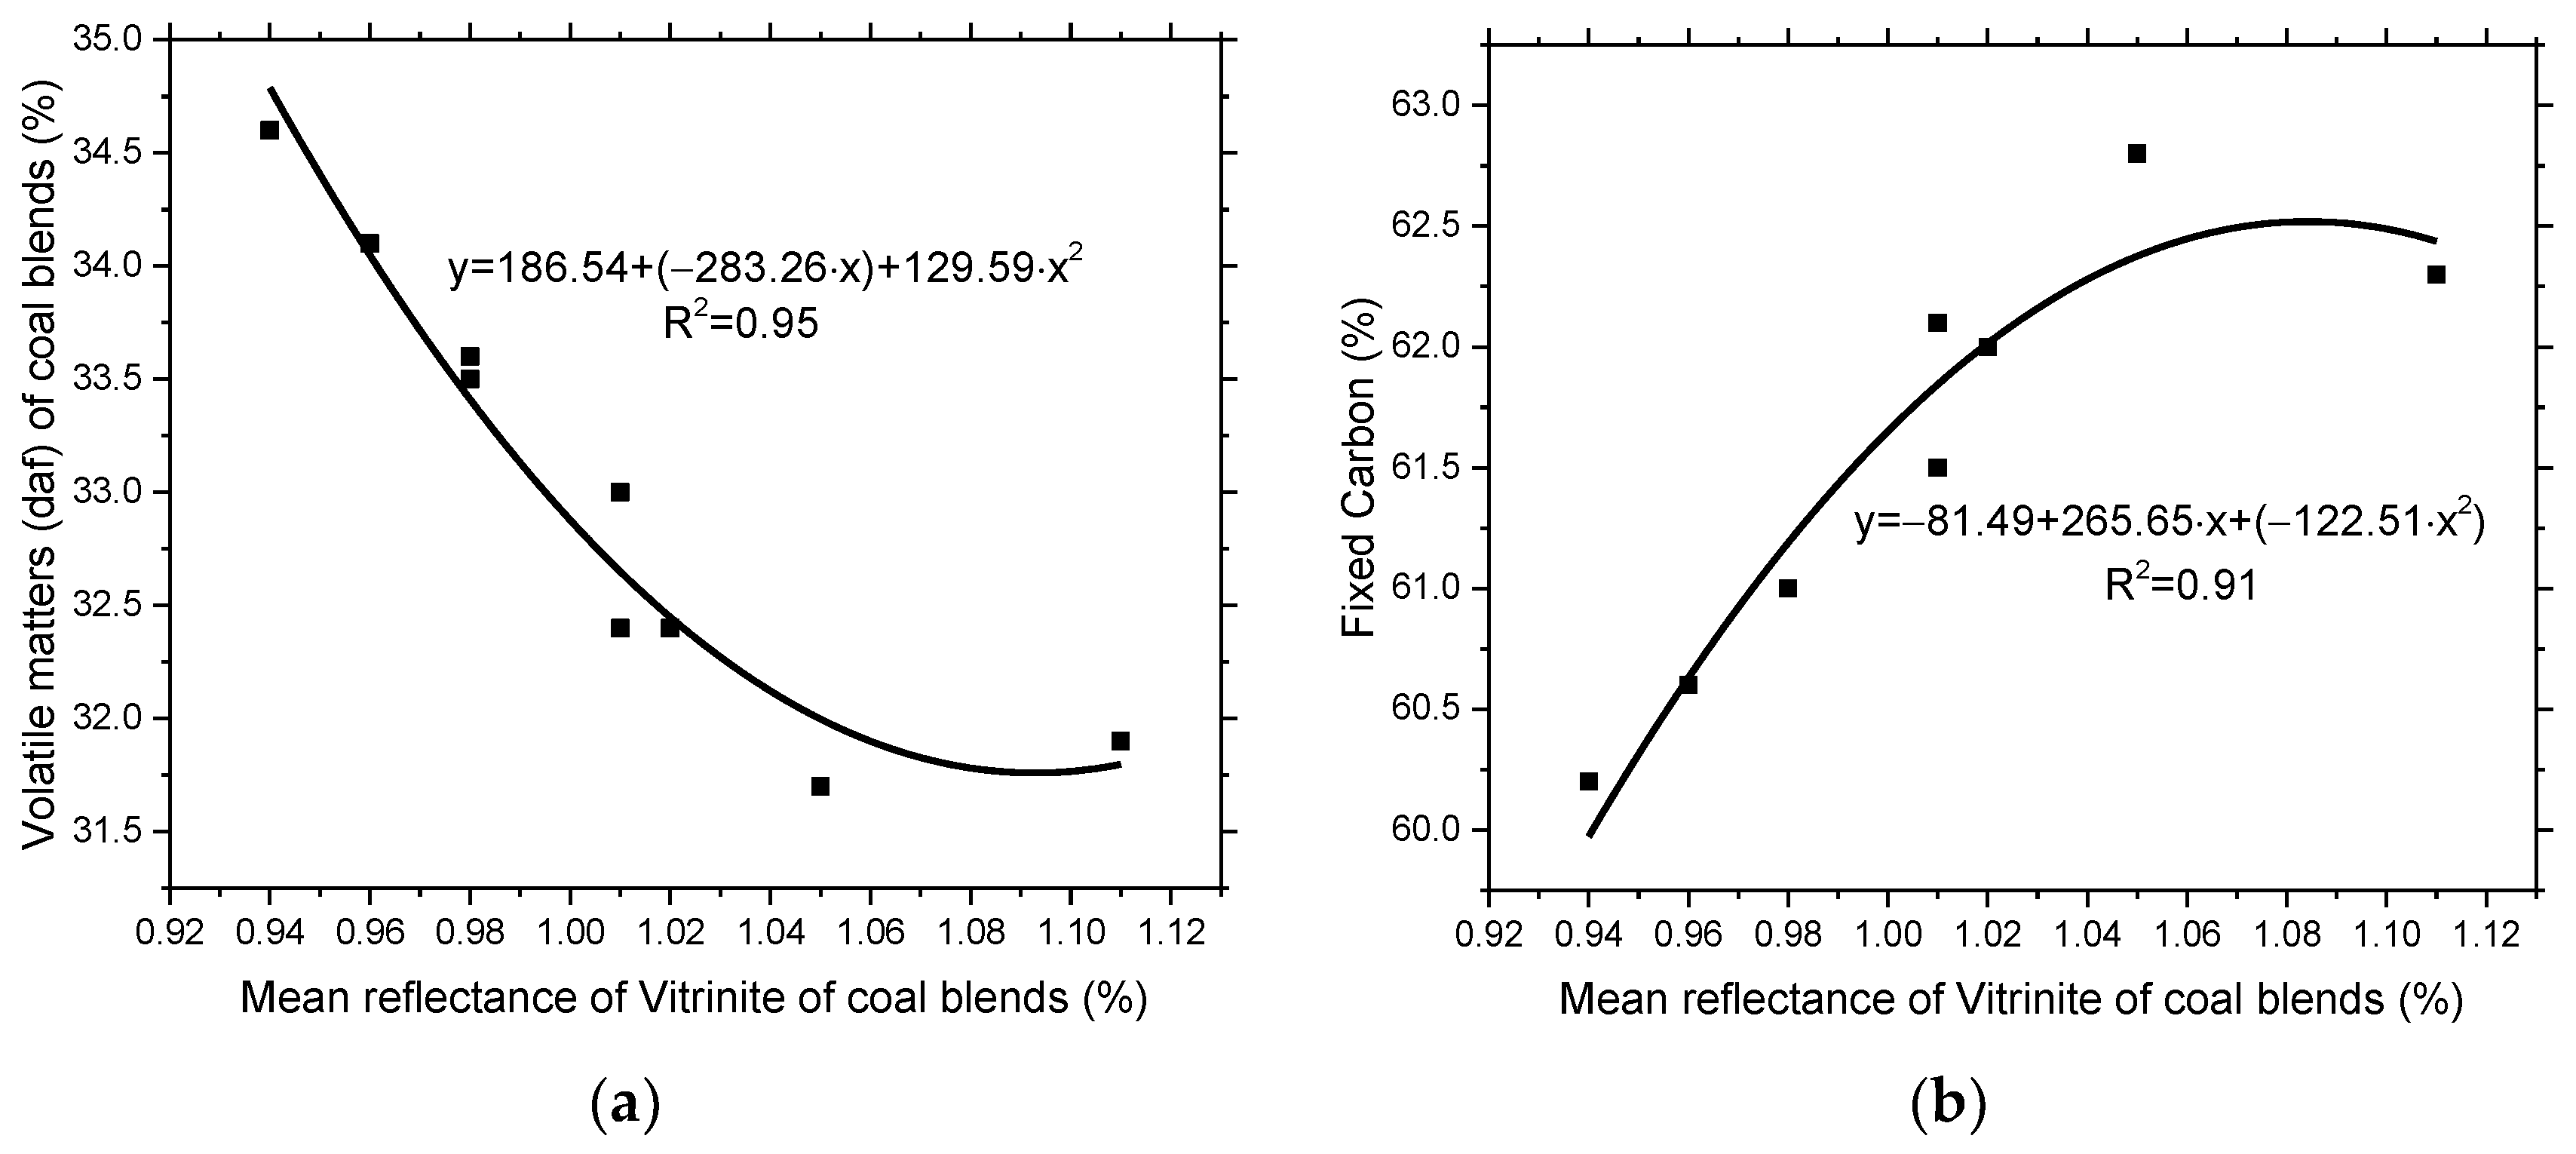
Figure 2a shows the relationship between the parameters of Rom and the VM of coal blends. The VM yield is found to have declined with the increase in the Rom of coal blends. This is a strong relationship that reflects the rank of the coals [29,30]. According to Sahoo et al. [30] the R2 for correlation between mean vitrinite reflectance and the volatile matter is 0.89. However, it should be noted that the yield of VM is of technological value, as it determines the amount of gaseous products released during coals heating. Figure 2b shows the relationship between Rom and FC of coal blends. With an increase in the Rom, the values of FC also increase due to a decrease in the yield of VM and the influence of ash yield, which was within a narrow range of 8.0–8.5% for the studied blends. A similar negative relationship between the Rom and VM and a positive relationship between the Rom and FC were observed in a previous study [58], however, the correlation coefficients are higher in our study.
It should be noted that the relationship between Rom and VM for blends is more pronounced, which can be explained by the fact that the composition of the coal blends was purposely chosen. In contrast, the dependence of coals can only characterize the actual properties without mixing to produce blends.
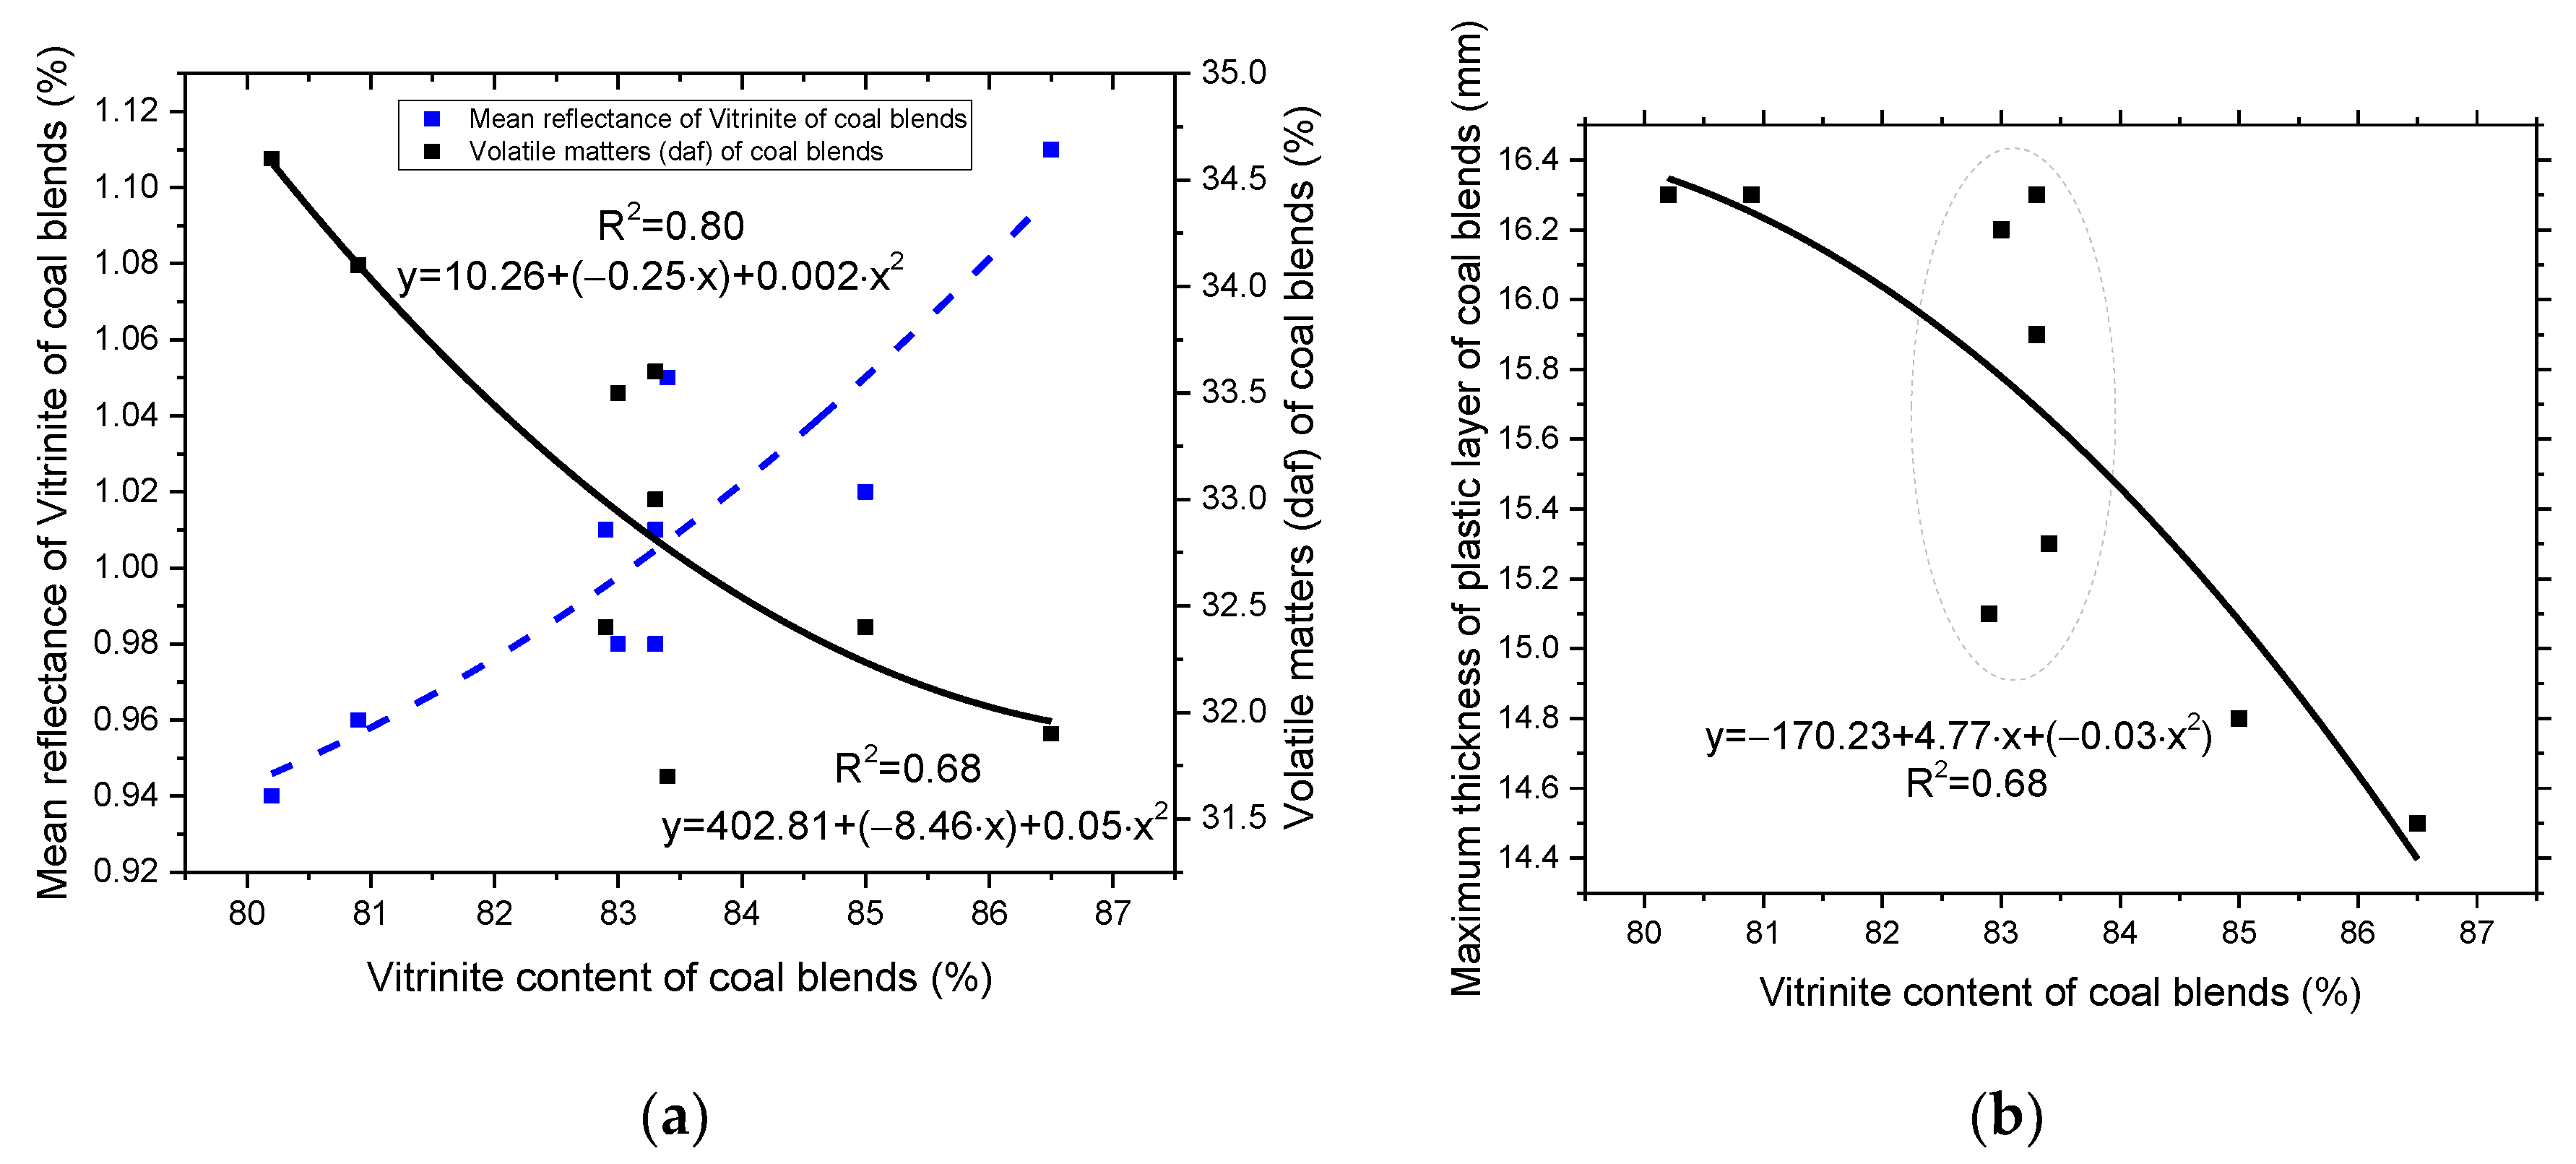
Figure 3a shows the relationship between vitrinite content and VM and the Rom. As the content of vitrinite increases, the yield of VM tends to decrease, as was also shown in previous studies [31,59,60], while the Rom increases. For the studied blends, the maximum thickness of the plastic layer of the coal blends tends to decrease with increasing vitrinite content, as shown in Figure 3b. The sum of caking microcomponents determines the plastic properties of coals. Usually, the maximum formation of the plastic layer corresponds to coals with VM of 30–35 wt.%, as follows from Table 2, Table 3, Table 4, Table 5, Table 6, Table 7, Table 8, Table 9 and Table 10. According to the requirements for industrial coal blends, the maximum thickness of the plastic layer should be within the range of 14–16 mm, ensuring good blend caking in the plastic state [55]. It is worth noting that the vitrinite values for the blends were in the range limited to 80.2–86.5 wt.%, and the main values for five blends were in a narrow range of 82.9–83.4 wt.% as shown in Figure 3b, which determined the behavior of the obtained curve.
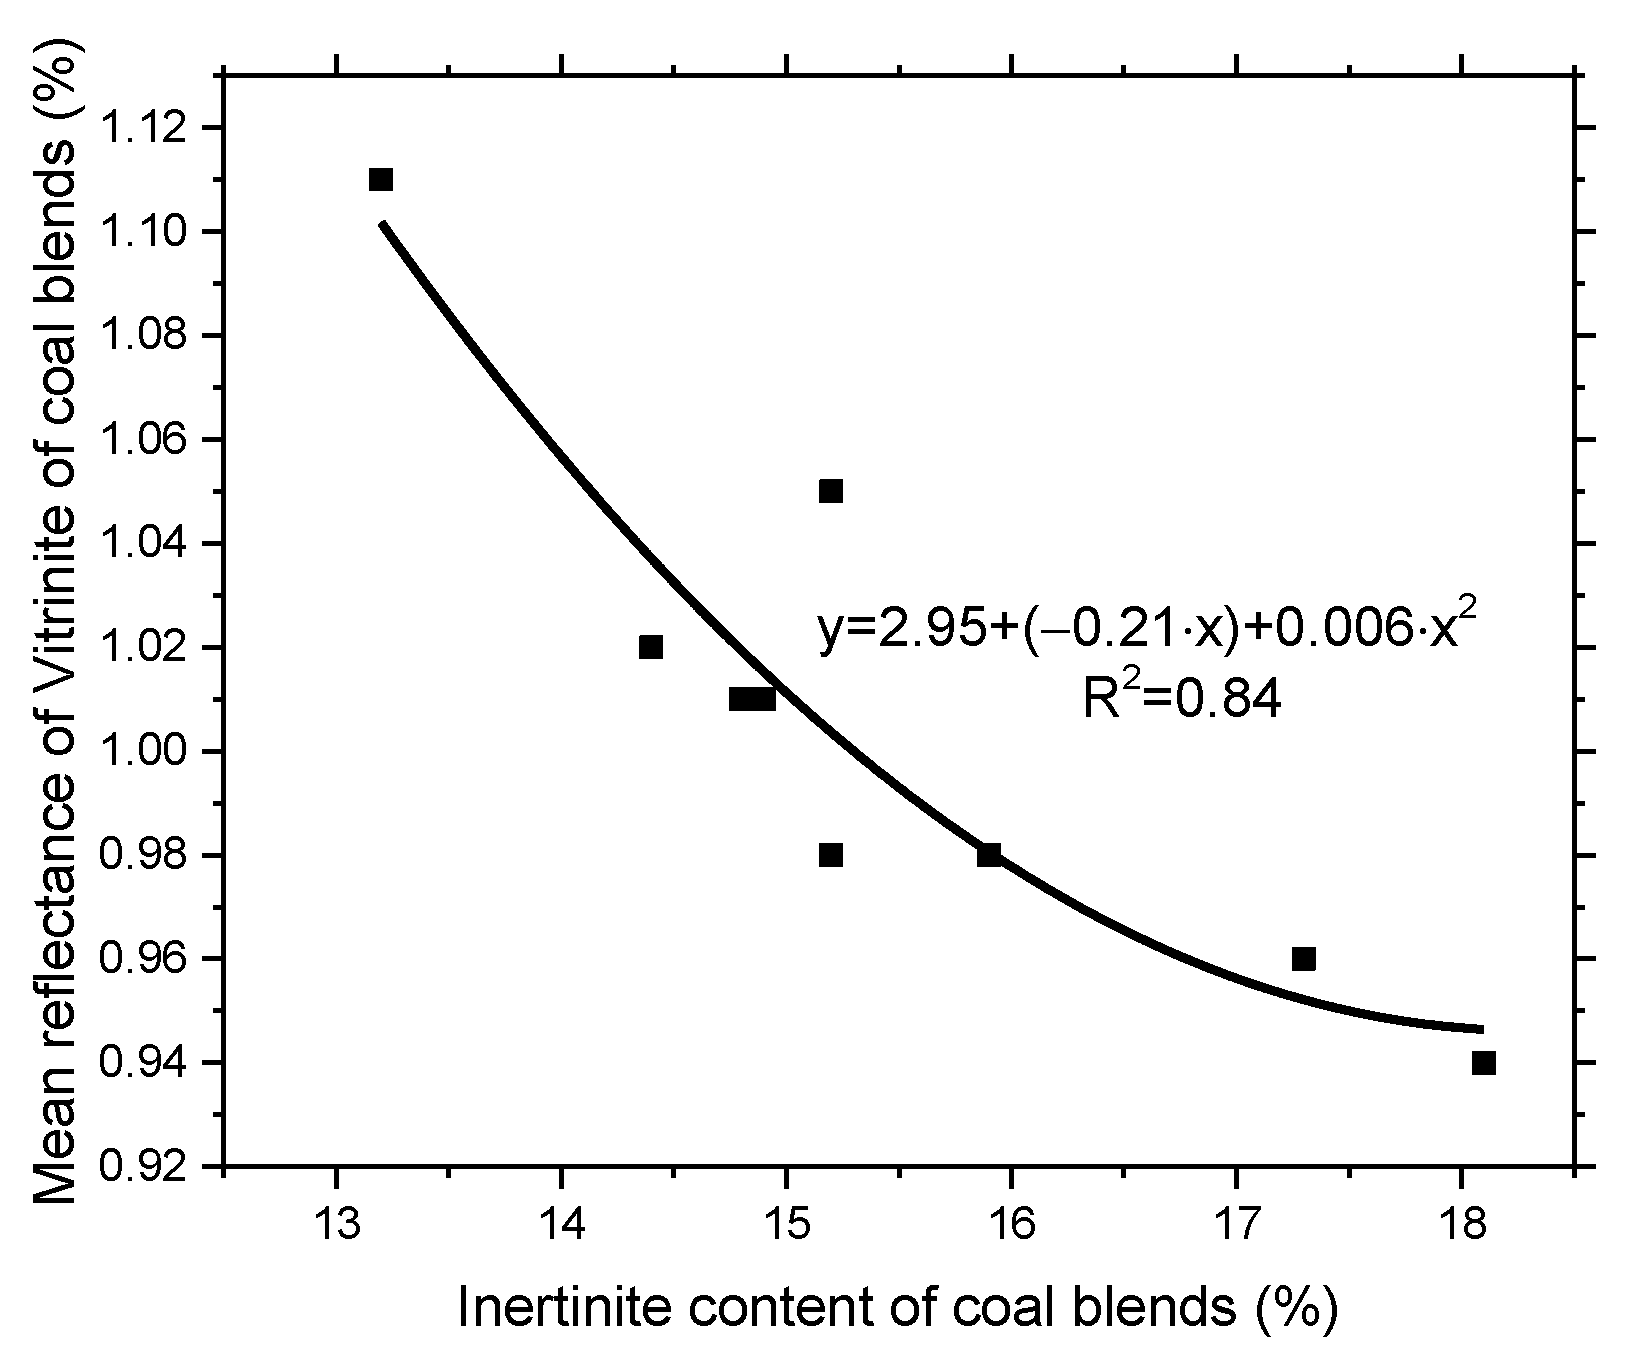
Figure 4 shows a negative correlation between parameters of inertinite content and the Rom for coal blends. With an increase in the amount of inertinite content in coals, the vitrinite content decreases, leading to a decrease in the Rom for blends. Additionally, no relationship was observed between the content of inertinite and the VM.

3.2. Metallurgical Coke Properties

Table 11 presents the characteristics of proximate analysis, physicochemical and physicomechanical properties of cokes, as well as the final temperatures of its production. According to the proximate analysis results, the ash yields of cokes are 10.6–11.1 wt.%. Changes in the yield of VM indicate the level of carbonization of the obtained coke and decrease with an increase in the final coking temperature. The low sulfur content in the coke is due to the low sulfur content in the blends. The CRI values of cokes decrease from coke 1 to coke 9 and are in the range of 32.9–30.3 wt.%, while the CRS values increase and are between 53.6–58.4 wt.%. Additionally, Table 11 shows the results of the tumble and abrasion strengths, M25 and M10, respectively. It can be seen that the M25 and M10 values of cokes are quite stable within the ranges from 87.3 wt.% to 88.8 wt.% and from 7.2 wt.% to 7.8 wt.%, respectively.
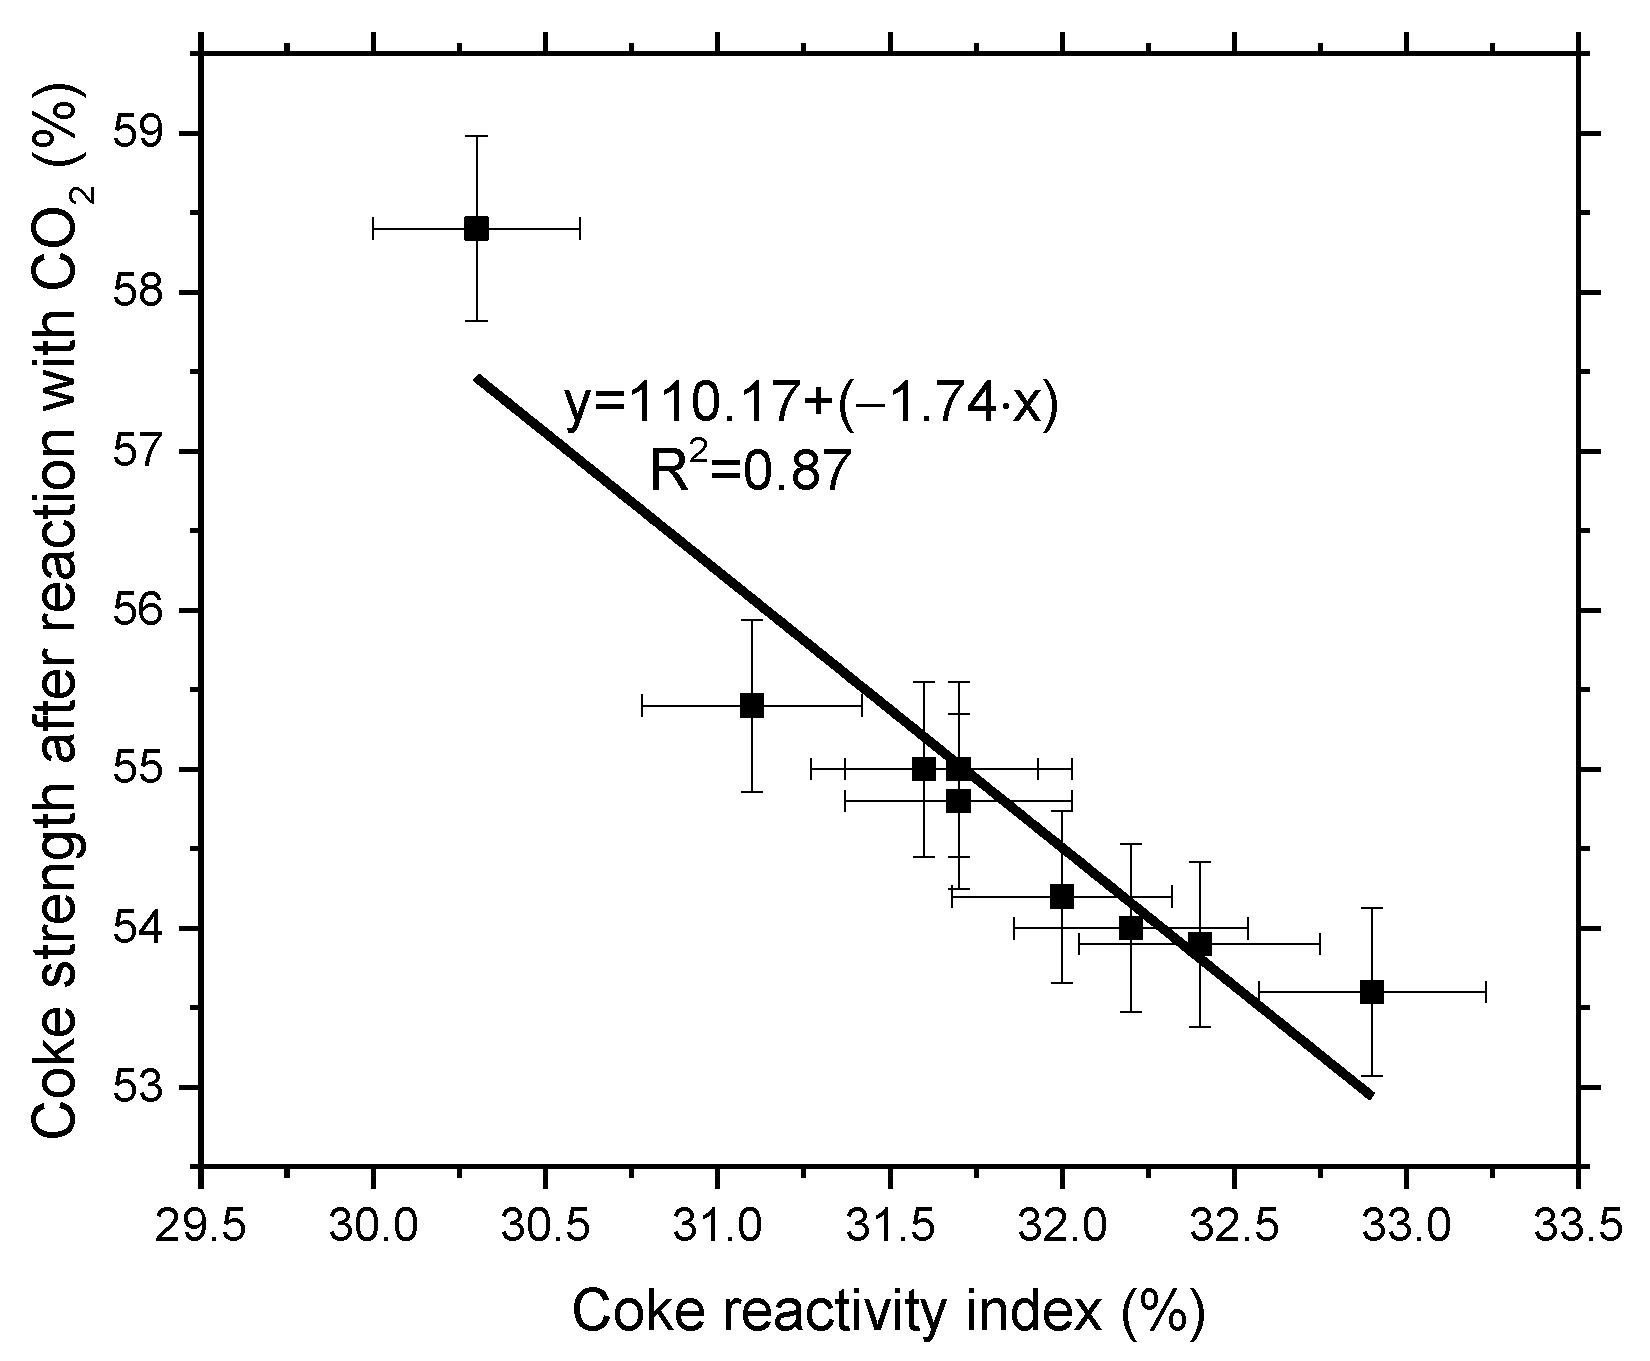
It is well known that the CSR parameter negatively correlates with the CRI parameter, and this relationship can be vice versa [61,62,63]. Figure 5 shows that with a decrease in the CRI of coke, the CSR increases. Coke 9 presents the lowest CRI and highest CSR, representing a good metallurgical property. According to [64] the R2 is 0.894 for the relationship between CRI and CSR. The resulting coefficient is slightly lower than indicated by [64] and below the R2 = 0.977 value indicated in [46,61].
In addition, using equations that describe the relationship between CRI and CSR, for example, CRI = 52.547–0.397·CSR in paper [65], and CSR = −1.6884·CRI + 102.38 [66], to assess the quality of the obtained coke leads to an underestimation of the values of the parameters in comparison with those obtained in this study. Therefore, the original equation is characterized by better accuracy.
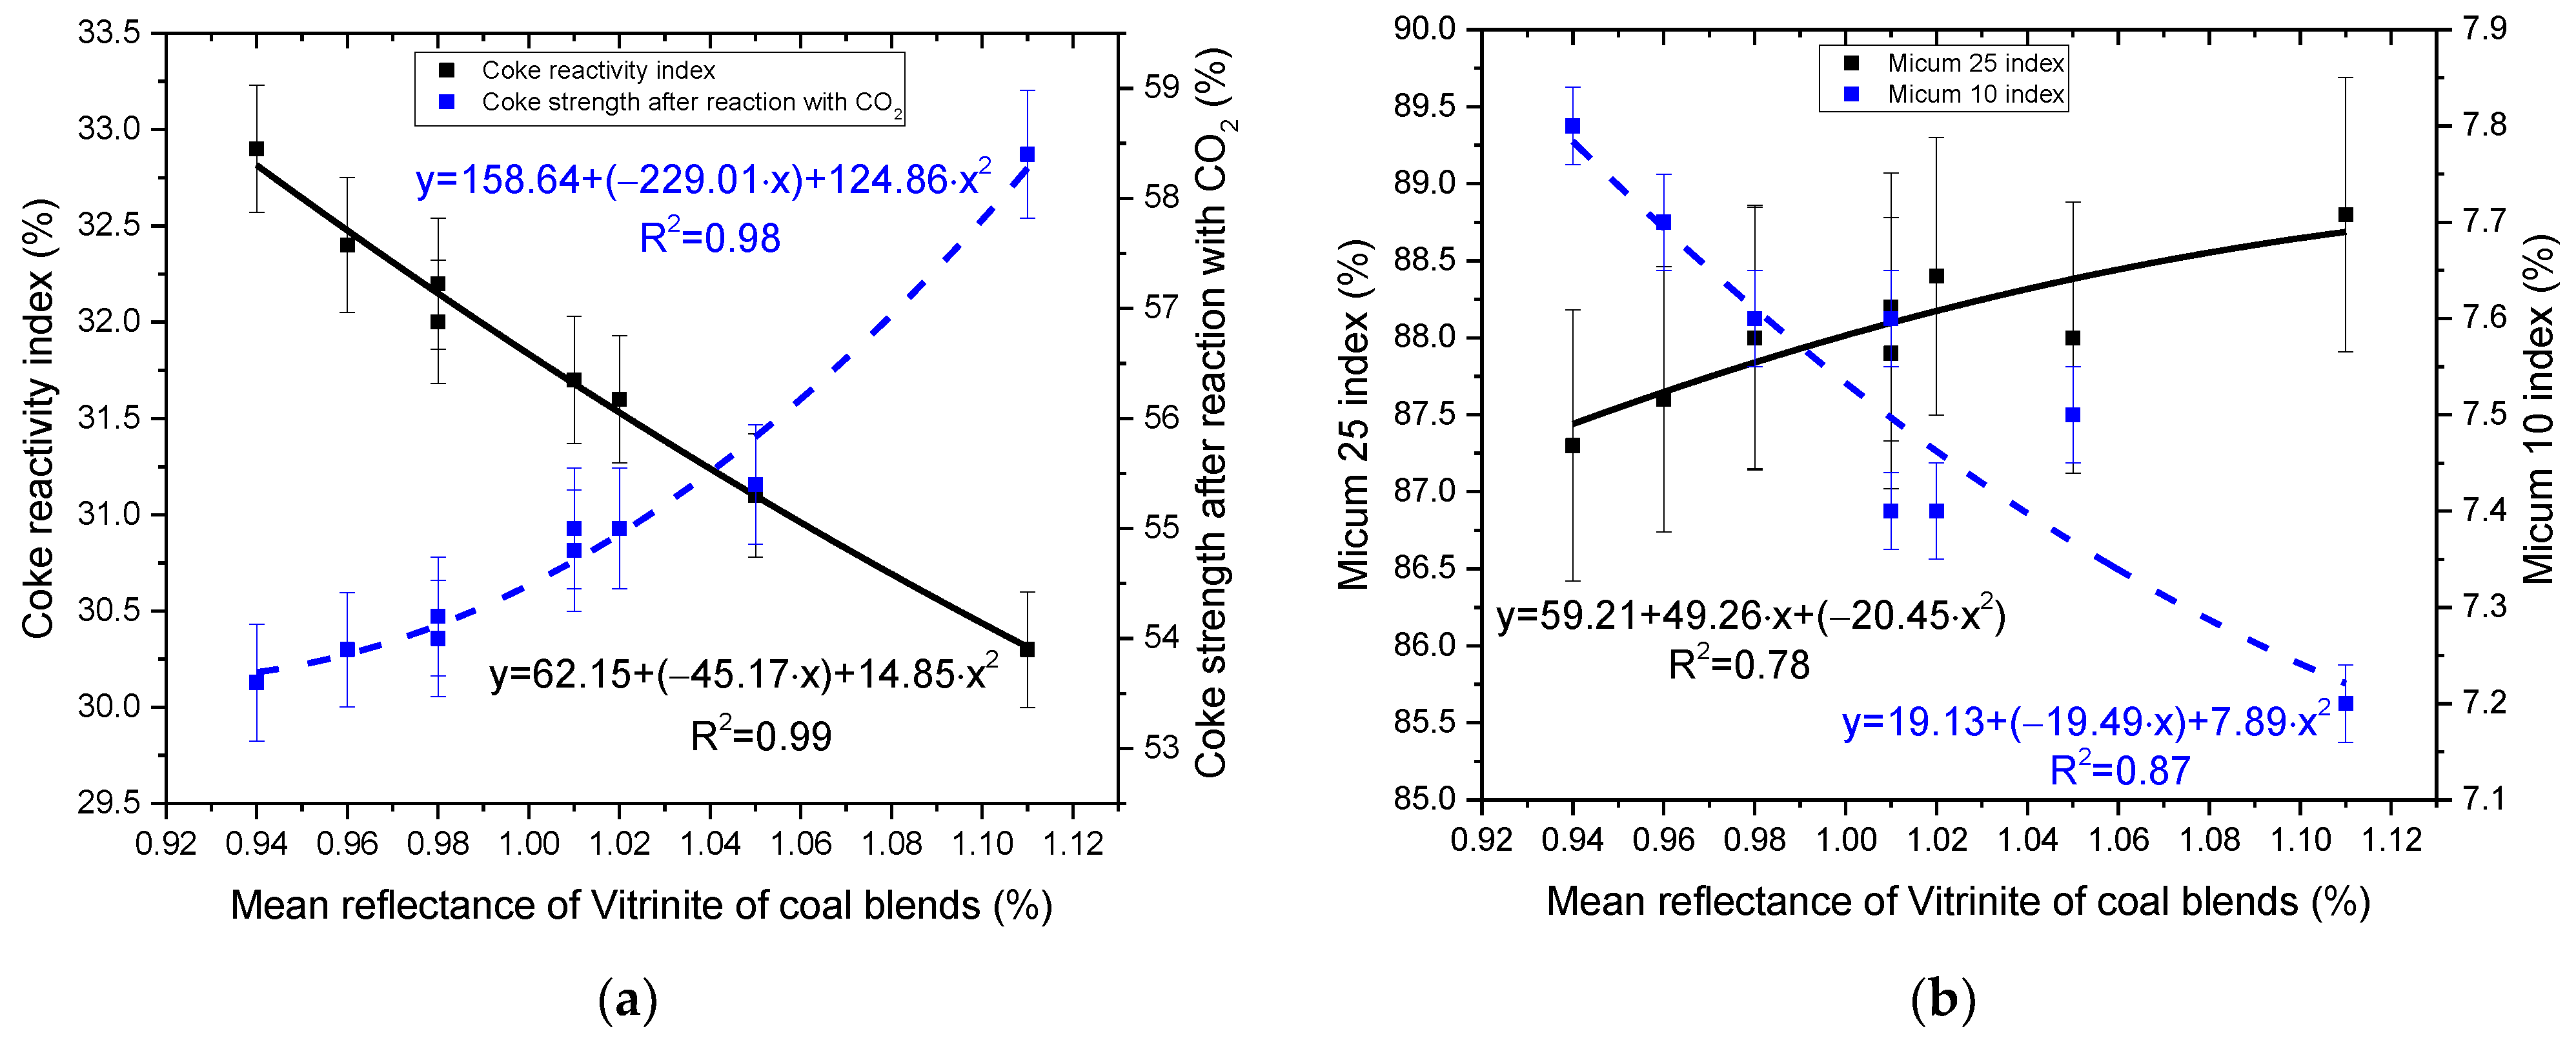
Figure 6a,b show the dependencies of the Rom on CRI and CSR and on Micum 25 and Micum 10 indices, respectively. It has been established that the coke quality indicators improve with an increase in the Rom. It should be noted that the reflectance of vitrinite for coal blend 9 corresponds to a value of 1.11 wt.%. According to Zhang et al. [67], a high CSR value of coke can be obtained from coal with a reflectance of vitrinite of 1.1–1.2 wt.% and/or from coals with VM of 22–26 wt.%. The relationship between the parameters of Rom and the parameters of CRI (R2 = 0.99) or CSR (R2 = 0.98) is stronger than that for M25 (R2 = 0.78) and M10 (R2 = 0.87). The higher the coefficient of determination (R2), the better the relationship. This is because the Rom depicts the microstructure and level of coalification, which ultimately affects the CRI and CSR parameters [67,68].
Therefore, compared with the ‘cold’ strength, the physicochemical indicators of coke quality, namely CRI and CSR, better reveal the coke’s relationship with the coals’ nature. This is because the parameters CRI and CSR better characterize the structural changes in the obtained cokes due to a chemical reaction with CO2 and subsequent determination of the mechanical strength, in contrast to the method of determining the ‘cold’ strength. Therefore, reflectance parameters describe the average degree of order of the molecular structure of organic matter and are a useful tool for the characterization of such heterogeneous carbon materials as raw or pyrolyzed. According to the Nippon Steel Corporation (NSC) model, it should also be pointed out, showing the dependence of the CSR index and the reflectance of vitrinite and inertinite [69,70]. The CSR increases with increasing Rom up to a value of about 1.4 wt.%, and at any level of Rom, coals with an inertinite content of 15–25 wt.% allow obtaining optimal CSR values. The paper [63] also reported that the maximum CSR value for each rank level of coals is obtained with optimum inertinite content. However, Kosina and Heppner [71] found that bituminous coals with the reflectance of vitrinite within the range of 0.80–0.90% and high inertinite content had no significant influence on coke mechanical properties expressed by Micum indices. In contrast, a distinct decrease in M40 values with increasing inertinite contents was observed for higher rank coals.
Figure 7a shows the relationship between the inertinite content of coal blends and CRI or CSR. As shown in Figure 7a, with an increase in inertinite content in the coal blend, the CRI values increase. It is worth noting that in paper [71] also with an increase in inertinite, the CRI increases, but the correlation coefficient is 0.696. The CSR index has the opposite effect, which is consistent with the results in [69]. Thus, for the investigated blends, it was found that the coke quality deteriorates with increased inertinite content by more than 14%.
Figure 7b shows the relationship between the parameters of inertinite content in coal blends and indicators M25 or M10. An increase in inertinite content negatively correlates with the M25 indicator and, contrariwise, shows a positive relationship with the M10 indicator. In addition, relationships (R2 = 0.91 for M25 and 0.90 for M10) indicate that the inertinite content of coal blends significantly influences ‘cold’ mechanical strength than on the CRI and CSR. However, many of the obtained M25 values are within the standard deviation range of 0.85–0.90. Thus, a low proportion of reactive macerals inhibits the agglomeration of coal particles, creating a less stable coke structure, according to Pearson [72].
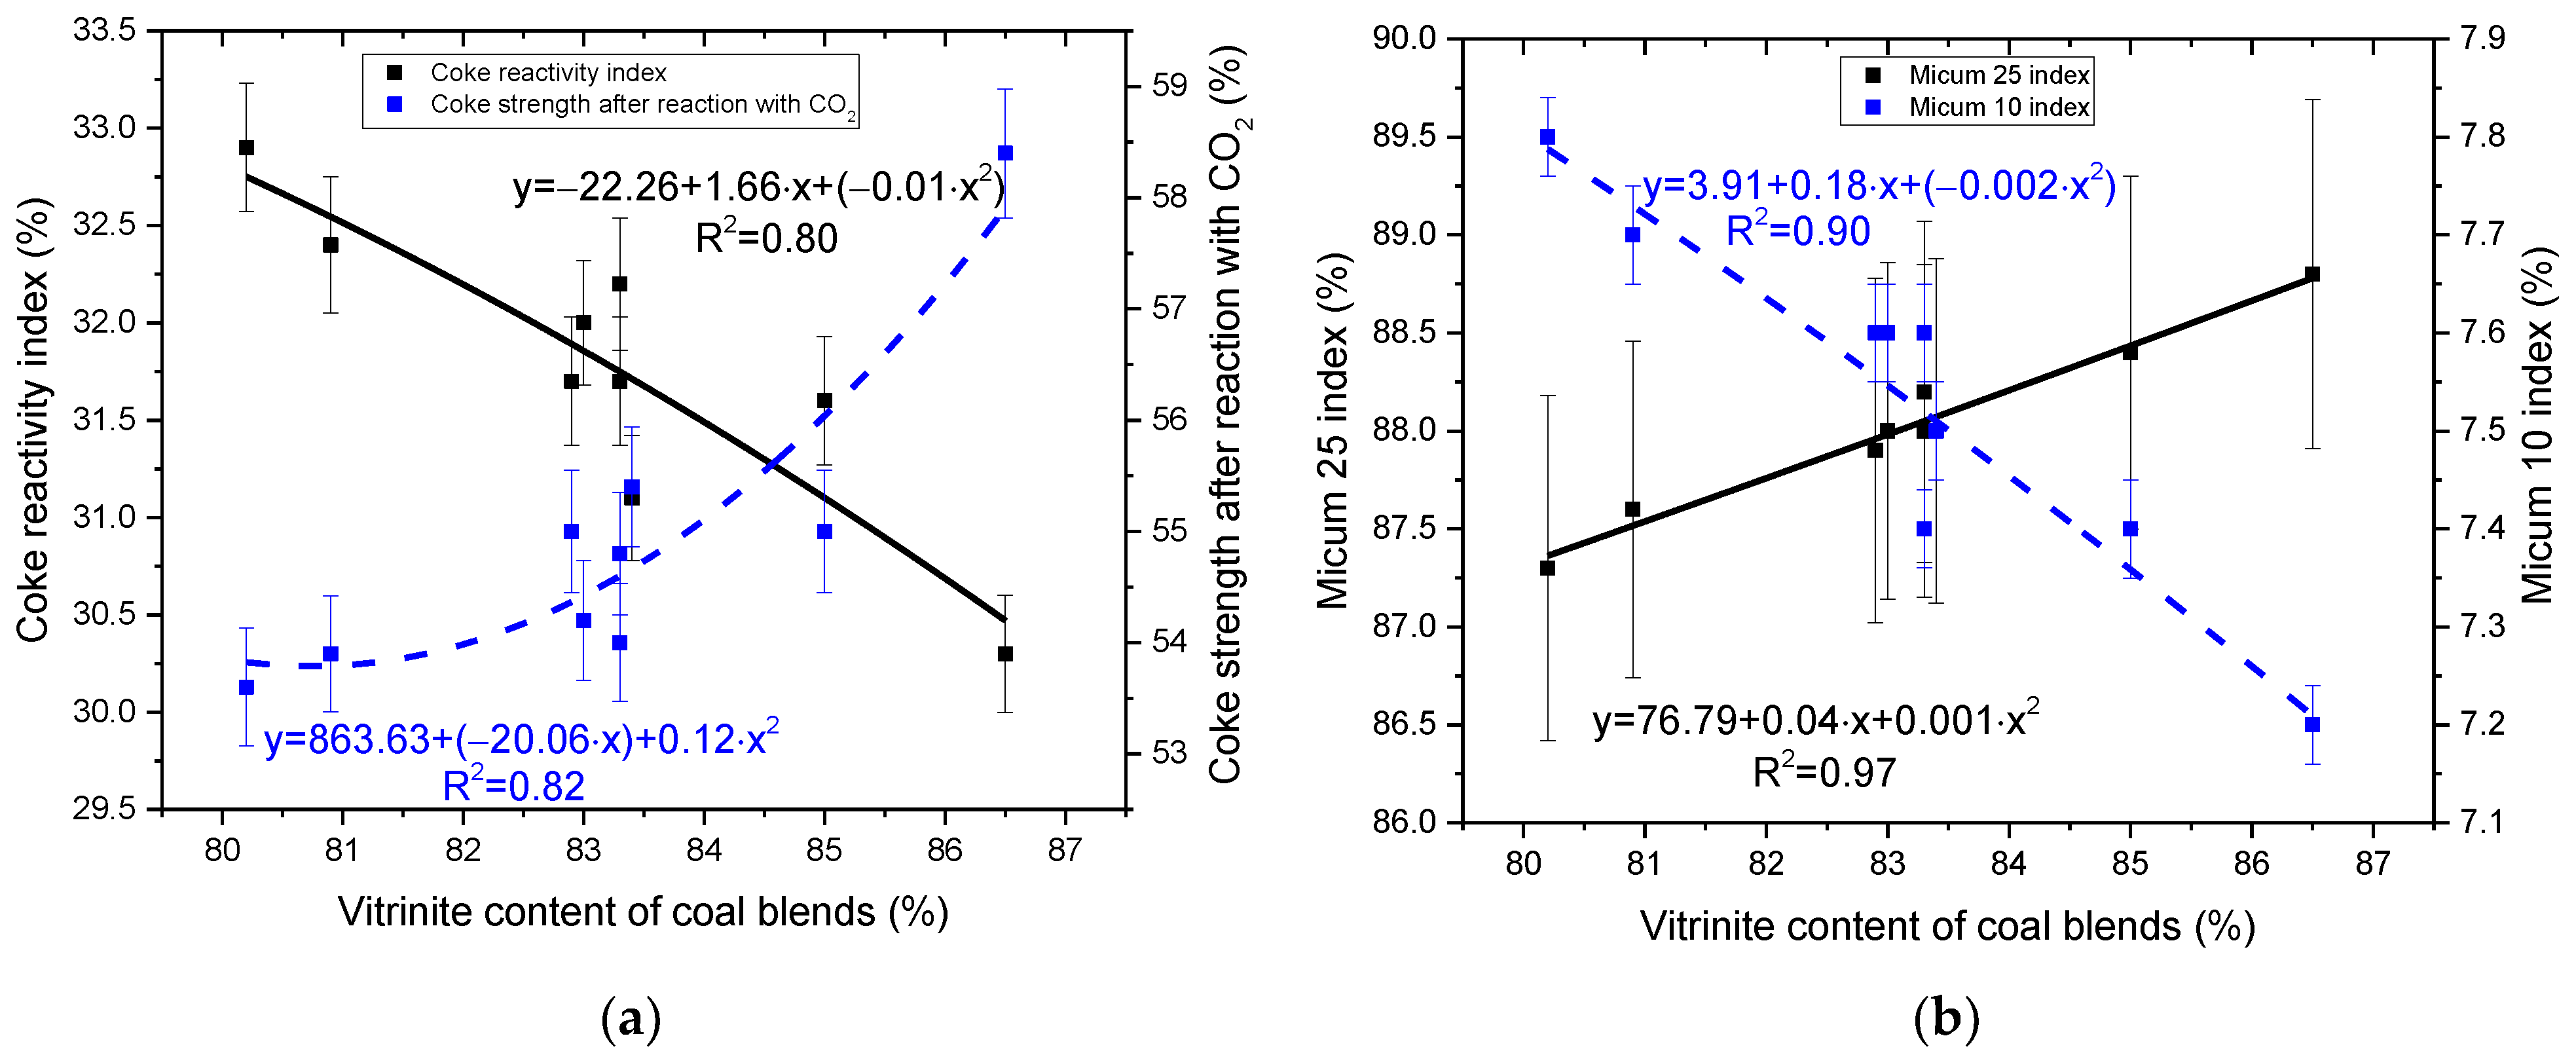
Since vitrinite is the main active component in coal, which contributes to forming a non-volatile liquid mass during coking, the influence of vitrinite content in coal blends on coke quality indicators was investigated. It is well-known that non-volatile liquid masses obtained from coking coals of different grades are firstly fused and then interact with inert components to form a coke [40]. Figure 8a shows the relationship between the parameters of the vitrinite content in coal blends and CRI or CSR.
With an increase in the vitrinite content within the coal blend, the CRI of coke decreases (R2 is 0.80). This is consistent with paper [73], where R2 is 0.748. In turn, this has the opposite effect on CSR, which is also consistent with [73] where R2 is 0.659. However, the obtained dependences of the content of inertinite and vitrinite contents within blends with CRI are characterized by higher correlation coefficients than in paper [73]. The decrease in CRI and increase in vitrinite content can be explained by the fact that softened ones originate from vitrinites, fuse, and enter into interfacial reactions with each other in the process of carbonization of a plastic mass. The higher fusion of the plastic mass is beneficial for mixing, and the interfacial reactions of the plastic mass are relatively sufficient in the coking process. Thus, cokes obtained from coal blends with a higher vitrinite content may have fewer defects in carbon structures, which show higher resistance to CO2 [40]. Noteworthy, a strong dependence exists between the parameters of the vitrinite content in coal blends and the M25 or M10 indices, which corresponds to R2 = 0.97 and R2 = 0.90, respectively, as shown in Figure 8b, which confirms the pattern of obtaining coke with good strength with an increase in the proportion of vitrinite in the blend.
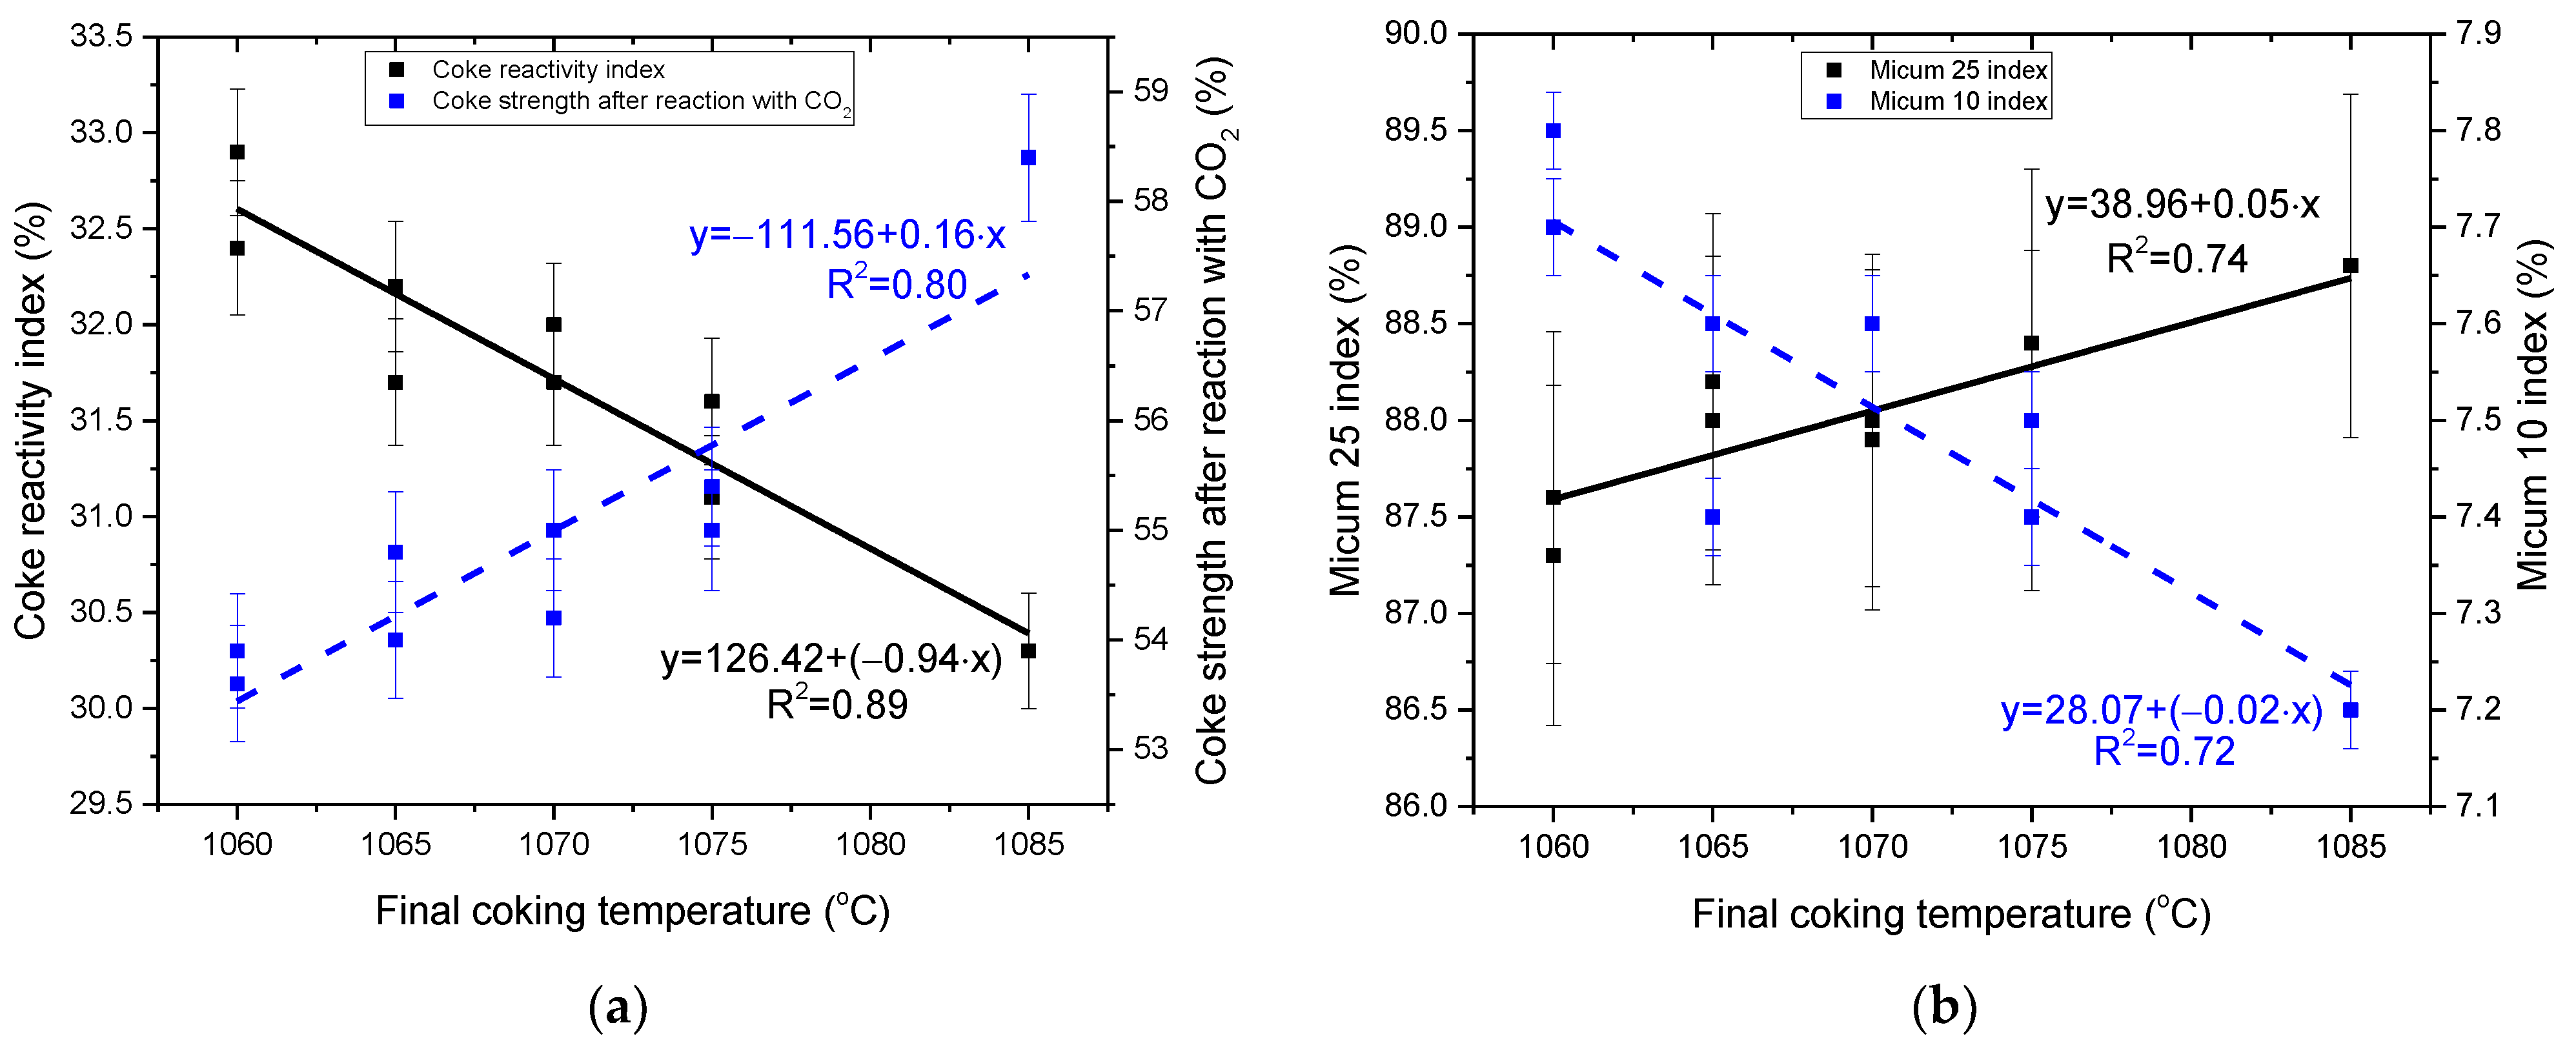
It is known that the final coking temperature affects the decline of CRI and the increase in CSR [2,74]. The final coking temperature is the maximum temperature of the coal pyrolysis process and can be considered a factor influencing the coke quality. A comparison of the results of determining the quality indicators of coke with the final temperature of coking shows a decrease in reactivity and an improvement in CSR with an increase in the final temperature of coking, as shown in Figure 9a. Less strict relationships were obtained between final coking temperature and Micum 25 or Micum 10 indices (Figure 9b). However, this also confirms that, in addition to the petrographic properties of the blend, the effect of the final coking temperature as a technological factor is important for further improving the coke quality.
Considering the strong relationship between CRI with final coking temperature and petrographic characteristics of coals, it was also determined which of these parameters has a greater impact on coke quality. Therefore, a two-component linear regression model was obtained, describing the dependence of CRI on final coking temperature (FCT) and inertinite content (IC), which includes the following Equation (2):
CRI = 96.7 + ( 0.06 ) · FCT + 0.16 · IC ,
The regression results showed a greater significance of final coking temperature on CRI. This conclusion can be of great practical importance, since the composition of coal blends takes into account, first of all, the properties of the coal macerals, while the coking temperature is assumed to be constant.
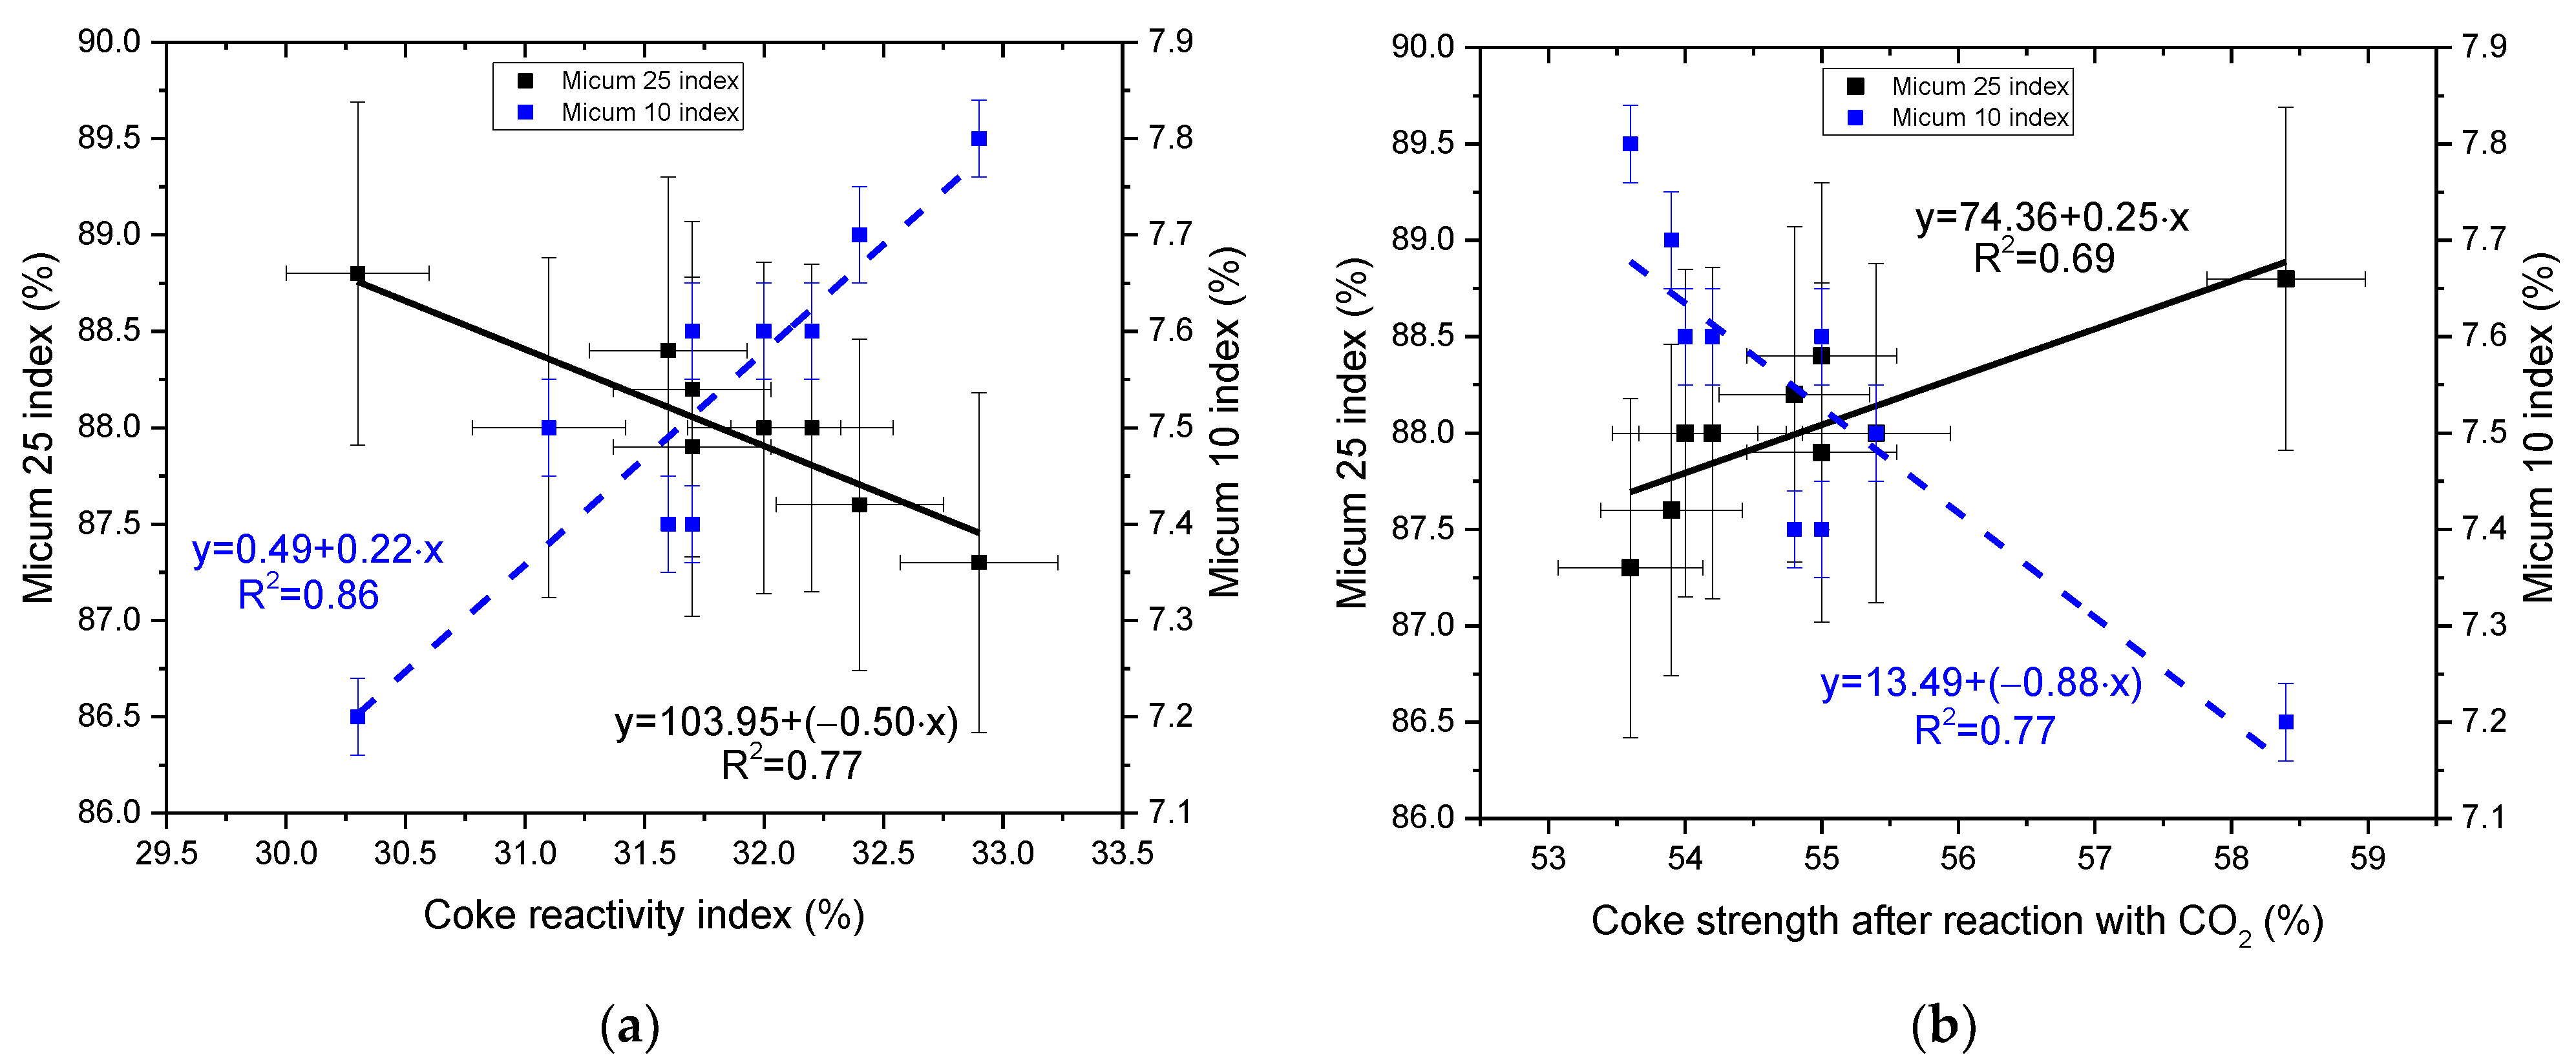
Analysis of the relationship between CRI or CSR with indicators M25 and M10 displays medium coefficients of determination. As can be seen from Figure 10a,b M25 increases and M10 decreases with decreasing CRI and increasing CSR. A good relationship between coke quality indicators confirms the influence of the petrographic properties of coal blends and the final coking temperature on the properties of industrial coke.
Consequently, the research results show that under conditions of an unstable raw material base for coking, multi-component coal blends, changes in coking regimes, petrographic parameters of the blend, proximate and caking indices of coal blends are closely related to the quality parameters of industrial coke.

4. Conclusions

Under the conditions of an unstable raw material base, multi-component coal blends, and fluctuations in the coking regime, it is important to correctly operate with the properties of coal to achieve the required coke quality. Petrographic analysis is of practical value for the quality assessment and efficient utilization of coal blends to ensure sustainable coke production. Therefore, an assessment of 9 coal blends in this study was suggested. The petrographic characteristics of 9 multi-component coal blends with proximate (VM and FC) and caking (y) properties have been established, and the influence on properties of metallurgical coke under industrial conditions has been investigated. The following conclusions and recommendations can be summarized:
  • Obtained dependencies between the parameters Rom and VM for all coals, which were used to prepare coal blends, showed a decrease in VM with increasing values of Rom (R2 = 0.93) and an increase in FC (R2 = 0.92). At the same time, the coals can be divided into four groups which correspond to gas coals (Rom = 0.50–0.89%) fat coals (Rom = 0.80–1.19%), coking coals (Rom = 1.0–1.29%) and lean coals (Rom = 1.30–1.80%).
  • The investigated multicomponent coal blends demonstrate Rom within the range of 0.94 to 1.11 wt.%, vitrinite content 80.2–86.5 wt.%, and inertinite 13.2–18.1 wt.%. A high coefficient of determination for the dependence on the Rom and volatile matters, or Rom and FC, has been established, namely R2 = 0.96 and R2 = 0.91, respectively. In addition, the relationship between the Rom in coal blends and the content of vitrinite or inertinite in the coal blends (R2 = 0.80 and R2 = 0.84, respectively) was obtained. Furthermore, the relationship between the change in VM or the maximum thickness of the plastic layer of coal blends on the vitrinite content, which corresponds to R2 = 0.72 and R2 = 0.68, has been analyzed.
  • A strict relationship between the Rom of coal blends and CRI or CSR of the obtained cokes has been established, corresponding to R2 = 0.99 and R2 = 0.98, respectively. An increase in the Rom for coal blends leads to a decrease in CRI and an increase in CSR. Additionally, the Rom has a good relationship with the ‘cold’ strength of M25 and M10. However, the parameters CRI and CSR better characterize the structural changes in the obtained cokes since they consider the change in the properties of the coke because of a chemical reaction with CO2 and subsequent determination of the mechanical strength.
  • An increase in inertinite content in the blends reduces the strength of the coke. Relationships between inertinite content in blends with M25 and M10 have been established and correspond to R2 = 0.91 and R2 = 0.90, respectively. It also shows an increase in CRI and a decrease in CSR with an increase in inertinite content within the blend, which is reflected by the coefficients of determination R2 = 0.83 and R2 = 0.88, respectively.
  • An increase in the content of vitrinite contributes to the improvement of the caking process of the coal blend and leads to the production of a strong and low-reactivity coke. This can be confirmed by the high coefficients of determination of the vitrinite content in the blends and the coke quality in terms of M25 and M10, corresponding to R2 = 0.97 and R2 = 0.90, respectively. Good relationships are also obtained between the vitrinite content with CRI and CSR, corresponding to R2 = 0.80 and R2 = 0.82, respectively.
  • The final coking temperature as a technological factor contributes to an additional improvement in the coke quality, which leads to a decrease in reactivity and an improvement in coke strength after reaction with CO2 with an increase in the final coking temperature. The relationship of the final coking temperature with the CRI and CSR indicators corresponds to the values R2 = 0.80 and R2 = 0.89, and for the indicators M25 and M10, it corresponds to the values R2 = 0.74 and R2 = 0.72, respectively. The obtained two-component linear regression showed a greater significance of thefinal coking temperature on CRI than inertinite content. This conclusion can be of practical importance for cokemaking plants, since the composition of coal blends considers the properties of the coal macerals, while the coking temperature is assumed to be constant.
Based on the results obtained, the coke quality can be improved by increasing the proportion of coals with a high Rom in the coal blend. However, as the research results show, in addition to ensuring the maximum optimal value of Rom in the preparation of coal blends to achieve the required coke quality, it is necessary to consider the proximate and caking properties of coals, the final temperature of coking, and the availability of coals with the appropriate properties at the cokemaking plant.

Author Contributions

Conceptualization, L.K.; methodology, A.K.; software, L.K.; validation, L.K., A.K. and K.R.; formal analysis, A.K.; investigation, L.K. and A.K.; writing—original draft preparation, L.K., A.K. and V.L.; writing—review and editing, L.K., A.K., J.S., H.Z. and A.M.; visualization, L.K. and V.L.; supervision, J.S.; funding acquisition, K.R. and A.M. All authors have read and agreed to the published version of the manuscript.

Funding

This research received no external funding.

Institutional Review Board Statement

Not applicable.

Informed Consent Statement

Not applicable.

Data Availability Statement

Data are contained within the article.

Acknowledgments

Support by the scholarship program “OeAD Sonderstpendien, Montanuniversität Leoben,” [MPC-2021-02136], financed by the Federal Ministry of Education, Science and Research of Austria, is gratefully acknowledged. We also wish to acknowledge the Montanuniversität Leoben for the support and staff of the Chair of Ferrous Metallurgy, who assisted throughout this scholarship. The authors are also grateful to the Reviewers for their insightful comments and efforts in improving the manuscript’s text.

Conflicts of Interest

The authors declare no conflict of interest.

References

  1. Takahashi, K.; Yoshino, A.; Nouchi, T.; Kano, J.; Ishihara, S.; Ariyama, T. Modeling of Coke Particle Breakage in Blast Furnace Considering Pore Structure by Discrete Element Method. ISIJ Int. 2021, 61, 1488–1497. [Google Scholar] [CrossRef]
  2. Kieush, L.; Schenk, J.; Pfeiffer, A.; Koveria, A.; Rantitsch, G.; Hopfinger, H. Investigation on the Influence of Wood Pellets on the Reactivity of Coke with CO2 and Its Microstructure Properties. Fuel 2022, 309, 122151. [Google Scholar] [CrossRef]
  3. Zhou, D.; Xu, K.; Bai, J.; He, D. On-Line Detecting the Tuyere Coke Size and Temperature Distribution of Raceway Zone in a Working Blast Furnace. Fuel 2022, 316, 123349. [Google Scholar] [CrossRef]
  4. Deva, N.; Ibrahimi, I. Substantiation of refractory lining influence on the electric furnace efficiency for the production of ferronickel. Min. Miner. Depos. 2021, 15, 71–77. [Google Scholar] [CrossRef]
  5. Koveria, A.; Kieush, L.; Svietkina, O.; Perkov, Y. Metallurgical Coke Production with Biomass Additives. Part 1. A Review of Existing Practices. Can. Metall. Q. 2020, 59, 417–429. [Google Scholar] [CrossRef]
  6. Bertling, H. Coal and Coke for Blast Furnaces. ISIJ Int. 1999, 39, 617–624. [Google Scholar] [CrossRef]
  7. Li, K.; Khanna, R.; Zhang, J.; Liu, Z.; Sahajwalla, V.; Yang, T.; Kong, D. The Evolution of Structural Order, Microstructure and Mineral Matter of Metallurgical Coke in a Blast Furnace: A Review. Fuel 2014, 133, 194–215. [Google Scholar] [CrossRef]
  8. Abdirashit, A.M.; Kelamanov, B.C.; Tazhiyev, Y.B.; Nurgali, N.Z.; Zayakin, O.V. Spectral analysis of ferrosilicoaluminium production gas cleaning dust briquette. Vestn. KazNRTU/Eng. J. Satbayev Univ. 2021, 143, 65–70. [Google Scholar] [CrossRef]
  9. Sybir, A.; Hubynskyi, M.; Fedorov, S.; Hubynskyi, S.; Vvedenska, T.; Bezuglyi, V. Effect of heat shock on graphitization of Donbass anthracite. Min. Miner. Depos. 2020, 14, 43–49. [Google Scholar] [CrossRef]
  10. Yang, Y.; Raipala, K.; Holappa, L. Ironmaking. In Treatise on Process Metallurgy; Elsevier: Amsterdam, The Netherlands, 2014; pp. 2–88. ISBN 978-0-08-096988-6. [Google Scholar]
  11. Kieush, L.; Koveria, A.; Boyko, M.; Yaholnyk, M.; Hrubiak, A.; Molchanov, L.; Moklyak, V. Influence of biocoke on iron ore sintering performance and strength properties of sinter. Min. Miner. Depos. 2022, 16, 55–63. [Google Scholar] [CrossRef]
  12. Chen, P.; Ma, J. Petrographic Characteristics of Chinese Coals and Their Application in Coal Utilization Processes. Fuel 2002, 81, 1389–1395. [Google Scholar] [CrossRef]
  13. Petlovanyi, M.; Malashkevych, D.; Sai, K.; Zubko, S. Research into balance of rocks and underground cavities formation in the coal mine flowsheet when mining thin seams. Min. Miner. Depos. 2020, 14, 66–81. [Google Scholar] [CrossRef]
  14. International Organization for Standardization ISO/DTS 4699; Hard Coal—Determination of Plastometric Indices—Manual Sapozhnikov Penetration Plastometer Method. ISO: Geneva, Switzerland, 2020.
  15. John, A.V.; Rao, U.A.; Rao, G.M.A. Note on the Use of Profile Features of Swapozhnikov’s Plastometric Curves for Assessment and Blending of Coking Coals. Fuel 1983, 62, 981–986. [Google Scholar] [CrossRef]
  16. ISO 10329:2017; Coal—Determination of Plastic Properties—Constant-Torque Gieseler Plastometer Method. International Organization for Standardization: Geneva, Switzerland, 2017.
  17. ISO 349:2020; Hard Coal-Audibert-Arnu Dilatometer Test. International Organization for Standardization: Geneva, Switzerland, 2020.
  18. ISO 335:1974; Hard Coal—Determination of Caking Power—Roga Test. International Organization for Standardization: Geneva, Switzerland, 1974.
  19. Rejdak, M.; Bigda, R.; Wojtaszek, M. Use of Alternative Raw Materials in Coke-Making: New Insights in the Use of Lignites for Blast Furnace Coke Production. Energies 2020, 13, 2832. [Google Scholar] [CrossRef]
  20. Piechaczek, M.; Mianowski, A. Coke Optical Texture as the Fractal Object. Fuel 2017, 196, 59–68. [Google Scholar] [CrossRef]
  21. International Committee for Coal and Organic Petrology (ICCP). New Inertinite Classification (ICCP System 1994). Fuel 2001, 80, 459–471. [Google Scholar] [CrossRef]
  22. Kwiecińska, B.; Petersen, H.I. Graphite, Semi-Graphite, Natural Coke, and Natural Char Classification—ICCP System. Int. J. Coal Geol. 2004, 57, 99–116. [Google Scholar] [CrossRef]
  23. Chehreh Chelgani, S.; Matin, S.S.; Hower, J.C. Explaining Relationships between Coke Quality Index and Coal Properties by Random Forest Method. Fuel 2016, 182, 754–760. [Google Scholar] [CrossRef]
  24. Warren, K.; Krahenbuhl, G.; Mahoney, M.; O’Brien, G.; Hapugoda, P. Estimating the Fusible Content of Individual Coal Grains and Its Application in Coke Making. Int. J. Coal Geol. 2015, 152, 3–9. [Google Scholar] [CrossRef]
  25. Malumbazo, N.; Wagner, N.J.; Bunt, J.R. The Petrographic Determination of Reactivity Differences of Two South African Inertinite-Rich Lump Coals. J. Anal. Appl. Pyrolysis 2012, 93, 139–146. [Google Scholar] [CrossRef]
  26. Cardott, B.J.; Curtis, M.E. Identification and Nanoporosity of Macerals in Coal by Scanning Electron Microscopy. Int. J. Coal Geol. 2018, 190, 205–217. [Google Scholar] [CrossRef]
  27. Koveria, A.; Kieush, L.; Hrubyak, A.; Kotsyubynsky, V. Properties of Donetsk Basin Hard Coals and the Products of Their Heat Treatment Revealed via Mossbauer Spectroscopy. Pet. Coal 2019, 61, 160–168. [Google Scholar]
  28. Valentim, B. Petrography of Coal Combustion Char: A Review. Fuel 2020, 277, 118271. [Google Scholar] [CrossRef]
  29. Alonso, M.J.G.; Borrego, A.G.; Alvarez, D.; Parra, J.B.; Menéndez, R. Influence of Pyrolysis Temperature on Char Optical Texture and Reactivity. J. Anal. Appl. Pyrolysis 2001, 58–59, 887–909. [Google Scholar] [CrossRef]
  30. Sahoo, M.; Bhowmick, T.; Mishra, V.; Pal, S.; Sharma, M.; Chakravarty, S. Significance of Coal Quality on Thermoplastic Properties: A Case Study. Int. J. Coal Prep. Util. 2019, 42, 1015–1032. [Google Scholar] [CrossRef]
  31. Wang, Y.; Liu, D.; Cai, Y.; Li, X. Variation of Petrophysical Properties and Adsorption Capacity in Different Rank Coals: An Experimental Study of Coals from the Junggar, Ordos and Qinshui Basins in China. Energies 2019, 12, 986. [Google Scholar] [CrossRef]
  32. Antoshchenko, M.; Tarasov, V.; Nedbailo, O.; Zakharova, O.; Yevhen, R. On the possibilities to apply indices of industrial coal-rank classification to determine hazardous characteristics of workable beds. Min. Miner. Depos. 2021, 15, 1–8. [Google Scholar] [CrossRef]
  33. Antoshchenko, M.; Tarasov, V.; Rudniev, R.; Zakharova, O. Using indices of the current industrial coal classification to forecast hazardous characteristics of coal seams. Min. Miner. Depos. 2022, 16, 7–13. [Google Scholar] [CrossRef]
  34. Maroto-Valer, M.M.; Taulbee, D.N.; Andresen, J.T.M.; Hower, J.C.; Snape, C.E. The Role of Semifusinite in Plasticity Development for a Coking Coal. Energy Fuels 1998, 12, 1040–1046. [Google Scholar] [CrossRef]
  35. Gray, R.J.; Devanney, K.F. Coke Carbon Forms: Microscopic Classification and Industrial Applications. Int. J. Coal Geol. 1986, 6, 277–297. [Google Scholar] [CrossRef]
  36. Jing, Z.; Gao, S.; Rodrigues, S.; Underschultz, J.; Strounina, E.; Pan, S.; Wu, S.; Li, Y.; Balucan, R.; Steel, K.M. Influence of Porosity on the Reactivity of Inertinite and Vitrinite toward Sodium Hypochlorite: Implications for Enhancing Coal Seam Gas Development. Int. J. Coal Geol. 2021, 237, 103709. [Google Scholar] [CrossRef]
  37. Sun, Z.; Ni, Z.; Wei, Q.; Liang, Y. Pyrolysis Characteristics of Vitrinites in Coking Coals with Different Coal Ranks. Int. J. Coal Prep. Util. 2018, 38, 271–279. [Google Scholar] [CrossRef]
  38. Zhang, D.; Yu, L.; Han, S.; Ren, X.; Zhang, W. Optimized Activity and Inertia Ratio in Coking Based on 40 kg Test Coke Oven. Coal Sci. Technol. 2008, 36, 110–112. [Google Scholar]
  39. Aziz, H.; Rodrigues, S.; Esterle, J.S.; Steel, K.M. Interactions between Vitrinite and Solid Additives Including Inertinite during Pyrolysis for Coke-Making Considerations. Fuel Processing Technol. 2020, 201, 106321. [Google Scholar] [CrossRef]
  40. Li, J.; Sun, Z.; Liang, Y. Interaction of Vitrinites in Similar Middle-Rank Coals during Coking Process. Fuel 2022, 316, 123334. [Google Scholar] [CrossRef]
  41. Gupta, S.; Shen, F.; Lee, W.-J.; O’Brien, G. Improving Coke Strength Prediction Using Automated Coal Petrography. Fuel 2012, 94, 368–373. [Google Scholar] [CrossRef]
  42. Schapiro, N.; Gray, R.J. The Use of Coal Petrography in Coke Making. J. Inst. Fuel 1964, 11, 134–242. [Google Scholar]
  43. Price, J.T.; Gransden, M.A.; Khan, B.D.R. Effect of Selected Minerals on High Temperature Properties of Coke. In Proceedings of the 2nd International Cokemaking Congress, London, UK, 28–30 September 1992; The Institute of Minerals: London, UK, 1992; pp. 287–292. [Google Scholar]
  44. Gray, R.; Champagne, P. Petrographic Characteristics Impacting the Coal to Coke Transformation. In Proceedings of the 47th Ironmaking Conference, Toronto, ON, Canada, 17–20 April 1988; pp. 313–324. [Google Scholar]
  45. Díez, M.A.; Alvarez, R.; Barriocanal, C. Coal for Metallurgical Coke Production: Predictions of Coke Quality and Future Requirements for Cokemaking. Int. J. Coal Geol. 2002, 50, 389–412. [Google Scholar] [CrossRef]
  46. Goscinski, J.S. Review of American Coal Quality and Its Effect on Coke Reactivity and after Reaction Strength of Cokes. J. Coal Qual. 1985, 4, 1. [Google Scholar]
  47. Kumar, P.P.; Barman, S.; Ranjan, M.; Ghosh, S.; Raju, V.V.S. Maximisation of Non-Coking Coals in Coke Production from Non-Recovery Coke Ovens. Ironmak. Steelmak. 2008, 35, 33–37. [Google Scholar] [CrossRef]
  48. Singh, R.; Ghosh, T.K.; Nag, D. Microtextural Analysis of Coke from Single and Binary Blend and Its Impact on Coke Quality. Ironmak. Steelmak. 2018, 45, 727–738. [Google Scholar] [CrossRef]
  49. North, L.; Blackmore, K.; Nesbitt, K.; Mahoney, M.R. Methods of coke quality prediction: A review. Fuel 2018, 219, 426–445. [Google Scholar] [CrossRef]
  50. North, L.; Blackmore, K.; Nesbitt, K.; Mahoney, M.R. Models of coke quality prediction and the relationships to input variables: A review. Fuel 2018, 219, 446–466. [Google Scholar] [CrossRef]
  51. ASTM D3172–13; Standard Practice for Proximate Analysis of Coal and Coke. ASTM: West Conshohocken, PA, USA, 2013.
  52. ISO 7404-2:2009; Methods for the Petrographic Analysis of Coals—Part 2: Methods of Preparing Coal Samples. International Organization for Standardization: Geneva, Switzerland, 2009.
  53. ISO 7404-3:2009; Methods for the Petrographic Analysis of Coals—Part 3: Method of Determining Maceral Group Composition. International Organization for Standardization: Geneva, Switzerland, 2009.
  54. ISO 7404-5:2009; Methods for the Petrographic Analysis of Coals—Part 5: Method of Determining Microscopically the Reflectance of Vitrinite. International Organization for Standardization: Geneva, Switzerland, 2009.
  55. Handbook for Cokemaking. In 6 Volumes. Volume 1. Coals for Coking. Benefication of Coals. Preparation of Coal for Coking, 6th ed.; Borisova, L.N.; Shapoval, Y.G. (Eds.) Inzhek Publishing House: Kharkiv, Ukraine, 2010. [Google Scholar]
  56. ISO 18894:2018; Coke—Determination of Coke Reactivity Index (CRI) and Coke Strength after Reaction (CSR). International Organization for Standardization: Geneva, Switzerland, 2018.
  57. ISO 556:2020; Coke (Greater than 20 Mm in Size)—Determination of Mechanical Strength). International Organization for Standardization: Geneva, Switzerland, 2020.
  58. Lin, Y.; Qin, Y.; Ma, D.; Duan, Z. Pore Structure, Adsorptivity and Influencing Factors of High-Volatile Bituminous Coal Rich in Inertinite. Fuel 2021, 293, 120418. [Google Scholar] [CrossRef]
  59. McCartney, J.T.; Teichmüller, M. Classification of Coals According to Degree of Coalification by Reflectance of the Vitrinite Component. Fuel 1972, 51, 64–68. [Google Scholar] [CrossRef]
  60. Tissot, B.P.; Welte, D.H. Coal and Its Relation to Oil and Gas. In Petroleum Formation and Occurrence: A New Approach to Oil and Gas Exploration; Springer: Berlin/Heidelberg, Germany, 1978; pp. 202–224. ISBN 978-3-642-96446-6. [Google Scholar]
  61. Zheng, H.; Xu, R.; Zhang, J.; Daghagheleh, O.; Schenk, J.; Li, C.; Wang, W. A Comprehensive Review of Characterization Methods for Metallurgical Coke Structures. Materials 2021, 15, 174. [Google Scholar] [CrossRef]
  62. Lundgren, M.; Sundqvist Ökvist, L.; Björkman, B. Coke Reactivity under Blast Furnace Conditions and in the CSR/CRI Test. Steel Res. Int. 2009, 80, 396–401. [Google Scholar] [CrossRef]
  63. Pusz, S.; Buszko, R. Reflectance Parameters of Cokes in Relation to Their Reactivity Index (CRI) and the Strength after Reaction (CSR), from Coals of the Upper Silesian Coal Basin, Poland. Int. J. Coal Geol. 2012, 90–91, 43–49. [Google Scholar] [CrossRef]
  64. Todoschuk, T.W.; Price, J.; Gransden, J. Development of coke strength after reaction (CSR) at Dofasco. Iron Steel Technol. 2004, 1, 73–84. [Google Scholar]
  65. Dash, P.S.; Guha, M.; Chakraborty, D.; Banerjee, P.K. Prediction of Coke CSR from Coal Blend Characteristics using Various Techniques: A Comparative Evaluation. Int. J. Coal Prep. Util. 2012, 32, 169–192. [Google Scholar] [CrossRef]
  66. Jordan, P. Characterising Coals for Coke Production and Assessing Coke: Predicting Coke Quality Based on Coal Petrography, Rheology and Coke Petrography, Faculty of Engineering and the Built Environment. Master’s Thesis, University of Witwatersrand, Johannesburg, South Africa, 2008; p. 121. [Google Scholar]
  67. Zhang, Q.; Wu, X.; Feng, A.; Shi, M. Prediction of Coke Quality at Baosteel. Fuel Processing Technol. 2004, 86, 1–11. [Google Scholar] [CrossRef]
  68. Yuan, Y.; Qu, Q.; Chen, L.; Wu, M. Modeling and Optimization of Coal Blending and Coking Costs Using Coal Petrography. Inf. Sci. 2020, 522, 49–68. [Google Scholar] [CrossRef]
  69. O’Brien, G.; Jenkins, B.; Esterle, J.; Beath, H. Coal Characterisation by Automated Coal Petrography. Fuel 2003, 82, 1067–1073. [Google Scholar] [CrossRef]
  70. Hara, Y.; Mikuni, O.; Yamanoto, H.; Yamanaki, H. The Assessment of Coke Quality with Particular Emphasis on Sampling Technique; Blast Furnace Coke: Quality, Cause and Effect; McMaster University: Hamilton, ON, Canada, 1980. [Google Scholar]
  71. Košina, M.; Heppner, P. Macerals in Bituminous Coals and the Coking Process: Part 1: Effect of Basic Coal Properties on the Process of Thermal Degradation. Fuel 1984, 63, 838–846. [Google Scholar] [CrossRef]
  72. Pearson, D.E. The Quality of Western Canadian Coking Coal. Can. Min. Metall. Bull. 1980, 73, 70–84. [Google Scholar]
  73. Serenčíšová, J.; Klika, Z.; Kolomazník, I.; Bartoňová, L.; Baran, P. Relationships among coking coals and related cokes characteristics: A statistical evaluation. Acta Geodyn. Geomater. 2018, 15, 311–322. [Google Scholar] [CrossRef]
  74. Bazaluk, O.; Kieush, L.; Koveria, A.; Schenk, J.; Pfeiffer, A.; Zheng, H.; Lozynskyi, V. Metallurgical Coke Production with Biomass Additives: Study of Biocoke Properties for Blast Furnace and Submerged Arc Furnace Purposes. Materials 2022, 15, 1147. [Google Scholar] [CrossRef]
Figure 1. (a) Relationship between mean reflectance of vitrinite and volatile matters (daf) of coals; (b) Relationship between mean reflectance of vitrinite and fixed carbon of coals.
Sustainability 14 09947 g001
Figure 2. (a) Relationship between mean reflectance of vitrinite and volatile matters (daf) of coal blends; (b) Relationship between mean reflectance of vitrinite and fixed carbon of coal blends.
Sustainability 14 09947 g002
Figure 3. (a) Relationship between vitrinite content and volatile matters (daf), mean reflectance of vitrinite, or (b) the maximum thickness of the plastic layer of coal blends.
Sustainability 14 09947 g003
Figure 4. Relationship between inertinite content and mean reflectance of vitrinite of coal blends.
Sustainability 14 09947 g004
Figure 5. Relationship between the coke reactivity index and coke strength after reaction with CO2.
Sustainability 14 09947 g005
Figure 6. (a) Relationship between mean reflectance of vitrinite of coal blends and CRI or CSR; (b) Relationship between mean reflectance of vitrinite of coals blend and Micum 25 index or Micum 10 index.
Sustainability 14 09947 g006
Figure 7. (a) Relationship between inertinite content of coal blends and coke reactivity index or coke strength after reaction with CO2; (b) Relationship between inertinite content of coal blends and Micum 25 or Micum 10 indices.
Sustainability 14 09947 g007
Figure 8. (a) Relationship between vitrinite content of coal blends and coke reactivity index or coke strength after reaction with CO2; (b) Relationship between vitrinite content in coal blends and Micum 25 or Micum 10 indices.
Sustainability 14 09947 g008
Figure 9. (a) Relationship between final coking temperature and coke reactivity index or coke strength after reaction with CO2; (b) Relationship between final coking temperature and Micum 25 or Micum 10 indices.
Sustainability 14 09947 g009
Figure 10. (a) Correlation trend between coke reactivity index and Micum 25 or Micum 10 indices; (b) Correlation trend between coke strength after reaction with CO2 and Micum 25 or Micum 10 indices.
Sustainability 14 09947 g010
Table 1. Characteristics of the coke oven battery.
CharacteristicUnit of MeasurementParameters
Total (Useful)
Useful capacity of ovenm321.6
Heating systemTwin vertical flues with recirculation of waste gases
Heating schemeCombined
Supply of gasSide
Length of the coke ovenmm13,980 (13,140)
Height of the coke ovenmm4300 (4000)
Width of the coke oven:
coke sidemm435
push sidemm385
averagemm410
tapermm50
Distance between axes of coke ovensmm1143
Number of verticalsunits28
Heating levelmm700
Number of ovens in the batteryunits37
Number of gas collectorsunits1
Table 2. Characteristic of coals and coals blend 1.
Type of CoalAmount within the Blend, wt.%Petrographic Analysis, wt.%Proximate Analysis, wt.%Maximum Thickness of Plastic LayerFixed Carbon *
RomVtLIAsh (db)VM (db)VM (daf)Sulfur (db)Y, mmFC, wt.%
A10.00.6675.03.022.08.037.440.60.4810.054.6
B18.00.7390.02.08.08.837.441.00.4016.053.8
C19.00.9582.02.016.07.532.334.91.0421.060.2
D14.00.9079.02.019.07.633.235.90.9621.059.2
E8.00.9481.03.016.07.133.335.80.8721.559.6
F12.01.1690.02.08.08.626.228.70.6613.065.2
G15.01.0563.00.037.08.026.528.80.4611.565.5
H4.01.5377.00.023.08.717.919.60.7211.573.4
Blend1000.9480.21.718.18.031.834.60.7016.360.2
Rom is mean reflectance of vitrinite; Vt is vitrinite; L is liptinite; I is inertinite; VM is volatile matter; db is dry basis; daf is dry ash free basis; * Calculated by equation, Fixed carbon, wt.% = 100 − (wt.% VM (db) − wt.% A (db)).
Table 3. Characteristic of coals and coals blend 2.
Type of CoalAmount within the Blend, wt.%Petrographic Analysis, wt.%Proximate Analysis, wt.%Maximum Thickness of Plastic LayerFixed Carbon
RomVtLIAsh (db)VM (db)VM (daf)Sulfur (db)Y, mmFC, wt.%
A10.00.6675.03.022.08.037.440.60.4810.054.6
B18.00.7390.02.08.08.837.441.00.4016.053.8
C17.00.9582.02.016.07.532.334.91.0421.060.2
D12.00.9079.02.019.07.633.235.90.9621.059.2
E12.00.9481.03.016.07.133.335.80.8721.559.6
F12.01.1690.02.08.08.626.228.70.6613.065.2
G10.01.0563.00.037.08.026.528.80.4611.565.5
H9.01.5377.00.023.08.717.919.60.7211.573.4
Blend1000.9680.91.817.38.031.434.10.7116.360.6
Table 4. Characteristic of coals and coals blend 3.
Type of CoalAmount within the Blend, wt.%Petrographic Analysis, wt.%Proximate Analysis, wt.%Maximum Thickness of Plastic LayerFixed Carbon
RomVtLIAsh (db)VM (db)VM (daf)Sulfur (db)Y, mmFC, wt.%
A11.00.6679.02.019.08.037.440.60.4610.054.6
B22.00.7390.02.08.08.236.740.00.3916.055.1
C4.00.9382.02.016.07.432.735.31.0622.059.9
D31.00.9180.02.018.07.633.235.90.9621.059.2
F17.01.1489.01.010.08.625.928.30.6513.065.5
H15.01.5377.00.023.08.717.919.60.7211.573.4
Blend1000.9883.31.515.28.130.933.60.6915.961.0
Table 5. Characteristic of coals and coals blend 4.
Type of CoalAmount within the Blend, wt.%Petrographic Analysis, wt.%Proximate Analysis, wt.%Maximum Thickness of Plastic LayerFixed Carbon
RomVtLIAsh (db)VM (db)VM (daf)Sulfur (db)Y, mmFC, wt.%
A12.00.6675.03.022.08.037.440.60.4810.054.6
B18.00.7390.02.08.08.837.240.80.3816.054.0
C20.00.9382.02.016.07.432.535.11.0222.060.1
D18.00.9079.02.019.07.633.235.90.9621.059.2
F17.01.1589.01.010.08.726.228.70.6513.065.1
H15.01.5377.00.023.08.717.919.60.7211.573.4
Blend1000.9883.01.115.98.230.833.50.7216.261.0
Table 6. Characteristic of coals and coals blend 5.
Type of CoalAmount within the Blend, wt.%Petrographic Analysis, wt.%Proximate Analysis, wt.%Maximum Thickness of Plastic LayerFixed Carbon
RomVtLIAsh (db)VM (db)VM (daf)Sulfur (db)Y, mmFC, wt.%
A11.00.6478.02.020.08.237.040.30.479.054.8
B11.00.7490.02.08.07.637.540.60.3916.054.9
I4.00.9191.01.08.08.734.537.80.5829.056.8
C13.00.9478.04.018.07.432.935.51.0724.559.7
J19.00.9190.01.09.08.333.536.50.5421.558.2
F27.01.1685.02.013.08.426.428.80.6412.565.2
K4.01.0258.01.041.08.425.427.70.3312.066.2
H11.01.5779.00.021.08.917.819.50.6611.573.3
Blend1001.0183.31.814.98.230.333.00.6216.361.5
Table 7. Characteristic of coals and coals blend 6.
Type of CoalAmount within the Blend, wt.%Petrographic Analysis, wt.%Proximate Analysis, wt.%Maximum Thickness of Plastic LayerFixed Carbon
RomVtLIAsh (db)VM (db)VM (daf)Sulfur (db)Y, mmFC, wt.%
A16.00.6275.02.023.07.836.940.00.4910.055.3
B13.00.7488.02.09.08.037.640.90.3916.054.4
L10.00.9985.06.09.06.632.935.20.8624.060.5
J7.00.9089.02.09.08.334.037.10.5521.557.7
M11.01.0574.01.025.08.826.629.20.4713.064.6
F25.01.1486.02.012.08.726.328.80.6613.065.0
N8.01.1690.02.08.08.025.828.01.0520.566.2
H10.01.5579.01.020.08.317.419.00.6311.574.3
Blend1001.0182.92.314.88.129.832.40.6215.162.1
Table 8. Characteristic of coals and coals blend 7.
Type of CoalAmount within the Blend, wt.%Petrographic Analysis, wt.%Proximate Analysis, wt.%Maximum Thickness of Plastic LayerFixed Carbon
RomVtLIAsh (db)VM (db)VM (daf)Sulfur (db)Y, mmFC, wt.%
A20.00.6279.01.020.08.136.940.10.4310.055.0
B4.00.7490.01.09.07.737.340.40.3314.055.0
I19.00.9092.00.08.08.735.138.40.5725.056.2
C4.00.9182.03.015.07.232.835.31.1022.060.0
M12.01.0773.00.027.08.826.629.20.4813.064.6
F27.01.1591.01.08.08.426.629.00.6713.065.0
H14.01.5782.00.018.08.217.919.50.7211.073.9
Blend1001.0285.00.614.48.329.732.40.5914.862.0
Table 9. Characteristic of coals and coals blend 8.
Type of CoalAmount within the Blend, wt.%Petrographic Analysis, wt.%Proximate Analysis, wt.%Maximum Thickness of Plastic LayerFixed Carbon
RomVtLIAsh (db)VM (db)VM (daf)Sulfur (db)Y, mmFC, wt.%
A5.00.6777.03.020.07.537.040.00.4510.055.5
B10.00.7188.02.010.08.136.940.10.4314.055.0
C22.00.9280.04.016.06.932.735.11.1321.060.4
O5.00.9187.00.013.08.033.936.81.2223.058.1
J7.00.9389.01.010.09.433.336.70.5720.057.3
M15.01.0771.01.028.08.827.129.70.6013.064.1
F24.01.1792.01.08.08.126.228.50.6713.065.7
H12.01.5682.00.018.07.917.519.00.7410.074.6
Blend1001.0583.41.415.28.029.231.70.7515.362.8
Table 10. Characteristic of coals and coals blend 9.
Type of CoalAmount within the Blend, wt.%Petrographic Analysis, wt.%Proximate Analysis, wt.%Maximum Thickness of Plastic LayerFixed Carbon
RomVtLIAsh (db)VM (db)VM (daf)Sulfur (db)Y, mmFC, wt.%
A9.00.6279.01.020.07.537.140.10.4410.055.4
P4.00.6776.01.023.07.636.239.20.519.556.2
B8.00.7490.01.09.08.236.740.00.4412.055.1
I8.00.9093.00.07.08.835.338.70.5624.055.9
C4.00.9379.03.018.07.132.835.31.1124.560.1
Q21.01.3084.00.016.09.931.935.41.1818.058.2
F29.01.1493.00.07.08.226.428.80.6813.065.4
H17.01.5382.00.018.08.317.719.30.7311.074.0
Blend1001.1186.50.313.28.529.231.90.7514.562.3
Table 11. Parameters of industrial metallurgical coke quality.
Coke SampleFinal Coking Temperature, °CIndices of Coke Quality, wt.%
Ash (db)VM (db)Sulfur (db)Fixed CarbonCoke Reactivity IndexCoke Strength after Reaction with CO2Micum 25 IndexMicum 10 Index
FCCRICSRM25M10
1106010.60.880.3488.4232.953.687.37.8
2106010.70.890.3588.4132.453.987.67.7
3106510.90.840.3388.2632.254.088.07.6
4107011.00.800.3688.2032.054.288.07.6
5106511.00.830.3388.1731.754.888.27.4
6107010.90.790.3288.3131.755.087.97.6
7107511.10.740.3188.1631.655.088.47.4
8107510.70.750.3888.5531.155.488.07.5
9108510.90.710.3788.3930.358.488.87.2
Publisher’s Note: MDPI stays neutral with regard to jurisdictional claims in published maps and institutional affiliations.

