Article

Lane-Change Risk When the Subject Vehicle Is Faster Than the Following Vehicle: A Case Study on the Lane-Changing Warning Model Considering Different Driving Styles

1
College of Traffic & Transportation, Chongqing Jiaotong University, Chongqing 400074, China
2
Key Laboratory for Automotive Transportation Safety Enhancement Technology of the Ministry of Transport, Chang’an University, Xi’an 710064, China
3
Modern Postal School, Xi’an University of Posts & Telecommunications, Xi’an 710061, China
*
Author to whom correspondence should be addressed.
Sustainability 2022, 14(16), 9938; https://doi.org/10.3390/su14169938
Submission received: 28 June 2022 / Revised: 8 August 2022 / Accepted: 9 August 2022 / Published: 11 August 2022

Abstract

:
The research of early warning and control strategy considering driving styles during lane changes is a hotspot in the field of automatic driving. However, many lane-changing studies only emphasize the warning analysis when the following vehicle is faster than the subject vehicle, while neglecting the potential risk when the subject vehicle is faster than the following vehicle in the adjacent lane during lane changes. To study the lane-changing characteristics of drivers considering driving styles and to establish a personalized lane-changing warning model under different relative speed conditions, fifty participants (three females and forty-seven males) were recruited to carry out a real road driving test. A novel Gaussian mixture model with the results of k-means clustering was established to classify driving styles based on two-dimensional variables: average time gap and average minimum time to collision. The clustering result was then verified. In addition, by analyzing the relationship between the subject vehicle and the following vehicle in the adjacent lane during lane changes, a lane-changing warning model considering driving styles under different relative speed conditions was established. Results show that the clustering algorithm proposed in this paper has high separability between samples, achieving a much softer clustering result that can provide a reference for the parameter setting of the personalized driver assistance system. Furthermore, the overall recognition accuracy of the hazardous lane-changing behaviors improved after drivers were classified into different driving styles. The established lane-changing warning model has a better recognition performance for aggressive drivers when compared with the other two driver types. The results provide a basis for the algorithm design of the intelligent lane-changing warning system and can improve the user acceptance of an advanced driver assistance system for self-driving vehicles.

1. Introduction

Studies have shown that lane changing is one of the most important causes leading to road traffic accidents [1,2]. The number of rear-end collisions and side-swipe collisions accounts for about 4% of road traffic accidents in Queensland, Australia [3]; 4.9% of all 2015 road traffic accidents were caused by overtaking and improper lane changing in China [4]; and nearly 5% of all road traffic accidents and 7% of all fatalities in such accidents are caused by improper merging or lane-changing operations in the United States [5]. During the process of lane changing, the poor perception and judgment ability or improper operation of the driver may lead to rear-end collisions and side-swipe collisions more easily [6,7]. Studies have shown that nearly half of drivers fail to use turn signals when changing lanes [8,9]. When turn signals are correctly used during lane changes, the traffic flow is increased and the possibility of road traffic accidents is reduced [9]. In addition, the results from one naturalistic driving study showed that the infrequent usage of turn signals, an inaccurate judgment of gap distance and time gap, and a large relative speed between the subject vehicle (SV) and following vehicles (FVs) will lead to an increase in rear-end collisions and side-swipe collisions during lane changes [10].
To reduce rear-end or side-swipe collisions caused by lane-changing maneuvers, a variety of lane-changing warning systems have emerged, such as the lane-changing decision warning system and crash avoidance system [11]. A lane-changing warning system can monitor the behaviors of the driver in real time and can give alarms in the form of voice or vision if an insufficient time gap or gap distance is detected during lane changing [12,13,14]. Therefore, the lane-changing warning system plays a key role in the advanced driving assistance system, which can effectively reduce the number of accidents and the risk of rear-end or side-swipe collisions [15]. Wang et al. [11] conducted two extremity tests on a freeway in China and proposed a two-stage lane-changing warning model based on the minimum safety distance and deceleration value of FVs when considering the perception characteristics of the driver, determining the two-stage deceleration threshold of −1.5 m/s2 and −2.7 m/s2. Fu et al. [16] analyzed the characteristics of drivers’ behaviors in performing and canceling lane changing based on the data collected from a real road test. The researchers identified the drivers’ subjective judgement for risk assessment and established lane-changing warning rules between the SV and surrounding vehicles in different speed ranges. Mar et al. [17] proposed a crash avoidance system to optimize the processing time of lane changes based on cascading fuzzy reasoning and determined appropriate lane-changing rules by analyzing the relative distance and relative speed between the SV and FVs under multiple conditions. Kim et al. [18] proposed an adaptive cruise control and crash avoidance system to improve driving comfort and lane-changing safety and determined the longitudinal and lateral control strategy of autonomous vehicles in a mixed traffic environment by analyzing severe braking maneuvers and lane-changing trajectories.
Furthermore, driving style is the way drivers prefer to drive or the driving habits that have formed over a period of time [19]. Lane-changing warning rules or models conforming to different types of drivers should be developed to improve safety and the acceptability of drivers during lane changes [20]. Liu et al. [21] proposed a Gaussian mixture model (GMM) with the inputs of the k-means algorithm for clustering, classified drivers into three types of driving styles based on two-dimensional variables (average time gap and average time gap when braking), and established car-following warning rules considering driving styles. Lotfi et al. [22] and Johnson et al. [23] classified drivers into different driving styles based on the speed, acceleration, and other related signals collected through smart phones. In addition, scholars have also classified drivers into various types and have identified the characteristics of drivers with different driving styles based on lane-changing behavior analysis. Takamatsu et al. [24] classified drivers into different types by analyzing the trajectories, steering wheel entropy, and other related indicators of the vehicle. Zhang et al. [25] proposed a driver classification method based on pattern recognition, which can determine the skill level of the driver by analyzing the discrete Fourier transform coefficient of steering angles and the lateral positions of the vehicle. Ren et al. [26] proposed a lane-changing model considering driving styles by utilizing the neural network algorithm, divided the samples into three types, and verified the classification accuracy of the model based on a next-generation simulation (NGSIM) dataset. Hou et al. [27] carried out a driving test on a freeway on a driving simulator and analyzed the characteristics of eye movements and motion parameters among different driving styles. It was found that the more aggressive a driver was, the less they focused on the surrounding environment and the lateral control stability, while exhibiting a higher frequency of abrupt acceleration or deceleration. According to the perception of lane-changing risk, Wang et al. [28] established a lane-changing warning system considering driving styles to improve user acceptance and determined appropriate warning thresholds for drivers with different driving styles by using the signal detection theory.
Most existing lane-changing warning systems focus on giving alarms to drivers when there is an approaching rear vehicle in the adjacent lane [29], and the risk of collisions between the SV and the FV is higher than that with other nearby vehicles during lane changes [30]. Therefore, this study mainly focuses on the lane-changing analysis when there is an FV in the adjacent lane. However, many lane-changing studies only emphasize the warning analysis when the FV is faster than the SV, while neglecting the potential risk when the SV is faster than the FV during lane changes. Therefore, this study analyzes the lane-changing characteristics of drivers under different relative speed conditions, uses a novel clustering method to classify drivers into different driving styles, and establishes a personalized lane-changing warning model under different relative speed conditions.

2. Methods

2.1. Participants and Test Routes

Fifty Chinese drivers were recruited (three of whom were female) in the field test. The ages of the participants were between 27 and 50 years, with an average value of 40.3 years and a standard deviation of 6.5 years. The driving experiences of the participants ranged from 2 to 30 years, with an average value of 14.0 years and a standard deviation of 8.3 years. The distributions of their ages and driving experiences are presented in Figure 1. During the test, the participants did not need to wear any test equipment. They simply drove the instrumented vehicle according to their daily driving habits. The test session of each participant was about 90–110 min.
The routes in this test included an urban road (marked in green), ring road (marked in yellow), and expressway (marked in red), as depicted in Figure 2 through map matching. The speed limits of these three kinds of routes were 40–50 km/h, 70–90 km/h, and 100–110 km/h, respectively.

2.2. Apparatus

An instrumented vehicle equipped with multi-sensors was used in the field test, which is exhibited in Figure 3. The multi-sensors used for the lane-changing analysis consisted of a lane detection system (to measure the lateral distance to the boundaries of the left and right lanes), a controller area network (CAN) acquisition card (to extract the SV speed, the steering angle, and the signals of gas and brake pedals), a millimeter-wave radar mounted on the rear bumper of the SV (to measure the relative speed/distance between the rear bumper of the SV and the front bumper of the FV), and six video monitoring systems (to record the videos of the driver’s face, pedal area, as well as the traffic environment and driving conditions in the front, back, left, and right directions). The video systems were used to assist in verifying uncertain lane-changing events after manual extraction. Data such as the time gap and the time to collision (TTC) were then calculated. The frequency of the recorded data used for the lane-changing analysis was set to 10 Hz for the whole field test.

2.3. Extraction of Lane-Changing Events

As described in the introduction section, only the lane-changing scenario when there was an FV in the adjacent lane was studied. In this study, the starting and ending points of the lane-changing events were determined at the moments when the SV had obvious lateral displacement for the first time and the trajectory of the SV tended to be stable in the new lane [31], as shown in Figure 4. To ensure the reliabilities of the extracted lane-changing events, all lane-changing events in this study were manually selected and verified by the video monitoring systems. During the entire process of the field test, a total of 2752 lane-changing events were extracted from the 50 drivers, of which 1496 lane-changing events consisted of the situations when the SV was followed by an FV in the adjacent lane.

3. Driving Style Classification in Lane-Changing Situations

3.1. Clustering Model Establishment

3.1.1. K-Means Algorithm

Considering that no labelled data are needed in the implementation of unsupervised machine learning algorithms, it is suitable for unsupervised machine learning algorithms to be used in a variety of applications where it is difficult to obtain labelled data. The k-means algorithm is considered to be one of the most commonly used unsupervised machine learning algorithms. The way the k-means algorithm works is as follows.
Suppose a group of vectors x 1 ,   x 2 ,   ,   x T is randomly divided into k clusters, where the cluster center is represented by the mean vector ( μ ¯ 1 ,   μ ¯ 2 ,   ,   μ ¯ K ) of the data points in each cluster. Each data point is then assigned to the nearest cluster according to the Euclidean distance or other forms of distance between that point and the mean vector of each cluster. The objective function Cost (i.e., based on the Euclidean distance) is minimized by updating the mean vector of each cluster, expressed as follows:
C o s t = i = 1 N ( a r g m i n j   | | x i μ ¯ j | | 2 2 ) .  
The cluster center is re-allocated iteratively until the convergence criterion is met, that is, if the cluster center formed in the current iteration is the same as that formed in the previous iteration, then the iterative approach is completed and the clustering result is returned.

3.1.2. Gaussian Mixture Model with the Inputs of K-Means Algorithm

Although the k-means algorithm has obvious advantages such as simplicity, rapid convergence, and good scalability, it belongs to a hard clustering algorithm, which means that it will associate each data point to one and only one cluster. As a statistical model based on probabilistic clustering, the GMM is mainly determined by two parameters: mean value and covariance matrix [32]. The GMM combines the advantages of non-parametric and parametric estimation and can express the distribution characteristics of data points in the parameter space well [33]. The probability density function of the GMM is defined as follows:
p ( x ) = i = 1 k α i · p i ( x ) = i = 1 k α i · N ( x | μ i ,   Σ i )
where k is the number of Gaussian distributions, and each distribution represents a cluster. α i is the mixed coefficient of the GMM and meets the constraint of i = 1 k α i = 1 . N ( x | μ i ,   Σ i ) is the probability density function of the ith Gaussian distribution, which is expressed as follows:
N ( x | μ i ,   Σ i ) = e 1 2 ( x μ ) T Σ 1 ( x μ ) ( 2 Π ) n 2 | Σ | 1 2
The parameters of the Gaussian distributions are listed as follows:
θ = [ α 1 ,   α 2 ,   α 3 ,   ,   α k ,     μ 1 ,   μ 2 ,   μ 3 ,   ,   μ k ,   Σ 1 ,   Σ 2 ,   Σ 3 ,   ,   Σ k
An iterative algorithm called expectation maximization (EM) is used in the GMM to find the estimation of these parameters that maximize the likelihood of the objective function, which is expressed as follows:
J ( θ ) = ln [ j = 1 k p ( x j ) ] = j = 1 k l n   p ( x j ) = i = 1 k l n [ α i · N ( x | μ i ,   σ i 2 ) ]
Considering the EM algorithm is sensitive to the values of the initial parameters, an improper selection of the initial values will make it difficult for the GMM to obtain a global optimal result. To this end, an improved GMM algorithm is proposed here by taking the clustering result of the k-means algorithm as the values of the initial parameters for the GMM, and a soft distribution result can be obtained by clustering with the improved model. That is, each data point will be assigned to the possible cluster according to the probabilities of that point belonging to different clusters. Finally, data with high probability in each cluster are selected as the clustering result. The specific steps of the improved GMM algorithm are as follows:
  • Initialize centroids by first shuffling all data points and randomly selecting k data points as the cluster centers.
  • Compute the sum of the squared distance between each data point and k centroids and assign each data point to the possible cluster based on the principle of the minimum distance.
  • Update k centroids by iterating until there is no change to the centroids.
  • Compute the proportion and the mean vector of the data points in each cluster determined by the k-means algorithm.
  • Take the clustering result of the k-means algorithm as the initial input parameters of the GMM (i.e., mean vector and weight of a cluster and covariance matrix of clusters).
  • Run the improved GMM algorithm to obtain the optimized clustering result.

3.2. Lane-Changing Safety Indicator Selection

As described in Section 2.3, a total of 2752 lane changes were completed by the 50 drivers, among which 1496 lane changes were the situations when an FV in the adjacent lane followed the SV. Considering that there is a car-following relationship between the FV in the adjacent lane and the SV during lane changes to a certain degree, ensuring the longitudinal safety during lane changes is of great significance in the selection of lane-changing safety indicators. To this end, the relationships between the average gap distance/time gap/TTC and the average speed of each lane-changing event are depicted by scatter diagrams when there is an FV in the adjacent lane, as shown in Figure 5, Figure 6 and Figure 7. As can be seen from Figure 5, Figure 6 and Figure 7, the average gap distance between the SV and the FV in the adjacent lane tends to increase with the increase in the average speed of the SV during lane changes, and the average time gap decreases with the increase in the average speed of the SV, while the TTC is relatively stable and less sensitive to speed variations.
To select suitable safety indicators in lane-changing situations, the distributions of the time gap and the TTC of these 1496 lane-changing events under different relative speed ranges and speed ranges were analyzed by referring to Liu et al. [34]. Furthermore, to show the characteristics of safety indicators in wide speed ranges, the lane-changing data with the relative speed below −5 km/h and the speed of the SV greater than 10 km/h were selected in this section. It should be noted that the relative speed is defined as ΔV = Vsubject_vehicle − Vfollowing_vehicle, so the relative speed analyzed in this section is negative. The average time gap and the TTC in various relative speed ranges and different speed ranges in the process of lane changes from the 50 drivers were calculated, as shown in Figure 8.
As can be seen from Figure 8, for different speed ranges of the SV, the TTC is relatively stable under high relative speed conditions (<−15 km/h), while the time gap is stable under low relative speed conditions (≥−15 km/h). Therefore, it is more appropriate to use the time gap as the safety indicator for lane-changing analysis when the relative speed is greater than −15 km/h, and the TTC is recommended as the safety indicator for the lane-changing analysis when the relative speed is less than −15 km/h by referring to Liu et al. [34].

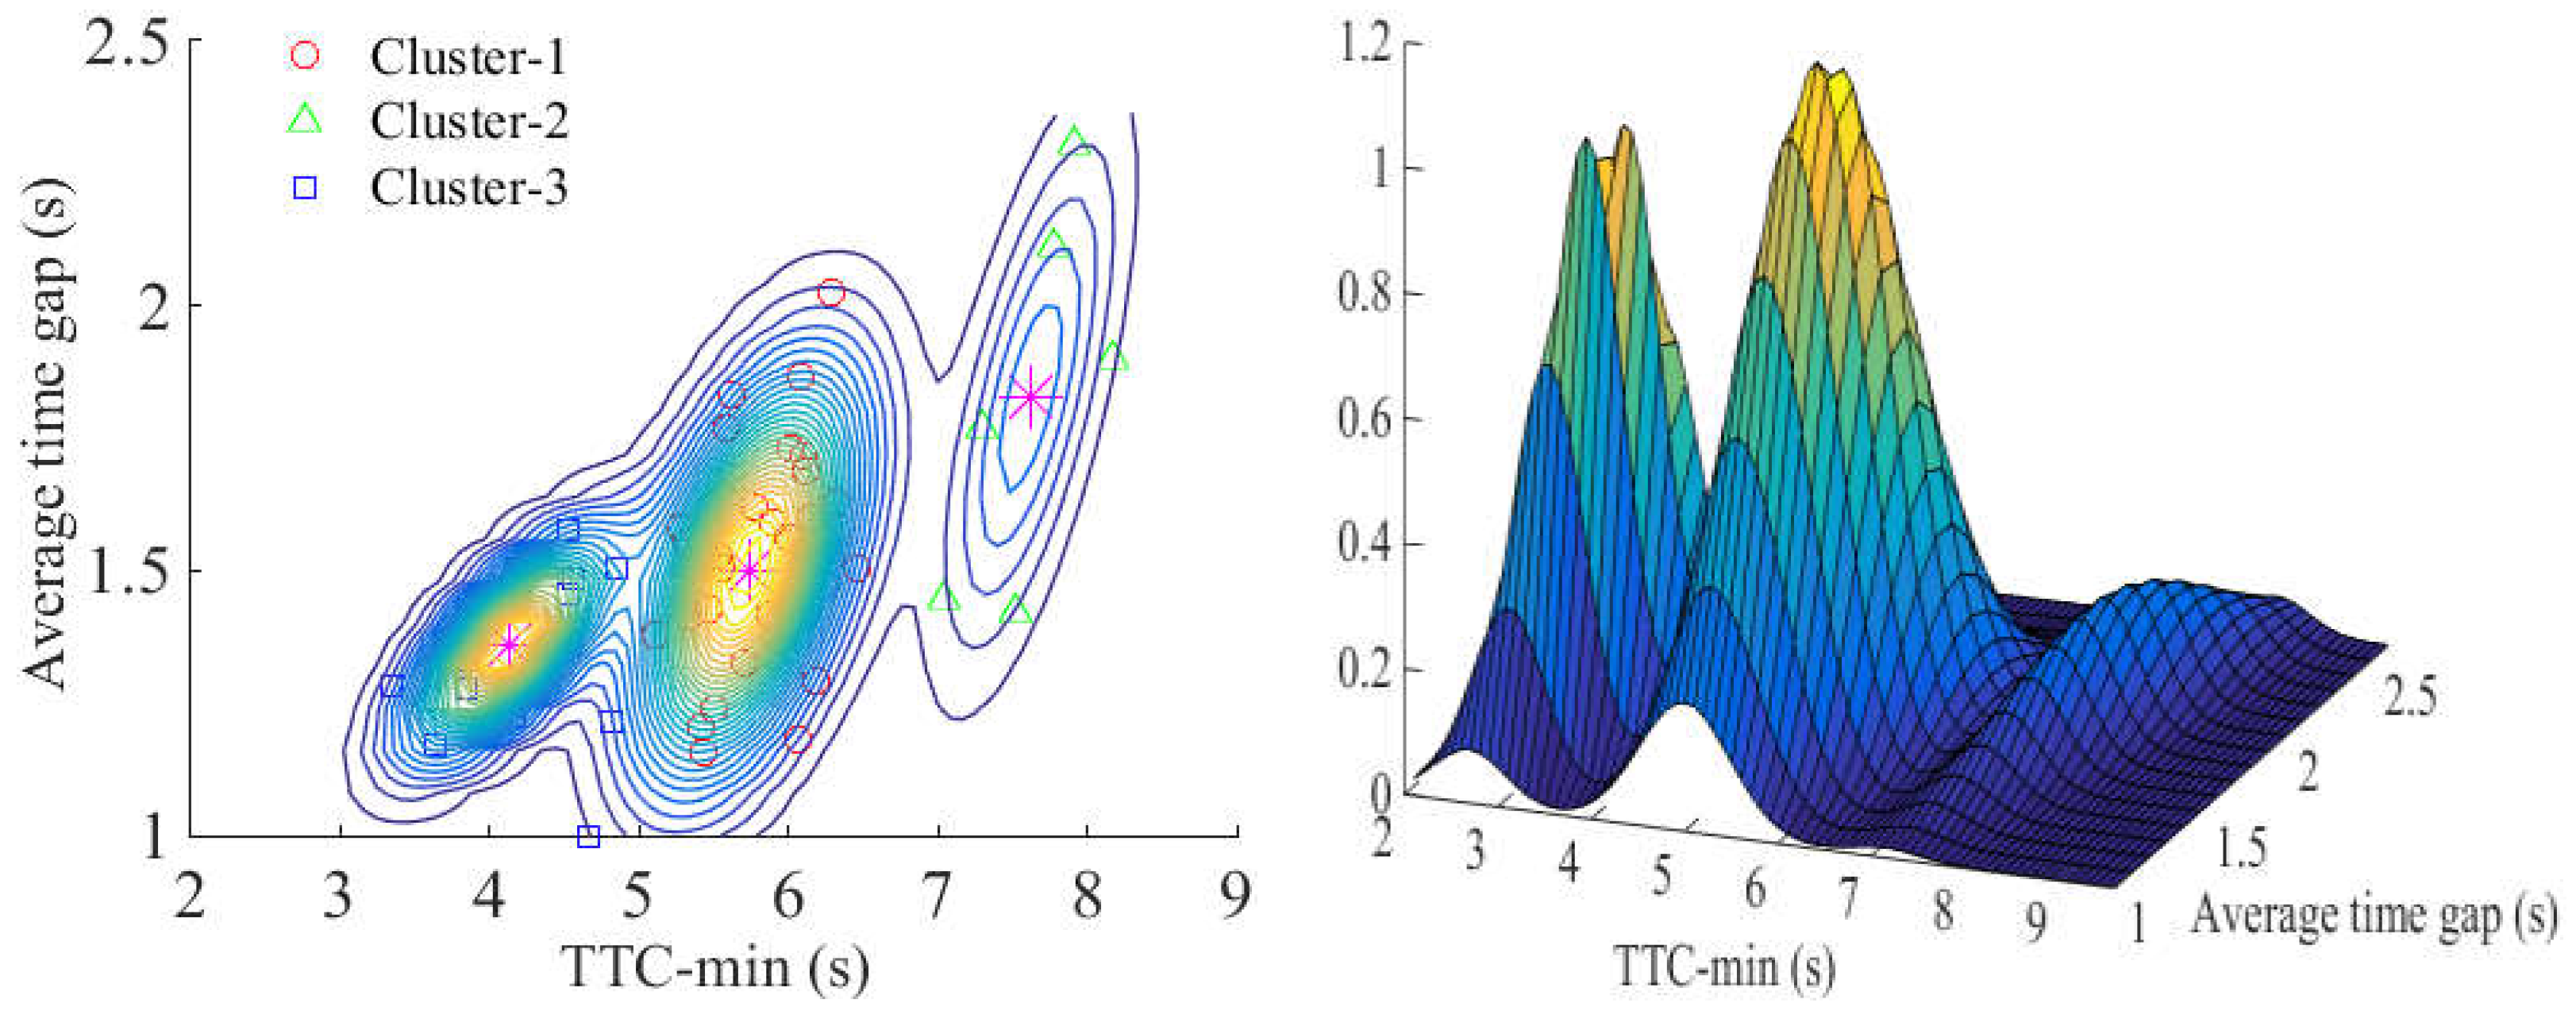
3.3. Clustering Results and Verification

As mentioned in Section 3.2, the time gap and the TTC are used as the safety indicators in lane changes. In addition, studies have shown that the average time gap can be used as the driving style classification indicator in lane-changing situations [35], and the minimum time to collision (TTC_min) can be used as the safety and warning indicator in the longitudinal direction [36]. To this end, the average time gap and the average TTC_min are used as the inputs of the clustering model established in Section 3.1, and drivers are classified into different driving styles (conservative drivers, calm drivers, and aggressive drivers) based on the number of clusters used in related studies [21,27,37]. The average time gap and average TTC_min are selected as two-dimensional variables to establish the clustering model considering driving styles in lane-changing situations. The contour map and surface diagram of the GMM model based on the k-means clustering results are depicted in Figure 9.
To avoid the influence of the samples near the cluster boundary on the subsequent analysis of warning rules, the typical samples with high probabilities were selected as the final clustering results according to the probability of every data point in each Gaussian model. Based on this, 12 drivers, 18 drivers, and 6 drivers were selected and respectively classified into the aggressive group, calm group, and conservative group. The clustering results of driving styles in lane-changing situations are shown in Table 1, and the frequencies in the different average time gap ranges and average TTC_min ranges during lane changes for the three types of drivers are depicted in Figure 10.
Furthermore, to verify the effectiveness of the clustering model built here, the distributions of the lane-changing durations for three types of drivers are presented in Figure 11. As can be seen from Figure 11, a significant difference (F = 93.47, p < 0.001) existed in the lane-changing durations for the three types of drivers. The results show that the peak frequencies of the lane-changing durations for aggressive drivers, calm drivers, and conservative drivers are 3–4 s, 4–5 s, and 5–6 s, respectively. Therefore, it can be concluded that the clustering model established in this paper has a good effect on the driving style classification in lane-changing situations based on the distributions of the average time gap, average TTC_min, and lane-changing durations for the three types of drivers.

4. Lane-Changing Warning Model Considering Different Driving Styles

As mentioned in Section 3.2, the time gap and TTC are used as the safety indicators in lane changes, and the time gap is recommended for the lane-changing analysis when the relative speed is greater than −15 km/h, and it is appropriate to use the TTC when the relative speed is less than −15 km/h. Considering that the lane-changing warning system usually starts to work after exceeding a certain speed value, this study selects the value of speed greater than 48 km/h (30 mph) for further lane-changing analysis and warning model construction by referring to a naturalistic driving research report [31].
In addition, many lane-changing studies only emphasize the warning analysis when the FV in the adjacent lane is faster than the SV, while neglecting the risk in the lane-changing situation when the SV is faster than the FV in the adjacent lane. However, according to the result of the lane-changing analysis in this study, safety cannot be guaranteed when the SV is faster than the FV. On the contrary, there are a large number of lane-changing situations with a relatively large deceleration of the FV when the SV conducts lane changes. Therefore, the lane-changing situation when the SV is faster than the FV in the adjacent lane is also considered and analyzed in this study to be used for the lane-changing analysis and warning model construction. According to the definition of relative speed in Section 3.2, the relative speed is negative when the FV is faster than the SV and is positive when the SV is faster than the FV.

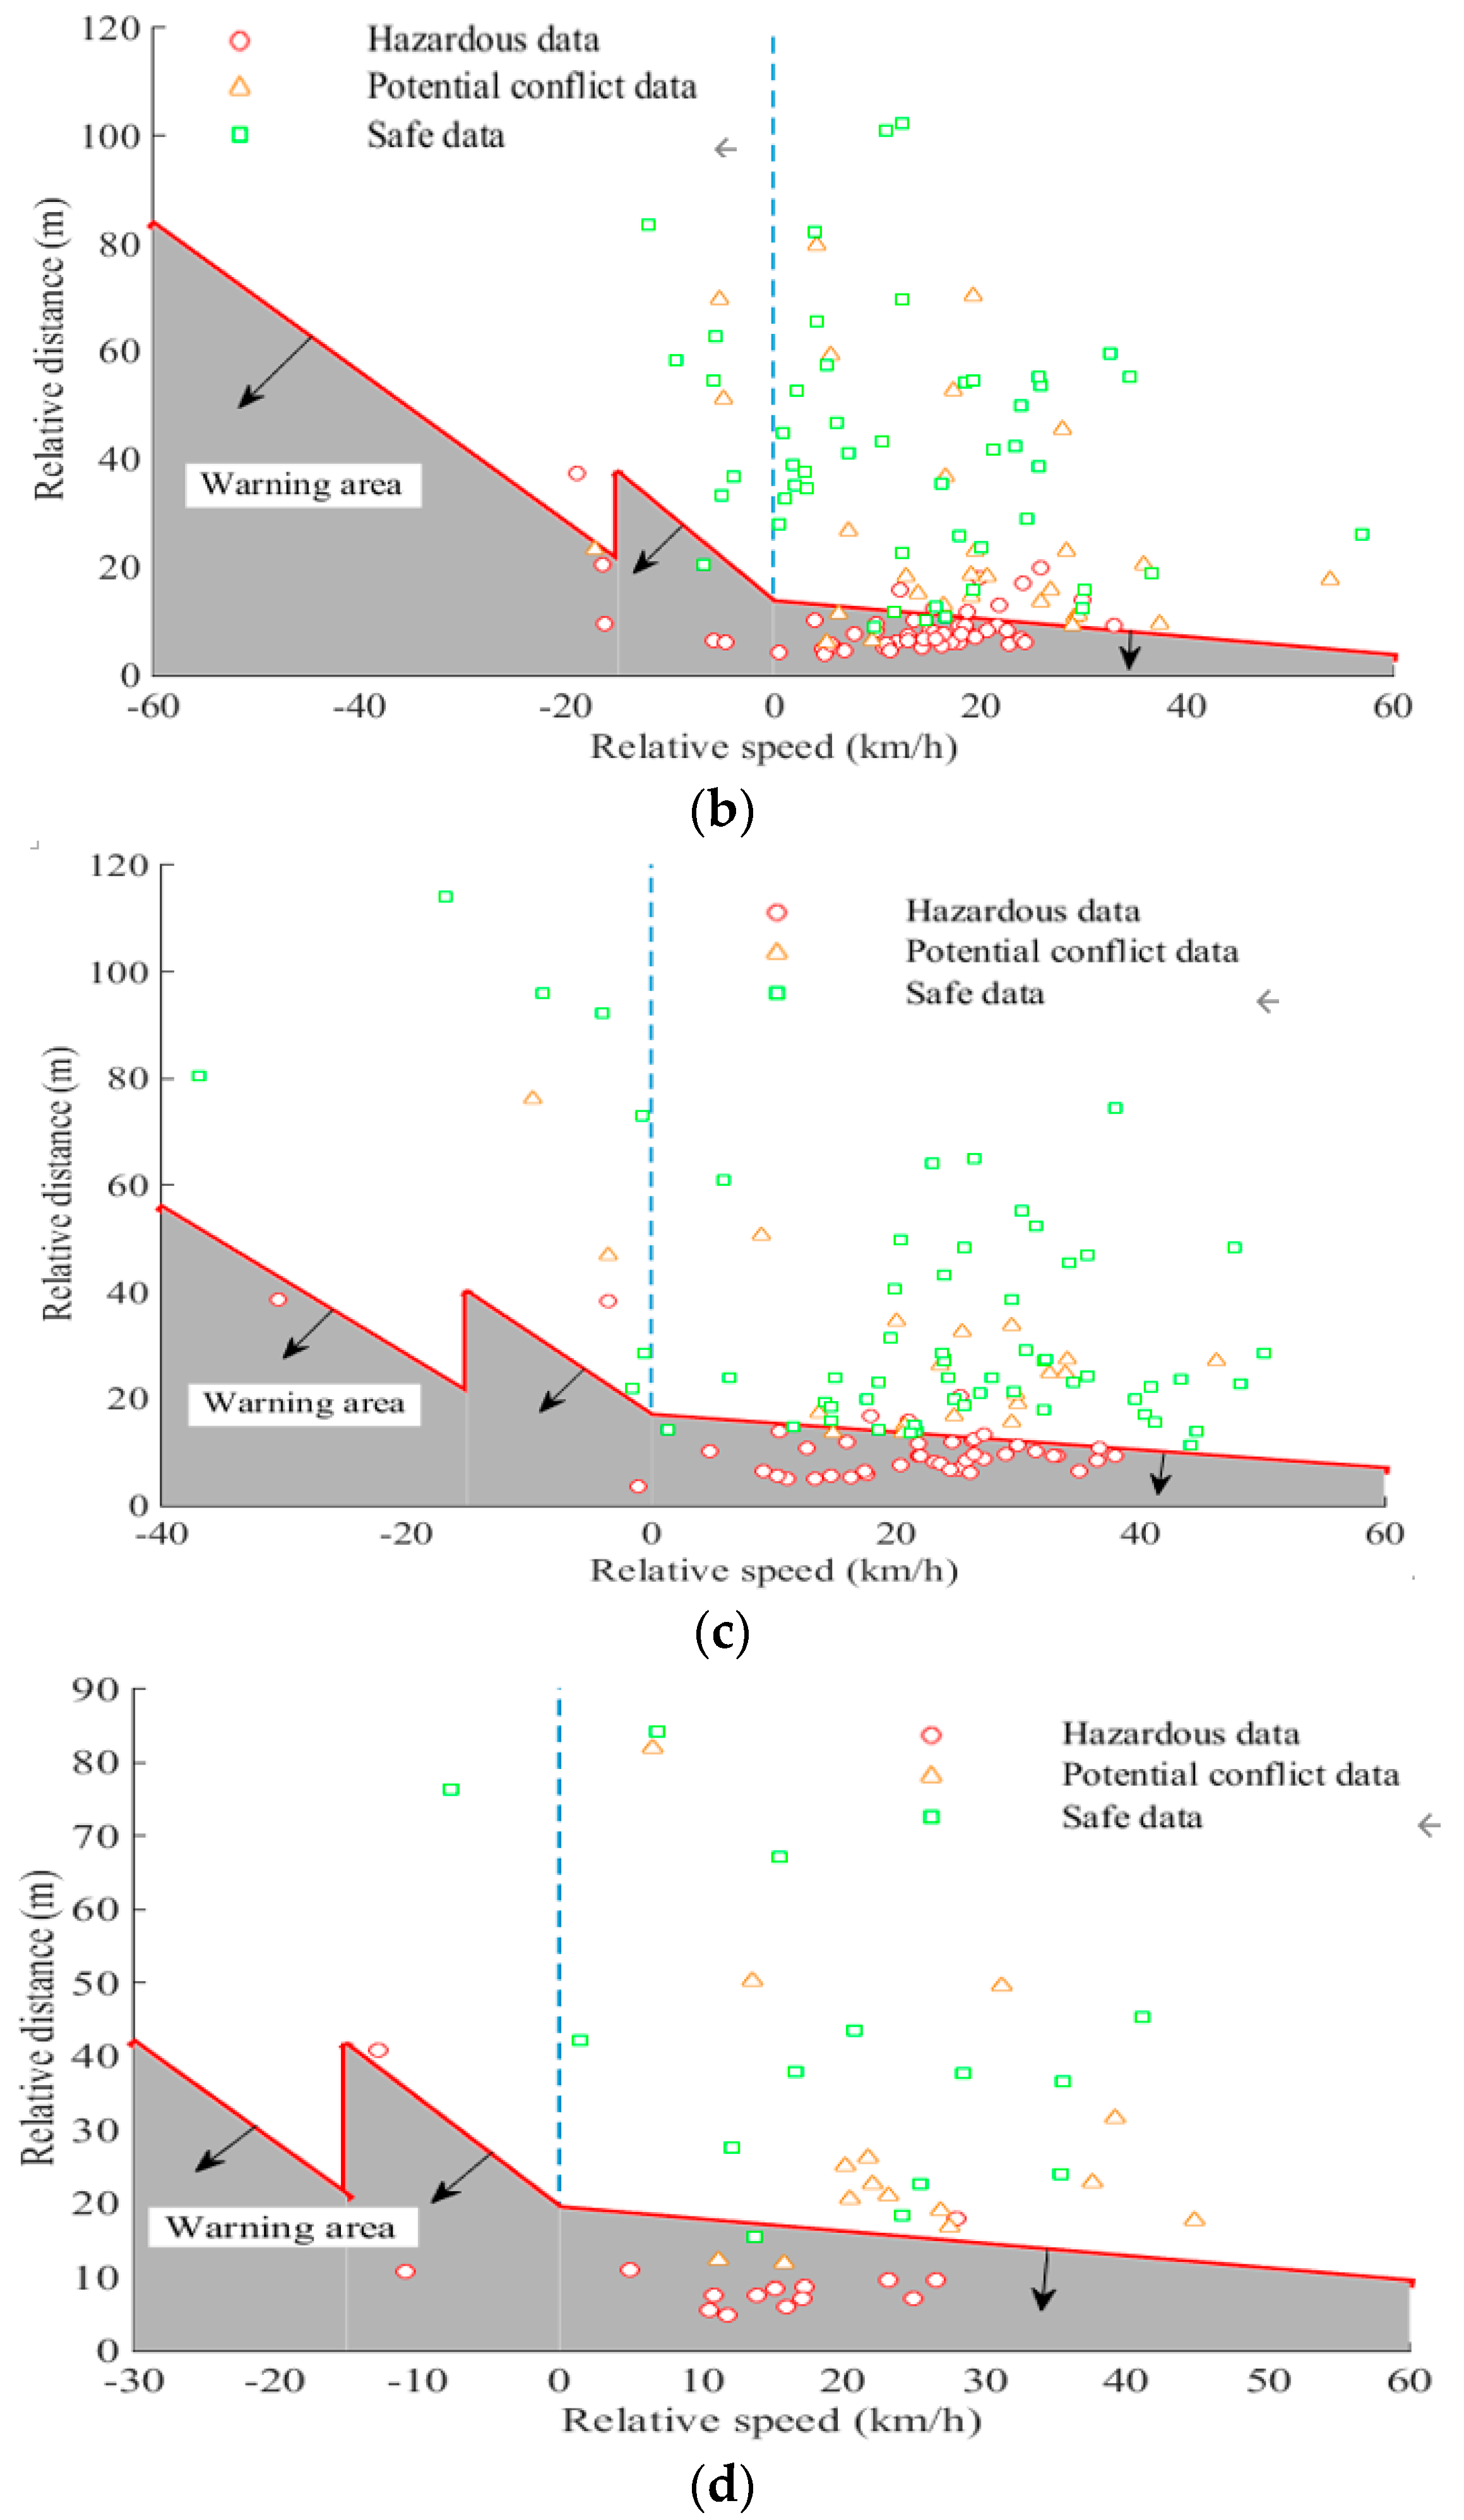
4.1. Lane-Changing Safety Distance Model

(1)
Ensure that the SV is always in front of the FV during lane changes
From the perspective of vehicle kinematics, the SV should always be in front of the FV throughout the entire process of lane changing. The kinematic relationship between these two vehicles is shown in Figure 12.
In Figure 12, DR is the longitudinal distance between the SV and the FV at the starting point of lane changes, DS is the longitudinal distance when the SV completely enters the adjacent lane, DF is the longitudinal distance of the FV, DW is the width of the SV, and θ is the angle between the front of the SV and the boundary line of the adjacent lane.
Some requirements should be met to ensure that the FV is always behind the SV during the lane-changing process. Specifically,
D R + D S 1 2 D W sin θ D F
In other words, the longitudinal distance between the SV and the FV at the starting point of the lane changes should be met:
D R D F + 1 2 D W sin θ D S
Therefore, the distance between these two vehicles at the starting point of lane changes should be guaranteed: Max{DR,0}. That is to say, if the FV cannot keep up with the SV during the entire lane-changing process, the minimum distance between these two vehicles at the starting point of lane changes can be set to be zero.
(2)
Ensure a safety distance between the SV and the FV after entering the adjacent lane
After meeting the requirements in (1), this can only theoretically guarantee the safety in the process of lane changing. However, in the actual process of lane changing, it is nearly impossible for drivers to accept that the distance between these two vehicles is close to zero, especially under high-speed conditions. If the longitudinal distance between these two vehicles is too small after entering the adjacent lane, there is still a greater risk of rear-end collision. To avoid collisions between these two vehicles throughout the lane-changing process, a safety distance should be maintained between these two vehicles after entering the adjacent lane, that is, a safety distance model needs to be added after the SV changes lanes. In general, commonly used safety distance models include the ISO 15623 forward collision warning model, safety distance model based on the time gap, and classic safety distance models, such as the Mazda model, Honda model, Berkeley model, and California model [38,39,40]. Given that the time gap is set to be one of the safety indicators for the lane-changing analysis in Section 3.2, a safety distance model based on the time gap is selected in this study. To ensure a low rate of false alarm, a safety distance model with a time gap value of 0.6 s is used here according to relevant literature [11].
In Figure 13, B0 is the relative distance between the SV and the FV after entering the adjacent lane. BS is the travelling distance of the SV, and BF is the travelling distance of the FV. To avoid possible collisions between two vehicles after entering the adjacent lane, the following conditions should be met:
B 0 + B S B F
Combined with the safety distance model with the time gap, B 0 should meet the following conditions:
B 0 T ( v F + a F t )
To summarize, throughout the lane-changing process, it is ensured that the SV is always in front of the FV in the adjacent lane, and there is a certain distance between two vehicles. Thus, the minimum safety distance model can ultimately be obtained as follows:
DSS = Max { D R , 0 } + B 0
Namely,
DSS = Max { ( v F v S ) t + 1 2 ( a F a S ) t 2 + 1 2 D W sin θ , 0 } + T ( v F + a F t ) = Max { Δ v t + 1 2 ( a F a S ) t 2 + 1 2 D W sin θ , 0 } + T ( v F + a F t )
where v S denotes the speed of the SV at the starting point of lane changing; v F is the speed of the FV when the SV starts to change lanes; Δ v is the relative speed of two vehicles; a S is the acceleration of the SV; a F is the acceleration of the FV; D W is the width of the SV (1.8 m); θ is the angle between the front of the SV and the boundary line of the adjacent lane; t is the duration time of lane changes; and T is the value of the time gap used here (0.6 s).

4.2. Lane-Changing Warning Model

Considering that the variations of acceleration values are not obvious for the SV and the FV in the process of lane changes, the majority of the acceleration values are distributed in the range of −0.5–0.5 m/s2, that is, most drivers do not have obvious acceleration or deceleration operations during lane changes, as shown in Figure 14. Based on this, the minimum safety distance model described in Section 4.1 is then simplified, and it is assumed that the SV and the FV maintain a constant speed during lane changes. That is to say, the acceleration values of the SV and the FV are set to be zero.
Furthermore, the speed of the SV during lane changes is divided into four ranges: ≤70 km/h, 70–90 km/h, 90–110 km/h, and ≥110 km/h. Through data analysis and calculation, the average duration time of lane changes in each speed range is 5.3 s, 5.1 s, 4.9 s, and 4.7 s, respectively. The average speed during lane changes in each speed range is 60 km/h, 79 km/h, 99 km/h, and 116 km/h, respectively. θ is set to 1° by referring to the results obtained by [11]. The simplified safety distance model for the lane-changing analysis is presented in Formula (12), and the safety distance model in different speed ranges is obtained, as shown in Table 2.
DSS = { Δ v t + 0.9 sin 1 ° + 0.6 ( v S Δ v )   Δ v < 0   0.6 ( v S Δ v )   Δ v 0
The model described above is a safety distance model based on the time gap for lane-changing analysis. In addition, the TTC is also commonly used as the warning indicator for lane-changing analysis in current studies, such as the lane-changing warning model with a threshold of 3 s or 5 s [11,31,41]. According to the results obtained in Section 3.2, the TTC is used as the safety indicator when the relative speed is less than −15 km/h, and the time gap is recommended as the safety indicator when the relative speed is greater than −15 km/h (negative by definition). Hence, the safety distance model based on the time gap and the TTC model are combined in this study, and a lane-changing warning model under different relative speed ranges is ultimately established, as shown in Table 3.

4.3. Recognition Results of Lane-Changing Warning Model

The lane-changing warning model built above can give a warning to the data located in the warning area. However, it should be taken into consideration that there is no data record specifically for lane-changing warning during the process of data collection in the real road test. To this end, the lane-changing data are classified into three categories according to the acceleration value of the FV when the SV starts to change lanes to verify the validity of the warning model. That is, the acceleration value of the FV less than −0.5 m/s2 is used as the hazard perception threshold, and the lane-changing data are classified into the hazardous area [42,43]; data with slight braking (−0.5 < aF ≤ −0.15 m/s2) is classified into the potential conflict area [44]; and data with an acceleration value above −0.15 m/s2 is considered as safe lane-changing data and is classified into the safety area. The distribution of the acceleration of the FV when the SV starts to change lanes is shown in Figure 15 and Figure 16.
When the TTC threshold is selected to be 5 s, the recognition accuracy is higher than that when the TTC threshold is 3 s under four different speed conditions after calculation. Therefore, the parameter T is set to be 5 s, and the lane-changing warning model can ultimately be obtained.
In addition, in the process of lane changing, if the distance between the SV and the FV is less than the minimum safety distance, the lane-changing warning model will issue an early warning. Based on the established lane-changing warning model, together with the hazardous and potential conflict/safe lane-changing data defined in this section, the recognition results under different speed conditions are obtained, as shown in Figure 17.
Table 4 shows the recognition results of the lane-changing warning model under different speed conditions. As can be seen from Table 4, the recognition accuracy of the lane-changing warning model under different speed conditions is 76.1%, 79.3%, 87.9%, and 68.6%, respectively. To summarize, the overall recognition accuracy of the lane-changing warning model at all speed ranges is 79.5% after calculation. However, when compared with the warning model proposed here, the recognition accuracy of the traditional warning model with TTC threshold of 3 s or 5 s is much lower (less than 10%) because it may neglect the potential risk when the SV is faster than the FV during lane changes.
Furthermore, based on the lane-changing data from the three types of drivers obtained in Section 3.3, the recognition accuracy of the lane-changing warning model for aggressive drivers under different speed conditions is 76.2%, 83.9%, 92.9%, and 81.3%. Likewise, the recognition accuracy of the lane-changing warning model for calm drivers under different speed conditions is 78.7%, 76.3%, 80%, and 70%. The recognition accuracy of the lane-changing warning model for conservative drivers under different speed conditions is 75%, 75%, 100%, and 50%. When considering different driving styles, the recognition accuracy of the lane-changing warning model for aggressive, calm, and conservative drivers at all speed ranges is 84%, 78%, and 79.2%, respectively. The overall recognition accuracy of these three types of drivers is 81%, as shown in Table 5. Therefore, the overall recognition accuracy is improved after drivers are classified into different driving styles, and the recognition results in different speed ranges for aggressive drivers are shown in Figure 18.
According to the results described above, when compared with the other two types of drivers, the lane-changing warning model established in this paper has a better recognition accuracy for aggressive drivers, which provides a technical means to establish a personalized lane-changing warning model considering driving styles under different relative speed conditions.

5. Conclusions

This study collected the lane-changing data of 50 participants from a real road driving test that was conducted in China and analyzed the characteristics of lane-changing events under different relative speed conditions when there was a following vehicle in the adjacent lane. The Gaussian mixture model with the inputs of the k-means algorithm was used for clustering, and drivers were classified into three types of driving styles (aggressive, calm, and conservative drivers) based on two-dimensional variables: average time gap and average minimum time to collision. Furthermore, the lane-changing warning model considering driving styles under different relative speed conditions was ultimately established. The results from this study can be summarised as follows:
  • For different speed ranges of the SV, the time to collision was relatively stable under high relative speed conditions (<−15 km/h), while the time gap was stable under low relative speed conditions (≥−15 km/h).
  • A significant difference existed in the lane-changing durations for the three types of drivers, and the peak frequencies of the lane-changing duration for aggressive drivers, calm drivers, and conservative drivers were 3–4 s, 4–5 s, and 5–6 s, respectively.
  • The overall recognition accuracy of the lane-changing warning model considering driving styles was 81%, and the overall recognition accuracy of the model for aggressive drivers was relatively higher at 84% when compared with the other two types of drivers.
The main contribution of this study lies in the combination of taking different relative speed conditions into consideration for the risk analysis of lane-changing behaviors and establishing the lane-changing warning model considering driving styles. Few studies have been conducted on lane-changing warning models considering driving styles under different relative speed ranges, especially when the SV is faster than the FV in the adjacent lane during lane changes. In addition, the propoed clustering algorithm in this study provides a new perspective on driving style classification and a reference for parameter setting in the development of a personalized driver assistance system.
The limitations of this work include the following. Nearly all of the participants recruited in the test were male drivers, which is because only three female drivers had signed up to participate in the experiment despite efforts to recruit both genders. Therefore, the results obtained here may only represent the characteristics of this specific group of drivers. In addition, one may question that the recognition accuracy of the lane-changing warning model in the speed range above 110 km/h is relatively low (68.6%) when compared with the values under other speed conditions (76.1%, 79.3%, and 87.9%). The reason for this difference is mainly because not many data points were extracted within the speed range above 110 km/h.
The results of this study can provide technical support for the development of a lane-changing warning system that can meet the needs and driving experiences for different types of drivers, improving user acceptance of the advanced driver assistance system and the human-like automatic driving system. In the future, the authors would like to recruit more female participants to make the ratio of samples more balanced, as well as to increase the number of samples. Furthermore, in future studies, the authors would also like to more closely look at the environmental influences on driving behavior (e.g., in different road conditions) and move the focus from an offline driving behavior analysis towards real-time identification and early warning.

Author Contributions

Conceptualization, T.L. (Tong Liu) and R.F.; data creation, C.W.; formal analysis, T.L. (Tong Liu); funding acquisition, T.L. (Tong Liu) and R.F.; investigation, Y.M. and C.W.; methodology, C.W. and R.F.; visualization, T.L. (Tong Liu) and Z.L.; Supervision, R.F. and C.W.; writing—original draft, T.L. (Tong Liu); writing—review and editing, C.W., Y.M., Z.L. and T.L. (Tangzhi Liu) All authors have read and agreed to the published version of the manuscript.

Funding

This work was supported by the National Natural Science Foundation of China (Grants 52172341, 52002319); Science and Technology Research Program of Chongqing Education Commission of China. (KJQN202100719); Opening Project of the Key Laboratory for Automotive Transportation Safety Enhancement Technology of the Ministry of Communication (300102221504).

Institutional Review Board Statement

Not applicable.

Informed Consent Statement

Not applicable.

Data Availability Statement

The data used to support the findings of this study are available from the corresponding author upon reasonable request.

Acknowledgments

We would like to thank the Key Laboratory for Automotive Transportation Safety Enhancement Technology of the Ministry of Communication (Chang’an University), which provided a platform for our research.

Conflicts of Interest

The authors declare no conflict of interest.

References

  1. Zhao, D.; Lam, H.; Peng, H.; Bao, S.; LeBlanc, D.J.; Nobukawa, K.; Pan, C.S. Accelerated evaluation of automated vehicles safety in lane-change scenarios based on importance sampling techniques. IEEE Trans. Intell. Transp. Syst. 2017, 18, 595–607. [Google Scholar] [CrossRef] [PubMed]
  2. He, Y.; Wang, P.; Chan, C.Y. Understanding lane change behavior under dynamic driving environment based on real-world traffic dataset. In Proceedings of the 2019 5th International Conference on Transportation Information and Safety (ICTIS), Liverpool, UK, 14–17 July 2019; pp. 1092–1097. [Google Scholar]
  3. Queensland Transport. Road Traffic Crashes in Queensland: A Report on the Road Toll 2009; Customer Services, Safety & Regulation Division, Department of Transport and Main Roads: Brisbane, Australia, 2012.
  4. Traffic Management Bureau of the Public Security Ministry. Annual Statistic Year book of Road Traffic Accidents in China (2015); Traffic Management Bureau of the Public Security Ministry: Wuxi, China, 2016.
  5. Hou, Y.; Edara, P.; Sun, C. Situation assessment and decision making for lane change assistance using ensemble learning methods. Expert Syst. Appl. 2015, 42, 3875–3882. [Google Scholar] [CrossRef]
  6. Hang, L.; Chen, C.; Zhang, J.; Fang, S.; You, J.; Guo, J. Modeling lane-changing behavior in freeway off-ramp areas from the shanghai naturalistic driving study. J. Adv. Transp. 2018, 2018, 8645709. [Google Scholar]
  7. Ning, H.; Yu, Y.; Bai, L. Unsafe Behaviors Analysis of Sideswipe Collision on Urban Expressways Based on Bayesian Network. Sustainability 2022, 14, 8142. [Google Scholar] [CrossRef]
  8. Ponziani, R. Turn Signal Usage Rate Results: A Comprehensive Field Study of 12,000 Observed Turning Vehicles; SAE Technical Paper; SAE: Warrendale, PA, USA, 2012. [Google Scholar]
  9. Wang, X.; Yang, M.; Hurwitz, D. Analysis of cut-in behavior based on naturalistic driving data. Accid. Anal. Prev. 2019, 124, 127–137. [Google Scholar] [CrossRef]
  10. Fitch, G.M.; Hankey, J.M. Investigating improper lane changes: Driver performance contributing to lane change near-crashes. Proc. Hum. Factors Ergon. Soc. Annu. Meet. 2012, 56, 2231–2235. [Google Scholar] [CrossRef]
  11. Wang, C.; Song, D.; Fu, R.; Guo, Y.; Xu, Y. Identification of lane change safety characteristic of large commercial bus on expressway. China J. Highw. Transp. 2018, 31, 229–238. [Google Scholar]
  12. Alonso, J.D.; Vidal, E.R.; Rotter, A.; Muhlenberg, M. Lane-change decision aid system based on motion-driven vehicle tracking. IEEE T. Veh. Technol. 2008, 57, 2736–2746. [Google Scholar] [CrossRef]
  13. Khan, A.; Bacchus, A.; Erwin, S. Surrogate safety measures as aid to driver assistance system design of the cognitive vehicle. IET Intell. Transp. Syst. 2014, 8, 415–424. [Google Scholar] [CrossRef]
  14. Paul, A.; Chauhan, R.; Srivastava, R.; Baruah, M. Advanced Driver Assistance Systems (No. 2016-28-0223); SAE Technical Paper; SAE: Warrendale, PA, USA, 2016. [Google Scholar]
  15. Tijerina, L. Operational and behavioral issues in the comprehensive evaluation of lane change crash avoidance systems. Transp. Hum. Factors 1999, 1, 159–175. [Google Scholar] [CrossRef]
  16. Fu, R.; Ma, Y.; Guo, Y.; Yuan, W.; Sun, H. Lane change warning rules based on real vehicle test data. J. Jilin Univ. Eng. Technol. Ed. 2015, 45, 379–388. [Google Scholar]
  17. Mar, J.; Lin, H.T. The car-following and lane-changing collision prevention system based on the cascaded fuzzy inference system. IEEE Trans. Veh. Technol. 2005, 54, 910–924. [Google Scholar] [CrossRef]
  18. Kim, T.; Lovell, D.J.; Kim, H.; Oh, C. Empirical results of effects of various causal factors on car-Following behavior. Transp. Res. Rec. 2010, 2188, 174–186. [Google Scholar] [CrossRef]
  19. Sagberg, F.; Selpi Piccinini, G.F.B.; Engstrom, J. A review of research on driving styles and road safety. Hum. Factors 2015, 57, 1248–1275. [Google Scholar] [CrossRef] [PubMed]
  20. Bengler, K.; Dietmayer, K.; Farber, B.; Maurer, M.; Stiller, C.; Winner, H. Three decades of driver assistance systems: Review and future perspectives. IEEE Intell. Transp. Syst. Mag. 2014, 6, 6–22. [Google Scholar] [CrossRef]
  21. Liu, T.; Fu, R.; Ma, Y.; Li, Z.; Cheng, W. Car-following warning rules considering driving styles. China J. Highw. Transp. 2020, 33, 170–180. [Google Scholar]
  22. Lotfi, R.; Ghatee, M. Smartphone based Driving Style Classification Using Features Made by Discrete Wavelet Transform, Human-Computer Interaction. arXiv 2018, arXiv:1803.06213. [Google Scholar]
  23. Johnson, D.A.; Trivedi, M.M. Driving style recognition using a smartphone as a sensor platform. In Proceedings of the 14th International IEEE Conference on Intelligent Transportation Systems (ITSC), Washington, DC, USA, 5–7 October 2011; pp. 1609–1615. [Google Scholar]
  24. Takamatsu, Y.; Takada, Y.; Kishi, N. A narrow road driving assistance system based on driving style. In Proceedings of the 2017 IEEE International Conference on Systems, Man, and Cybernetics (SMC), Banff, AB, Canada, 5–8 October 2017; pp. 1669–1674. [Google Scholar]
  25. Zhang, Y.; Lin, W.C.; Chin, Y.K.S. A pattern-recognition approach for driving skill characterization. IEEE Trans. Intell. Transp. Syst. 2010, 11, 905–916. [Google Scholar] [CrossRef]
  26. Ren, G.; Zhang, Y.; Liu, H.; Zhang, K.; Hu, Y. A new lane-changing model with consideration of driving style. Int. J. Intell. Transp. Syst. Res. 2019, 17, 181–189. [Google Scholar] [CrossRef]
  27. Hou, H.; Jin, L.; Guan, Z.; Du, H.; Li, J. Effects of Driving Style on Driver Behavior. China J. Highw. Transp. 2018, 31, 18–27. [Google Scholar]
  28. Wang, C.; Sun, Q.; Guo, Y.; Fu, R.; Yuan, W. Improving the user acceptability of advanced driver assistance systems based on different driving styles: A case study of lane change warning systems. IEEE Trans. Intell. Transp. Syst. 2019, 21, 4196–4208. [Google Scholar] [CrossRef]
  29. Dang, R.; Ding, J.; Su, B.; Yao, Q.; Tian, Y.; Li, K. A lane change warning system based on V2V communication. In Proceedings of the 17th International IEEE Conference on Intelligent Transportation Systems (ITSC), Qingdao, China, 8–11 October 2014; pp. 1923–1928. [Google Scholar]
  30. Satzoda, R.K.; Gunaratne, P.; Trivedi, M.M. Drive quality analysis of lane change maneuvers for naturalistic driving studies. In Proceedings of the 2015 IEEE Intelligent Vehicles Symposium (IV), Seoul, Korea, 28 June–1 July 2015; pp. 654–659. [Google Scholar]
  31. Lee, S.E.; Olsen, E.C.; Wierwille, W.W. A Comprehensive Examination of Naturalistic Lane-Changes; National Highway Traffic Safety Administration: Washington, DC, USA, 2004.
  32. McLachlan, G.; Peel, D. Finite Mixture Models; Wiley-Interscience: Hoboken, NJ, USA, 2000. [Google Scholar]
  33. Sun, X.; Wu, Z.; Lv, X.; Chen, Z. Improved Gaussian Mixture Model Based Moving Target Detection. Comput. Eng. Des. 2014, 35, 914–917. [Google Scholar]
  34. Liu, T. Comparison of Car-Following Behavior in Terms of Safety Indicators Between China and Sweden. IEEE Trans. Intell. Transp. Syst. 2020, 21, 3696–3705. [Google Scholar] [CrossRef]
  35. Doshi, A.; Trivedi, M.M. Examining the impact of driving style on the predictability and responsiveness of the driver: Real-world and simulator analysis. In Proceedings of the 2010 IEEE Intelligent Vehicles Symposium, La Jolla, CA, USA, 21–24 June 2010; pp. 232–237. [Google Scholar]
  36. Aust, M.L.; Engström, J.; Viström, M. Effects of forward collision warning and repeated event exposure on emergency braking. Transp. Res. Part F 2013, 18, 34–46. [Google Scholar] [CrossRef]
  37. Feng, F.; Bao, S.; Sayer, J.R.; Flannagan, C.A.; Manser, M.; Wunderlich, R. Can vehicle longitudinal jerk be used to identify aggressive drivers? An examination using naturalistic driving data. Accid. Anal. Prev. 2017, 104, 125–136. [Google Scholar] [CrossRef]
  38. ISO 15623:2002-10; Transport Information and Control Systems-Forward Vehicle Collision Warning Contents. ISO: Geneva, Switzerland, 2002; Volume 10.
  39. Vadeby, A. Modeling of relative collision safety including driver characteristics. Accid. Anal. Prev. 2004, 36, 909–917. [Google Scholar] [CrossRef] [PubMed]
  40. Xiong, X.; Wang, M.; Cai, Y.; Chen, L.; Farah, H.; Hagenzieker, M.P. A forward collision avoidance algorithm based on driver braking behavior. Accid. Anal. Prev. 2019, 129, 30–43. [Google Scholar] [CrossRef]
  41. Jiang, R.; Zhu, S.; Chang, H.; Wu, J.; Ding, N.; Liu, B.; Qiu, J. Determining an Improved Traffic Conflict Indicator for Highway Safety Estimation Based on Vehicle Trajectory Data. Sustainability 2021, 13, 9278. [Google Scholar] [CrossRef]
  42. Ni, J.; Liu, Z.; Tu, X. Safety prediction model of lane changing based on driver assistance system. J. Transp. Syst. Eng. Inf. Technol. 2016, 16, 95–100. [Google Scholar]
  43. Fu, R.; Liu, T.; Guo, Y.; Zhang, S.; Cheng, W. A case study in China to determine whether GPS data and derivative indicator can be used to identify risky drivers. J. Adv. Transp. 2019, 2019, 9072531. [Google Scholar] [CrossRef]
  44. Mori, M.; Miyajima, C.; Hirayama, T.; Kitaoka, N.; Takeda, K. Integrated modeling of driver gaze and vehicle operation behavior to estimate risk level during lane changes. In Proceedings of the 16th International IEEE Conference on Intelligent Transportation Systems (ITSC 2013), Hague, The Netherlands, 6–9 October 2013; pp. 2020–2025. [Google Scholar]
Figure 1. Distributions of the ages and driving experiences of the 50 drivers. (a) Age distribution (b) Driving experience distribution.
Sustainability 14 09938 g001
Figure 2. Test routes.
Sustainability 14 09938 g002
Figure 3. Instrumented vehicle.
Sustainability 14 09938 g003
Figure 4. Lane-changing process.
Sustainability 14 09938 g004
Figure 5. Average gap distance and average speed.
Sustainability 14 09938 g005
Figure 6. Average time gap and average speed.
Sustainability 14 09938 g006
Figure 7. Average TTC and average speed.
Sustainability 14 09938 g007
Figure 8. Average TTC (left) and time gap (right) for various relative speed and speed ranges.
Sustainability 14 09938 g008
Figure 9. Contour map (left) and surface diagram (right) of the GMM model based on the k-means clustering results.
Sustainability 14 09938 g009
Figure 10. Distributions of average time gap (left) and TTC_min (right) for three types of drivers.
Sustainability 14 09938 g010
Figure 11. Distributions of lane-changing durations for the three types of drivers.
Sustainability 14 09938 g011
Figure 12. The kinematic relationship between the SV and the FV during lane changes.
Sustainability 14 09938 g012
Figure 13. Safety distance model based on the time gap after entering the adjacent lane.
Sustainability 14 09938 g013
Figure 14. Distributions of the FV (left) and the SV (right) acceleration values during lane changes.
Sustainability 14 09938 g014
Figure 15. Speed of the SV and Acceleration of the FV (Δv < 0).
Sustainability 14 09938 g015
Figure 16. Speed of the SV and Acceleration of the FV (Δv > 0).
Sustainability 14 09938 g016
Figure 17. Recognition results of the lane-changing warning model in different speed ranges. (a) vS. ≤ 70 km/h. (b) 70 < vS. ≤ 90 km/h. (c) 90 < vS. ≤ 110 km/h. (d) vS. > 110 km/h.
Sustainability 14 09938 g017aSustainability 14 09938 g017b
Figure 18. Recognition results in different speed ranges for aggressive drivers. (a) vs. ≤70 km/h. (b) 70< vs. ≤90 km/h. (c) 90< vs. ≤110 km/h. (d) vs. >110 km/h.
Sustainability 14 09938 g018aSustainability 14 09938 g018b
Table 1. Clustering results of driving styles.
Driving StylesDriver #sAverage Time Gap (s)Average TTC_Min (s)
Aggressive6, 7, 16, 17, 20, 22, 23, 26, 28, 40, 43, 501.364.21
Calm3, 4, 5, 9, 12, 14, 18, 21, 30, 32,
34, 35, 39, 41, 44, 45, 46, 47
1.555.84
Conservative2, 8, 15, 24, 25, 371.837.62
Table 2. Lane-changing safety distance model in different speed ranges.
Speed Ranges (km/h)Lane-Changing Safety Distance Model
v S ≤ 70 DSS = { 5.9   Δ v + 10                                     Δ v < 0 0.6   Δ v + 10                                     Δ v 0
70   <   v S ≤ 90 DSS = { 5.7   Δ v + 13.17                         Δ v < 0 0.6   Δ v + 13.17                         Δ v 0
90   <   v S ≤ 110 DSS = { 5.5   Δ v + 16.5                             Δ v < 0 0.6   Δ v + 16.5                             Δ v 0
v S > 110 DSS = { 5.3   Δ v + 19.33                       Δ v < 0 0.6   Δ v + 19.33                       Δ v 0
Table 3. Lane-changing warning model under different relative speed ranges.
Speed Ranges (km/h)Lane-Changing Warning Model
v S ≤ 70 DWS = { T Δ v Δ v < 15 5.9   Δ v + 10 15 Δ v < 0 0.6   Δ v + 10 Δ v 0
70   <   v S ≤ 90 DWS = { T Δ v Δ v < 15 5.7   Δ v + 13.17 15 Δ v < 0 0.6   Δ v + 13.17 Δ v 0
90   <   v S ≤ 110 DWS = { T Δ v Δ v < 15 5.5   Δ v + 16.5 15 Δ v < 0 0.6   Δ v + 16.5 Δ v 0
v S > 110 DWS = { T Δ v Δ v < 15 5.3   Δ v + 19.33 15 Δ v < 0 0.6   Δ v + 19.33 Δ v 0
Table 4. Confusion matrixes of lane-changing data under different speed conditions.
(a) vS ≤ 70 km/h
Warning AreaSafety Zone
Hazardous data 8321
Potential conflict/Safe data 26309
(b) 70 km/h < v ≤ 90 km/h
Warning AreaSafety Zone
Hazardous data 9628
Potential conflict/Safe data 25277
(c) 90 km/h < v ≤ 110 km/h
Warning AreaSafety Zone
Hazardous data 8024
Potential conflict/Safe data 11225
(d) v > 110 km/h
Warning AreaSafety Zone
Hazardous data 246
Potential conflict/Safe data 1145
Table 5. Confusion matrixes of lane-changing data for the three types of drivers.
Warning AreaSafety Zone
Hazardous data24369
Potential conflict/Safe data57692
Publisher’s Note: MDPI stays neutral with regard to jurisdictional claims in published maps and institutional affiliations.

