Article

Predicting Factors Influencing Preservice Teachers’ Behavior Intention in the Implementation of STEM Education Using Partial Least Squares Approach

1
School of Mathematical Sciences, Beijing Normal University, Beijing 100875, China
2
School of Mathematics and Statistics, Hunan Normal University, Changsha 410081, China
3
Mathematics Education Department, Universitas Syiah Kuala, Banda Aceh 23111, Indonesia
4
Fakultas Keguruan dan Ilmu Pendidikan, Universitas Jambi, Jambi 36122, Indonesia
*
Authors to whom correspondence should be addressed.
Sustainability 2022, 14(16), 9925; https://doi.org/10.3390/su14169925
Submission received: 29 June 2022 / Revised: 19 July 2022 / Accepted: 9 August 2022 / Published: 11 August 2022

Abstract

:
The integration of STEM education has been promoted to improve the quality of education in the 21st century, with its usage leading to emphasis on the factors influencing the intentions of preservice teachers. Therefore, this study aims to determine the factors influencing preservice teachers’ intentions, as well as the effects of gender and age on the implementation of STEM education. The Theory of Planned Behavior (TPB) was adopted to predict the relationship between knowledge, social influence, attitude, perceived usefulness, control, and behavioral intention (BI) of using STEM education among preservice secondary school teachers. A total of 30 item questionnaires on behavioral intentions were distributed to 201 respondents, with data being analyzed using the Structural Equation Model (SEM). The results showed that perceived usefulness had a positive significance, and a relationship with the attitudes of preservice teachers toward STEM education. Habit had a positive significance in influencing teachers’ behavioral intentions and implementation. Subjective norms did not have a significant correlation with BI and implementation. These results are recommended for providing solutions to analytical problems, and to successfully improve future learning through an educational approach.

1. Introduction

STEM education is rapidly becoming popular, globally accepted, and implemented in various countries, because of its innovative method of serving social and economic needs [1]. In this era, innovation is highly considered in various disciplines, as it provides solutions to complex realistic problems and supports sustainable development [2]. Several studies assumed that innovation breakthroughs were due to the combination of teams, ideas, and objects from different fields [1,3,4].
In 2015, STEM education was introduced in Indonesia and developed by the Southeast Asian Ministers of Education Organization (SEAMEO), although the implementation remains minimal and in the development stage [5,6]. This is considered one of the factors hindering the maximization of the educational approach, since it is based on the improvement of students’ literacy [7,8]. According to Bybee [9], STEM literacy is defined as the conceptual understanding, as well as the individualistic skills and abilities to overcome daily problems related to the educational approach and global issues. Few studies explain the patterns of increasing knowledge of STEM education and its implementation intentions by preservice teachers [10]. This indicates that the approach encourages uneducated teachers to combine many subject topics that are more challenging and frightening. A preservice teacher is defined as a person in a transition from a normal university student to a school educator. They are also known as novice teachers, who still need to learn more about the various approaches and media used to achieve educational goals. The enrichment of these teachers with abundant knowledge of learning models, approaches, and effective methods are carried out through STEM education. This is considered a vital element of any preservice teacher-training program, to improve their ability to meet the demands of 21st century education. Based on these descriptions, determination of the factors related to the attitudes of these teachers to STEM education is highly necessary, accompanied by the improvement patterns of its implementation. Therefore, this study aims to determine the factors influencing the intentions and attitudes of preservice teachers concerning implementing STEM (science, technology, engineering, and mathematics) education. Using this approach, the ability to teach is often a complex learning activity including various factors, due to being insufficient to only emphasize individual attitudes, as well as the knowledge of science, technology, engineering, and mathematics. From previous studies, TPB (Theory of Planned Behavior) [11] was modified by adding several important factors influencing the intention of the preservice teachers toward implementing STEM education [12]. When teachers have positive attitudes toward this approach, their creative and convergent thinking skills are found to increase due to their being important for teaching [1].
The questions evaluated in this study are observed as follows:
  • What are the significant positive factors influencing the preservice teachers’ attitudes toward STEM education?
  • What are the significant positive factors influencing the behavioral intention of preservice teachers to implement STEM education?
  • What are the factors with the highest positive significance on the attitudes of preservice teachers toward implementing STEM education?
  • What are the factors with the highest positive significance on the behavioral intention of preservice teachers toward implementing STEM education?
  • Do gender and age affect preservice teachers in STEM education?
The results are recommended for providing solutions to analytical problems and to successfully improve future learning through STEM education. It is also expected to provide a new perspective on the determination of previous studies. Additionally, the proposed model helps local governments, universities, and schools in identifying and predicting the patterns of improving the implementation of STEM education.

2. Theoretical Background and Hypothesis Development

2.1. STEM Education

In the last decade, STEM education has become an important learning approach based on having relationships with and influence on sustainable development goals [13,14,15]. This approach is the combination of skills and knowledge in science, technology, engineering, and mathematics education [3,16]. It is also defined as a learning approach with the most important goal being encouraging students to cooperate between disciplines, improve systematic thinking and communication skills, conduct analysis and produce projects, as well as enhance creativity and problem-solving techniques [17,18,19].
Education exhibits the importance of the professions within the science, technology, engineering, and mathematics sectors, indicating that the improvement and development of life are related to these study fields [20,21,22]. Moreover, technology has affected all available sectors including education [23], with the expectation of humans becoming producers, developers, and inventors [24]. The exploitation and utilization of knowledge in these study fields are also important learning points. To meet this need, individuals need to be able to carry out the following: (1) think creatively and critically, (2) determine problems, (3) develop plans, (4) provide solutions, and (5) evaluate decisions. This shows that many countries have implemented STEM education in K-12 programs [25,26,27], to improve the quality of a superior workforce. Besides this, the learning approach is also carried out at the elementary level, as indicated in Figure 1. STEM education has a significant relationship with the four applicable scientific fields, i.e., science, technology, engineering, and mathematics, in terms of developing products [28,29]. This proves that the encouragement of the learning approach from an early age is important, as the attitude of preservice teachers toward utilization is observed to have a relationship with increasing the implementation of STEM education in the future.

2.2. Stem Education in Indonesia

STEM education was introduced in Indonesia in 2013, subsequently becoming the focus and commitment of all stakeholders in 2014 [30]. During this period, all educational-level stakeholders agreed to improve the implementation, specifically among ordinary and preservice teachers. The government also established a partnership with the United States Agency for International Development (USAID) to jointly develop a suitable STEM-based learning model for the country’s educational conditions [31]. However, the implementation of this model has not been maximized. According to Schmid et al. [10], the integration of STEM-based learning in Elementary Schools was guided by the Faculty of Education, Universiti Kebangsaan Malaysia (UKM). At the tertiary level, Syiah Kuala University emphasized STEM education by building a study center for related educational analysis. These university centers are expected to focus on developing professional or preservice teachers, to improve the implementation of the learning model in the future. An analysis of the factors related to the attitudes and behavioral intentions of these teachers concerning implementing and using STEM education is also necessary.
Based on meta-analysis data [32], only one study has been conducted on STEM education, which then improved in 2015–2018 although it still remains at a low standard. This study emphasized the development of the learning media or models; however, its application and implementation were not carried out. In 2020, the meta-analysis study data on STEM education subsequently decreased due to the COVID-19 pandemic. The implementation of STEM education in Indonesia is often carried out in schools, with the decline in 2020 being the initial start to an accelerative restoration in various cities. In addition, one of the important initial steps is to observe whether teachers already know its essentials.

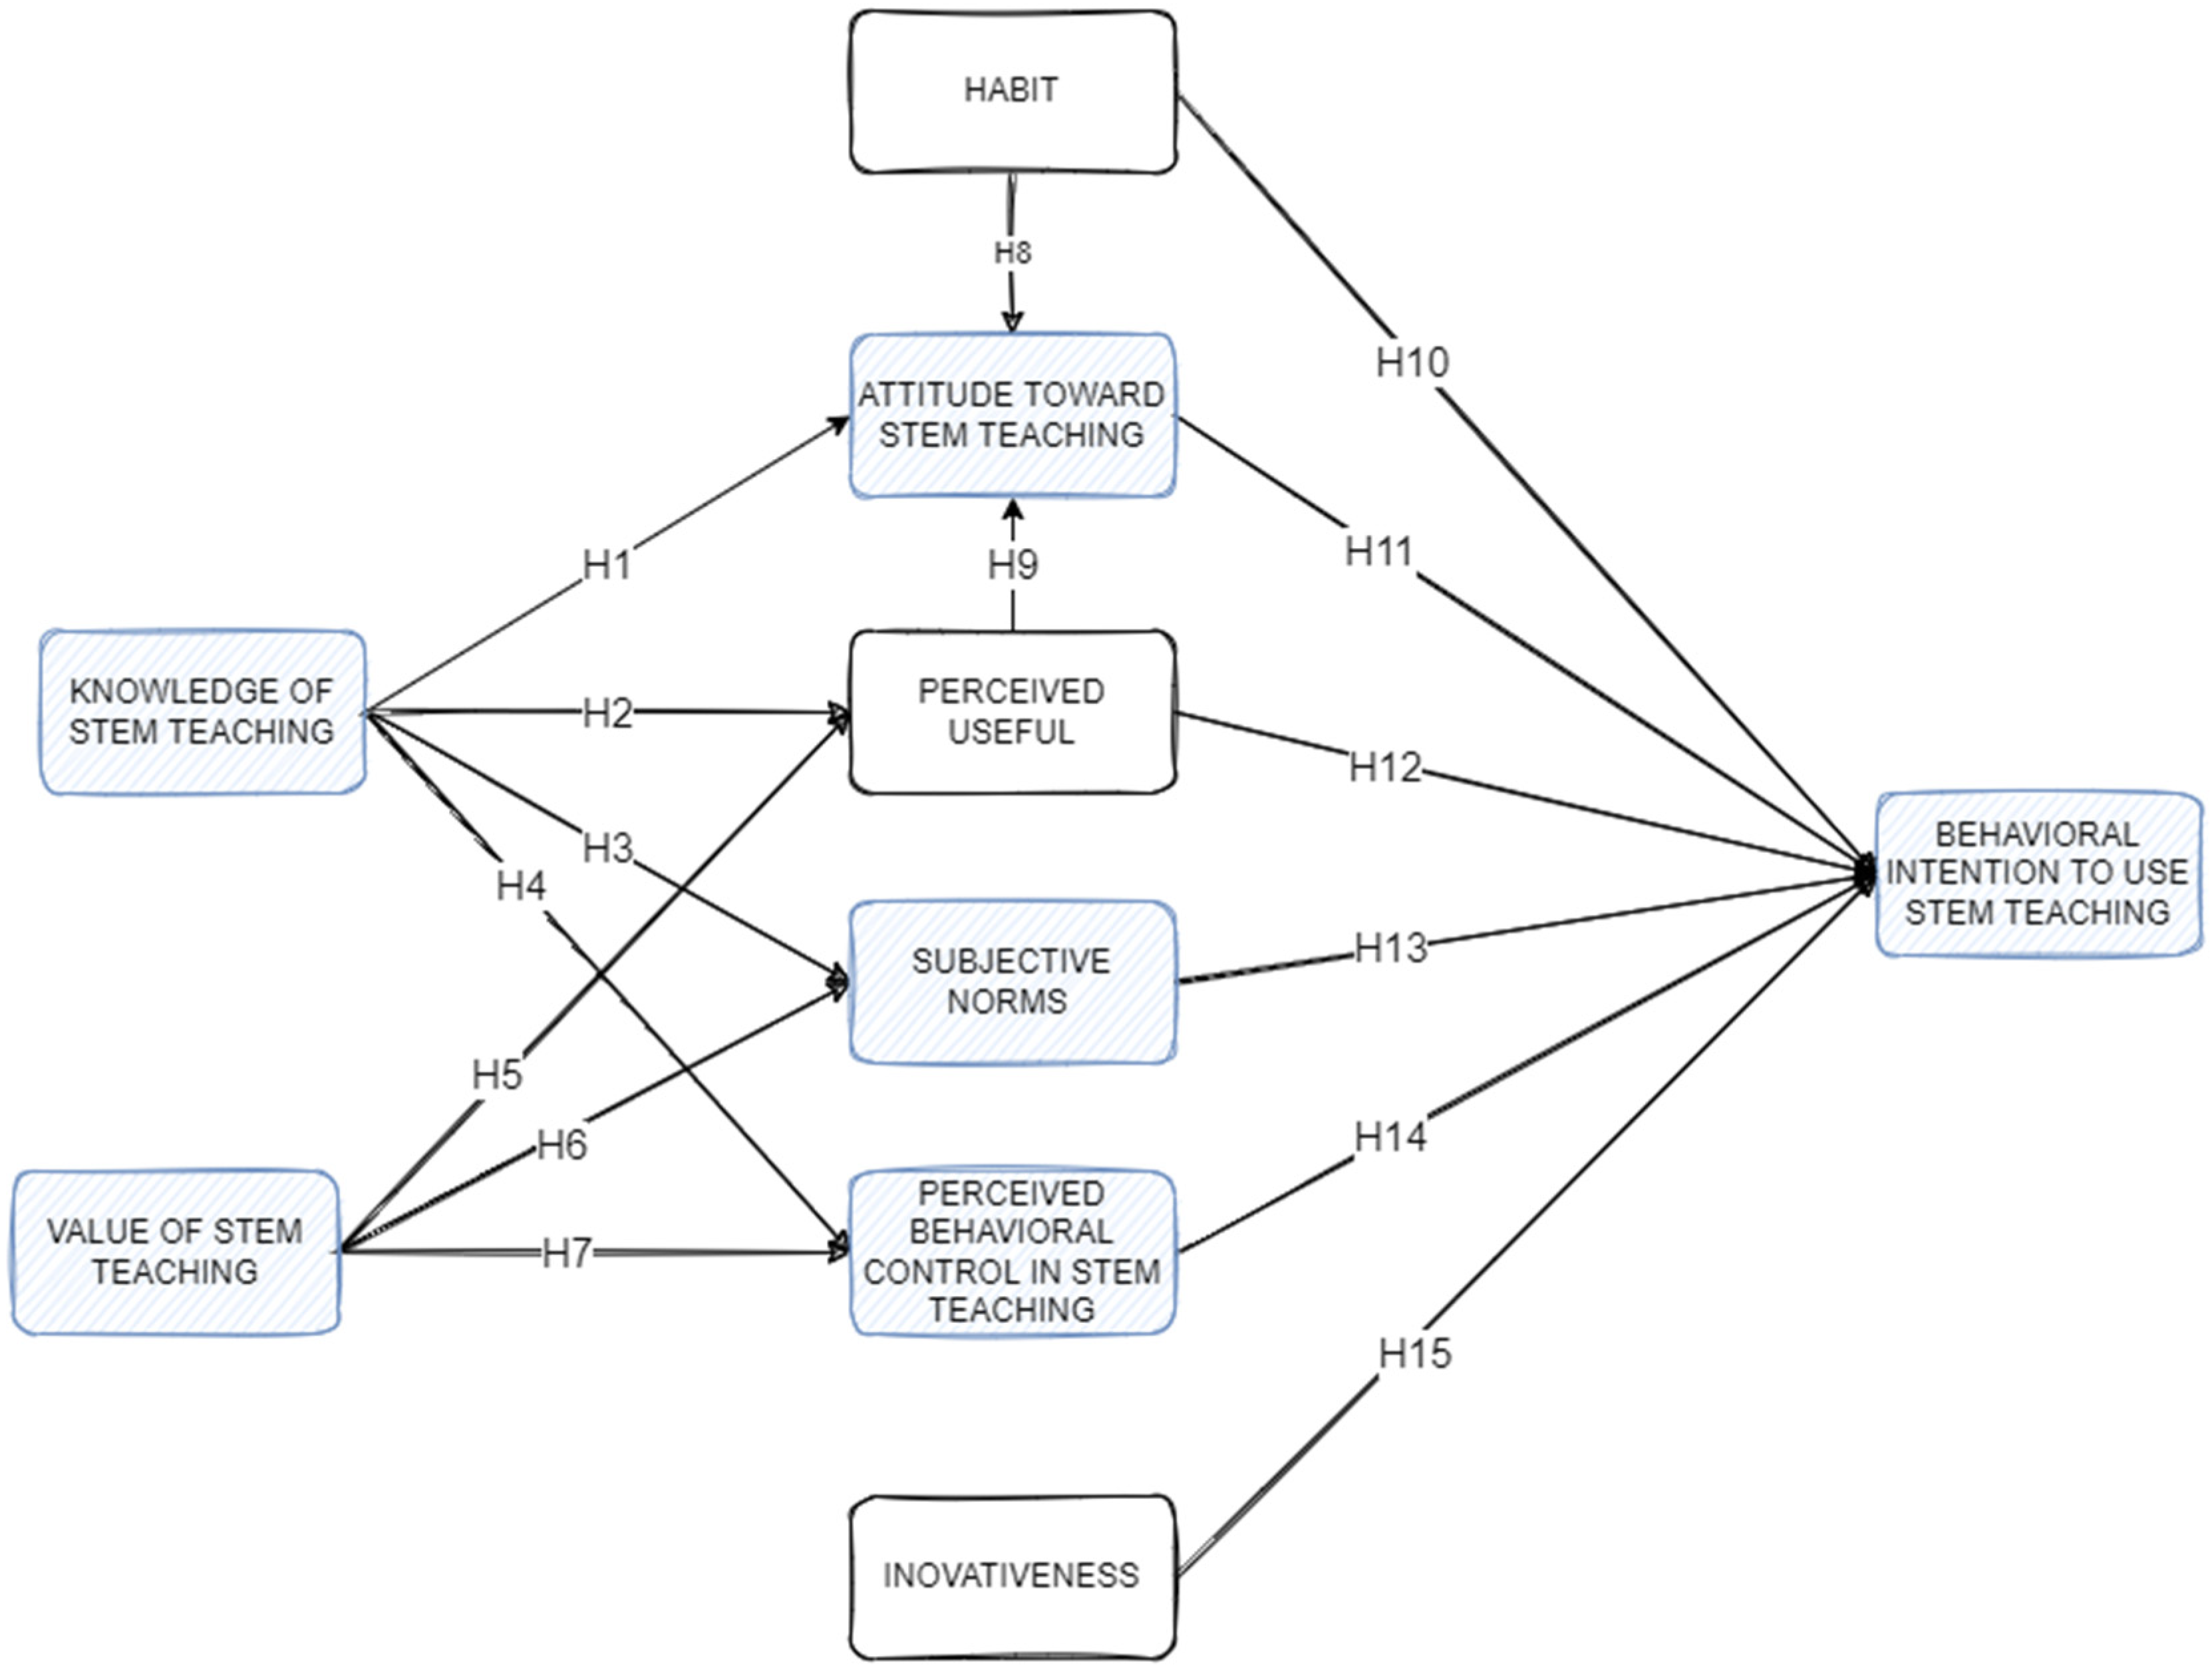
2.3. Theoretical Analysis Model

To determine the factors influencing preservice teachers’ behavioral intentions to implement STEM education, we extended the original theoretical Theory of Planned Behavior (TPB) model [11] (Figure 2). TPB is one of the models often used to predict behavioral intention (BI) in the educational sector [33]. In exploring the relationship between teachers’ BI and beliefs, the effectiveness of this model has been examined in many studies [34,35]. This describes teachers’ reaction to new learning and habits, as well as predicting their responses to a new approach or educational model. Meanwhile, this study adds several potential influential factors supported by strong literature studies to analyze the behavioral intention and attitude concerning STEM education. In addition, a moderator variable was added to subsequently analyze the differences in gender and age.

2.4. Knowledge of STEM Education

Using STEM education, learning is defined as an interdisciplinary lesson having a relationship with the fields of science, technology, engineering, and mathematics, aimed to determine or develop in-depth knowledge related to nature [36]. Technology education has the initial goal of teaching the modification patterns of natural nature to meet human needs and desires [37,38]. Engineering education also aims to teach utilization patterns concerning natural resources for the benefit of life and mankind [39]. Irrespective of these conditions, literacy in mathematics is needed to analyze the scientific model and relationship between American science, technology, and engineering [40].
Although several models have investigated this educational approach, the technique emphasizing the relationship between STEM disciplines was adopted through a specific field. This indicated that preservice teachers need to master the knowledge of their selected discipline while possessing sufficient understanding to combine their knowledge with other STEM fields.

2.5. Value of STEM Education

The attitudes and intentions of one’s actions are determined by individualistic perceptions [41]. This explains that the preservice teacher’s knowledge of STEM education needs to essentially affect their perceptions regarding the value of the educational approach. Furthermore, value is subjectively based on feelings, observations, and experiences. According to Williams [12], prestigious teachers’ attitudes toward STEM education is generally influenced by the lessons obtained at related universities. Monroe, Day, and Grieser [42] also stated that value is related to perceived usefulness and behavioral control. This led to the inclusion of the variable in these analytical processes that involves analyzing the relationship between the approach value and the implementation intentions of preservice teachers. The questionnaire item of this variable was also adopted by Mahoney [43] and Lin and Williams [12].

2.6. Habit

This study adopts an interesting variable introduced by Venkatesh [44], where habit was the most influential factor in a person’s behavioral intentions. However, a report in 2003 showed that habit was one of the important factors influencing the continuous utilization of technology [45]. This was conducted and confirmed before Venkatesh [44] included the variable in UTAUT2. Based on these conditions, the initial hypothesis stated that teachers adapted to the utilization of STEM education when attending related and familiar courses. This subsequently affected their intentions to use the educational approach.

2.7. Attitude towards STEM Education

Attitude is defined as people’s expectations and predictions for an action [41,46]. This proves the positivity of their attitudes toward behavioral intentions, with several studies subsequently showing a relationship between both variables [46,47,48]. In this report, attitudes concerning STEM education were interpreted based on good performances, which positively affected teachers’ behavioral intention regarding implementation.

2.8. Perceived Usefulness

Perceived usefulness is defined as the individual believing that an action or a specific system is capable of improving work performance [41]. In this study, it is, however, defined as the beliefs of preservice teachers regarding the assumption that the implementation of STEM education could increase their teaching effectiveness and provide good results to students. The more they believe, the higher their behavioral intention in using the educational approach to teach. According to previous studies, perceived usefulness has a good relationship with a person’s intention and actual usage of technology in the educational sector [47,49,50].

2.9. Subjective Norms Related to STEM Education

Subjective norm is the pressure felt by a person from the surrounding environment to perform an action [11]. It also indicates the perception that important people often need to provide support to others when acting [33,51,52]. In this report, subjective norm is, however, defined as the degree to which preservice teachers receive demands from important people regarding the implementation of STEM education. According to Venkatesh [44], many individuals often make similar assumptions based on the perceptions of these important personalities. This was in line with the study of Wijaya [53], where subjective norm was the most influential predictor of a person’s behavioral intention, concerning using technology. Another report also showed that it had a significant positive effect on behavioral intention within an educational context [54,55,56].

2.10. Perceived Behavioral Control of STEM Education

This is highly related to self-efficacy and is defined as the level of a person’s behavioral assessment regarding the implementation patterns and the extent of utilization [57]. This shows that perceived behavioral control is generally measured as self-efficacy or people’s beliefs in their abilities. Based on several observations, the variable has a positive relationship with a person’s usage intention [58,59,60,61]. In this study, it is consequently a critical factor when preservice teachers decide to implement STEM education. Regarding the initial hypothesis, perceived behavioral control has a relationship with the successful implementation of STEM education. It also helps in solving the problems related to its implementation.

2.11. Innovativeness

This is often used by many study experts to predict technology use and is widely integrated with TAMs (technology-acceptance models) [62,63,64]. It is also defined as a person’s willingness to use new designs or products [65]. In this study, innovativeness is consequently the willingness of preservice teachers to implement STEM education. This is not often influenced by the environment or other external variables, with Law [66] showing that it has a relationship with the extent to which a person is willing to experiment with new patterns or concepts.

2.12. Behavioral Intention to Implement STEM Education

Behavioral intention is defined as the personal attitude concerning carrying out a specific action [41,44,67]. However, it is the intention exhibited concerning the implementation of STEM education, according to this study. In this condition, the initial hypothesis states that behavioral intention is influenced by eight independent variables, namely knowledge, value, habit, perceived usefulness, innovativeness, PBC (perceived behavioral control), attitude, and subjective norms (Figure 3). Therefore, the hypothesis in this report includes the following,
H1. 
The knowledge of STEM education has a positive relationship with attitude.
H2. 
The knowledge of STEM education has a positive relationship with perceived usefulness.
H3. 
The knowledge of STEM education has a positive relationship with the subjective norm.
H4. 
The knowledge of STEM education has a positive relationship with perceived behavioral control.
H5. 
The value of STEM education has a positive relationship with perceived usefulness.
H6. 
The value of STEM education has a positive relationship with the subjective norm.
H7. 
The value of STEM education has a positive relationship with perceived behavioral control.
H8. 
Habit has a positive relationship with the attitude of preservice teachers toward STEM education.
H9. 
Perceived usefulness has a positive relationship with preservice teacher attitudes toward STEM education.
H10. 
Habit has a positive relationship with the behavioral intention to implement STEM education.
H11. 
Attitude has a positive relationship with the behavioral intention to implement STEM education.
H12. 
Perceived usefulness has a positive relationship with the behavioral intention to implement STEM education.
H13. 
Subjective norm has a positive relationship with the behavioral intention to implement STEM education.
H14. 
PBC (perceived behavioral control) has a positive relationship with the behavioral intention to implement STEM education.
H15. 
Innovativeness has a positive relationship with the behavioral intention to implement STEM education.

2.13. Moderation Effect

The demographic information data are used to determine whether gender and age moderate preservice teachers’ intention to implement STEM education. In this condition, gender is the main moderating variable in the UTAUT model [57] due to being widely used in behavioral intention studies within education contexts. Based on perceived usefulness, several previous studies proved that men and women highly emphasized the technology or solution capable of helping them quickly complete work and improve job performances, respectively [57]. Furthermore, significant differences were observed between men and women in subjective norms, as the males were less concerned with the opinions of those around them compared to the females [57,68]. Several studies also showed significant results regarding gender moderation [69,70,71]. During the process of age moderation, some differences were subsequently observed, as younger people easily adapted to new technologies and work patterns compared to older individuals. This was in line with some previous studies, where attitudinal differences were observed between the older and younger age groups [72,73]. Therefore, this present report classifies the age of preservice teachers into below and above 20 years.
Based on the potential moderator of these variables concerning the knowledge, value, perceived usefulness, subjective norm, habit, attitude, innovativeness, and PBC of STEM education, additional hypotheses were subsequently developed as follows:
H16. 
Age moderates the relationship between knowledge, value, perceived usefulness, subjective norm, habit, attitude, innovativeness, and PBC with the preservice teachers’ behavioral intentions to implement STEM education.
H17. 
Gender moderates the relationship between knowledge, value, perceived usefulness, subjective norm, habit, attitude, innovativeness, and PBC, with the preservice teachers’ behavioral intentions to implement STEM education.

3. Methods

A quantitative approach with a survey design was used in this analysis, with the Partial Least Square-Structural Equation Modeling (PLS-SEM) technique [74,75] being adopted to analyze and explain the relationship between variables, as well as the fit of the study model. This technique was suitable for reports incorporating and examining untested predictors and theoretical frameworks.

3.1. Sample and Population

Before the questionnaire distribution, consent was thoroughly obtained from the ethical committee of SK University (No. 3806/UN11.1.6/TU.01.01/2022). Consent was thoroughly obtained from the ethical committee of SK University, which has a STEM laboratory and “STEM education” courses. These possessions emphasized the improvement of professional teachers’ abilities, according to the standards needed in the 21st century. Furthermore, The data were obtained using a purposive sampling technique [76,77], where the preservice teachers need to have acquired a course on STEM education for 1 year and experienced school attendance for related practice studies. These participants were invited to participate by filling out questionnaires on the factors influencing their intention to implement STEM education in the future. Participation and responses were also voluntary and anonymous. This was based on an explanation that the data were only used for study purposes. Using an online questionnaire from April to May 2022, the data collection instruments were subsequently distributed. Furthermore, the virtual filling-in of the data provided strong evidence that participation was highly voluntary. After completion, a total of 206 data were obtained; only 201 were valid responses; of the participants, 85.07% were women. The complete demographic respondent data are shown in Table 1.
The instrument had an introductory section explaining the study objectives, the surveyor’s procedure, and the consent form. The structure of the questionnaire was also divided into 2 parts, with the first category containing 5 questions on demographic information. Meanwhile, the second part contained 26 measurement items derived from 9 variable constructs (see Appendix A). These emphasized the results of extensions from the TPB model, using a 5-point Likert response scale from SD to SA (strongly disagree to strongly agree).

3.2. Data Analysis

The Partial Least Squares-Structural Equation Modeling (PLS-SEM) technique was used through SmartPLS and SPSS software to analyze the data and test the moderator effect. PLS-SEM was chosen as the major analysis method for this investigation for a number of reasons. In this investigation, there were 9 variables and 15 paths, demonstrating that PLS-SEM could support a model with a complex interaction involving multiple indicator variables and paths. Assumptions about data distribution were not affected by the method [75]. To establish causal information, this study used a predictive strategy for model estimation. Because one of PLS-main SEM’s purposes is to deal with the dichotomy between information, prior associated ideas, and prediction as to the development foundation, PLS-SEM was chosen as a result. Comparing PLS-statistical SEM’s power to that of other methods like CB-SEM and simple regression [75]. The advantages apply even when predicting common factor model data. When the outcomes are present in the population, the PLS-SEM function’s statistical power also allows for the identification of correlations between constructs or variables [78]. For exploratory research that looks at less common ideas, the PLS-SEM feature within the statistical power is particularly useful. Thirdly, the software is more user-friendly than other programs like CB-SEM by SPSS and linear structural relations (Lisrel) since it has easy-access software packages available. The data were examined using SmartPLS 3, which is a user-friendly, state-of-the-art latent variable modeling tool that combines cutting-edge techniques (such as PLS-POS, IPMA, and sophisticated bootstrapping processes). Predicting a particular set of hypothesized associations that optimizes the explained variance in the dependent variables is the main goal of the user-friendly graphical user interface technique. PLS is often more suitable for testing model relationships and new path modelling, which has a more complex study structure [74,75]. In PLS-SEM, the analytical step was divided into several stages based on Hair et al. [75]. In this condition, both convergent and discriminatory validities (CV and DV) were initially evaluated, with the values of Item loadings, Cronbach alpha, composite reliability, and the AVE being used for the measurement of CV. For DV analysis, the Fornell–Larcker criterion [79] and heterotrait–monotrait (HTMT) [80] values were also evaluated. Meanwhile, the final step emphasized the evaluation of multicollinearity through the VIF value [81]. After the reliability and validity tests, the structural model and initial hypothesis analyses were then carried out through bootstrapping.

4. Results

4.1. Data Normality Analysis

Before entering the measurement model, the normality of the data needs to be tested through the kurtosis and skewness values of each item in the descriptive statistics table, as in Table 2. Based on the criteria, all the utilized item variables had a kurtosis and skewness value between −0.840 and 2.013, and −1.000 and 0.182, respectively, which were below 2.2 [82,83]. From these results, all these variables were observed to have normally distributed data.

4.2. Measurement Model

For the analysis of the measurement model, Hair [75] suggested evaluation of the convergent validity, the composite reliability, and the AVE value. These estimation steps were subsequently achieved in the PLS algorithm for CFA (Confirmatory Factor Analysis); the analysis of factor loading values is shown in Figure 4. This fully explained the internal consistency analysis concerning evaluating CFA-based reliability, validity, and DV.

4.3. Internal Consistency, Reliability, and Validity

The CFA-based PLS algorithm was used to analyze the value of the outer loading on each measurement item, as shown in Figure 4. However, SmartPLS was used to analyze the factor loading value for all items. Based on the results, the value of outer loadings was between 0.802 and 0.955. This indicated that all constructs exceeded the recommended values from Hair [75], where the outer loading estimations need to be higher than 0.708. In the next step, the Rho-A value was used to determine the internal consistency of reliability, with Henseler [84] stating that higher estimation led to a greater model reliability level. This proved that a value above 0.7 was sufficient to define satisfaction, although a problem due to construct validity reduction was observed when the estimation was more than 0.95 [85]. A Rho-A value above this estimation also portrayed redundancy items [86]. Based on the results, the study model had the lowest and highest Rho-A values at 0.728 and 0.945, respectively. In this condition, Cronbach alpha was also used as an option to analyze internal consistency reliability, although it needs to be higher than 0.700. From the analysis, the lowest Cronbach alpha value was 0.727, as the full estimations in collaboration with Rho-A are shown in Table 3. For all constructs, both the Cronbach alpha and Rho-A values met the criteria, indicating that they had satisfactory internal consistency reliability. This was because all values were not less or more than 0.700 and 0.950, respectively.
The next step emphasized the evaluation of CV (convergent validity), which was used to determine the extent to which the convergent construct described the variance items according to Hair, where the analysis of CV was observed from the AVE value. Using the PLS algorithm, the AVE had the lowest and highest estimations of 0.715 and 0.908 on value and innovativeness, respectively. This was in line with the Hair [75] criteria, where the AVE value needs to be greater than 0.5. For each construct, the Rho-A, CR, and AVE values proved that internal consistency was achieved for a more complete measurement model, as shown in Table 3.
The final step emphasized the analysis of the discriminant validity (DV), which is defined as the extent to which each construct is empirically different from others. This was analyzed using two methods, namely the Fornell–Larcker criterion [79] (see Table 4) and the heterotrait–monotrait (HTMT) ratio. These were used because some studies assumed that the analysis of DV was less effective when using only one method.
Based on the Fornell–Larcker criterion [79], the cross-loading value (in bold) needs to be higher than the loading values of other constructs. For example, the cross-loading value for innovativeness was 0.953 higher than the other loading construct estimations, i.e., knowledge, PBC, perceived usefulness, subjective norm, and value at 0.526, 0.563, 0.657, 0.518, and 0.571, respectively. According to Hair [75], smaller HTMT values led to better discriminants. To meet the discriminant validity criteria, the HTMT value should also not be more than 0.900. Meanwhile, Henseler [84] stated that the HTMT value should not exceed the upper threshold of 1.00. In this condition, construct validity becomes less dominant when the HTMT value exceeds the threshold, due to having a similar concept. Using bootstrapping 5000 subsamples with Smart PLS software (Table 5), the obtained HTMT value was lower than 0.900, showing that the discriminant validity had met the criteria and should be continuously analyzed in the structural model process.

4.4. Structural Model

According to Hair [75], the process of assessing the structural model began by analyzing the issue of collinearity. This was accompanied by a relationship analysis, through the path coefficients of t and p values. To obtain the strength of this model in explaining the attitude of preservice teachers concerning STEM education, subsequent analyses were carried out on the coefficient of determination (R2), the effect size (F2), and the predictive relevance (Q2). In addition, the gender and age differences were analyzed using the ANOVA test [87].

4.5. Collinearity

The collinearity test between latent variables was observed in the Variance Inflation Factor (VIF) value. In this condition, the collinearity level was higher with a greater VIF value. Furthermore, a VIF value greater than 5.00 indicated a collinearity problem between the structural model variables [75,78]. Table 6 shows that all VIF values are below 5, confirming that all the model variables did not have a problem with collinearity.
Figure 5 and Figure 6 and Table 7 shows the results of the initial hypothetical analysis, where 11 and 4 of the proposed hypotheses were supported and unsupported, respectively. Based on the results, knowledge had a relationship with the teachers’ behavioral intentions, subjective norms, and PBC concerning STEM education (H1, β = 0.130, t = 2.062, p-value < 0.05; H3, β = 0.177, t = 1.924, p-value < 0.05; H4, β = 0.161, t = 1.975, p-value < 0.05), although it did not affect perceived usefulness (H2, β = 0.114, t = 1.459, p-value > 0.05). Value also affected perceived usefulness, and had a relationship with the subjective norm and PBC (H5, β = 0.538, t = 7.070, p-value < 0.001; H6, β = 0.415, t = 5.637, p-value < 0.001; H7, β = 0.586, t = 9.159, p-value < 0.001). Furthermore, habit had a relationship and greatly affected the attitude and behavioral intentions of the preservice teachers toward STEM education, respectively (H8, β = 0.487, t = 7.646, p-value < 0.01; H10, β = 0.487, t = 7.646, p-value < 0.001). Perceived usefulness also had the strongest positive significance and relationship with the attitude and behavioral intentions of preservice teachers toward the educational approach, respectively (H9, β = 0.580, t = 10.257, p-value < 0.001; H12, β = 0.224, t = 3.335, p-value < 0.01). Moreover, attitude, subjective norm, and PBC did not have a relationship with the teachers’ behavioral intentions concerning STEM education (H11, β = 0.066, t = 1.083, p-value > 0.05; H13, β = 0.045, t = 0.776, p-value > 0.05; H14, β = 0.080, t = 1.103, p-value > 0.05). Irrespective of these conditions, innovativeness still had a relationship with the preservice teachers’ intentions to implement the educational approach (H15, β = 0.131, t = 2.045, p-value < 0.05).

4.6. Coefficient of Determination (R2)

The coefficient of determination (R2) is commonly used to evaluate the structural model due to the extent to which relationships are predicted between the dependent and independent variables [88,89]. This ranges from 0 to 1, with a higher R2 value leading to greater prediction accuracy in a study model [90]. R2 values less than 0.25, between 0.5 and 0.75, and above 0.75 are categorized as weak, moderate, and substantial, respectively. Based on the smart PLS results, all the model’s dependent variables had good predictive accuracy with moderate R2 values, as shown in Table 8 and Figure 5.

4.7. Predictive Relevance (Q2)

Besides the analysis of R2 values as a significant criterion, Hair [75] also suggested the evaluation of Stone–Geisser’s Q2, which is used to assess the relevant predictive stone [91]. This shows that a higher Q2 value leads to the specific predictive accuracy of item data points. The value of this construct is also obtained through the blindfolding procedure in SmartPLS software. Moreover, Q2 is used to assess cross-validated redundancy measures for each dependent construct [92]. Based on the endogenous latent variable, a relevant predictive model was achieved due to the value of Q2 being more than 0. Predictive relevance is also considered small, medium, and large when below, equal to, and above 0.02, 0.15, and 0.35, respectively. Table 9 shows the Q2 values for the five endogenous variables not less than 0.217, indicating that the independent construct (behavioral intention) had a significant predictive value for the dependent determinant.

4.8. Effect Size (F2)

According to the evaluation of the structural model, an analysis of the F2 value also needs to be performed. This construct explains the effect of exogenous on endogenous variables to determine changes in the R2 value when specific exogenous determinants are excluded from the model. The F2 values below, between, and above 0.15, 0.15 and 0.35, and 0.35 are categorized as small, medium, and large effects, respectively. Based on the results, perceived usefulness had the largest F2 for attitudes, as shown in Table 10.

4.9. Moderating Effect Analysis of Gender and Age

This study subsequently examined the occurrence of differences between two demographic factors—gender and age—regarding preservice teachers’ intentions to implement STEM education. The moderator effects were calculated and analyzed using t-test and ANOVA analysis through the SPSS software [93]. In this case, the results of the independent sample t-test concerned the differences between men and women in the implementation of the educational approach. Table 11 also indicates that the preservice teachers did not show a significant difference (p > 0.05) in the perceptions of men and women for the 10 variables. Therefore, gender did not affect Indonesian preservice teachers’ behavioral intentions to implement STEM education.
Based on the age moderator effect analysis, differences were observed in the subjective norm and habit variables at p-values < 0.05, as well as t-values of 4.239 and 5.546, respectively.

5. Discussion

The developed model aimed to predict the factors influencing the attitude and behavioral intention of preservice teachers toward implementing STEM education. Based on the PLS algorithm, 11 of the 15 hypotheses were supported, with three predictors each directly affecting the teachers’ attitudes and behavioral intentions in implementing STEM education. At approximately 70%, the structural model also successfully validated and analyzed the factors having a relationship with the two constructs (attitude and behavioral intention). Additionally, the final model increased the power of TPB, contributing to the behavioral intention knowledge of the teachers. These results contributed to the closure of analytical gaps and provided valuable outputs for improving the present implementation of STEM education in Indonesia. Regarding the increase in teachers’ attitudes concerning the implementation of this educational approach, knowledge, perceived usefulness, and habit were observed as the positively significant variables. Perceived usefulness had the greatest positive effect on the implementation attitudes. This was in line with previous articles, where the variable largely affected behavior in the acceptance model theory [48,50,94]. These results provided information to Indonesian governments and institutions to improve the implementation of STEM education. This ensured the need for special/continuous training and guidance on the objectives of learning, as well as the benefits of the educational approach. It also enabled the awareness of students concerning the need for the present STEM education and increased technical knowledge. The factors directly affecting behavioral intentions included habit, perceived usefulness, and innovativeness. In this case, habit had the largest positive significance on the BI of teachers concerning implementing STEM education. Innovativeness also had a significant positive effect due to the utilization of Generation Z children not older than 25 years old [95]. This is because they have high enthusiasm for new things and new concepts, with the curiosity to utilize innovative learning approaches subsequently considered [96,97]. The generation was also dominated by undergraduates, as they were required to learn many things and innovate through different learning approaches. These outcomes are in line with several previous studies [62,64].
According to these results, habit was the biggest effective factor having a relationship with the implementation of STEM education in Indonesia. Therefore, all educational institution levels need to familiarize preservice teachers with the use of STEM education. It should also be included as a mandatory or additional course while transforming the learning approach in eligible classes. Additionally, the obtained results need to adequately familiarize these teachers with STEM education-based learning to increase their behavioral intention to implement it. Meanwhile, subjective norms did not have a significant relationship with BI. This was not in line with many previous studies, where the variable significantly affected a person’s behavioral intention to perform attitudinal actions [53,98]. More articles also showed that it was the first biggest positive factor influencing BI and UB (behavioral intention and usage behavior) [99]. In this condition, Indonesian preservice teachers assumed that they had the value and knowledge of STEM education, and felt that the perceived usefulness of implementation was a more important factor than environmental influences.
The results also showed no gender effect on all factors affecting preservice teachers’ behavioral intentions toward implementing the educational approach. This showed that STEM education improved gender differences in the fields of science and computer programs, which were previously less favored by women in Indonesia. These results were essentially in line with Price [100], where differences were observed in the gender factor concerning intention to continue STEM education. Age was also found to moderate subjective norms and habits, with the teachers <20 years old having higher responses than other individuals (see Table 12). This explained that the preservice teachers were environmentally influenced in the first and second years of college. Therefore, lecturers and campuses need to capitalize on this golden opportunity to instill the knowledge and importance of STEM education in all educational personnel.

6. Conclusions and Implication

This study predicted the factors influencing the behavioral intention of Indonesian preservice teachers to implement STEM education. It also examined the moderating role of gender and age on the behavioral intentions concerning implementation. Using Indonesian preservice teachers as samples, success was achieved in the validation, analysis, and extension of the TPB model. In this condition, three factors each had a direct relationship with attitude and behavioral intention. Based on gender and age, differences were also observed in subjective norms, perceived behavioral control, and habit. These results are expected to be an important contribution toward increasing the use of STEM education in the future. This is because the learning technique encourages interdisciplinary education with a sustainable development approach. Besides this, sustainable development goals also require STEM education to educate sensitive and professional interdisciplinary individuals. The results obtained subsequently need to close a gap in areas related to the behavioral intention of implementing STEM education in developing countries. The strength of this study model also showed that preservice teachers’ attitudes and BI toward STEM education were above 50 and 70%, respectively.

7. Limitation and Suggestions

This study had several limitations, including the development of a conceptual model from the original TPB model. Another limitation was the addition of several determinants with the potential to influence behavioral intention concerning implementing STEM education. Of the many models used to analyze these implementation intentions, each of them had its advantages, leading to different results from the conceptual development of the study design.
Since the sample was only limited to the preservice teachers at SK University, Indonesia, the result generalization in other countries needs to be carefully carried out. Subsequent studies need to examine the comparative factors influencing preservice teachers’ intentions to implement STEM education. Additionally, the study only emphasized the use of quantitative techniques. This indicates that a combination of qualitative and quantitative methods needs to be used to deeply explain the influential factors of STEM education implementation. Some additional moderators such as voluntary and major also need to be added for subsequent analysis. Finally, no negative statements were observed in the questionnaire, as their additions are suggested to avoid response bias.

Author Contributions

Conceptualization, T.T.W. and M.M.; methodology, A.H.; software, T.T.W. and A.H.; formal analysis, T.T.W. and M.M.; data curation, M.M.; writing—original draft preparation, T.T.W. and M.M.; writing—review and editing, T.T.W.; visualization, all author; supervision, P.J. and A.H.; project administration, P.J.; funding acquisition, P.J. All authors have read and agreed to the published version of the manuscript.

Funding

This research was funded by 2022 Hunan Provincial General Higher Education Teaching Reform Research Project “Virtual Teaching and Research Section Empowering Excellent Middle School Mathematics Teacher Training Research”; 2021 Hunan Provincial Department of Education Scientific Research Project “Academic Development Tracking Research of Top-notch Innovative Reserve Talents in Adolescent Basic Disciplines-Based on Mathematics Competitive Students as an Example” (21B0049); Ph.D. Research Start-up Fund of Hunan Normal University.

Institutional Review Board Statement

The study was conducted according to the guidelines of the Declaration of Helsinki, and approved by the Institutional Review Board (or Ethics Committee) of Universitas Syiah Kuala (protocol code 3806/UN11.1.6/TU.01.01/2022 and 1 May 2022).

Informed Consent Statement

Informed consent was obtained from all subjects involved in the study.

Data Availability Statement

Data available on request.

Acknowledgments

Thank for all preservice teacher participate in this study.

Conflicts of Interest

The authors declare no conflict of interest.

Appendix A

ConstructEnglish VersionIndonesian Version
Knowledge of STEM educationI am familiar with science knowledge (chemistry/physics/biology) at the junior and senior high school levelsSaya farmiliar dengan pengetahuan science (kimia/fisika/biologi) di level SMP dan SMA
I am familiar with technology-related knowledge at the junior and senior high school levelSaya farmiliar dengan pengetahuan terkait teknologi pada level SMP dan SMA
I am familiar with the knowledge of engineering (STEM) at the junior and senior high school levelSaya farmiliar dengan pengetahuan mengenai engineering (STEM) pada level SMP dan SMA
I am familiar with mathematics knowledge at the junior and senior high school levelSaya farmiliar dengan pengetahuan matematika pada level SMP dan SMA
Value of STEM educationI feel teaching students how to collect STEM-related data during the teaching process is very importantSaya merasa mengajarkan siswa bagaiamana cara mengumpulkan data yang berhubungan dengan STEM selama proses mengajar sangat penting
I feel teaching students how to use STEM-related data during the teaching process is very importantSaya merasa mengajarkan siswa bagaimana cara menggunakan data yang berhubungan dengan STEM selama proses mengajar sangat penting
I feel like teaching students how to use STEM-related data during the testing and modification process.Saya merasa mengajarkan siswa bagaiamana cara menggunakan data yang berhubungan dengan STEM pada saat testing dan proses modifikasi.
I like using STEM learning in classSaya suka menggunakan pembelajaran STEM di kelas
I think STEM activities help improve students’ abilitiesSaya pikir kegiatan STEM sangat membantu meningkatkan kemampuan siswa
I think STEM activities help improve student learning scoressaya pikir STEM activites dapat membantu meningkatkan nilai belajar siswa
Attitude concerning STEM educationUsing STEM learning is a good ideaMenggunakan pembelajaran STEM adalah ide yang bagus
Using STEM learning makes teaching and learning activities interestingMenggunakan pembelajaran STEM membuat kegaiatan belajar mengajar menjadi menarik
I enjoy using STEM learning when teachingSaya senang menggunakan pembelajaran STEM saat mengajar
Subjective normOther teachers at my school use STEM learning when teachingGuru guru lain di sekolah saya menggunakan pembelajaran STEM saat mengajar
The government advise teachers to implement STEM learningPemerintah menyarankan para guru untuk mengimplementasikan pembelajaran STEM
The head of the curriculum section advises teachers to implement STEM educationKepala bagian kurikulum menyarankan para guru untuk mengimplementasikan STEM education
Perceived behavior control in STEM educationI will try to collaborate with other teachers to implement STEM educationSaya akan berusaha berkolaborasi dengan guru lain untuk mengimplementasikan STEM education
I will try to remind students to solve problems based on STEM knowledgeSaya akan berusaha mengingatkan siswa untuk memecahkan masalah berdasarkan pengetahuan STEM
I will try to teach students how to modify products based on STEM knowledgeSaya akan berusaha mengajarkan siswa bagaimana untuk memodifikasi produk berdasarkan pengetahuan STEM
I will try to teach students how to think based on STEM knowledge in teaching and learning activitiesSaya akan berusaha untuk mengajarkan siswa bagaimana untuk berpikir berdasarkan pengetahuan STEM pada kegiatan belajar mengajar
Perceived usefulnessI think STEM learning is useful in teaching and learning activitiesSaya rasa pembelajaran STEM bermanfaat pada kegiatan belajar mengajar
STEM learning improves my teaching skills in schoolPembelajaran STEM meningkatkan kemampuan mengajar saya di sekolah
I think using STEM learning for teaching is more effective than traditional teachingSaya pikir menggunakan pembelajaran STEM untuk mengajar efektif dibanding pengajaran tradisional
Behavioral intention toward STEM educationI will use STEM learning at every teaching opportunitySaya akan menggunakan pembelajaran STEM pada setiap kesempatan mengajar
I will recommend STEM learning to my teacher friendsSaya akan merekomendasikan pembelajaran STEM kepada teman teman guru
Using STEM learning has become my teaching habit
HabitI have to use the STEM approach if I teach at the junior high and high school levelsMenggunakan pembelajaran STEM sudah menjadi kebiasaan mengajar saya
I enjoy learning about new learning approachesSaya harus menggunakan pendekatan STEM jika mengajar di tingkat SMP dan SMA
InnovativenessI enjoy using new teaching methodsSaya senang belajar tentang pendekatan pembelajaran baru
When there is a new teaching approach, I try to practice it in the classroomSaya senang menggunakan metode mengajar yang baru
Compared to other teachers, I am usually the first to try a new learning modelKetika ada pendekatan mengajar yang baru, saya mencoba untuk mempraktekkannya di dalam kelas
I am curious about teaching using the STEM approachDibandingkan dengan guru guru lain, saya biasanya orang pertama yang mencoba model pembelajaran baru
AnxietyI am afraid I cannot teach well if I use the STEM approachSaya merasa penasaran mengajar menggunakan pendekatan STEM
I am afraid that students will not like my teaching method using the STEM approachSaya takut tidak dapat mengajar dengan baik jika menggunakan pendekatan STEM
I will use STEM learning at every teaching opportunitySaya takut siswa tidak menyukai cara mengajar saya menggunakan pendekatan STEM

References

  1. So, H.J.; Ryoo, D.; Park, H.; Choi, H. What Constitutes Korean Pre-service Teachers’ Competency in STEAM Education: Examining the Multi-functional Structure. Asia-Pacific Educ. Res. 2019, 28, 47–61. [Google Scholar] [CrossRef]
  2. Grodal, S.; Thoma, G. Cross-pollination in science and technology: Concept mobility in the nanobiotechnology field. Ann. Econ. Stat. d’E’conomie Stat. 2014, 115, 57–80. [Google Scholar] [CrossRef]
  3. Kier, M.W.; Johnson, L.L. Exploring How Secondary STEM Teachers and Undergraduate Mentors Adapt Digital Technologies to Promote Culturally Relevant Education during COVID-19. Educ. Sci. 2022, 12, 48. [Google Scholar] [CrossRef]
  4. Williams, J.; Roth, W.-M.; Swanson, D.; Doig, B.; Groves, S.; Omuvwie, M.; Ferri, R.B.; Mousoulides, N. Interdisciplinary Mathematics Education: A State of the Art; ICME-13 Topical Surveys; Springer: Cham, Switzerland, 2016; pp. 1–35. [Google Scholar] [CrossRef]
  5. Lee, K.T.; Nason, R.A. Reforming the preparation of future STEM teachers. In Proceedings of the 2nd International STEM in Education Conference, Beijing, China, 30 June 2012. [Google Scholar]
  6. Honey, M.; Pearson, G.; Schweingruber, H. STEM Integration in K-12 Education: Status, Prospects, and an Agenda for Research; National Academies Press: Washington, DC, USA, 2014. [Google Scholar]
  7. Ahmad, J.; Siew, N.M. Curiosity towards stem education: A questionnaire for primary school students. J. Balt. Sci. Educ. 2021, 20, 289–304. [Google Scholar] [CrossRef]
  8. Makamure, C.; Tsakeni, M. COVID-19 as an agent of change in teaching and learning stem subjects. J. Balt. Sci. Educ. 2020, 19, 1078–1091. [Google Scholar] [CrossRef]
  9. Bybee, R.W. Advancing STEM Education: A 2020 Vision. Technol. Eng. Teach. 2010, 70, 30–35. [Google Scholar]
  10. Schmid, M.; Brianza, E.; Petko, D. Self-reported technological pedagogical content knowledge (TPACK) of pre-service teachers in relation to digital technology use in lesson plans. Comput. Hum. Behav. 2021, 115, 106586. [Google Scholar] [CrossRef]
  11. Ajzen, I. From Intentions to Actions: A Theory of Planned Behavior in Action Control; SSSP Springer Series in Social Psychology; Springer: Berlin/Heidelberg, Germany, 1985. [Google Scholar]
  12. Lin, K.Y.; Williams, P.J. Taiwanese Preservice Teachers’ Science, Technology, Engineering, and Mathematics Teaching Intention. Int. J. Sci. Math. Educ. 2016, 14, 1021–1036. [Google Scholar] [CrossRef]
  13. ACM International Conference Proceeding Series. 2019. Available online: https://www.scopus.com/inward/record.uri?eid=2-s2.0-85117535722&partnerID=40&md5=7c9a8692c55c8d5b5f1d39815a2549ef (accessed on 10 June 2022).
  14. Syahmani, S.; Hafizah, E.; Sauqina, S.; Adnan, M.B.; Ibrahim, M.H. STEAM Approach to Improve Environmental Education Innovation and Literacy in Waste Management: Bibliometric Research. Indones. J. Learn. Adv. Educ. 2021, 3, 130–141. [Google Scholar] [CrossRef]
  15. Khadri, H.O. Becoming future-proof STEM teachers for enhancing sustainable development: A proposed general framework for capacity-building programs in future studies. Prospects 2022, 1–15. [Google Scholar] [CrossRef]
  16. Chang, D.F.; Lee, K.Y.; Tseng, C.W. Exploring Structural Relationships in Attracting and Retaining International Students in STEM for Sustainable Development of Higher Education. Sustainability 2022, 14, 1267. [Google Scholar] [CrossRef]
  17. Newhouse, C.P. STEM the Boredom: Engage Students in the Australian Curriculum Using ICT with Problem-Based Learning and Assessment. J. Sci. Educ. Technol. 2017, 26, 44–57. [Google Scholar] [CrossRef]
  18. Nicholas, C.; Scribner, J.A. Enhancing PBL Authenticity by Engaging STEM-Professional Volunteers. Interdiscip. J. Probl. Learn. 2021, 15, 2. [Google Scholar] [CrossRef]
  19. Kilty, T.; Burrows, A.; Welsh, K.; Kilty, K.; McBride, S.; Bergmaier, P. Transcending Disciplines: Engaging College Students in Interdisciplinary Research, Integrated Stem, and Partnerships. J. Technol. Sci. Educ. 2021, 11, 146–166. [Google Scholar] [CrossRef]
  20. Thu, H.L.T.; Tran, T.; Phuong, T.T.T.; Tuyet, T.L.T.; le Huy, H.; Thi, T.V. Two decades of stem education research in middle school: A bibliometrics analysis in scopus database (2000–2020). Educ. Sci. 2021, 11, 353. [Google Scholar] [CrossRef]
  21. Simoncini, K.; Lasen, M. Ideas About STEM Among Australian Early Childhood Professionals: How Important is STEM in Early Childhood Education? Int. J. Early Child. 2018, 50, 353–369. [Google Scholar] [CrossRef]
  22. Petrosino, A.J., Jr.; Stroup, W.M. Group-Based Cloud Computing for Secondary STEM Education. June 2017. Available online: https://www.scopus.com/inward/record.uri?eid=2-s2.0-85030539786&partnerID=40&md5=49d7d118ea79fd3cec66892c7900a7ba (accessed on 11 June 2022).
  23. Wijaya, T.T.; Zhou, Y.; Ware, A.; Hermita, N. Improving the Creative Thinking Skills of the Next Generation of Mathematics Teachers Using Dynamic Mathematics Software. Int. J. Emerg. Technol. Learn. 2021, 16, 212–226. [Google Scholar] [CrossRef]
  24. Purwaningsih, E.; Sari, S.P.; Sari, A.M.; Suryadi, A. The effect of stem-pjbl and discovery learning on improving students’ problem-solving skills of the impulse and momentum topic. J. Pendidik. IPA Indones. 2020, 9, 465–476. [Google Scholar] [CrossRef]
  25. Smith, K.N.; Jaeger, A.J.; Thomas, D. ‘Science Olympiad Is Why I’m Here’: The Influence of an Early STEM Program on College and Major Choice. Res. Sci. Educ. 2019, 51, 443–459. [Google Scholar] [CrossRef]
  26. Lin, P.Y.; Chai, C.S.; Jong, M.S.Y. A Study of Disposition, Engagement, Efficacy, and Vitality of Teachers in Designing Science, Technology, Engineering, and Mathematics Education. Front. Psychol. 2021, 12, 661631. [Google Scholar] [CrossRef]
  27. Correia, M.S.M.; Baptista, M.L.M. The effects of a STEM approach on preservice elementary teachers’ subject matter knowledge about sound. Acta Sci. 2021, 23, 179–208. [Google Scholar] [CrossRef]
  28. Coles, A. Facilitating the use of video with teachers of mathematics: Learning from staying with the detail. Int. J. STEM Educ. 2019, 6, 1. [Google Scholar] [CrossRef]
  29. Wong, C.Y.; Shih, Y.T. Enhance STEM Education by Integrating Product Design with Computer-Aided Design Approaches. Comput. Aided. Des. Appl. 2022, 19, 694–711. [Google Scholar] [CrossRef]
  30. Arlinwibowo, J.; Retnawati, H.; Kartowagiran, B. How to Integrate STEM Education in The Indonesian Curriculum? A Systematic Review. Chall. Sci. 2021, 18–25. [Google Scholar] [CrossRef]
  31. Prabowo, A.; Anggoro, R.P.; Adiyanto, R.; Rahmawati, U. Interactive Multimedia-based Teaching Material for Trigonometry. J. Phys. Conf. Ser. 2018, 1097, 012138. [Google Scholar] [CrossRef]
  32. Farwati, R.; Metafisika, K.; Sari, I.; Sitinjak, D.S.; Solikha, D.F.; Solfarina, S. STEM Education Implementation in Indonesia: A Scoping Review. Int. J. STEM Educ. Sustain. 2021, 1, 11–32. [Google Scholar] [CrossRef]
  33. Stössel, J.; Baumann, R.; Wegner, E. Predictors of student teachers’ esd implementation intention and their implications for improving teacher education. Sustainability 2021, 13, 9027. [Google Scholar] [CrossRef]
  34. Zhao, W.; Mok, I.A.C.; Cao, Y. Factors influencing teachers’ implementation of a reformed instructional model in China from the theory of planned behavior perspective: A multiple case study. Sustainability 2020, 12, 1. [Google Scholar] [CrossRef]
  35. Yusop, F.D.; Habibi, A.; Razak, R.A. Factors Affecting Indonesian Preservice Teachers’ Use of ICT During Teaching Practices Through Theory of Planned Behavior. SAGE Open 2021, 11, 21582440211027572. [Google Scholar] [CrossRef]
  36. National Research Council (NRC). National Science Education Standards; National Academy Press: Washington, DC, USA, 1996. [Google Scholar]
  37. Dias, A.; Ordaz, M.G.; López, F.M. The wisdom innovation model—Adjusting new insights and hosting new perspectives to human augmented reality. Commun. Comput. Inf. Sci. 2011, 219, 73–85. [Google Scholar] [CrossRef]
  38. 15th International Conference on Human Computer Interaction, HCI International 2013. Available online: https://www.scopus.com/inward/record.uri?eid=2-s2.0-85015595703&partnerID=40&md5=9e54145641ddf1a2aeebdc27bb2b347a (accessed on 10 June 2022).
  39. Nejkovic, V.; Tosic, M. Exploring factors for effective use of online information in SPOC within the engineering education. Comput. Appl. Eng. Educ. 2018, 26, 1457–1469. [Google Scholar] [CrossRef]
  40. American Association for the Advanced of Science. Benchmarks for Science Literacy; Oxford University Press: New York, NY, USA, 1993. [Google Scholar]
  41. Davis, F.D. Perceived usefulness, perceived ease of use, and user acceptance of information technology. MIS Q. 1989, 13, 319–340. [Google Scholar] [CrossRef]
  42. Monroe, M.; Day, B.; Grieser, M. Environmental Education & Communication for a Sustainable World; Academy for Educational Development: Washington, DC, USA, 2000. [Google Scholar]
  43. Smith, P.J.; Murphy, K.L.; Mahoney, S.E. Towards identifying factors underlying readiness for online learning: An exploratory study. Distance Educ. 2003, 24, 57–67. [Google Scholar] [CrossRef]
  44. Venkatesh, V.Y.L.; Thong, J.; Xu, X. Consumer acceptance and use of information Technology: Extending the unified theory of acceptance and use of technology. MIS Quarterly. Manag. Inf. Syst. Q. 2012, 36, 157–178. [Google Scholar] [CrossRef]
  45. Gefen, D. TAM or just plain habit: A look at experienced online shoppers. J. End User Comput. 2003, 15, 1–13. [Google Scholar] [CrossRef]
  46. Gellerstedt, M.; Babaheidari, S.M.; Svensson, L. A first step towards a model for teachers’ adoption of ICT pedagogy in schools. Heliyon 2018, 4, e00786. [Google Scholar] [CrossRef]
  47. Drueke, B.; Mainz, V.; Lemos, M.; Wirtz, M.A.; Boecker, M. An Evaluation of Forced Distance Learning and Teaching Under Pandemic Conditions Using the Technology Acceptance Model. Front. Psychol. 2021, 12, 701347. [Google Scholar] [CrossRef]
  48. Smeda, A.; Shiratuddin, M.F.; Wong, K.W. A structural equation modelling approach for adoption of e-book amongst mathematics and statistics (MAS) students at higher education institutions in Libya. Int. J. Inf. Learn. Technol. 2018, 35, 240–254. [Google Scholar] [CrossRef]
  49. Osih, S.C.; Singh, U.G.; Africa, S. Students ’ perception on the adoption of an e-textbook ( digital ) as an alternative to the printed textbook. S. Afr. J. High. Educ. 2020, 34, 201–215. [Google Scholar] [CrossRef]
  50. Joo, Y.J.; Park, S.; Lim, E. Factors Influencing Preservice Teachers’ Intention to Use Technology. J. Educ. Technol. Soc. 2018, 21, 48–59. Available online: http://www.jstor.org/stable/26458506 (accessed on 10 June 2022).
  51. Lavidas, K.; Komis, V.; Achriani, A. Explaining faculty members’ behavioral intention to use learning management systems. J. Comput. Educ. 2022, 0123456789. [Google Scholar] [CrossRef]
  52. Saleem, M.; Kamarudin, S.; Shoaib, H.M.; Nasar, A. Influence of augmented reality app on intention towards e-learning amidst COVID-19 pandemic. Interact. Learn. Environ. 2021, 1–15. [Google Scholar] [CrossRef]
  53. Wijaya, T.T.; Cao, Y.; Weinhandl, R.; Yusron, E. Applying the UTAUT Model to Understand Factors Affecting Micro-Lecture Usage by Mathematics Teachers in China. Mathematics 2022, 10, 1008. [Google Scholar] [CrossRef]
  54. Mukminin, A.; Habibi, A.; Muhaimin, M.; Prasojo, L.D. Exploring the drivers predicting behavioral intention to use m-learning management system: Partial least square structural equation model. IEEE Access 2020, 8, 181356–181365. [Google Scholar] [CrossRef]
  55. Taamneh, A.; Alsaad, A.; Elrehail, H.; Al-Okaily, M.; Lutfi, A.; Sergio, R.P. University lecturers acceptance of moodle platform in the context of the COVID-19 pandemic. Glob. Knowl. Mem. Commun. 2022; Ahead-of-print. [Google Scholar] [CrossRef]
  56. Alenezi, A.R. Modeling the Social Factors Affecting Students’ Satisfaction with Online Learning: A Structural Equation Modeling Approach. Educ. Res. Int. 2022, 2022, 2594221. [Google Scholar] [CrossRef]
  57. Venkatesh, M.G.; Morris, G.B.; Davis, G.B.; Davis, F.D. User acceptance of information technology: Toward a unified view. Manag. Inf. Syst. Q. 2003, 27, 425–478. [Google Scholar] [CrossRef]
  58. Azizan, S.N.; Lee, A.S.H.; Crosling, G.; Atherton, G.; Arulanandam, B.V.; Lee, C.E. Online Learning and COVID-19 in Higher Education: The Value of IT Models in Assessing Students’ Satisfaction. Int. J. Emerg. Technol. Learn. 2022, 17, 245–278. [Google Scholar] [CrossRef]
  59. Reyes, E.G.D.; Galura, J.C.; Pineda, J.L.S. C5-LMS design using Google Classroom: User acceptance based on extended Unified Theory of Acceptance and Use of Technology. Interact. Learn. Environ. 2022, 1–10. [Google Scholar] [CrossRef]
  60. El-Sofany, H.F.; El-Seoud, S.A. Implementing effective learning with ubiquitous learning technology during coronavirus pandemic. Comput. Syst. Sci. Eng. 2022, 40, 389–404. [Google Scholar] [CrossRef]
  61. Mujalli, A.; Khan, T.; Almgrashi, A. University Accounting Students and Faculty Members Using the Blackboard Platform during COVID-19; Proposed Modification of the UTAUT Model and an Empirical Study. Sustainability 2022, 14, 2360. [Google Scholar] [CrossRef]
  62. Salloum, S.A.; Al-emran, M.; Shaalan, K.; Tarhini, A. Factors affecting the E-learning acceptance: A case study from UAE. Educ. Inf. Technol. 2019, 24, 509–530. [Google Scholar] [CrossRef]
  63. Abu-Al-Aish, A.; Love, S. Factors influencing students’ acceptance of m-learning: An investigation in higher education. Int. Rev. Res. Open Distance Learn. 2013, 14, 82–107. [Google Scholar] [CrossRef]
  64. Liu, Y.; Zhao, L.; Su, Y.-S. Exploring Factors of Preschool Parents’ Behavioral Intention to Use Face Recognition Technology on Campus. Front. Phys. 2022, 10, 857751. [Google Scholar] [CrossRef]
  65. Saprikis, V.; Avlogiaris, G.; Katarachia, A. Determinants of the intention to adopt mobile augmented reality apps in shopping malls among university students. J. Theor. Appl. Electron. Commer. Res. 2021, 16, 30. [Google Scholar] [CrossRef]
  66. Law, K.M.Y.; Geng, S. Correction to: How innovativeness and handedness affect learning performance of engineering students? Int. J. Technol. Des. Educ. 2019, 29, 1207. [Google Scholar] [CrossRef]
  67. Fishbein, M.; Ajzen, I. Belief, Attitude, Intention, and Behavior: An Introduction to Theory and Research; Addison-Wesley: Boston, MA, USA, 1975. [Google Scholar]
  68. Venkatesh, V.; Davis, F.D. Theoretical extension of the technology acceptance model: Four longitudinal field studies. Manage. Sci. 2000, 46, 186–204. [Google Scholar] [CrossRef]
  69. Palomares-Ruiz, A.; Cebrián-Martínez, A.; García-Toledano, E.; López-Parra, E. Digital gender gap in university education in Spain. Study of a case for paired samples. Technol. Forecast. Soc. Chang. 2021, 173, 121096. [Google Scholar] [CrossRef]
  70. Garg, A. Investigating the Moderating Effects of Age and Gender on Customers’ Use of Tablet Menu in Casual Dining Restaurants. J. Qual. Assur. Hosp. Tour. 2021, 1–39. [Google Scholar] [CrossRef]
  71. Erdogan, A.; Sahin, I. Relationship between math teacher candidates’ Technological Pedagogical and Content Knowledge (TPACK) and achievement levels. Procedia—Soc. Behav. Sci. 2010, 2, 2707–2711. [Google Scholar] [CrossRef]
  72. Wang, Y.S.; Wu, M.C.; Wang, H.Y. Investigating the determinants and age and gender differences in the acceptance of mobile learning. Br. J. Educ. Technol. 2009, 40, 92–118. [Google Scholar] [CrossRef]
  73. Lin, T.C.; Tsai, C.C.; Chai, C.S.; Lee, M.H. Identifying Science Teachers’ Perceptions of Technological Pedagogical and Content Knowledge (TPACK). J. Sci. Educ. Technol. 2013, 22, 325–336. [Google Scholar] [CrossRef]
  74. Hair, J.; Black, B.; Babin, B.; Anderson, R.E.; Tatham, R.L. Multivariate Data Analysis, 6th ed.; Prentice Hall: Hoboken, NJ, USA, 2006. [Google Scholar]
  75. Hair, J.F.; Hult, G.T.M.; Ringle, C.; Sarstedt, M. A Primer on Partial Least Squares Structural Equation Modeling (PLS-SEM); SAGE Publications: Thousand Oaks, CA, USA, 2016. [Google Scholar]
  76. Leow, L.P.; Phua, L.K.; Teh, S.Y. Extending the social influence factor: Behavioural intention to increase the usage of information and communication technology-enhanced student-centered teaching methods. Educ. Technol. Res. Dev. 2021, 69, 1853–1879. [Google Scholar] [CrossRef]
  77. Jiang, H.; Islam, A.Y.M.A.; Gu, X.; Spector, J.M. Online learning satisfaction in higher education during the COVID-19 pandemic: A regional comparison between Eastern and Western Chinese universities. Educ. Inf. Technol. 2021, 26, 6747–6769. [Google Scholar] [CrossRef]
  78. Kock, N. Common method bias in PLS-SEM: A full collinearity assessment approach. Int. J. E-Collab. 2015, 11, 1–10. [Google Scholar] [CrossRef]
  79. Fornell, C.; Larcker, D.F. Evaluating structural equation models with unobservable variables and measurement error. J. Mark. Res. 1981, 18, 39–50. [Google Scholar] [CrossRef]
  80. Wut, T.M.; Lee, S.W.; Xu, J.B. How do Facilitating Conditions Influence Student-to-Student Interaction within an Online Learning Platform? A New Typology of the Serial Mediation Model. Educ. Sci. 2022, 12, 337. [Google Scholar] [CrossRef]
  81. Law, L.; Fong, N. Applying partial least squares structural equation modeling (PLS-SEM) in an investigation of undergraduate students’ learning transfer of academic English. J. English Acad. Purp. 2020, 46, 100884. [Google Scholar] [CrossRef]
  82. Morchid, N. The Determinants of Use and Acceptance of Mobile Assisted Language Learning: The Case of EFL Students in Morocco. Arab World Eng. J. 2019, 5, 76–97. [Google Scholar] [CrossRef]
  83. Moorthy, K.; T’Ing, L.C.; Ming, K.S.; Ping, C.C.; Ping, L.Y.; Joe, L.Q.; Jie, W.Y. Behavioral Intention to Adopt Digital Library by the Undergraduates. Int. Inf. Libr. Rev. 2019, 51, 128–144. [Google Scholar] [CrossRef]
  84. Henseler, J.; Ringle, C.M.; Sarstedt, M. A new criterion for assessing discriminant validity in variance-based structural equation modeling. J. Acad. Mark. Sci. 2015, 43, 115–135. [Google Scholar] [CrossRef]
  85. Diamantopoulos, A.; Siguaw, J.A. Formative versus reflective indicators in organizational measure development: A comparison and empirical illustration. Br. J. Manag. 2006, 17, 263–282. [Google Scholar] [CrossRef]
  86. Alvi, I. College students’ reception of social networking tools for learning in India: An extended UTAUT model. Smart Learn. Environ. 2021, 8, 1–18. [Google Scholar] [CrossRef]
  87. Mukminin, A.; Habibi, A.; Muhaimin, M.; Asrial, A.; Haryanto, E.; Setiono, P.; Sofyan, S. Vocational Technical High School teachers’ beliefs towards ICT for the 21 st century education: Indonesian context. Probl. Educ. 21st Century 2019, 77, 22–38. [Google Scholar] [CrossRef]
  88. Mulyani, E.A.; Alpusari, M.; Putra, E.D. The Effect of Learning Facilities and Family Environment on Motivation to Learn of Prospective Elementary Teacher Education on Online Learning. J. Teach. Learn. Elem. Educ. 2021, 4, 89. [Google Scholar] [CrossRef]
  89. Shiferaw, K.B.; Mengiste, S.A.; Gullslett, M.K.; Zeleke, A.A.; Tilahun, B.; Tebeje, T.; Wondimu, R.; Desalegn, S.; Mehari, E.A. Healthcare providers’ acceptance of telemedicine and preference of modalities during COVID-19 pandemics in a low-resource setting: An extended UTAUT model. PLoS ONE 2021, 16, 1–15. [Google Scholar] [CrossRef]
  90. Wijaya, T.T.; Zhou, Y.; Houghton, T.; Weinhandl, R.; Lavicza, Z.; Yusop, F.D. Factors affecting the use of digital mathematics textbooks in indonesia. Mathematics 2022, 10, 1808. [Google Scholar] [CrossRef]
  91. Stone, M. Cross-validatory choice and assessment of statistical predictions. J. R. Stat. Soc. 1974, 36, 111–133. [Google Scholar] [CrossRef]
  92. Yusop, F.D. Exploring the factors affecting pre-service science teachers ’ actual use of technology during teaching practice Exploring the factors affecting pre-service science t eachers ’ actual use of technology during teaching practice. S. Afr. J. Educ. 2022, 42, 1–11. [Google Scholar] [CrossRef]
  93. Almekhlafi, A.G. The effect of E-books on Preservice student teachers’ achievement and perceptions in the United Arab Emirates. Educ. Inf. Technol. 2021, 26, 1001–1021. [Google Scholar] [CrossRef]
  94. Akar, E.; Mardikyan, S. Analyzing factors affecting users ’ behavior intention to use social media: Twitter. Int. J. Bus. Soc. Sci. 2014, 5, 85–95. [Google Scholar]
  95. Turner, A. Generation Z: Technology and Social Interest. J. Individ. Psychol. 2015, 71, 103–113. [Google Scholar] [CrossRef]
  96. Cilliers, E.J. The Challenge of Teaching Generation Z. People Int. J. Soc. Sci. 2017, 3, 188–198. [Google Scholar] [CrossRef]
  97. Priporas, C.V.; Stylos, N.; Fotiadis, A.K. Generation Z consumers’ expectations of interactions in smart retailing: A future agenda. Comput. Hum. Behav. 2017, 77, 374–381. [Google Scholar] [CrossRef]
  98. Zhou, Y.; Li, X.; Wijaya, T.T. Determinants of Behavioral Intention and Use of Interactive Whiteboard by K-12 Teachers in Remote and Rural Areas. Front. Psychol. 2022, 13, 934423. [Google Scholar] [CrossRef]
  99. Joa, C.Y.; Magsamen-Conrad, K. Social influence and UTAUT in predicting digital immigrants’ technology use. Behav. Inf. Technol. 2021, 41, 1620–1638. [Google Scholar] [CrossRef]
  100. Saxton, E.; Burns, R.; Holveck, S.; Kelley, S.; Prince, D.; Rigelman, N.; Skinner, E.A. A Common Measurement System for K-12 STEM education: Adopting an educational evaluation methodology that elevates theoretical foundations and systems thinking. Stud. Educ. Eval. 2014, 40, 18–35. [Google Scholar] [CrossRef]
Figure 1. Preservice teachers practice STEM education in schools.
Sustainability 14 09925 g001
Figure 2. The original model of the Theory of Planned Behavior.
Sustainability 14 09925 g002
Figure 3. The proposed conceptual model developed from the original TPB model [11].
Sustainability 14 09925 g003
Figure 4. CFA and R-square values in PLS.
Sustainability 14 09925 g004
Figure 5. Final model with R square and path coefficient.
Sustainability 14 09925 g005
Figure 6. Hypothesis testing results. The dotted red line indicates the relationship is not significant. Note: * p < 0.05, ** p < 0.01 *** p < 0.001.
Sustainability 14 09925 g006
Table 1. Demographic Respondent Data.
Data DemographyN%
gendermale309.14
female17185.07
ageunder 205426.87
20–2514773.13
majormathematics13667.66
physics178.46
biology2914.43
chemistry199.45
Table 2. Descriptive statistics data for data normality testing.
MeanMinMaxStandard DeviationExcess KurtosisSkewness
KNW14.0051.0005.0000.8200.397−0.665
KNW23.7961.0005.0000.7942.013−1.000
KNW33.5721.0005.0000.8730.058−0.359
KNW44.0251.0005.0000.7291.362−0.737
VAL13.9802.0005.0000.684−0.582−0.069
VAL24.0202.0005.0000.6540.049−0.236
VAL33.9602.0005.0000.675−0.258−0.147
VAL43.9502.0005.0000.718−0.430−0.170
VAL54.1642.0005.0000.660−0.308−0.297
VAL64.0752.0005.0000.661−0.343−0.187
ATD14.1843.0005.0000.565−0.1690.008
ATD24.1592.0005.0000.6100.158−0.233
ATD33.9052.0005.0000.681−0.6120.025
SN13.5321.0005.0000.829−0.2970.108
SN23.9201.0005.0000.7220.135−0.198
SN33.8361.0005.0000.7180.507−0.313
PBC14.0953.0005.0000.5240.5270.111
PBC24.0652.0005.0000.6071.233−0.435
PBC34.0852.0005.0000.5881.655−0.462
PBC44.0902.0005.0000.5921.589−0.461
PU14.1493.0005.0000.629−0.536−0.126
PU24.0353.0005.0000.649−0.617−0.034
PU34.1143.0005.0000.663−0.736−0.131
BI13.8212.0005.0000.704−0.8060.182
BI24.0903.0005.0000.671−0.777−0.107
HB13.5121.0005.0000.8640.014−0.085
HB23.7261.0005.0000.8340.321−0.276
INV14.1142.0005.0000.6160.111−0.204
INV24.1243.0005.0000.654−0.680−0.133
INV34.0402.0005.0000.653−0.280−0.148
INV43.5921.0005.0000.877−0.476−0.083
ANX14.0603.0005.0000.681−0.840−0.075
ANX23.6822.0005.0000.874−0.721−0.096
ANX33.7412.0005.0000.787−0.6110.001
Table 3. Cronbach alpha, CR, AVE, and Rho-A values for internal consistency reliability and validity analysis.
ConstructCronbach’s AlphaRho-AComposite
Reliability
Average Variance
Extracted (AVE)
ATD0.8310.8600.8960.743
BI0.7270.7280.8800.786
HABIT0.8360.8420.9240.859
INNOVATIVENESS0.8990.9000.9520.908
KNOWLEDGE0.8790.8810.9170.735
PBC0.9370.9450.9550.843
PU0.8470.8650.9070.765
SN0.8910.8990.9330.822
VALUE0.9200.9230.9380.715
Table 4. Fornell–Larcker criterion value of smart PLS software.
ATDBIHABITINVKNWPBCPUSNVALUE
ATD0.862
BI0.5670.886
HABIT0.4290.7500.927
INV0.5470.6430.5370.953
KNW0.4040.3820.3790.5260.858
PBC0.5920.6270.5600.5630.4460.918
PU0.6880.6210.4020.6570.3760.6110.874
SN0.4500.6290.6810.5180.3790.5670.4940.907
VALUE0.6900.6160.5700.5710.4860.6640.5930.5010.846
Note: The bold and diagonal values indicate the square root of AVE and the correlation between constructs unable to exceed the AVE square root, respectively.
Table 5. Heterotrait–monotrait value (HTMT) for discriminant validity testing.
ATDBIHABITINVKNWPBCPUSNVALUE
ATD
BI0.702
HABIT0.4770.863
INV0.6190.7920.616
KNW0.4520.4700.4350.589
PBC0.6610.7560.6270.6130.484
PU0.8010.7670.4450.7400.4250.674
SN0.4950.7800.7940.5770.4230.6160.547
VALUE0.7730.7480.6420.6260.5350.7100.6610.542
Table 6. Variance Inflation Factor (VIF) value.
ConstructVIF ValueConstructVIF Value
ATD12.348PBC36.500
ATD22.205PBC46.605
ATD31.611PU12.087
BI11.485PU22.763
BI21.485PU31.900
HB12.067SN12.092
HB22.067SN23.263
INV13.002SN33.446
INV23.002VAL12.899
KNW13.135VAL23.720
KNW23.366VAL33.473
KNW31.759VAL42.357
KNW42.574VAL53.865
PBC12.585VAL62.776
PBC23.250
Table 7. Results of initial hypothesis testing and path estimation.
HypothesisβMeanSTDEVT Statisticsp-ValuesHypothesis Testing Results
H1KNOWLEDGE → ATD0.1300.1360.0632.0620.040supported
H2KNOWLEDGE → PU0.1140.1100.0781.4590.145Not supported
H3KNOWLEDGE → SN0.1770.1670.0921.9240.050supported
H4KNOWLEDGE → PBC0.1610.1590.0811.9750.049supported
H5VALUE → PU0.5380.5400.0767.0700.000supported
H6VALUE → SN0.4150.4220.0745.6370.000supported
H7VALUE → PBC0.5860.5870.0649.1590.000supported
H8HABIT → ATD0.1460.1450.0572.5570.011supported
H9PU → ATD0.5800.5780.05710.2570.000supported
H10HABIT → BI0.4870.4900.0647.6460.000supported
H11ATD → BI0.0660.0650.0611.0830.280Not supported
H12PU → BI0.2240.2270.0673.3350.001supported
H13SN → BI0.0450.0480.0580.7760.438Not supported
H14PBC → BI0.0800.0830.0731.1030.271Not supported
H15INNOVATIVENESS → BI0.1310.1210.0642.0450.041supported
Table 8. Coefficient of determination (R2).
ConstructR2Interpretation
PU0.362moderate
SN0.275moderate
PBC0.461moderate
ATD0.514moderate
BI0.704moderate
Table 9. Q2 Value.
Table 9. Q2 Value.
ConstructSSOSSEQ2 (=1 − SSE/SSO)Interpretation Q2 Value
ATD603.000387.1970.358large
BI402.000186.4120.536large
PBC804.000495.7560.383large
PU603.000446.7210.259medium
SN603.000472.1870.217medium
Table 10. Value of effect size.
Relationship F-SquareEffect Size
ATD → BI0.007small
HABIT → ATD0.034small
HABIT → BI0.367large
INNOVATIVENESS → BI0.027small
KNOWLEDGE → ATD0.028small
KNOWLEDGE → PBC0.037small
KNOWLEDGE → PU0.016small
KNOWLEDGE → SN0.033small
PBC → BI0.010small
PU → ATD0.540large
PU → BI0.064small
SN → BI0.003small
VALUE → PBC0.487large
VALUE → PU0.346large
VALUE → SN0.182medium
Table 11. Results of testing gender differences in STEM education using a t-test.
VariableMaleFemalet-Valuep-Value
MeanStdMeanStd
KNW3.85000.758863.84940.678710.0000.997
VAL4.08330.441504.01460.592670.3670.545
ATD3.93330.490524.10920.539712.7790.097
SN3.97780.806743.72510.658153.5040.063
PBC4.15000.418334.07160.550050.5520.458
PU4.10000.411994.09940.591770.0000.996
BI4.10000.635183.92980.604681.9910.160
HB3.75000.751443.59650.795790.9650.327
INV3.84170.497773.98980.605951.6000.207
Table 12. The results of the age difference test on STEM education using the t-test.
ConstructUnder 2020–25t-Valuep-Value
MeanStdMeanStd
KNW3.87500.663663.84010.700380.1010.751
VAL3.95680.662084.04990.535791.0460.308
ATD4.08020.575304.08390.521740.0020.966
SN3.92590.665623.70290.685944.2390.041
PBC4.14350.531114.06120.532820.9440.333
PU4.04940.608844.11790.552840.5740.449
BI4.08330.678163.90820.579383.2860.071
HB3.83330.812643.54080.768635.5460.019
INV4.08330.616213.92520.579632.8420.093
Publisher’s Note: MDPI stays neutral with regard to jurisdictional claims in published maps and institutional affiliations.

