
Rainfall and Runoff Trend Analysis in the Wadi Mina Basin (Northern Algeria) Using Non-Parametric Tests and the ITA Method


Abstract
:1. Introduction
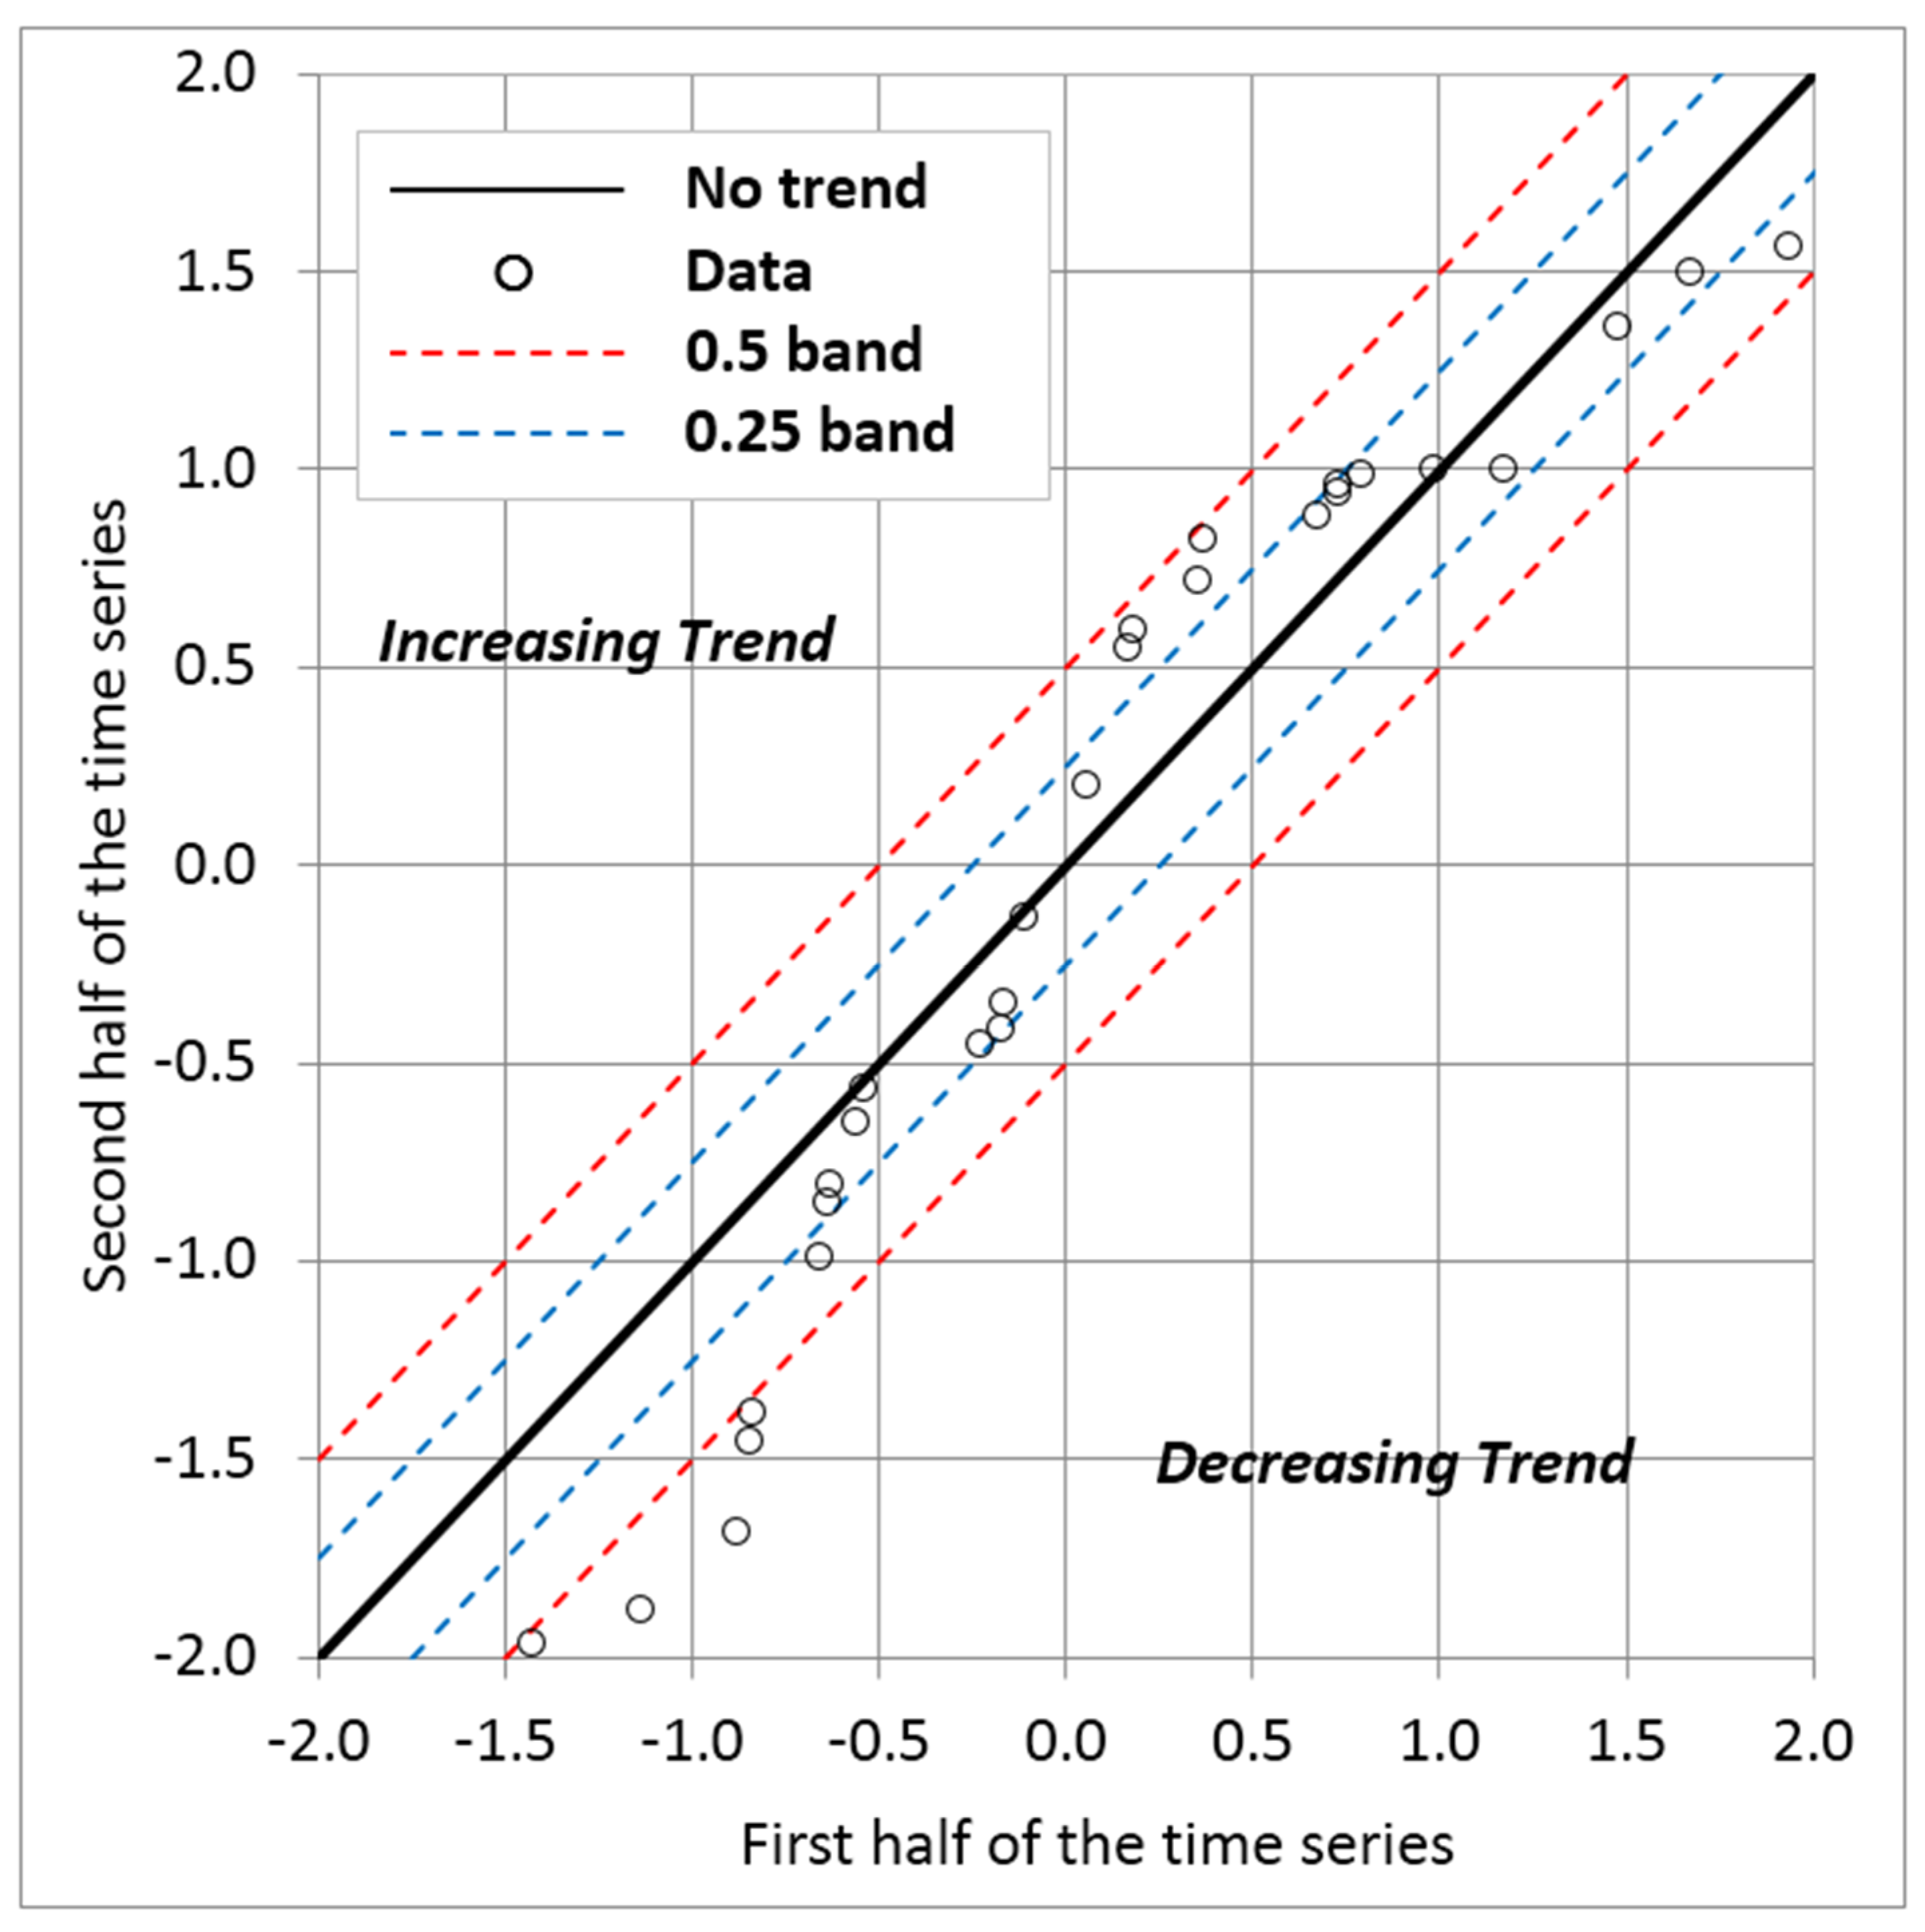
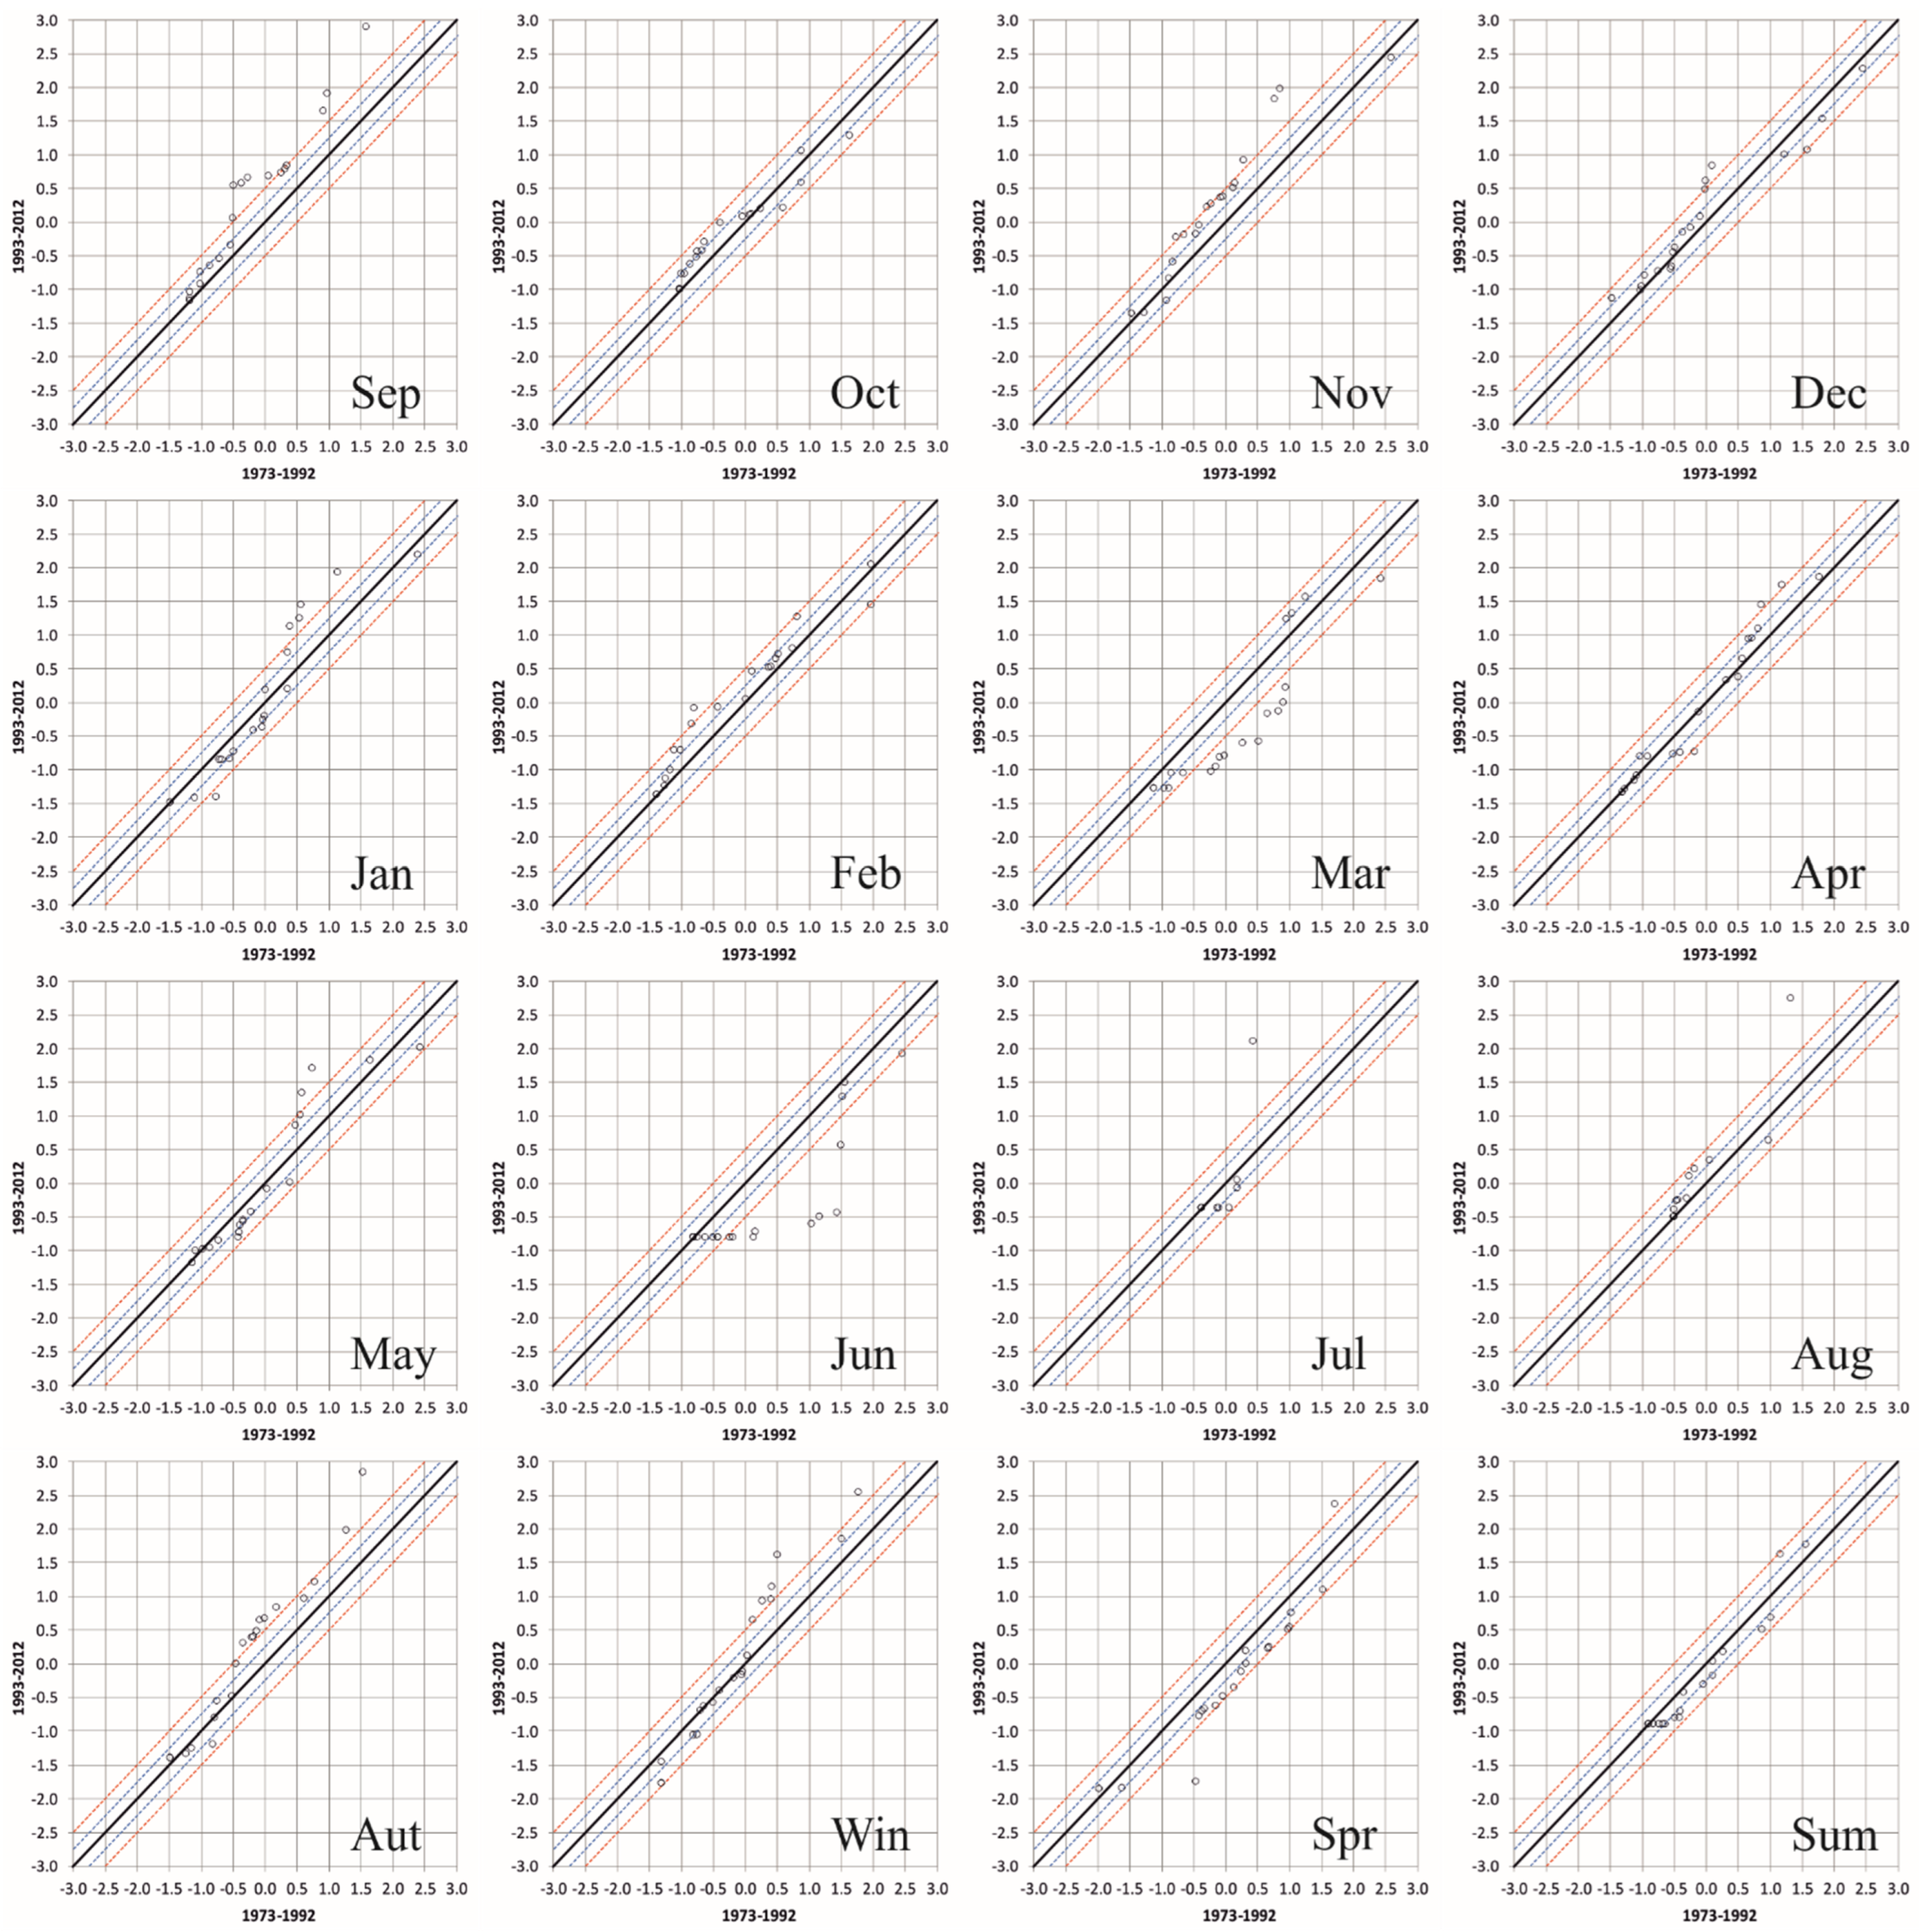
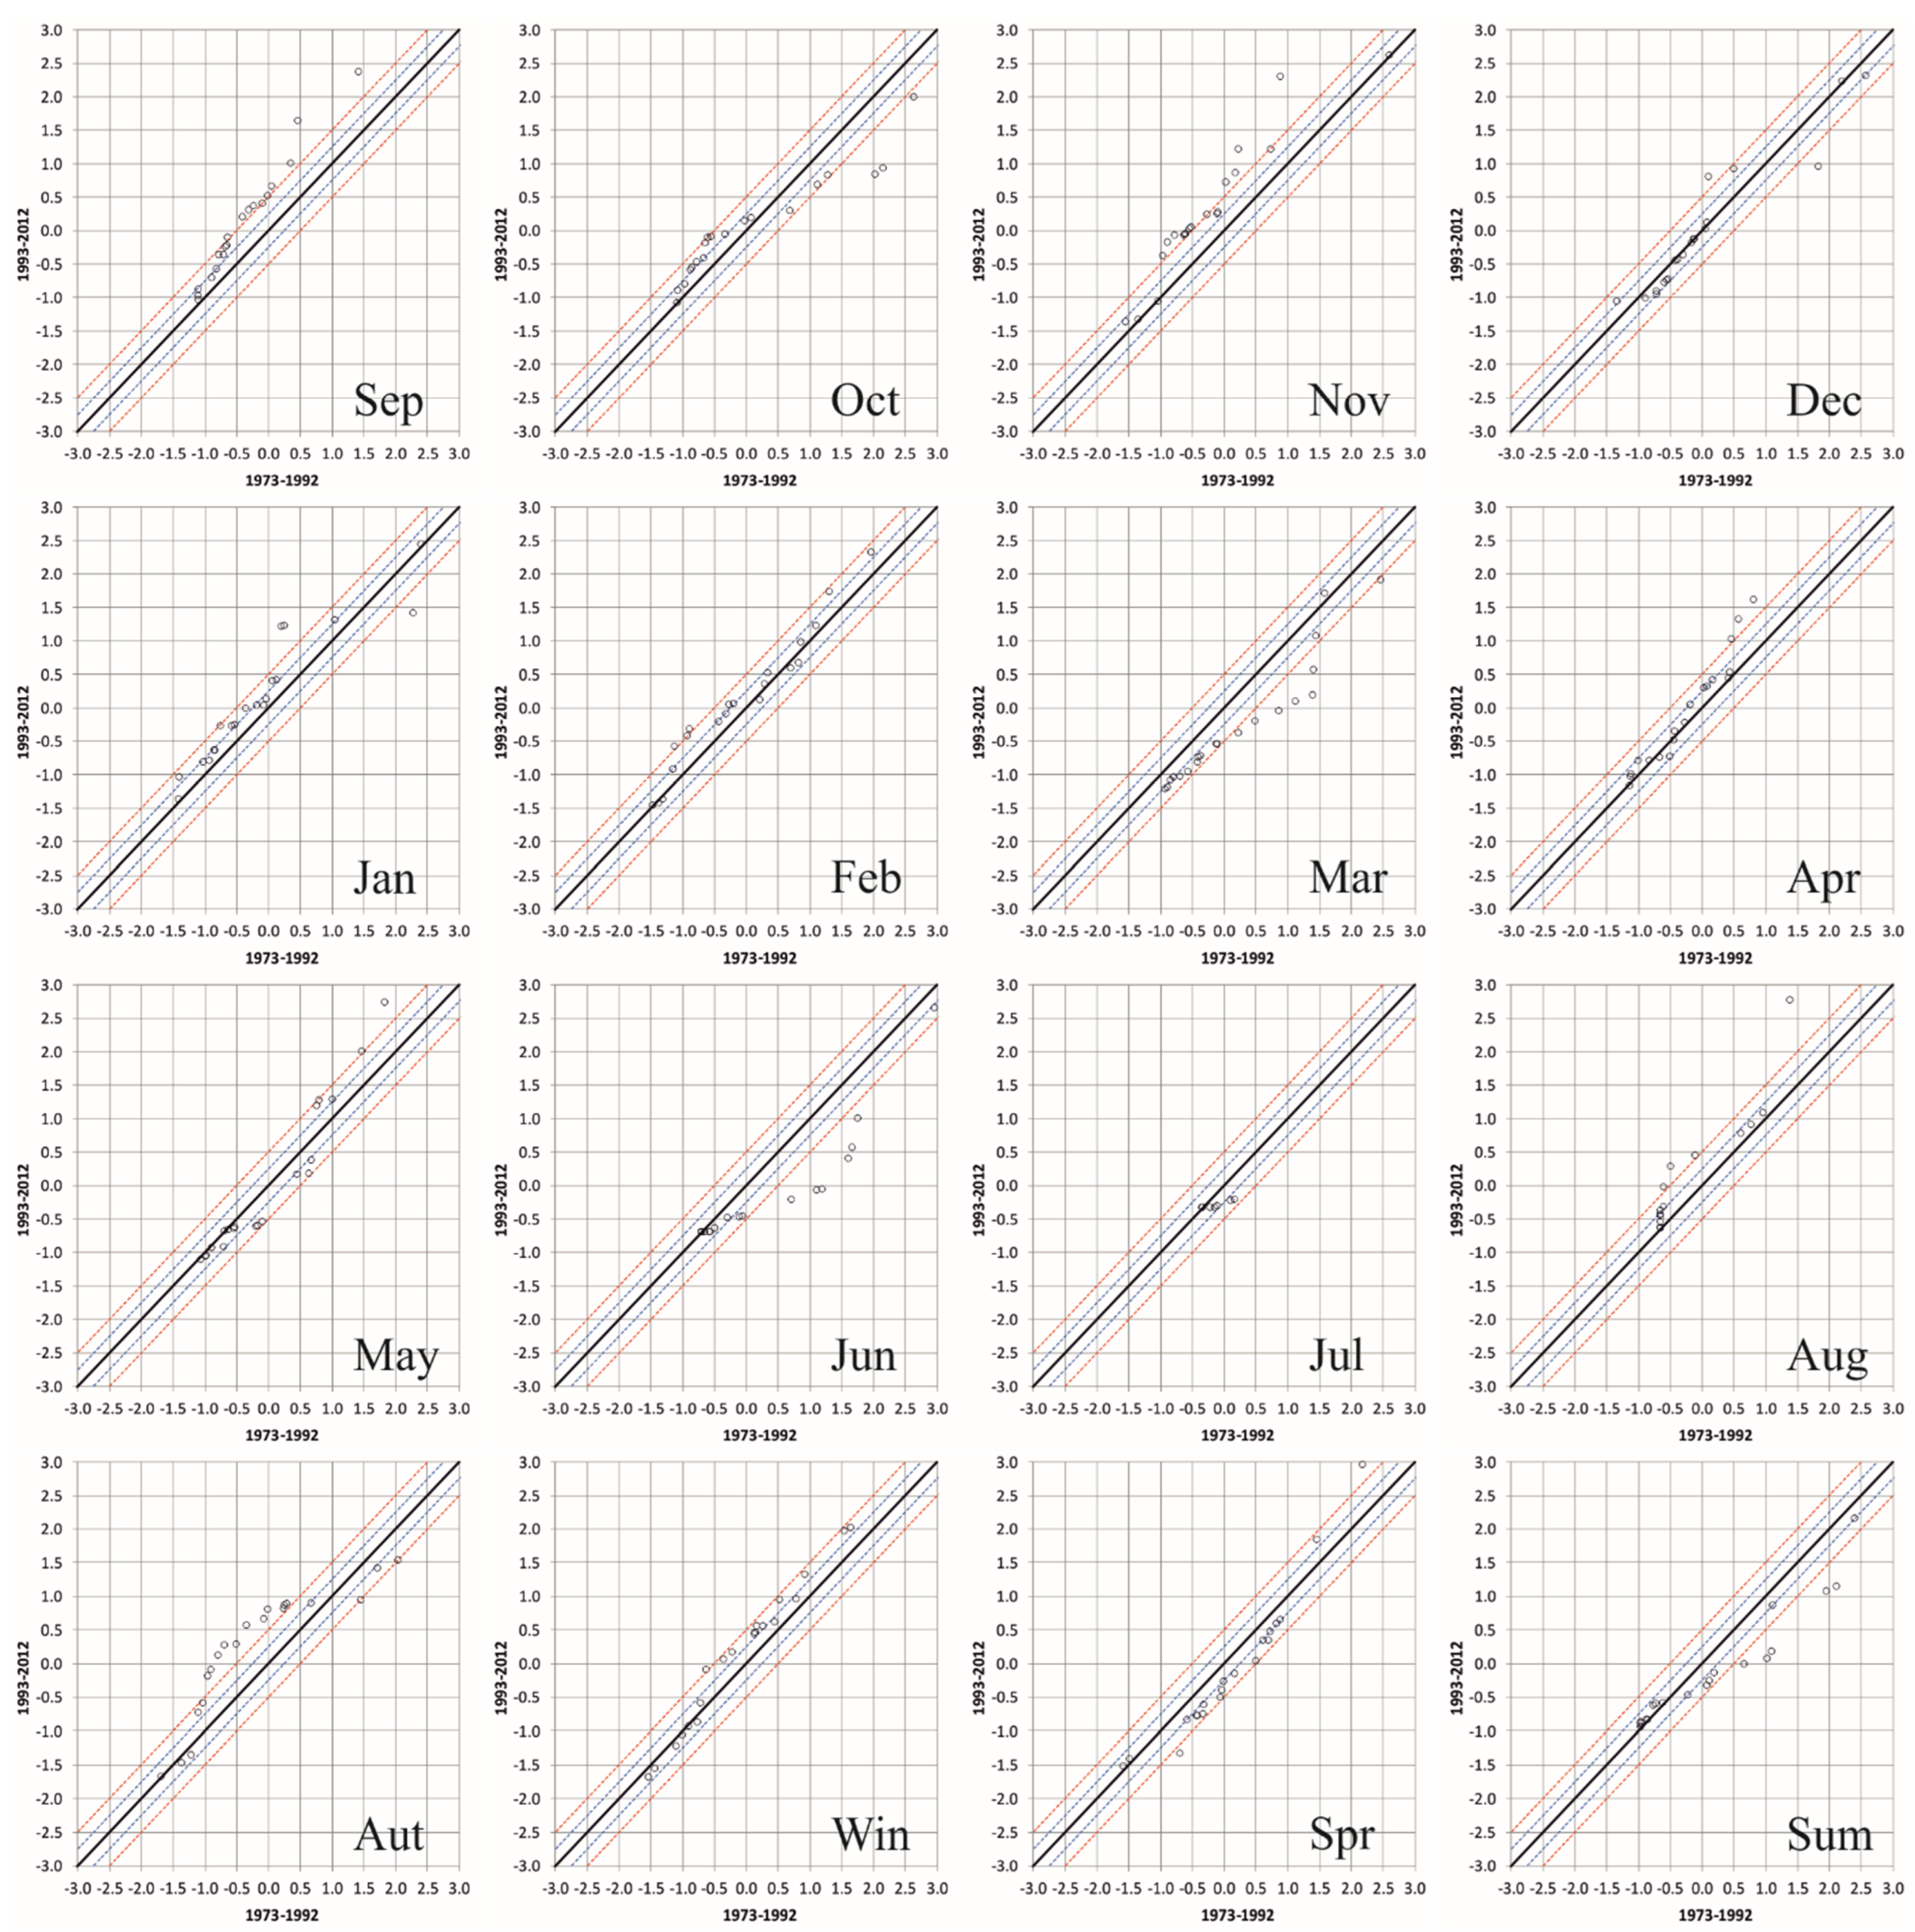
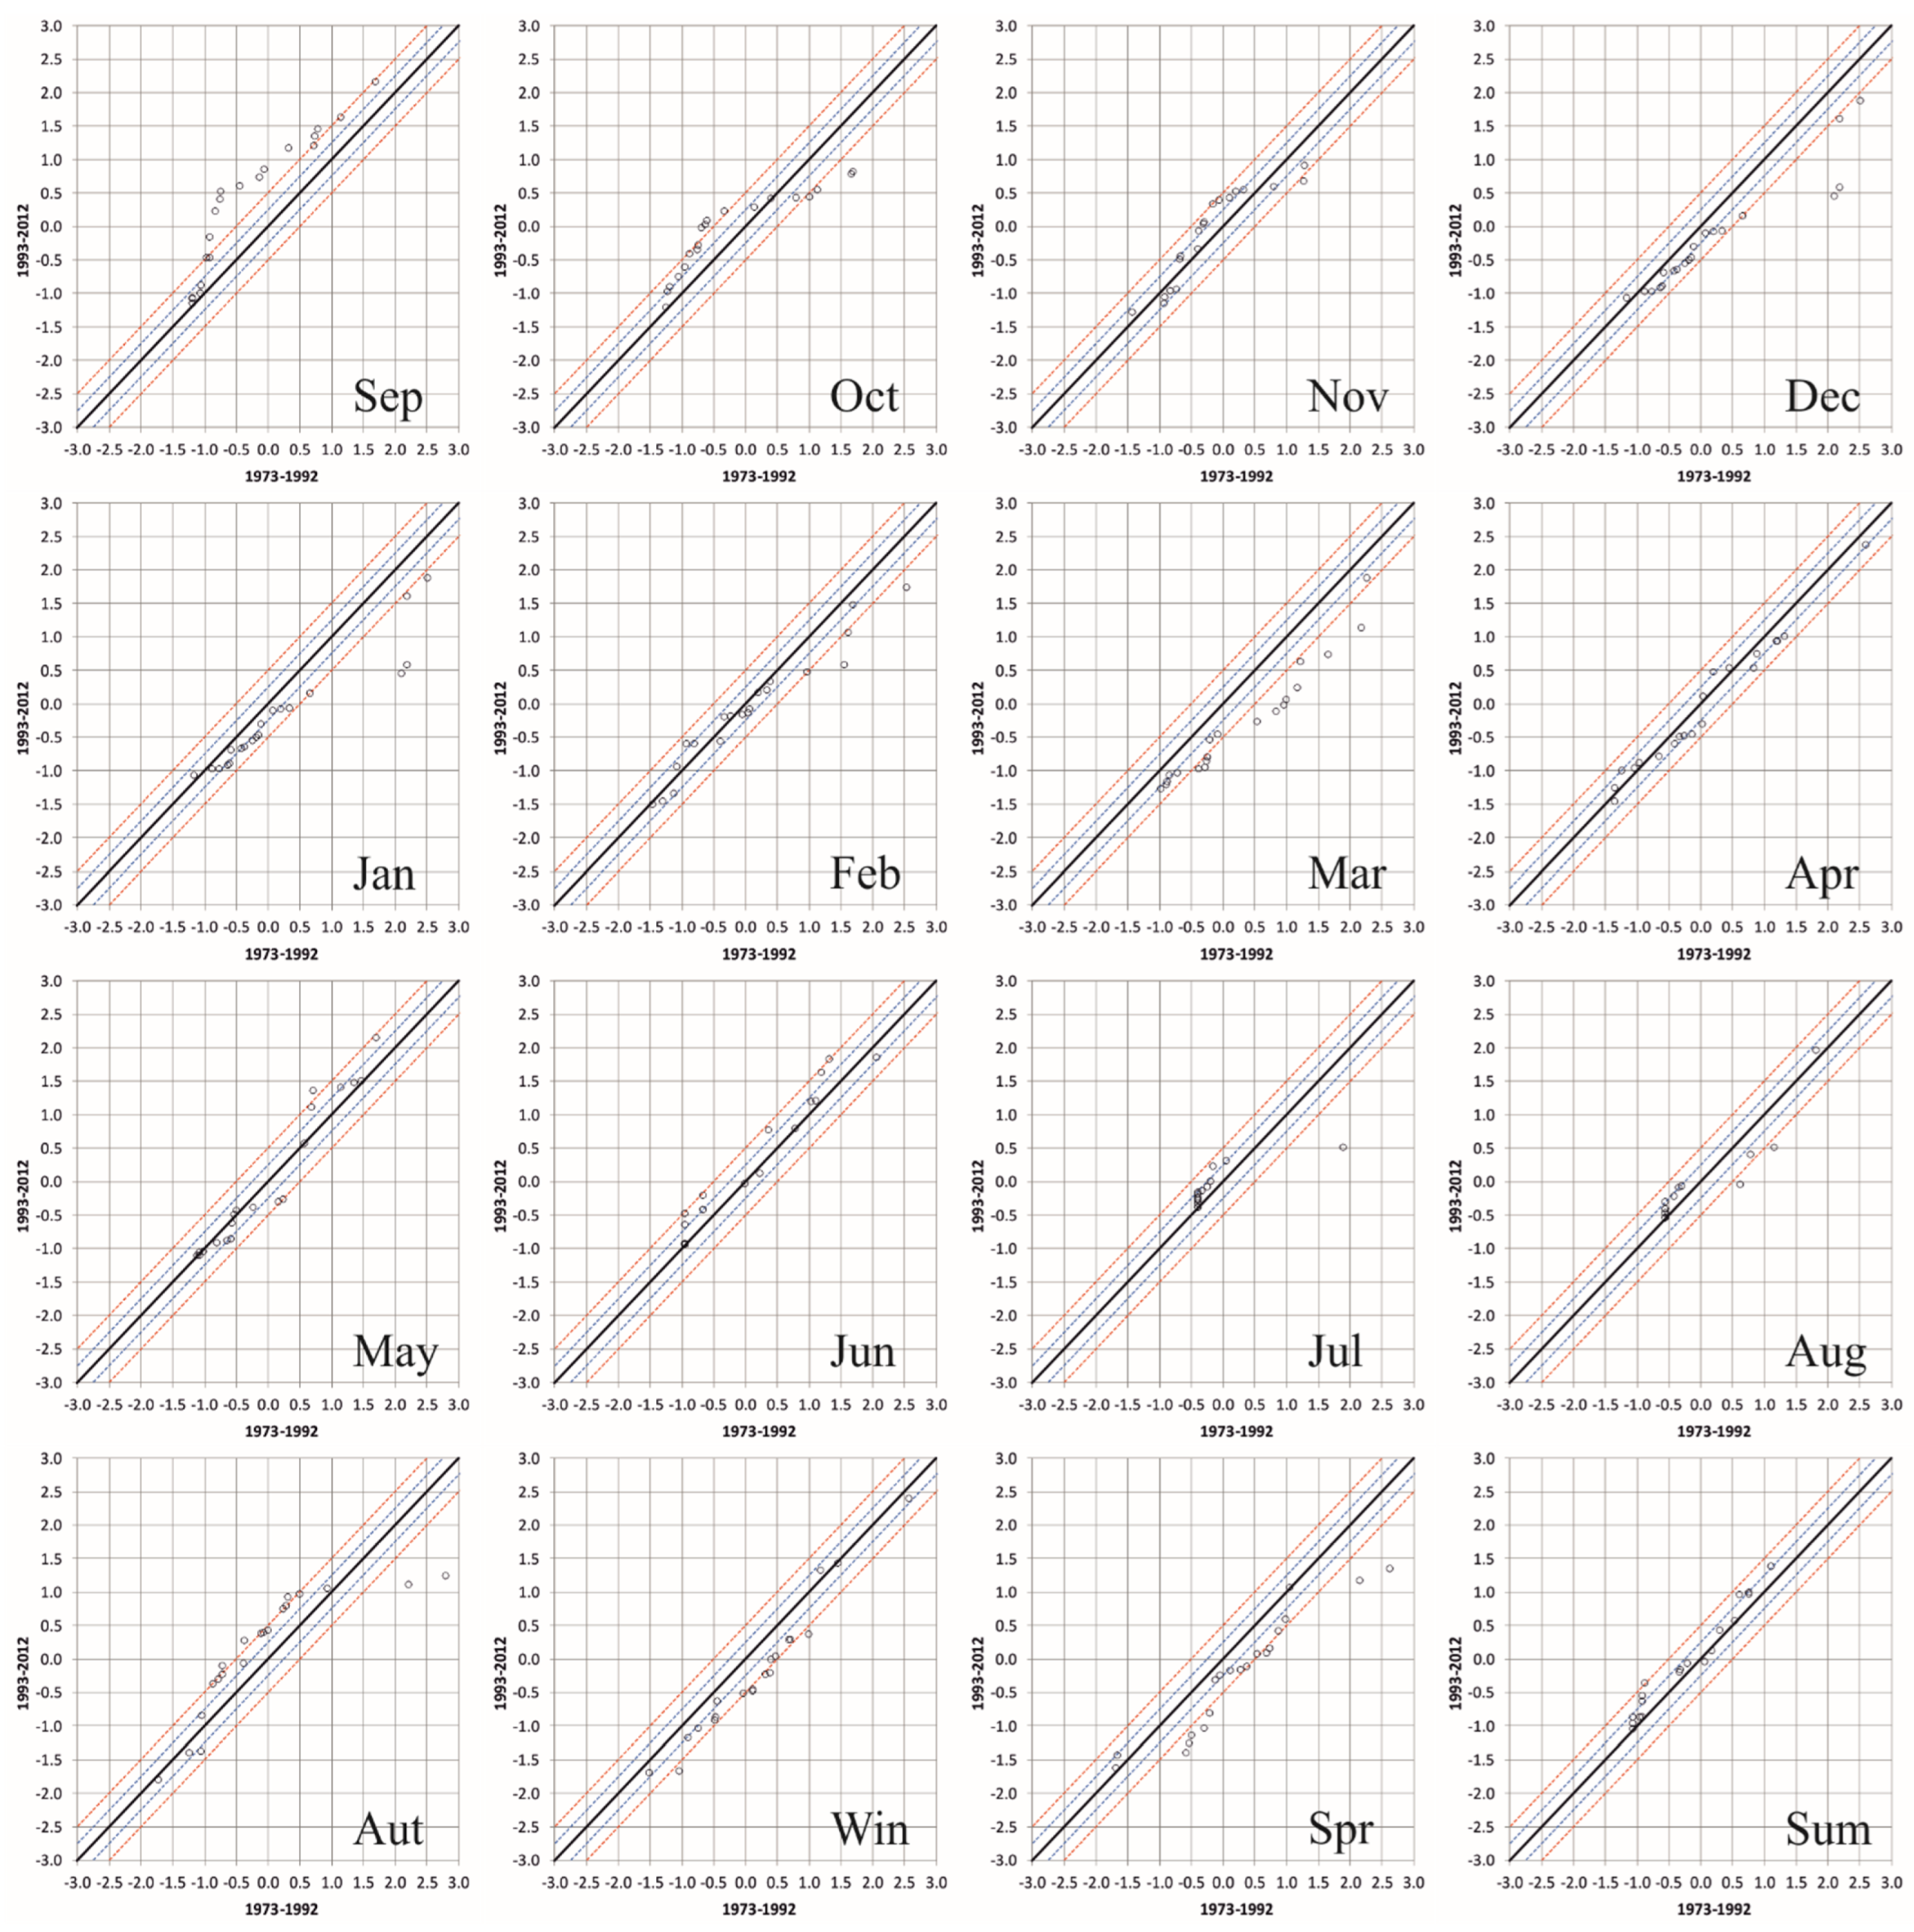
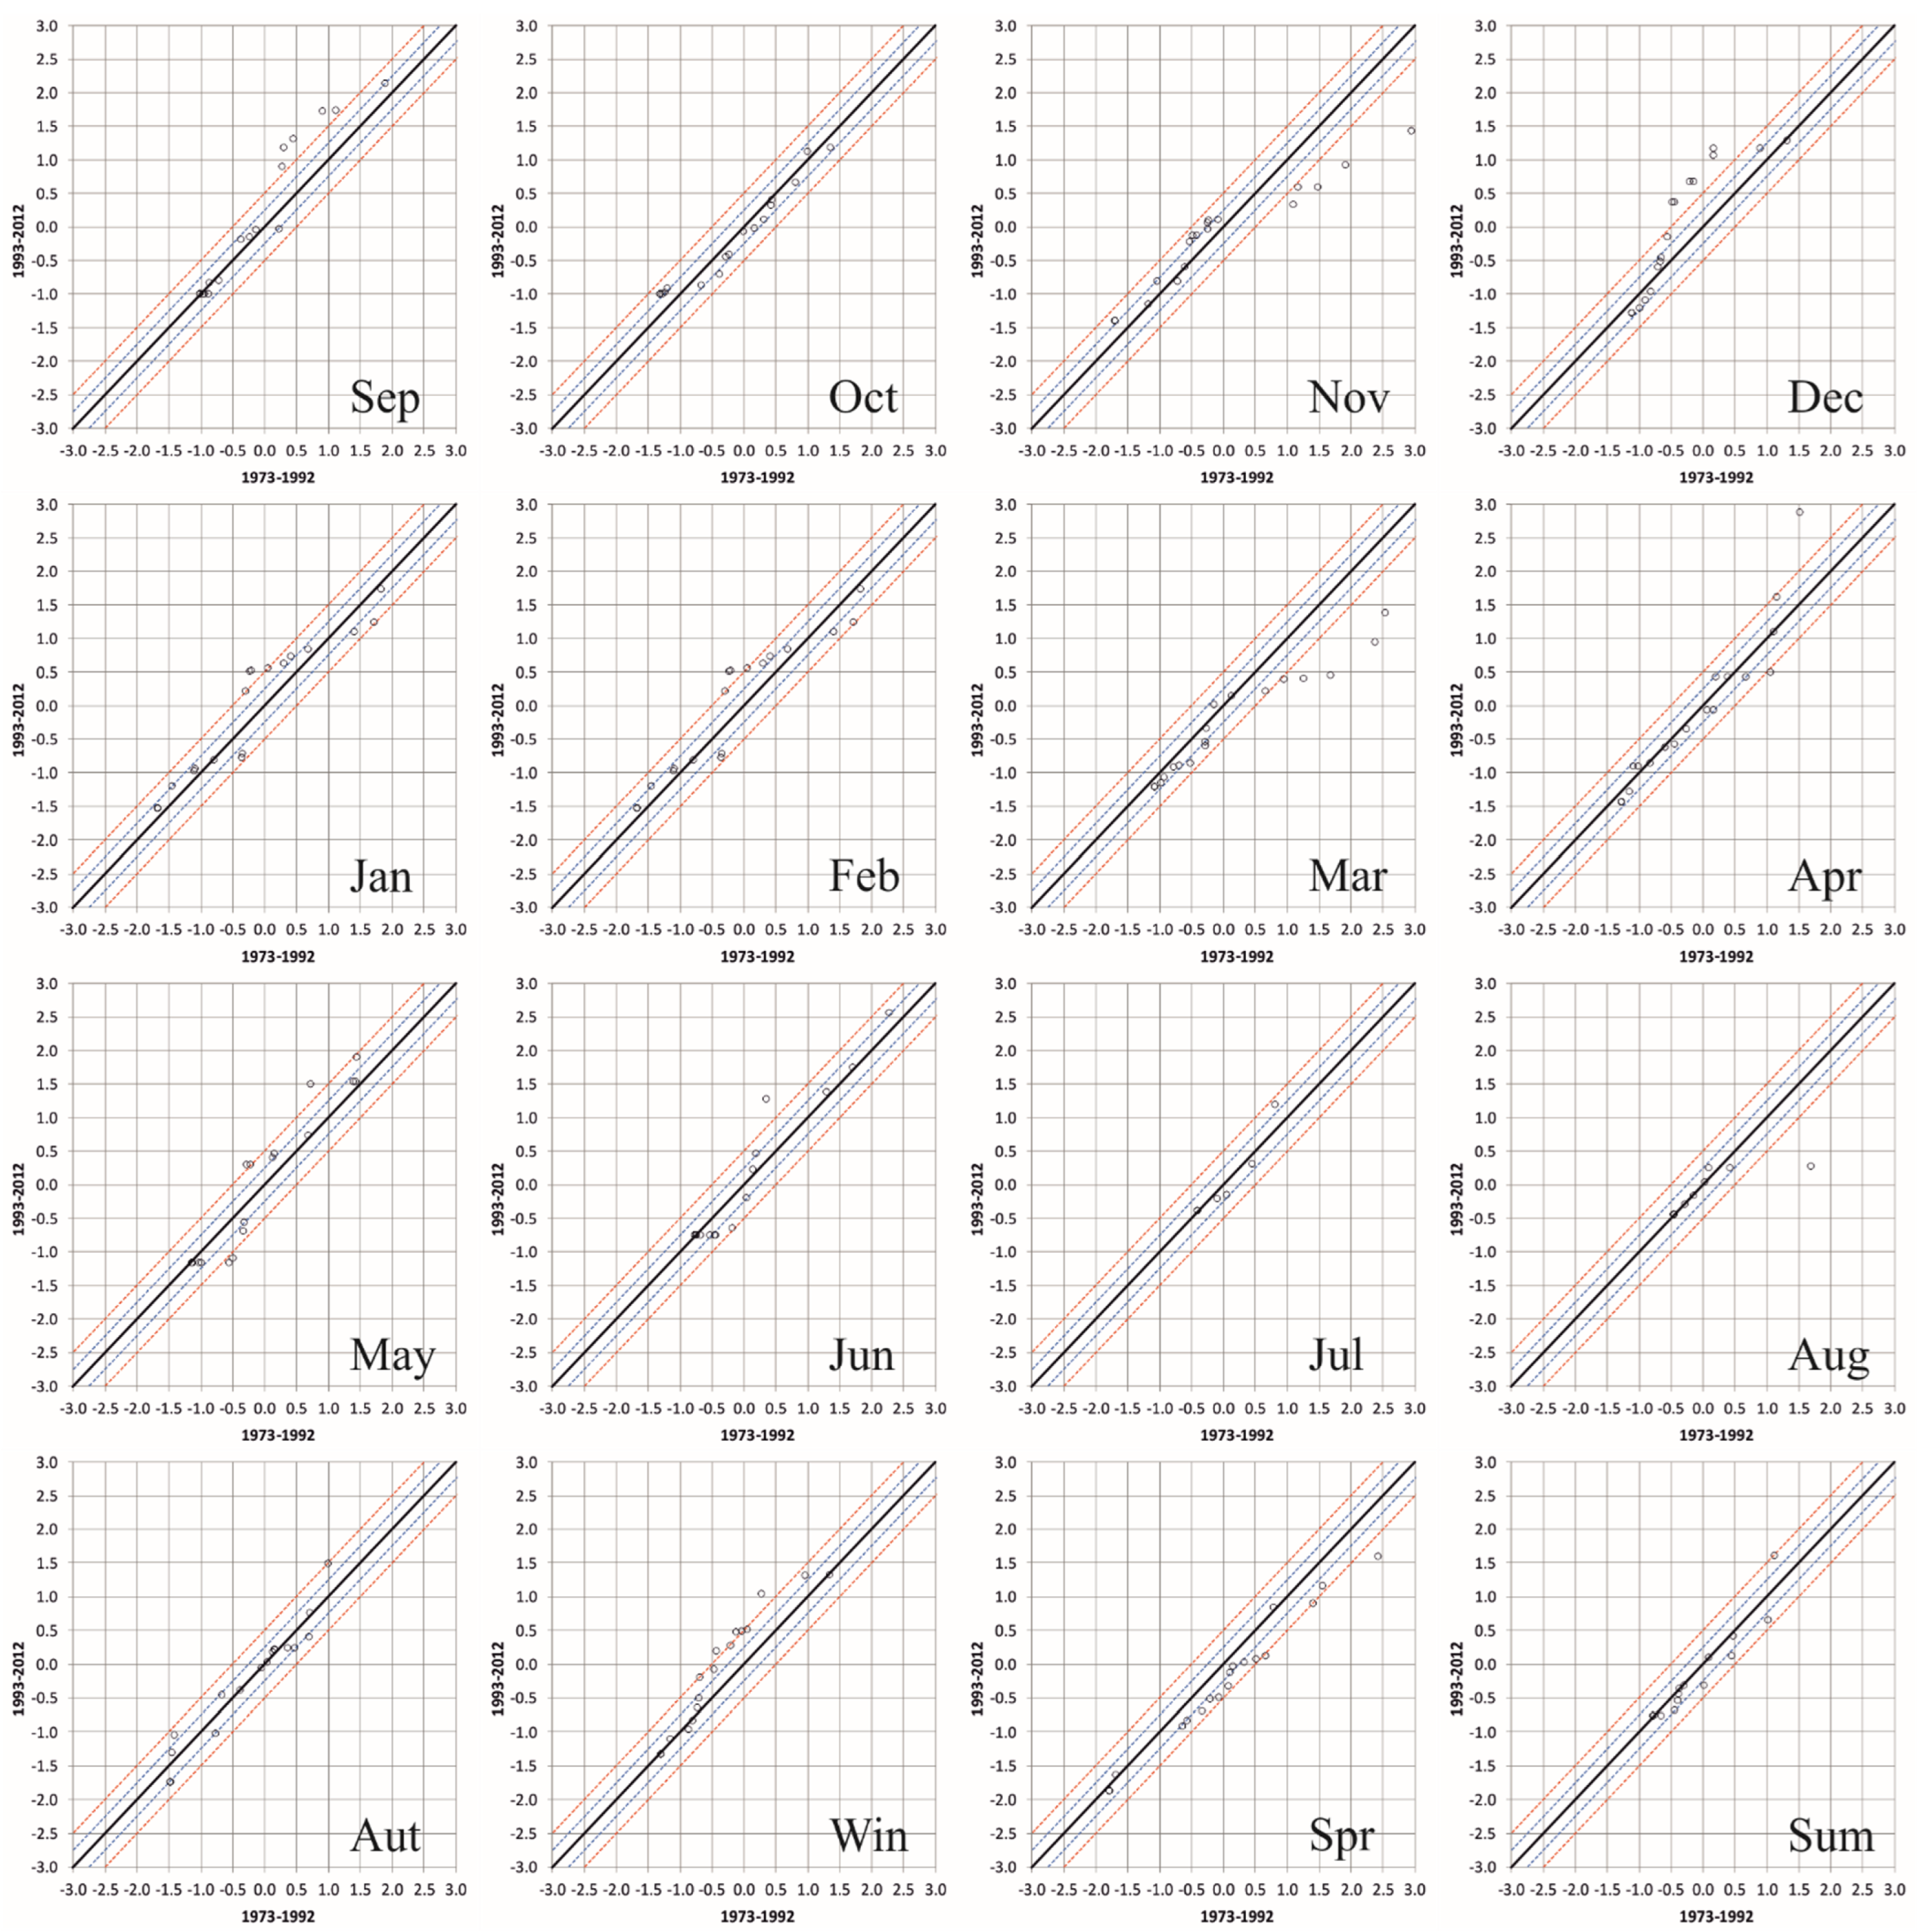
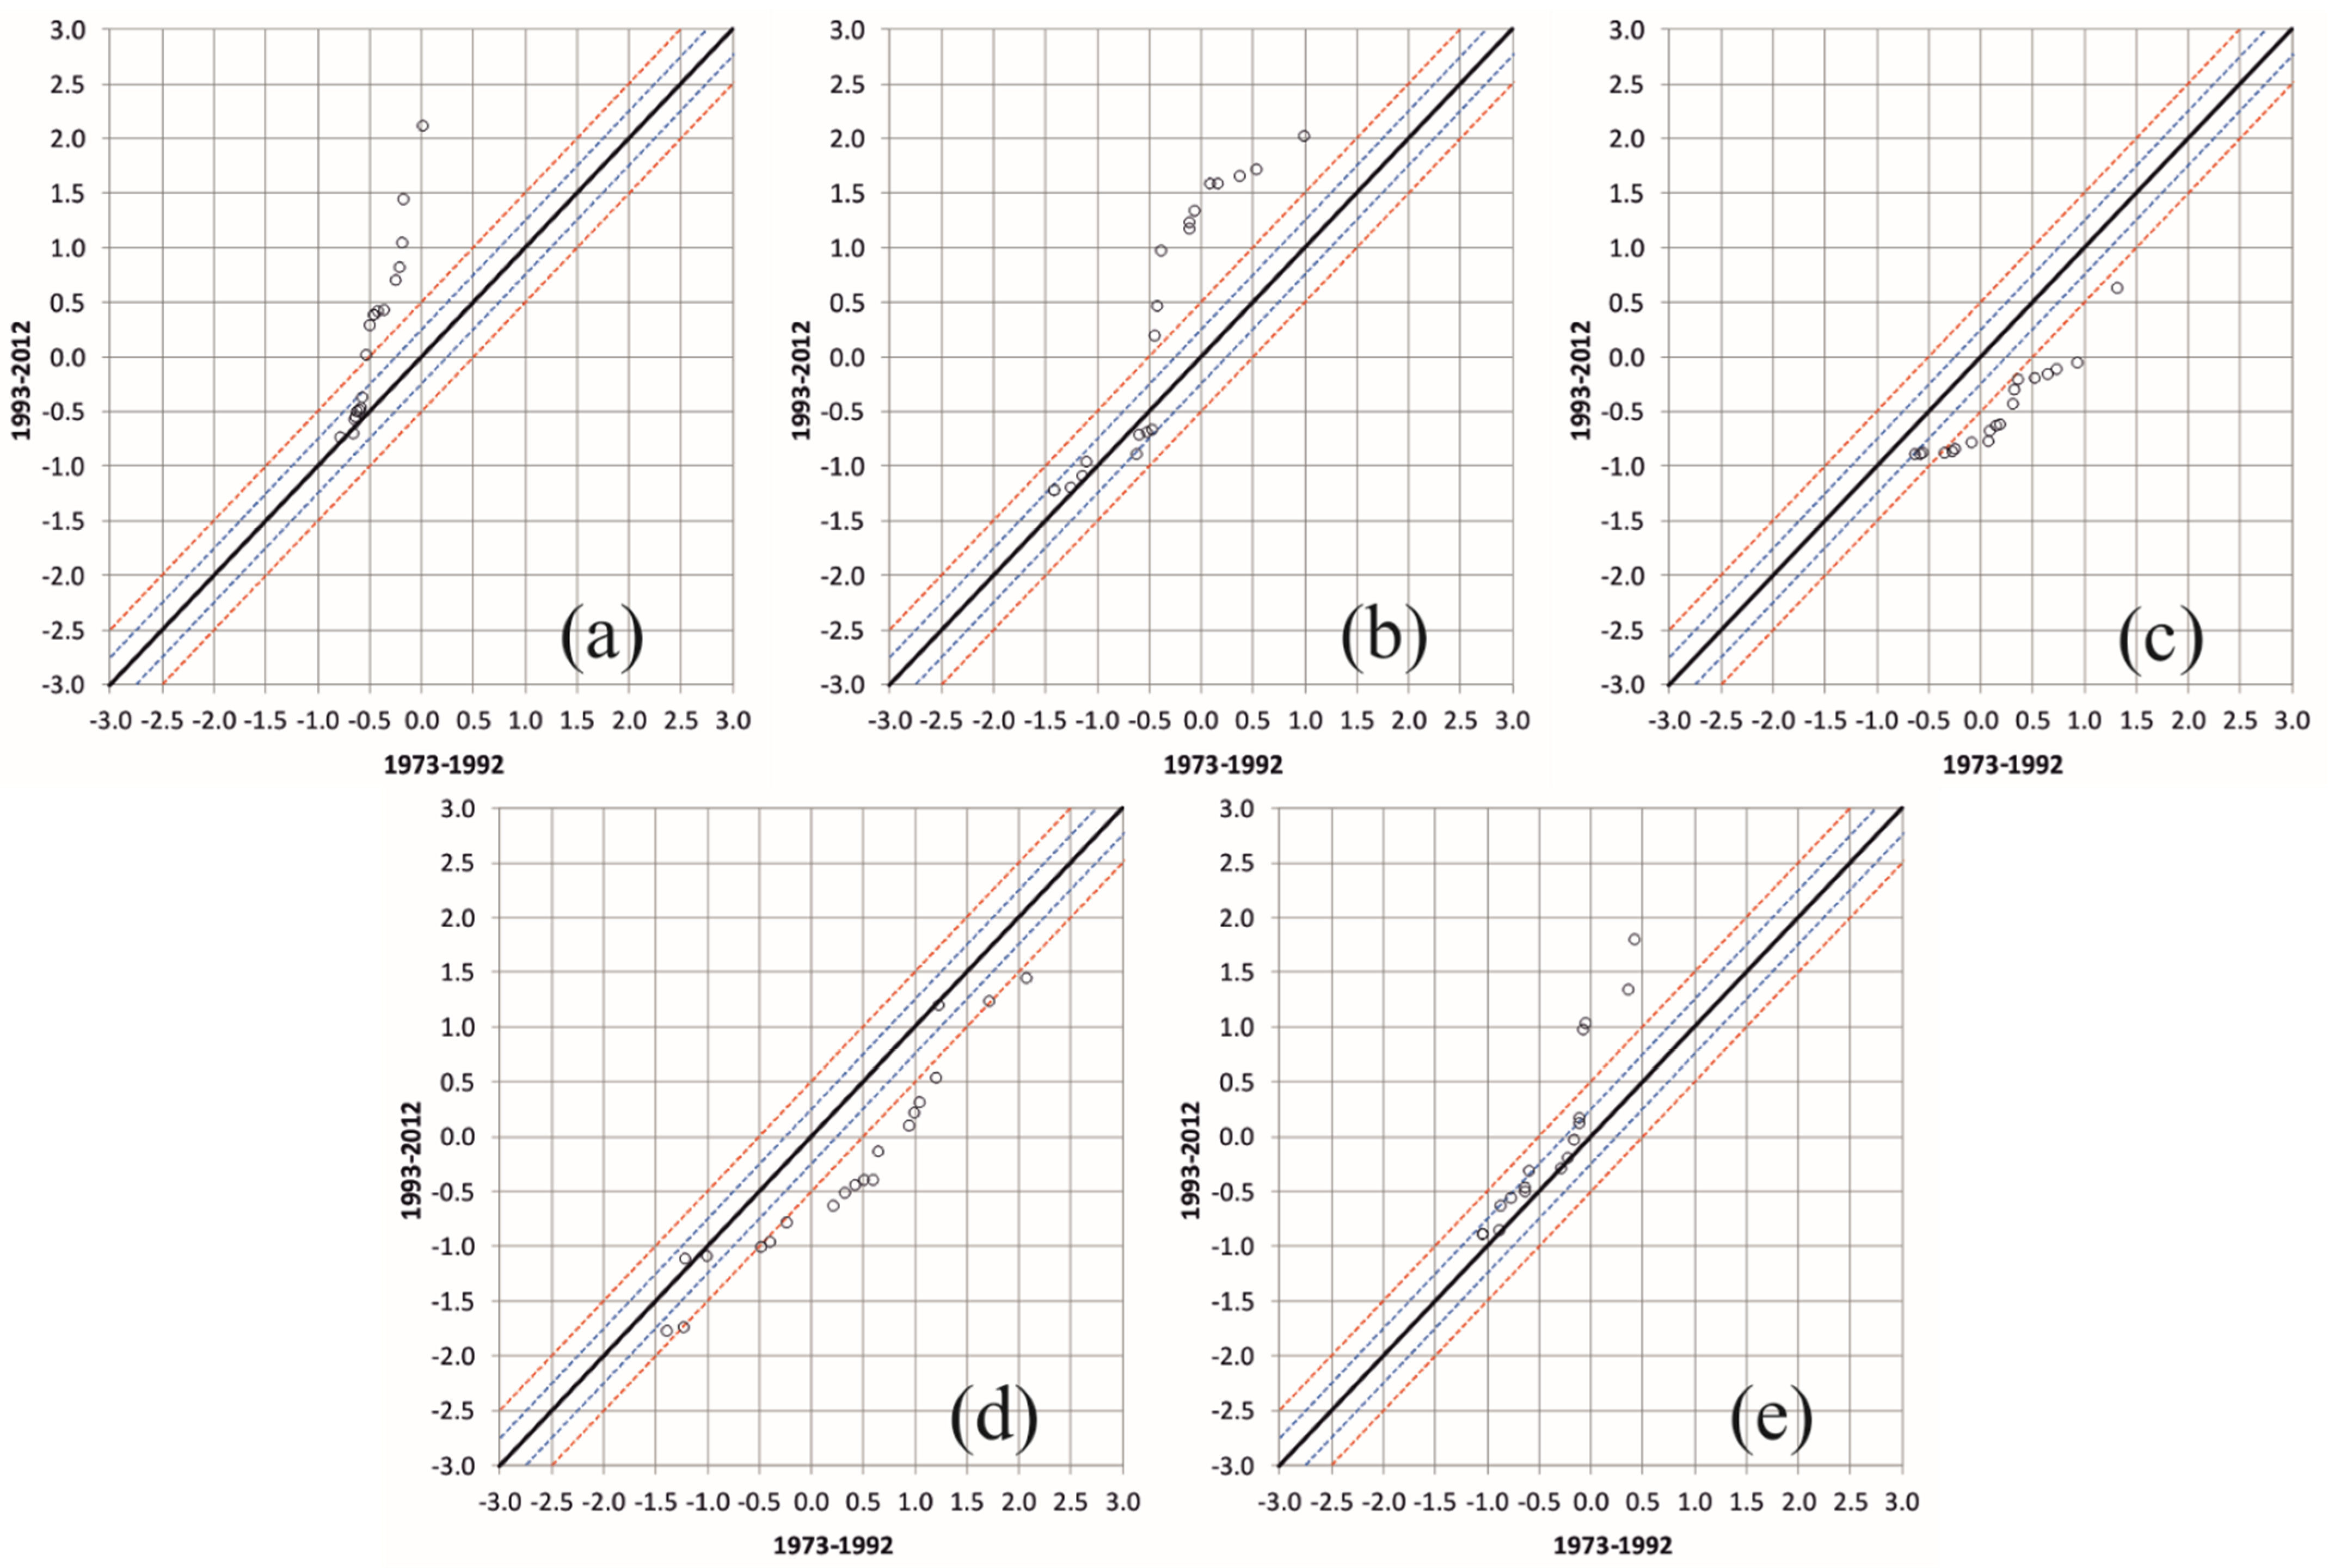
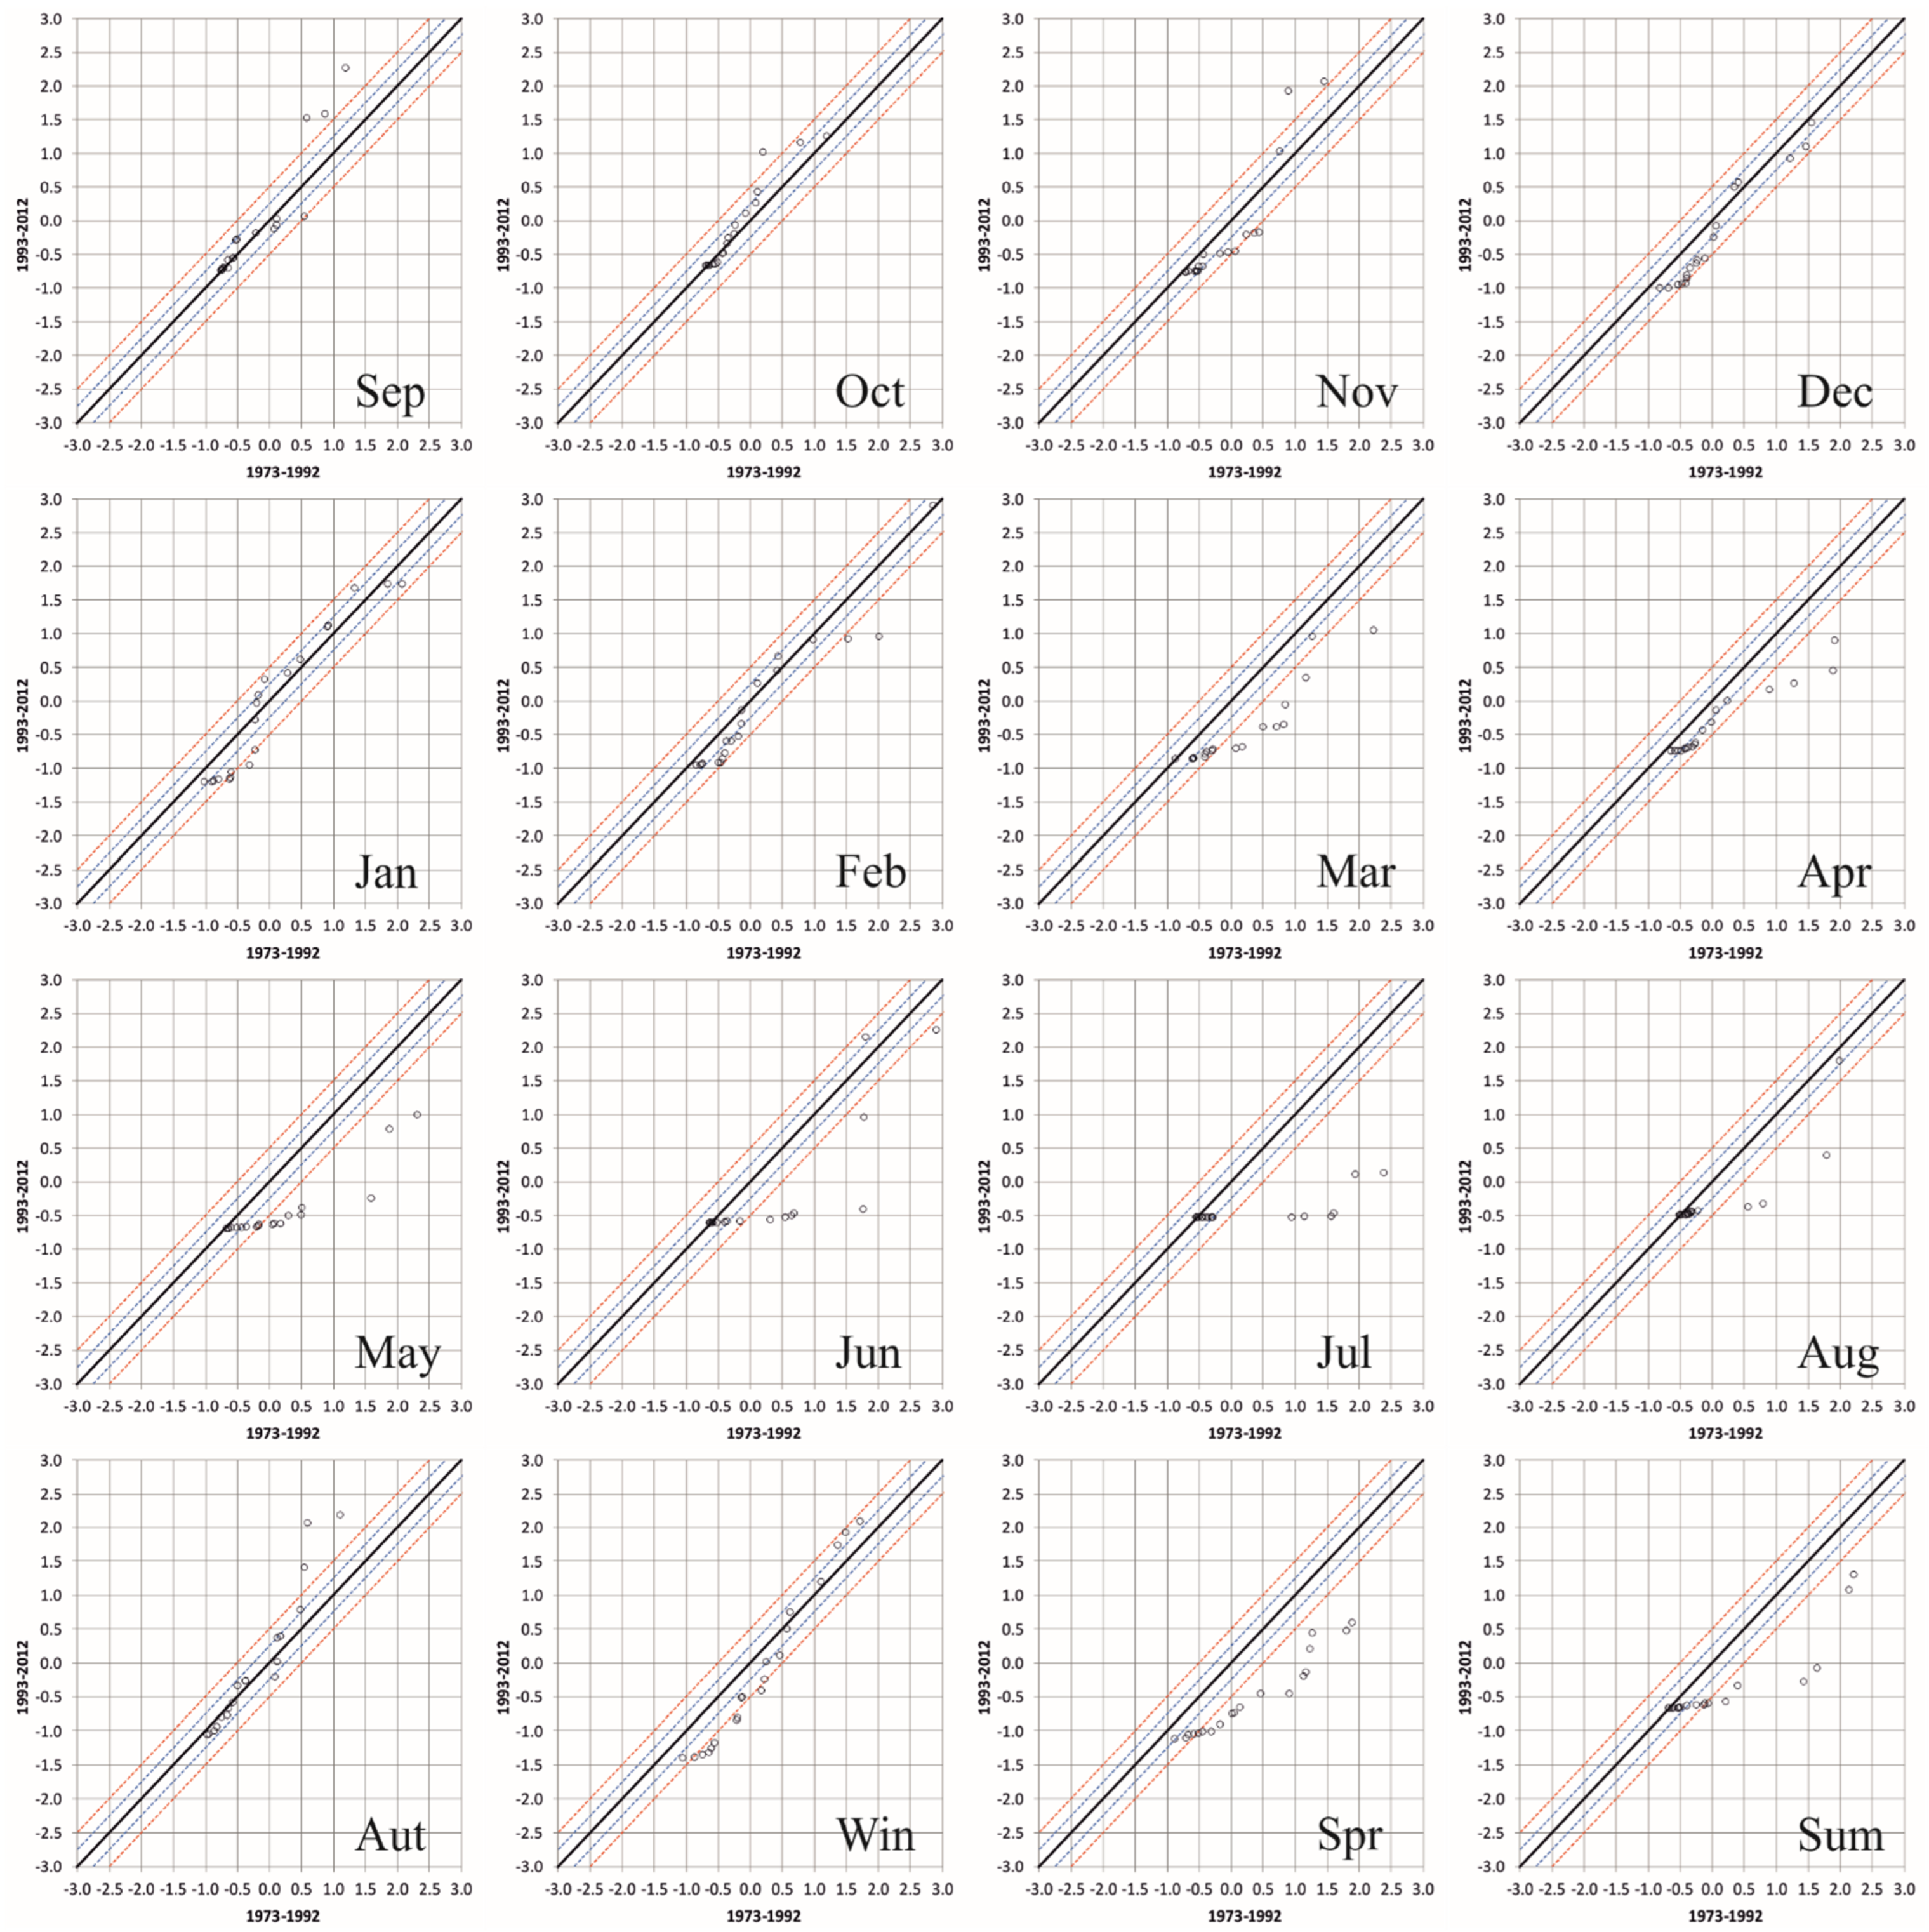
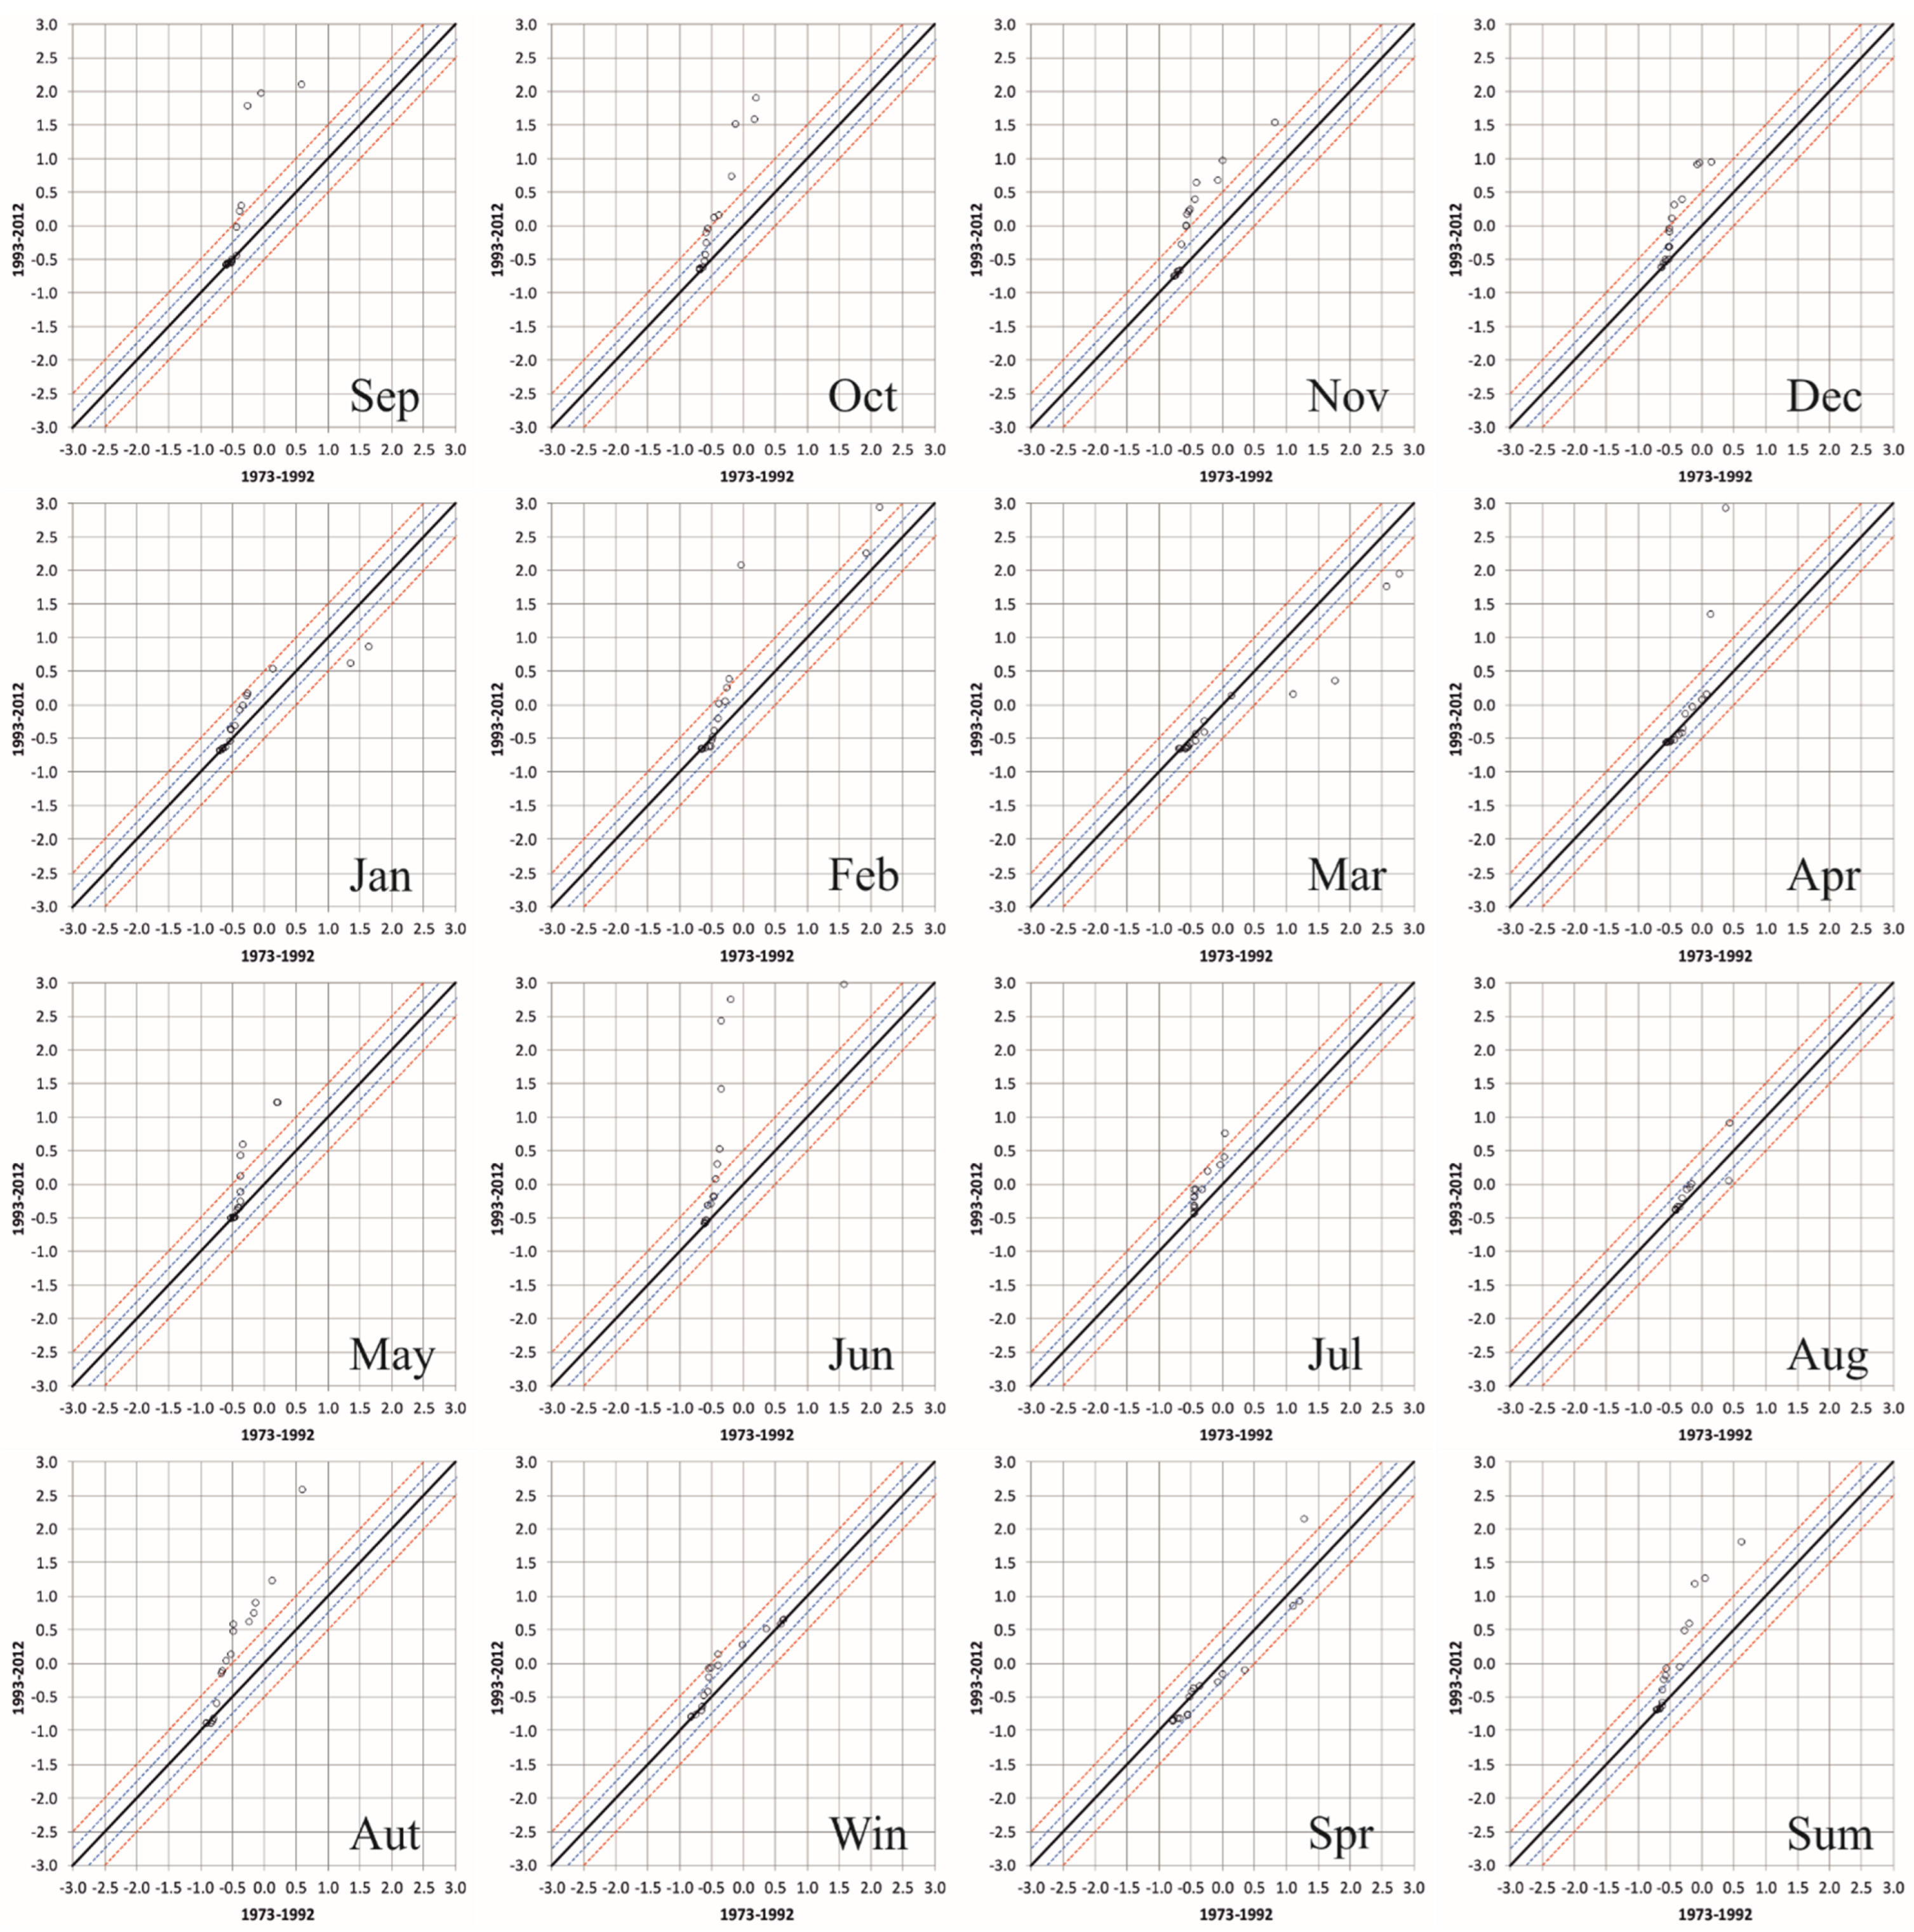
2. Methodology
- Divide the time series into two equal parts;
- Order each part from the lowest value to the highest one;
- Locate the two ordered time series in a Cartesian diagram with the first half on the x-axis and the second half on the y-axis.
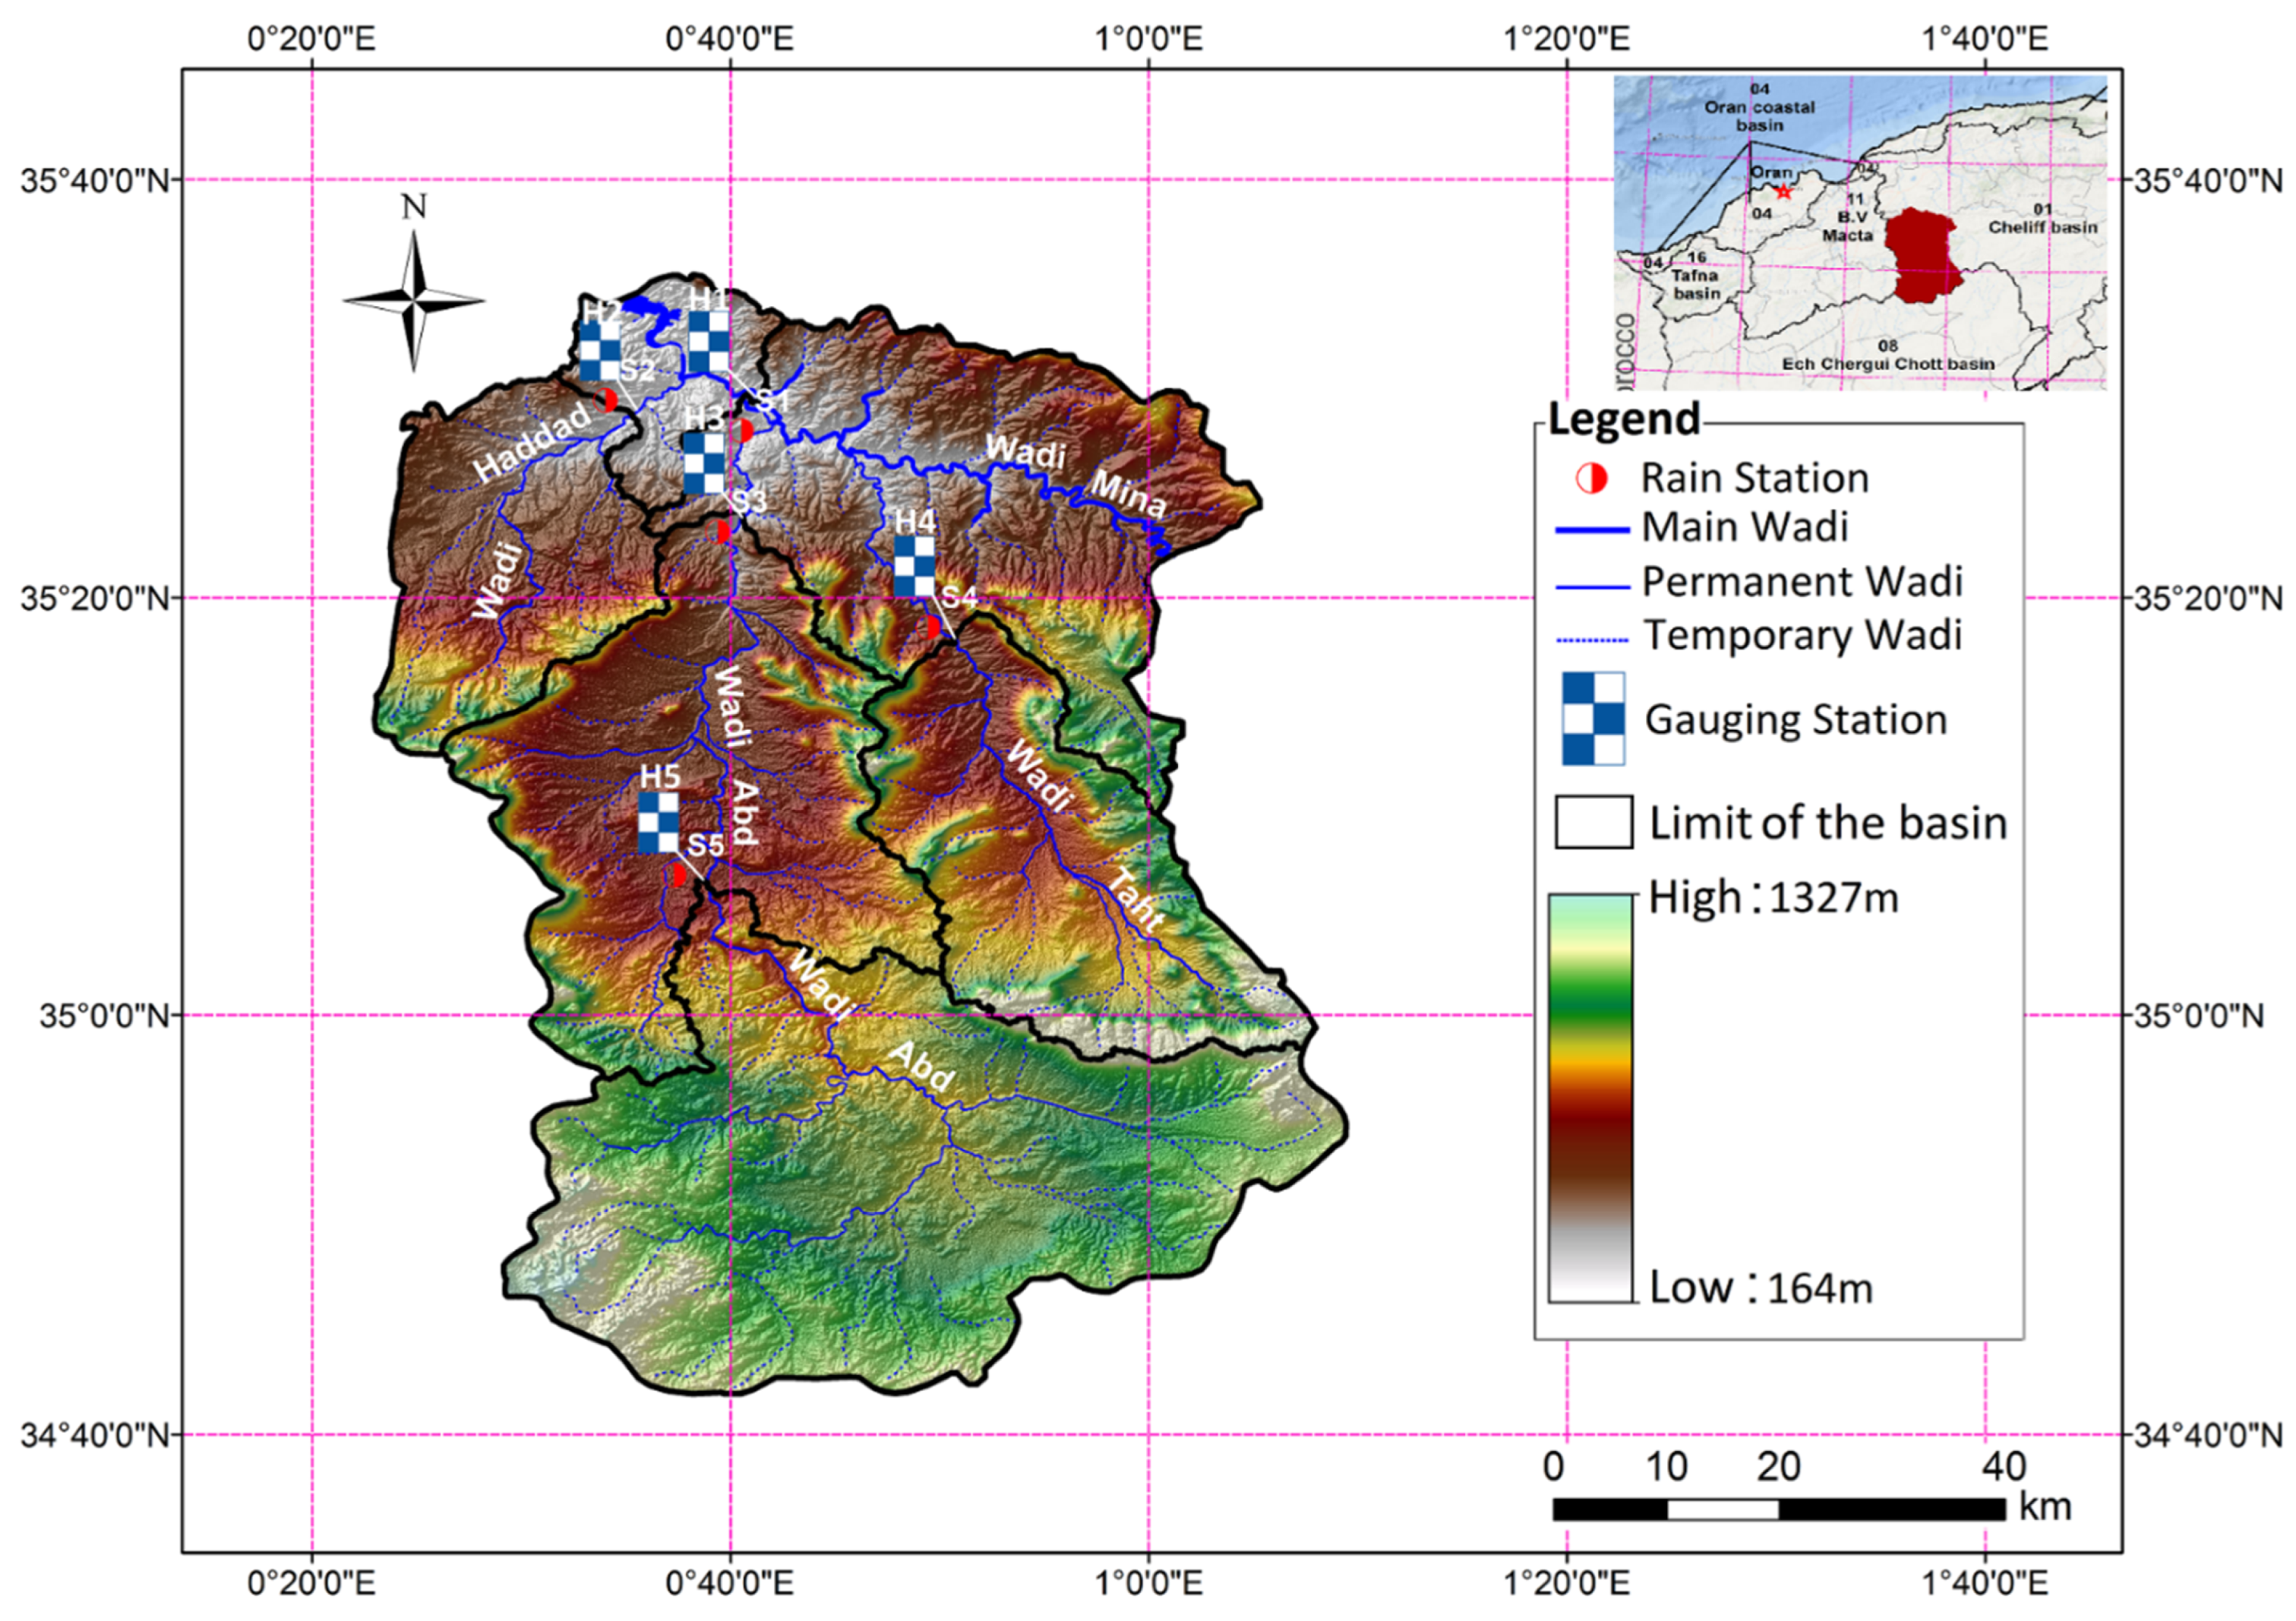
3. Study Area and Data
4. Results and Discussion
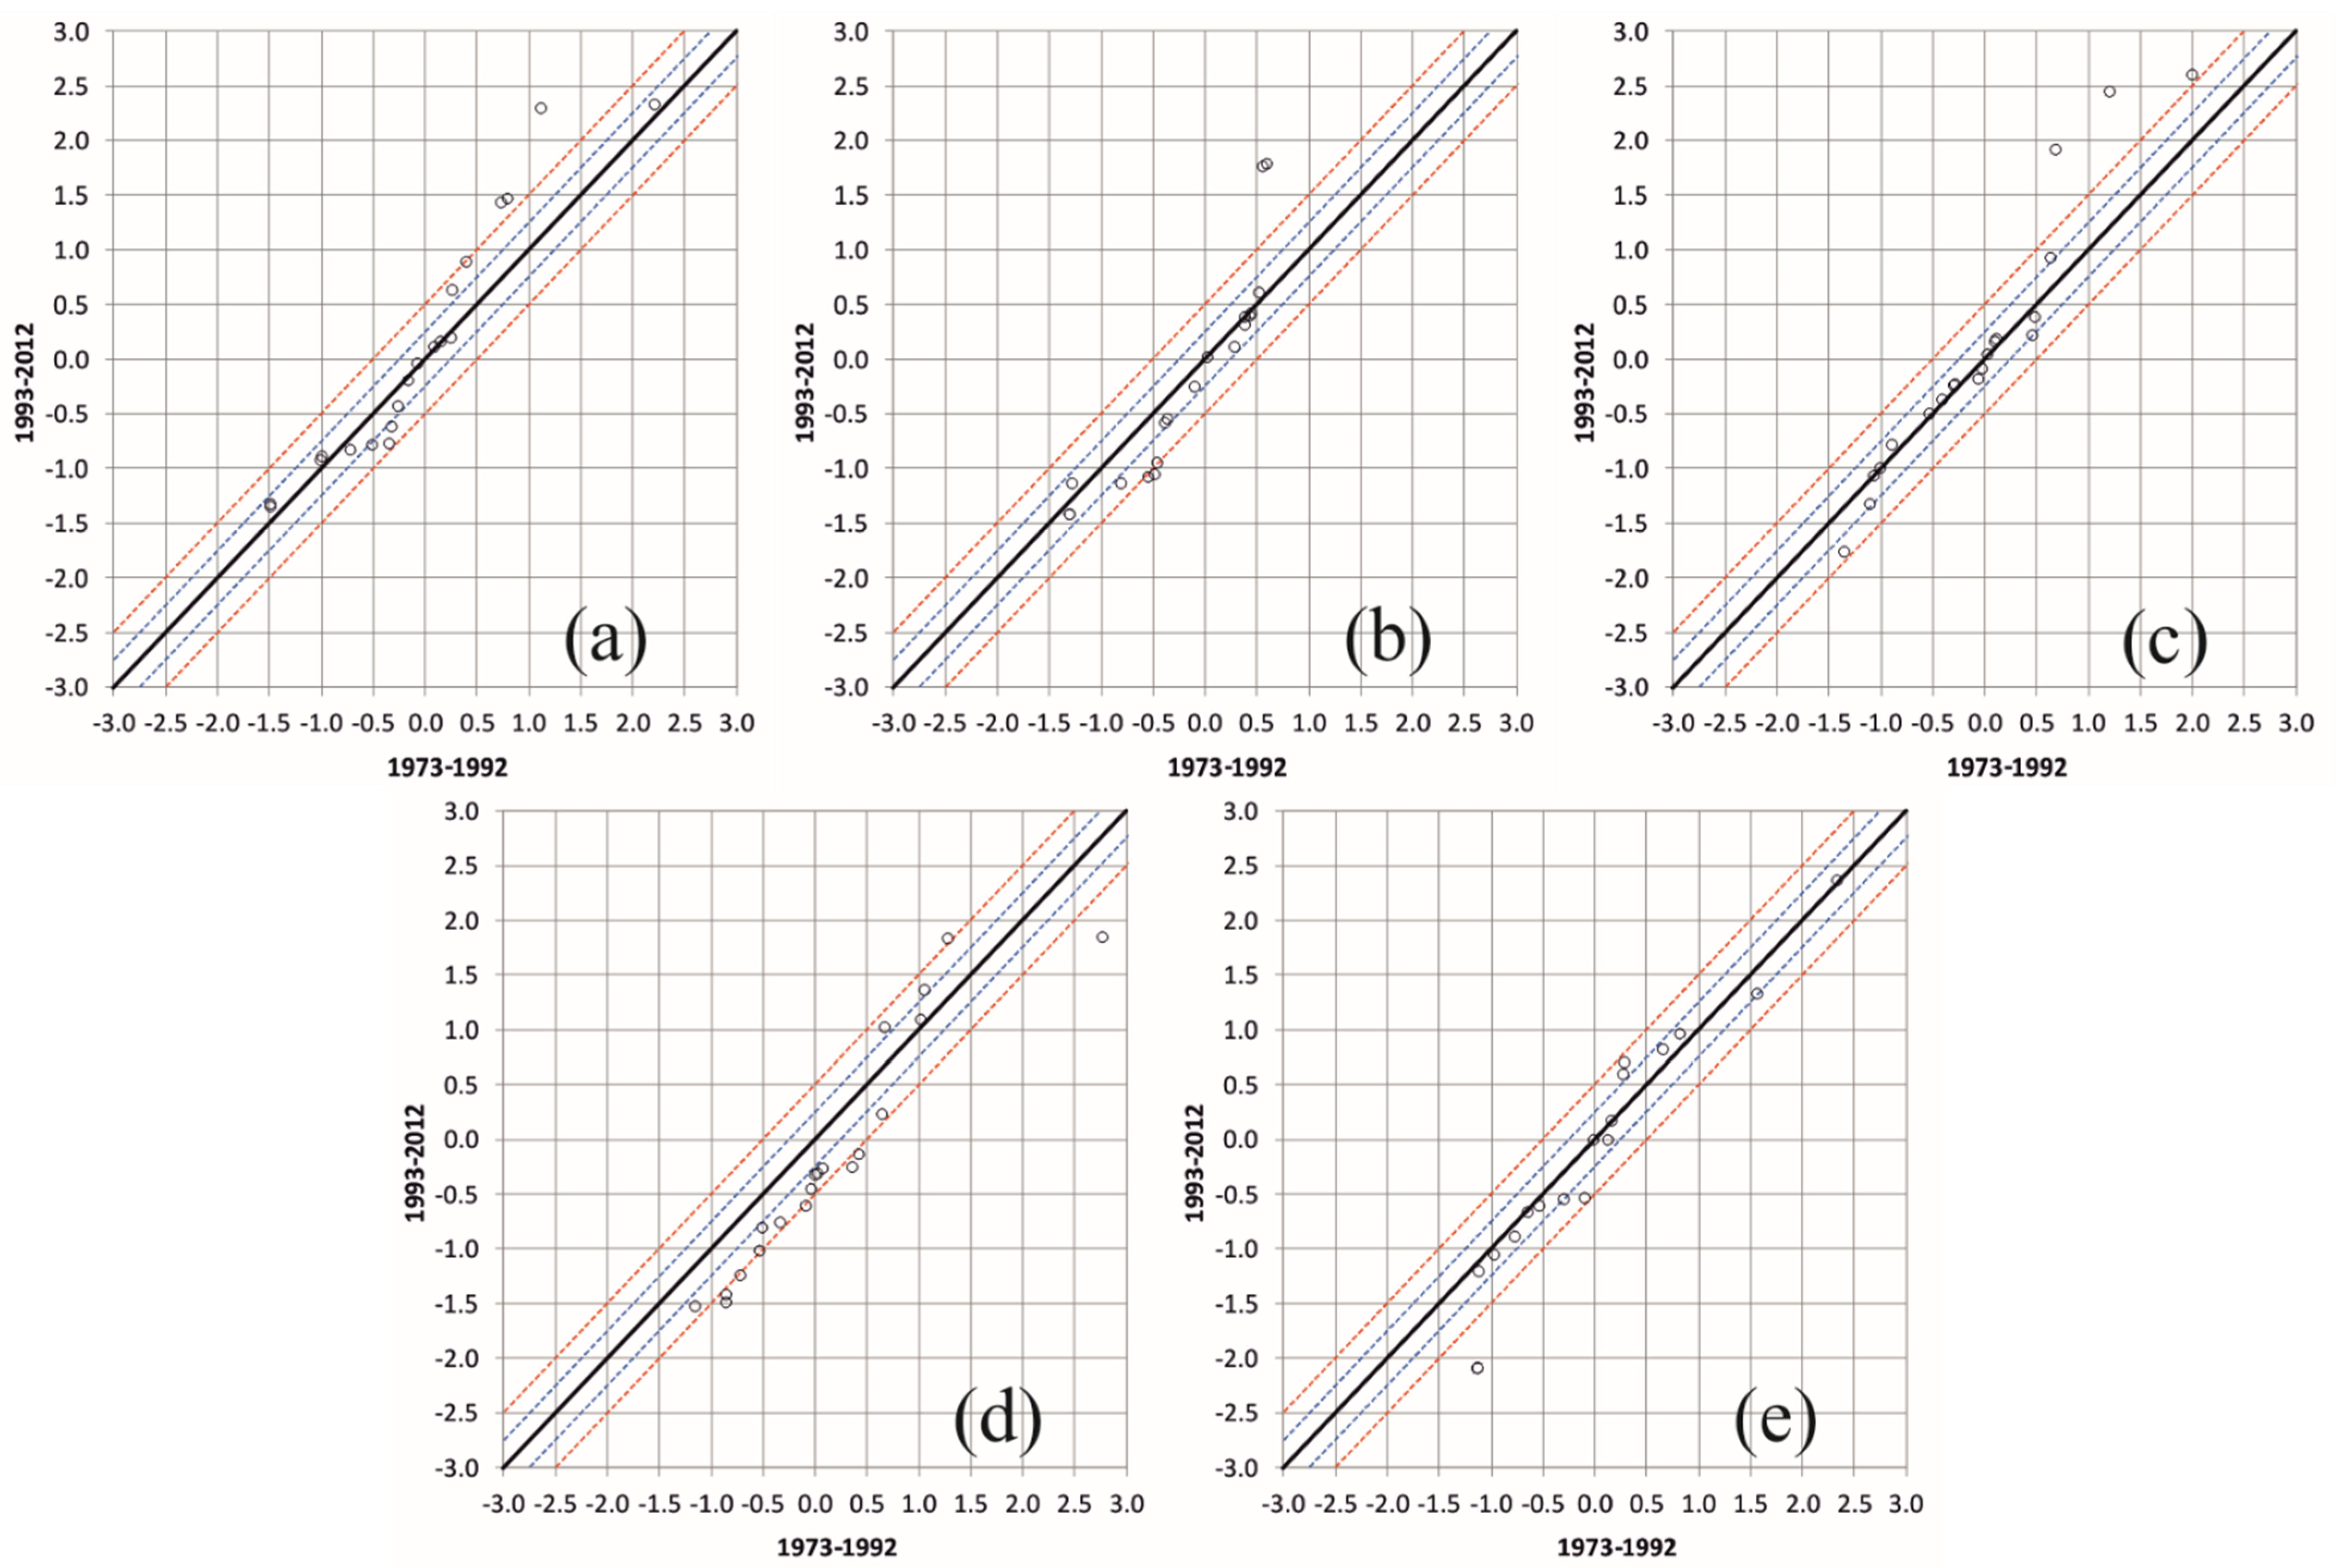
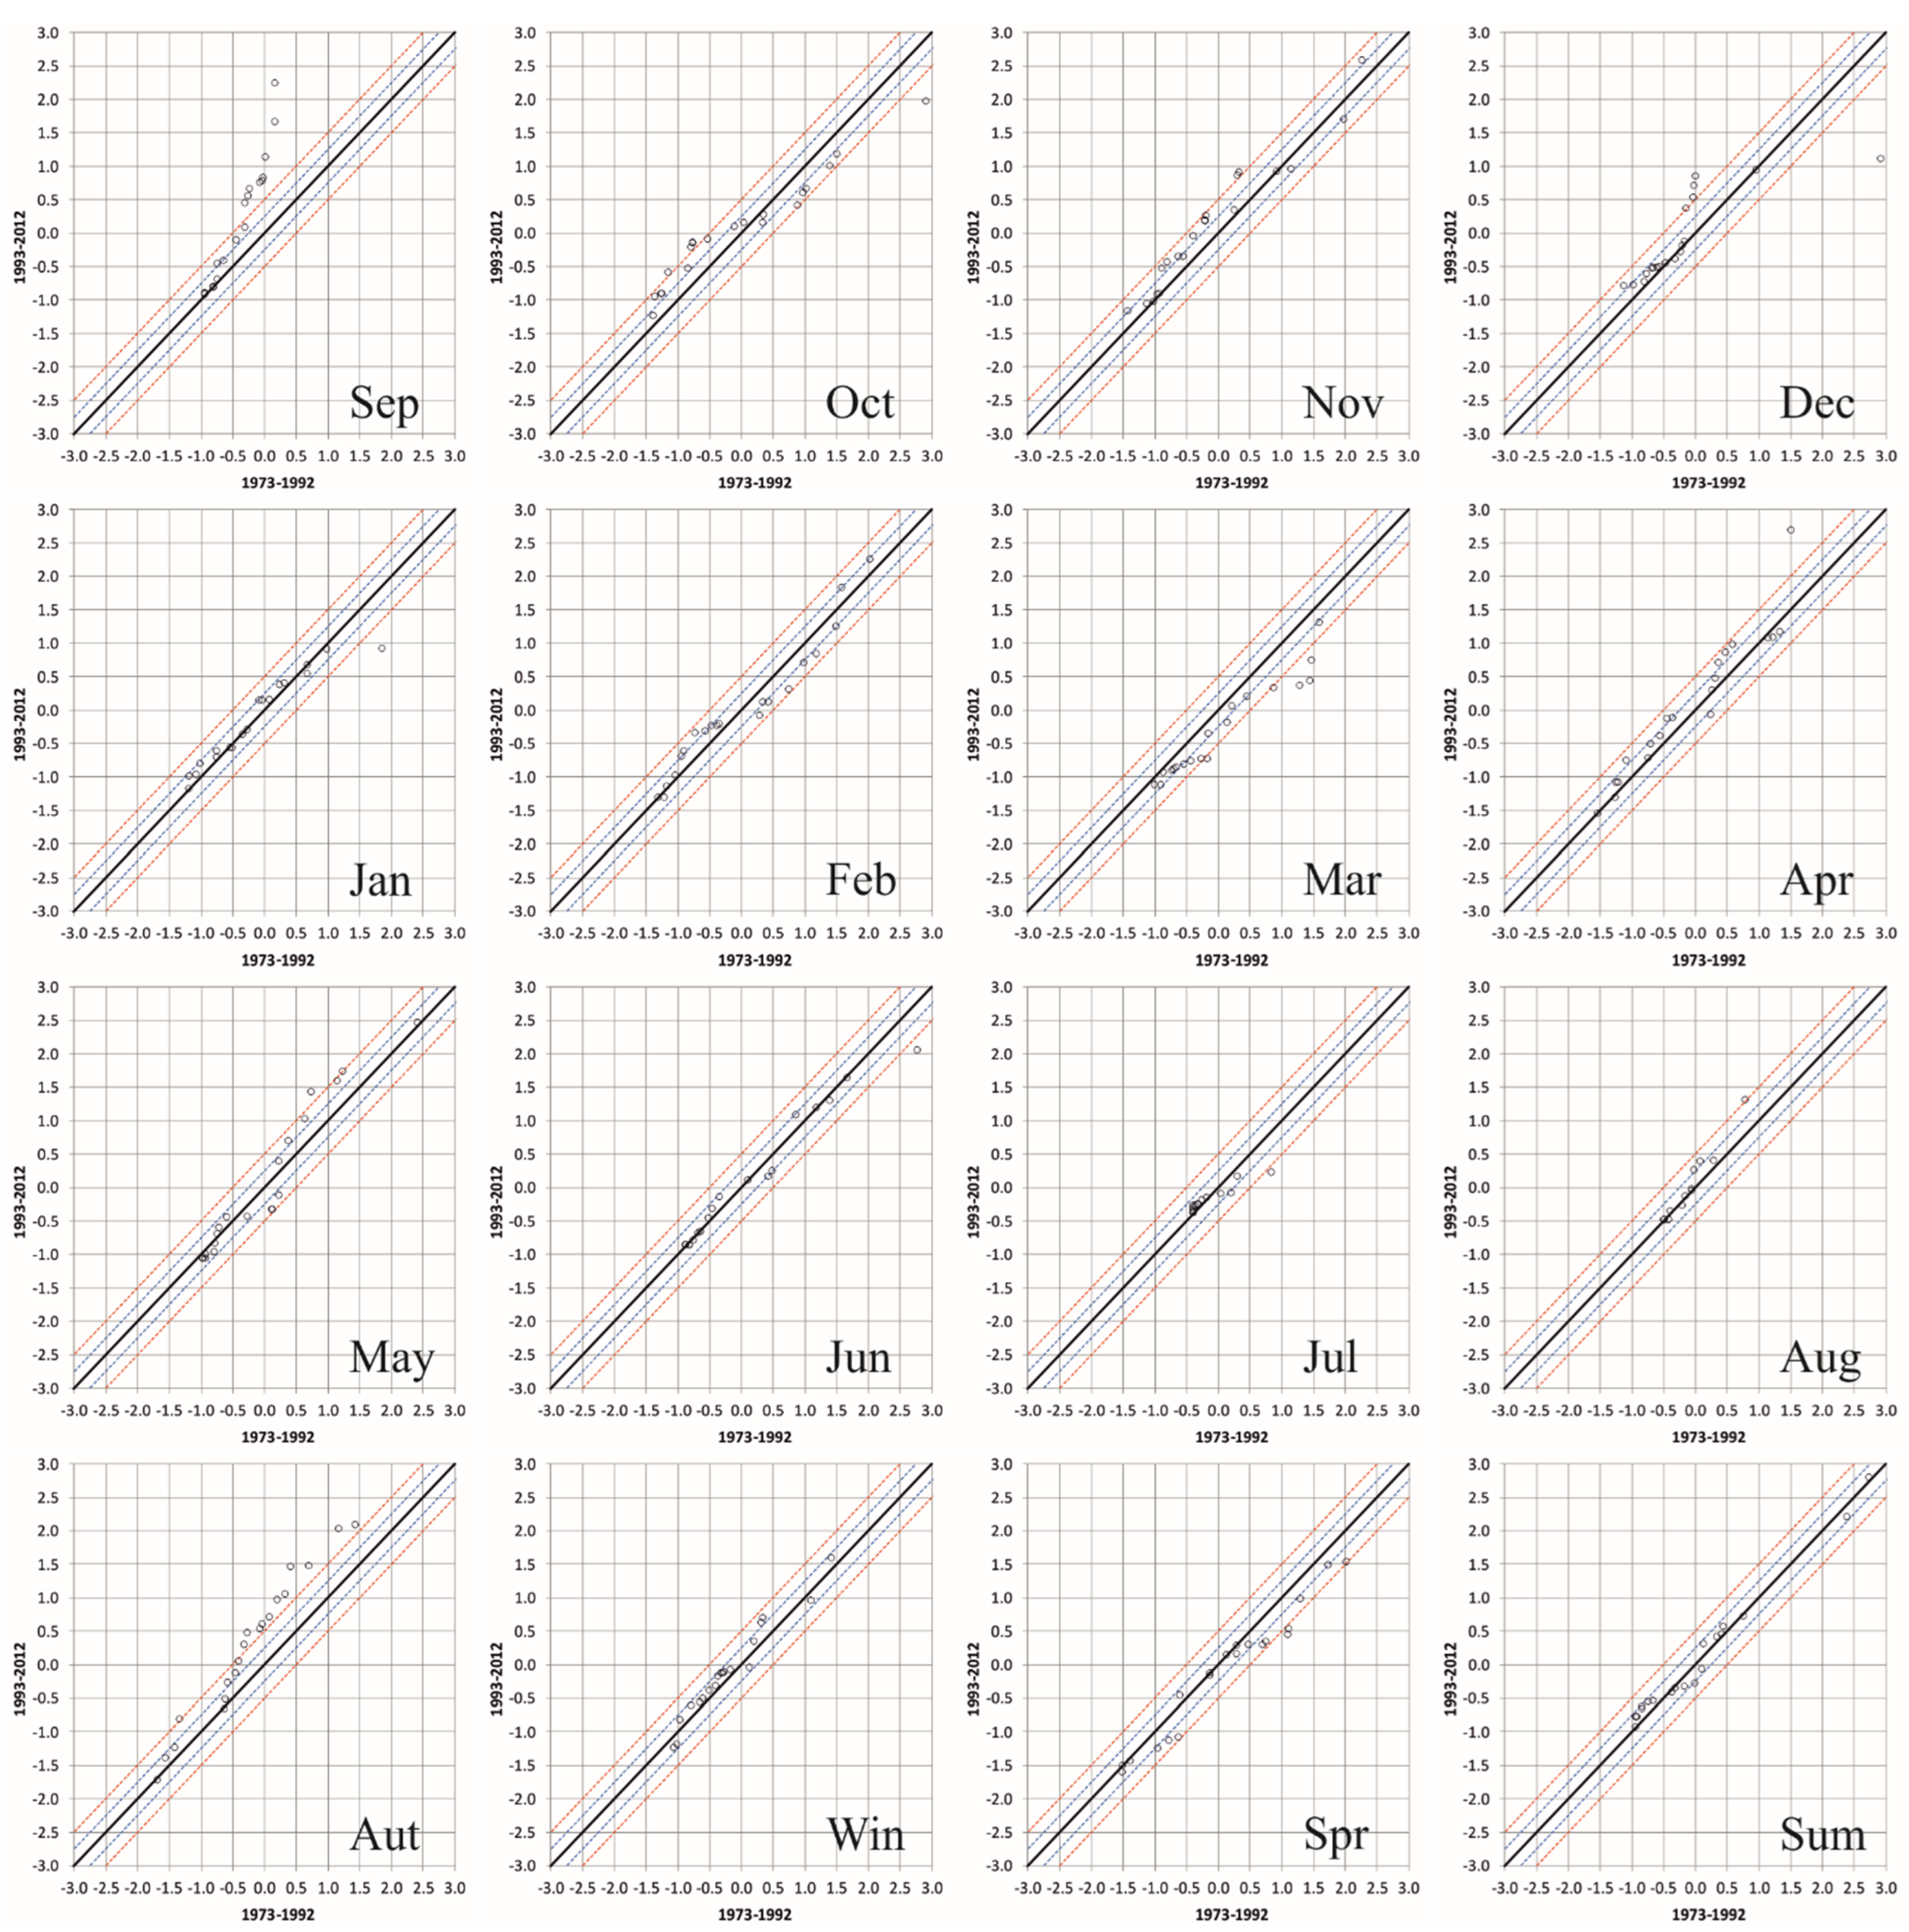
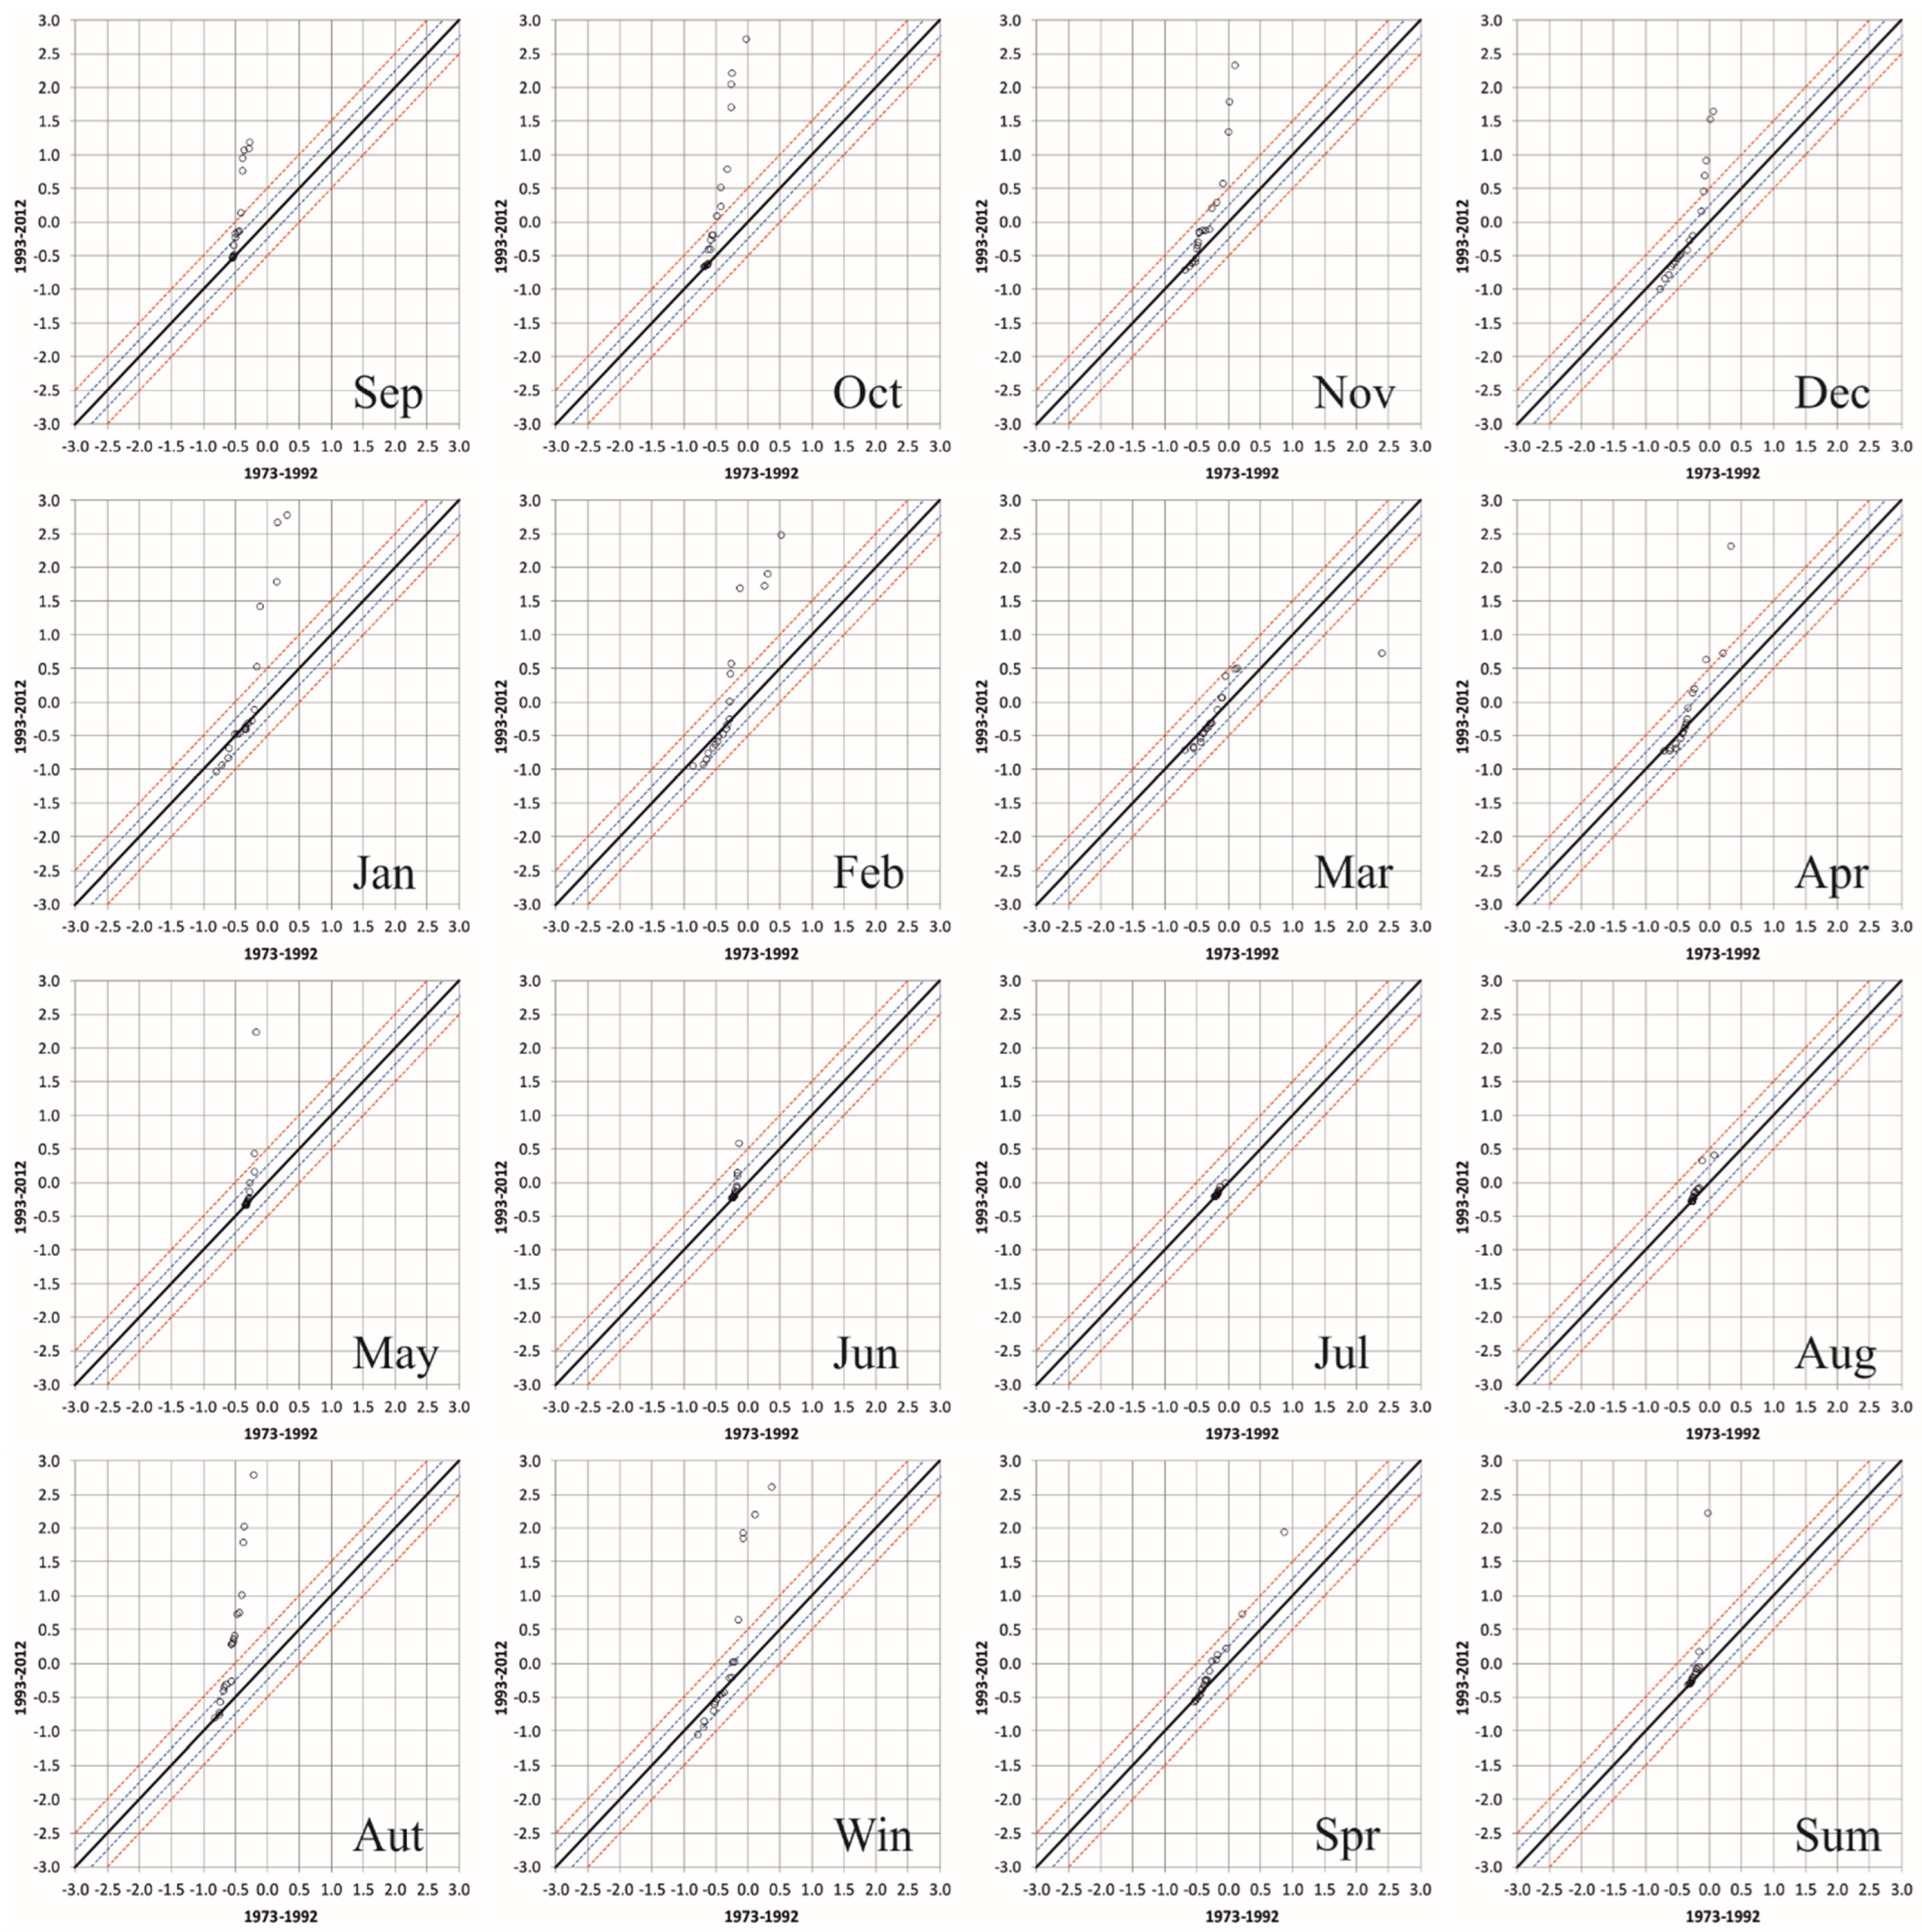
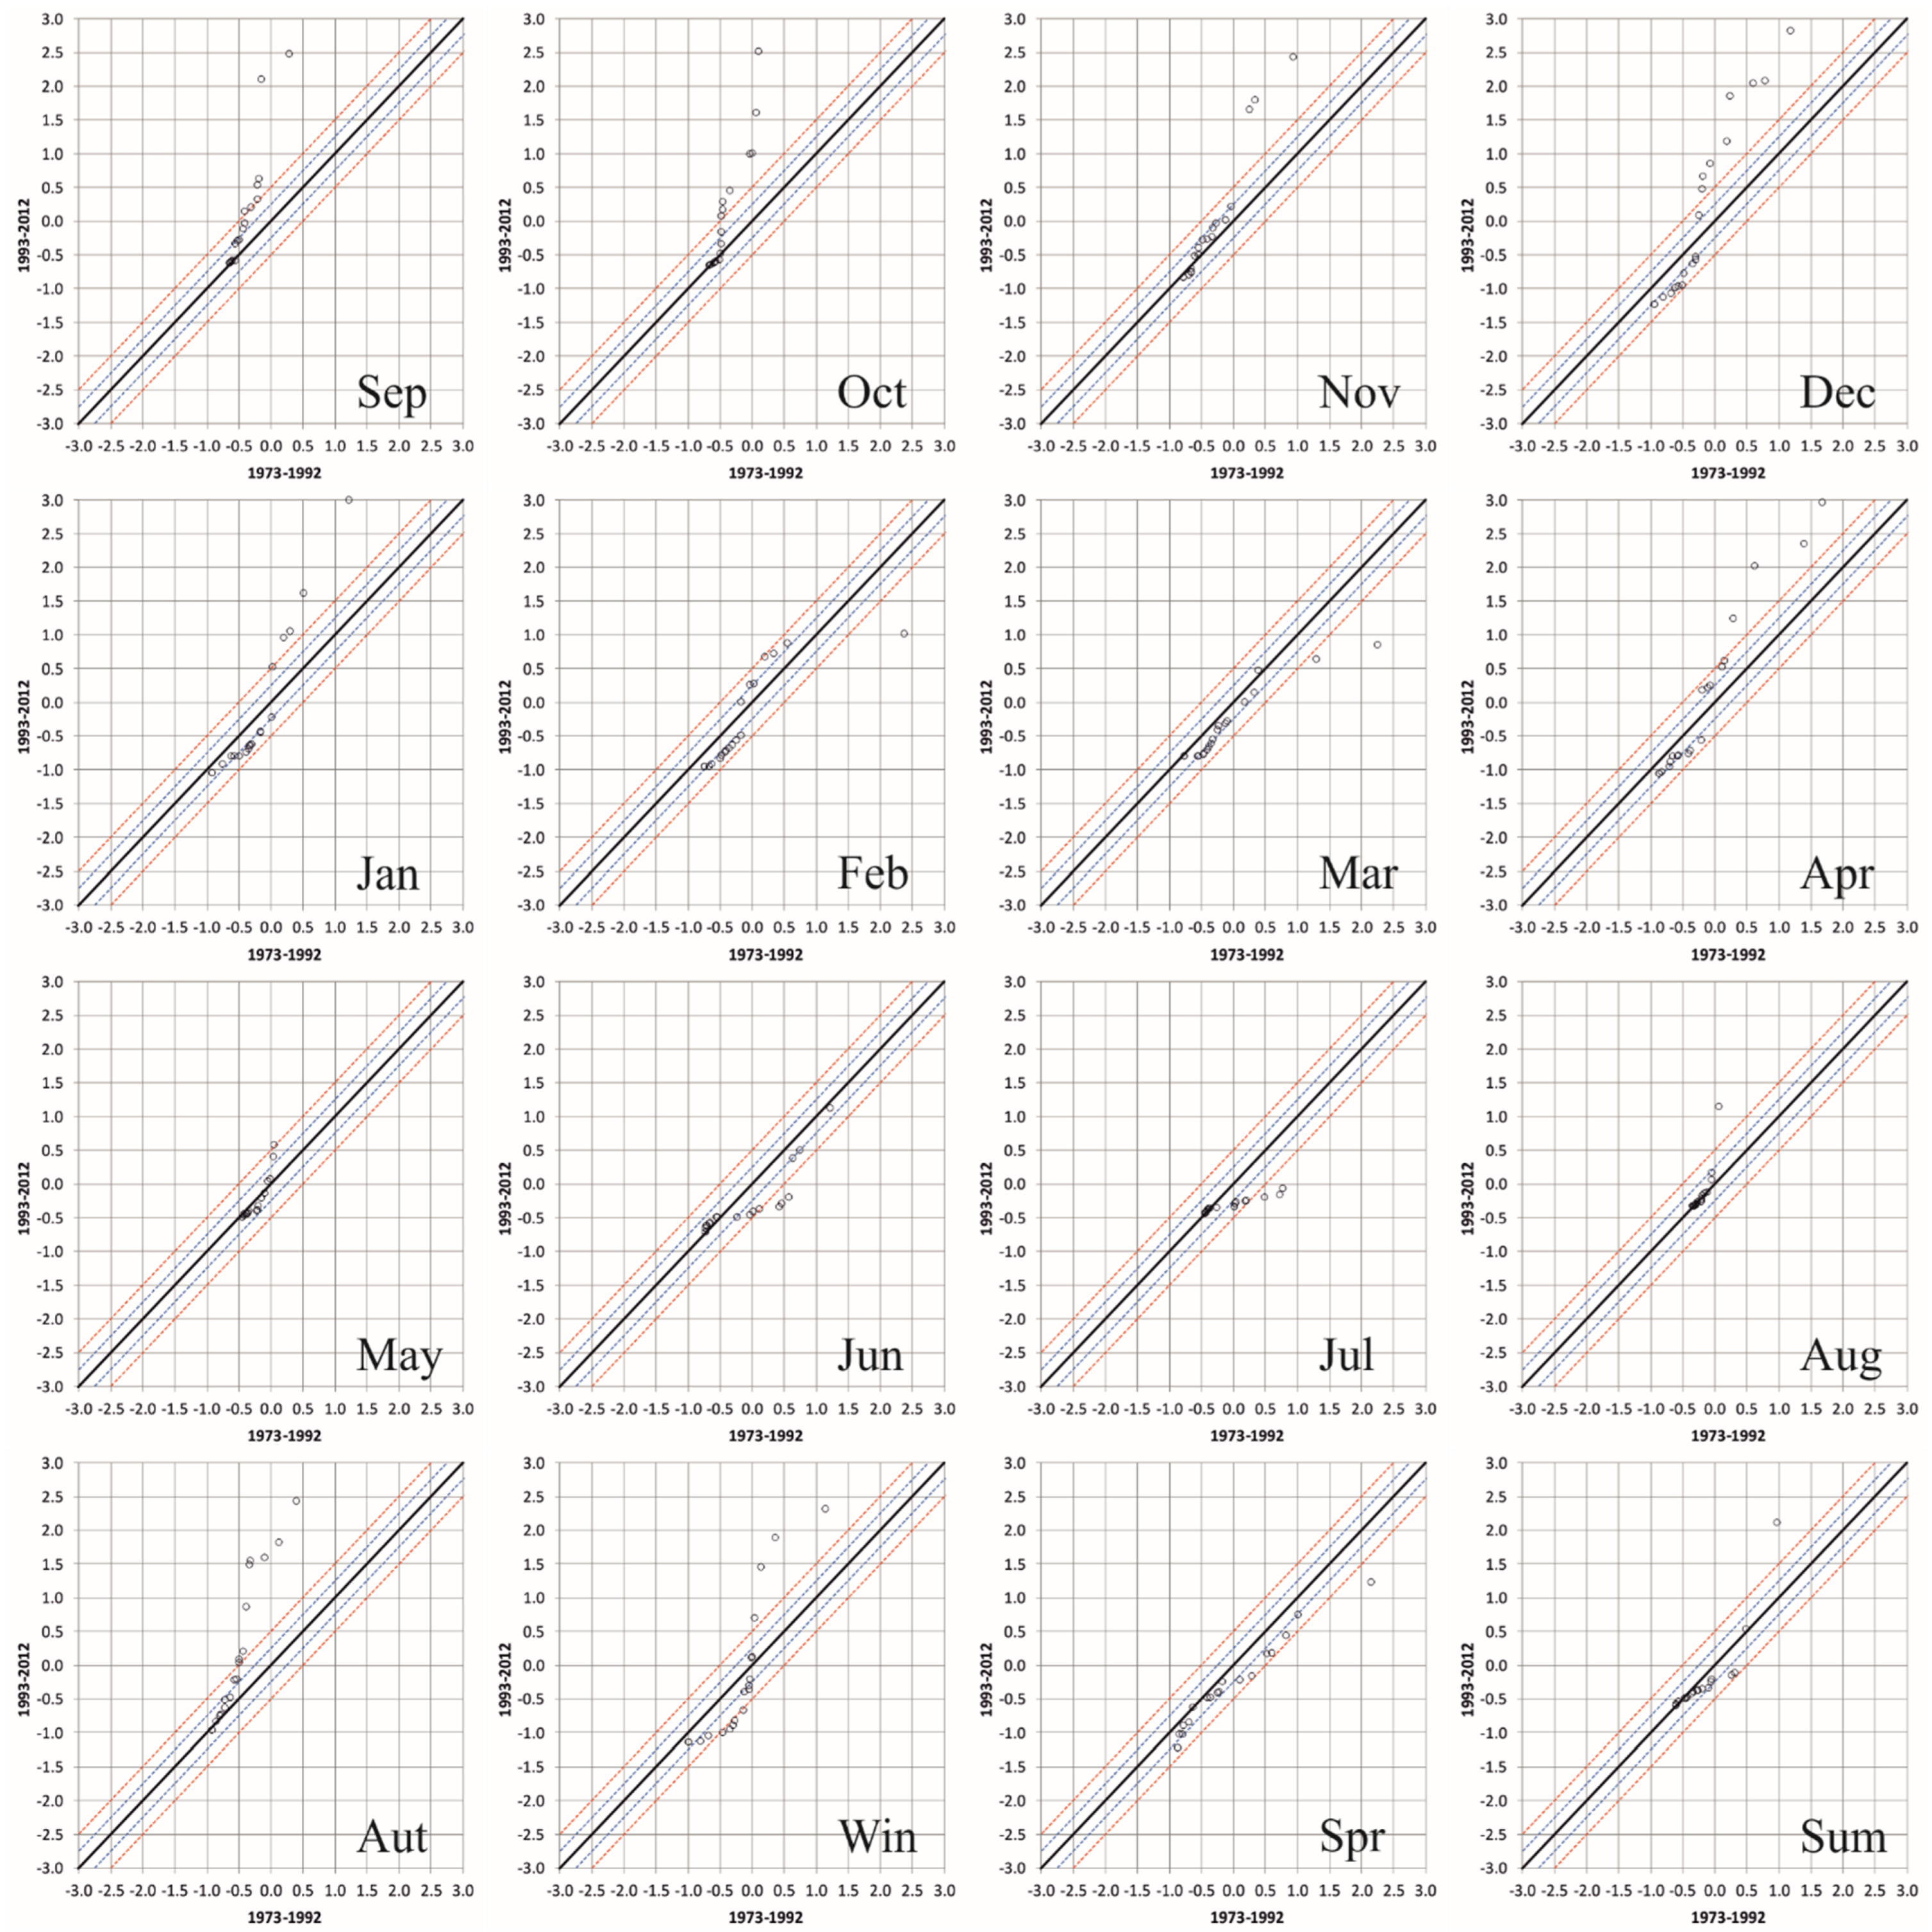
4.1. Rainfall Data
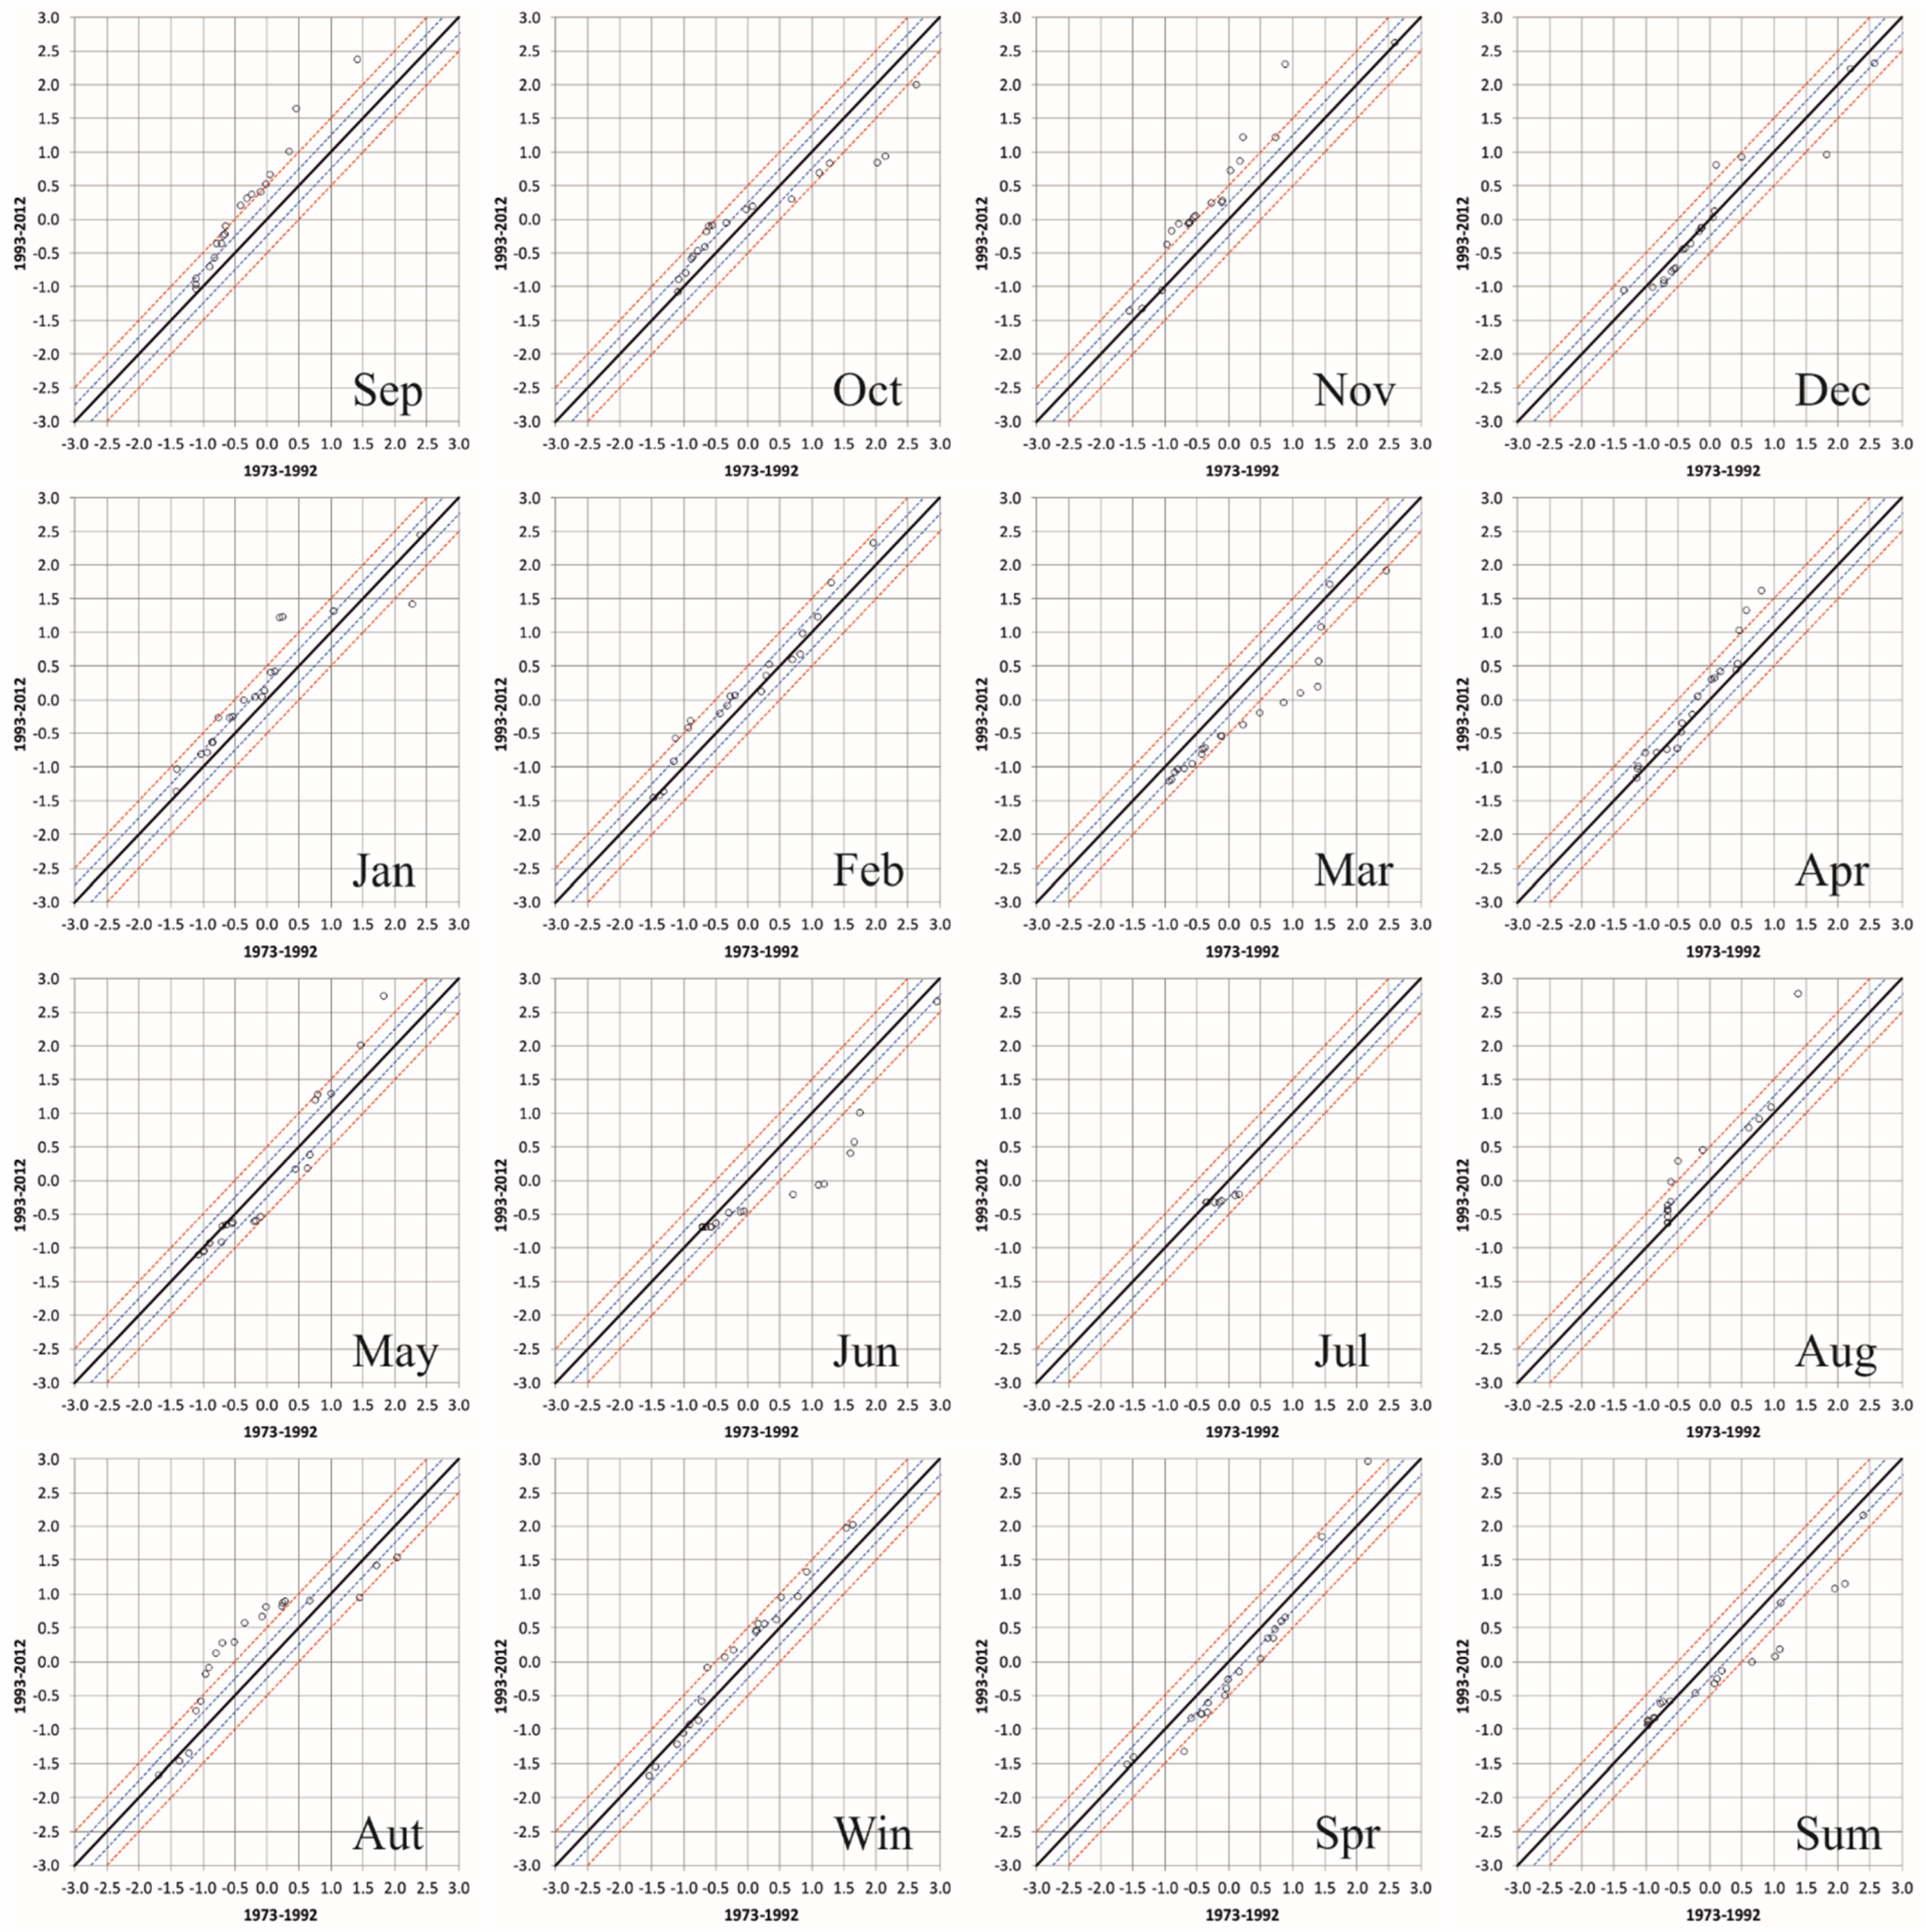
4.2. Runoff Data
4.3. Discussion
5. Conclusions
- A marked negative trend at the annual scale in the Oued Abtal and the Kef Mehboula stations;
- From a seasonal point of view, a negative trend was detected in spring (in four out of five stations), in winter for the Oued Abtal station, and in autumn for the Kef Mehboula station;
- A general reduction in the annual runoff values in the Wadi Mina basin was identified, particularly in the Sidi Abdelkader Djillali and Oued Abtal stations;
- On a seasonal scale, a negative trend was detected in all the seasons in the Sidi Abdelkader Djillali and Oued Abtal stations and in three out of four seasons for the Ain Hamara station.
Author Contributions
Funding
Institutional Review Board Statement
Informed Consent Statement
Data Availability Statement
Acknowledgments
Conflicts of Interest
References
- Intergovernmental Panel on Climate Change (IPCC). Sixth Assessment Report of the Intergovernmental Panel on Climate Change; Cambridge University Press: Cambridge, UK, 2021. [Google Scholar]
- Caloiero, T.; Caloiero, P.; Frustaci, F. Long-term precipitation trend analysis in Europe and in the Mediterranean basin. Water Environ. J. 2018, 32, 433–445. [Google Scholar] [CrossRef]
- Benabdelouahab, T.; Gadouali, F.; Boudhar, A.; Lebrini, Y.; Hadria, R.; Salhi, A. Analysis and trends of rainfall amounts and extreme events in the Western Mediterranean region. Theor. Appl. Climatol. 2020, 141, 309–320. [Google Scholar] [CrossRef]
- Kyselý, J.; Beguería, S.; Beranová, R.; Gaál, L.; López-Moreno, J.I. Different patterns of climate change scenarios for short-term and multi-day precipitation extremes in the Mediterranean. Glob. Planet. Chang. 2012, 98, 63–72. [Google Scholar] [CrossRef] [Green Version]
- Longobardi, A.; Villani, P. Trend analysis of annual and seasonal rainfall time series in the Mediterranean area. Int. J. Climatol. 2010, 30, 1538–1546. [Google Scholar] [CrossRef]
- Shohami, D.; Dayan, U.; Morin, E. Warming and drying of the eastern Mediterranean: Additional evidence from trend analysis. J. Geophys. Res. 2011, 116, D22101. [Google Scholar] [CrossRef]
- Ziv, B.; Saaroni, H.; Pargament, R.; Harpaz, T.; Alpert, P. Trends in rainfall regime over Israel, 1975–2010, and their relationship to large-scale variability. Reg. Environ. Chang. 2014, 14, 1751–1764. [Google Scholar] [CrossRef]
- Meddi, M.; Hubert, P. Impact de la modification du régime pluviométrique sur les ressources en eau du Nord-ouest de l’Algérie. In Proceedings of the International Symposium on Hydrology of the Mediterranean and Semi Arid Regions, Montpellier, France, 1–4 April 2003; IAHS Publication: Wallingford, UK, 2003; pp. 229–235. (In French) [Google Scholar]
- Goubanova, K.; Li, L. Extremes in temperature and precipitation around the Mediterranean basin in an ensemble of future climate scenario simulations. Glob. Planet. Chang. 2007, 57, 27–42. [Google Scholar] [CrossRef]
- Zittis, G. Observed rainfall trends and precipitation uncertainty in the vicinity of the Mediterranean, Middle East and North Africa. Theor. Appl. Climatol. 2018, 134, 1207–1230. [Google Scholar] [CrossRef]
- Tramblay, Y.; El Adlouni, S.; Servat, E. Trends and variability in extreme precipitation indices over Maghreb countries. Nat. Hazards Earth Syst. Sci. 2013, 13, 3235–3248. [Google Scholar] [CrossRef] [Green Version]
- Elmeddahi, Y.; Issaadi, A.; Mahmoudi, H.; Tahar Abbes, M.; Goossen, M.F.A. Effect of climate change on water resources of the Algerian Middle Cheliff basin. Desalin. Water Treat. 2014, 52, 2073–2081. [Google Scholar] [CrossRef]
- Ragab, R.; Prudhomme, C. Climate change and water resources management in arid and semi–arid regions: Prospective and challenges for the 21st Century. Biosyst. Eng. 2002, 81, 3–34. [Google Scholar] [CrossRef]
- Giorgi, F.; Lionello, P. Climate change projections for the Mediterranean region. Glob. Planet. Chang. 2008, 63, 90–104. [Google Scholar] [CrossRef]
- Elouissi, A.; Sen, Z.; Habi, M. Algerian rainfall innovative trend analysis and its implications to Macta watershed. Arab. J. Geosci. 2016, 9, 303. [Google Scholar] [CrossRef]
- Achite, M.; Caloiero, T.; Wałęga, A.; Krakauer, N.; Hartani, T. Analysis of the Spatiotemporal Annual Rainfall Variability in the Wadi Cheliff Basin (Algeria) over the Period 1970 to 2018. Water 2021, 13, 1477. [Google Scholar] [CrossRef]
- Achite, M.; Caloiero, T. Analysis of temporal and spatial rainfall variability over the Wadi Sly basin, Algeria. Arab. J. Geosci. 2021, 14, 1867. [Google Scholar] [CrossRef]
- Lu, C.H.; Dong, X.Y.; Tang, J.L.; Liu, G.C. Spatio-temporal trends and causes of variations in runoff and sediment load of the Jinsha River in China. J. Mt. Sci. 2019, 16, 2361–2378. [Google Scholar] [CrossRef]
- Bates, B.C.; Kundzewicz, Z.; Wu, S. Climate Change and Water. In Technical Paper of the Intergovernmental Panel on Climate Change; IPCC Secretariat: Geneva, Switzerland, 2008; p. 210. [Google Scholar]
- Milly, P.C.D.; Dunne, K.A.; Vecchia, A.V. Global pattern of trends in streamflow and water availability in a changing climate. Nat. Cell Biol. 2005, 438, 347–350. [Google Scholar] [CrossRef]
- Mostowik, K.; Siwek, J.; Kisiel, M.; Kowalik, K.; Krzysik, M.; Plenzler, J.; Rzonca, B. Runoff trends in a changing climate in the Eastern Carpathians (Bieszczady Mountains, Poland). Catena 2019, 182, 104174. [Google Scholar] [CrossRef]
- Sidibe, M.; Dieppois, B.; Mahé, G.; Paturel, J.E.; Amoussou, E.; Anifowose, B.; Lawler, D. Trend and variability in a new, reconstructed streamflow dataset for West and Central Africa, and climatic interactions, 1950–2005. J. Hydrol. 2018, 561, 478–493. [Google Scholar] [CrossRef] [Green Version]
- Descroix, L.; Mahé, G.; Lebel, T.; Favreau, G.; Galle, S.; Gautier, E.; Olivry, J.C.; Albergel, J.; Amogu, O.; Cappelaere, B.; et al. Spatio-Temporal Variability of Hydrological Regimes Around the Boundaries between Sahelian and Sudanian Areas of West Africa: A Synthesis. J. Hydrol. 2009, 375, 90–102. [Google Scholar] [CrossRef]
- Amogu, O.; Descroix, L.; Yéro, K.S.; Le Breton, E.; Mamadou, I.; Ali, A.; Vischel, T.; Bader, J.-C.; Moussa, I.B.; Gautier, E.; et al. Increasing River Flows in the Sahel? Water 2010, 2, 170–199. [Google Scholar] [CrossRef] [Green Version]
- Mahé, G.; Lienou, G.; Descroix, L.; Bamba, F.; Paturel, J.E.; Laraque, A.; Meddi, M.; Habaieb, H.; Adeaga, O.; Dieulin, C.; et al. The rivers of Africa: Witness of climate change and human impact on the environment. Hydrol. Process. 2013, 27, 2105–2114. [Google Scholar] [CrossRef]
- Onyutha, C. Identification of sub-trends from hydro-meteorological series. Stoch. Environ. Res. Risk Assess. 2015, 30, 189–205. [Google Scholar] [CrossRef]
- Blain, G.C. The Mann-Kendall test the need to consider the interaction between serial correlation and trend. Acta Sci. Agron. 2013, 36, 393–402. [Google Scholar]
- Yue, S.; Wang, C.Y. The Mann-Kendall test modified by effective sample size to detect trend in serially correlated hydrological series. Water Resour. Manag. 2004, 18, 201–218. [Google Scholar] [CrossRef]
- Wang, F.; Shao, W.; Yu, H.; Kan, G.; He, X.; Zhang, D.; Ren, M.; Wang, G. Re-evaluation of the Power of the Mann-Kendall Test for Detecting Monotonic Trends in Hydrometeorological Time Series. Front. Earth Sci. 2020, 8, 14. [Google Scholar] [CrossRef]
- Serinaldi, F.; Kilsby, C.G.; Lombardo, F. Untenable nonstationarity: An assessment of the fitness for purpose of trend tests in hydrology. Adv. Water Resour. 2018, 111, 132–155. [Google Scholar] [CrossRef]
- Şen, Z. An innovative trend analysis methodology. J. Hydrol. Eng. 2012, 17, 1042–1046. [Google Scholar] [CrossRef]
- Caloiero, T. Evaluation of rainfall trends in the South Island of New Zealand through the innovative trend analysis (ITA). Theor. Appl. Climatol. 2019, 139, 493–504. [Google Scholar] [CrossRef]
- Malik, A.; Kumar, A.; Guhathakurta, P.; Kisi, O. Spatial-temporal trend analysis of seasonal and annual rainfall (1966–2015) using innovative trend analysis method with significance test. Arab. J. Geosci. 2019, 12, 328. [Google Scholar] [CrossRef]
- Caloiero, T.; Coscarelli, R.; Ferrari, E. Application of the Innovative Trend Analysis Method for the Trend Analysis of Rainfall Anomalies in Southern Italy. Water Resour. Manag. 2018, 32, 4971–4983. [Google Scholar] [CrossRef]
- Gedefaw, M.; Yan, D.; Wang, H.; Qin, T.; Girma, A.; Abiyu, A.; Batsuren, D. Innovative Trend Analysis of Annual and Seasonal Rainfall Variability in Amhara Regional State, Ethiopia. Atmosphere 2018, 9, 326. [Google Scholar] [CrossRef] [Green Version]
- Haktanir, T.; Citakoglu, H. Trend, independence, stationarity, and homogeneity tests on maximum rainfall series of standard durations recorded in Turkey. J. Hydrol. Eng. 2014, 19, 501–509. [Google Scholar] [CrossRef]
- Ay, M.; Kisi, O. Investigation of trend analysis of monthly total precipitation by an innovative method. Theor. Appl. Climatol. 2015, 120, 617–629. [Google Scholar] [CrossRef]
- Kisi, O. An innovative method for trend analysis of monthly pan evaporations. J. Hydrol. 2015, 527, 1123–1129. [Google Scholar] [CrossRef]
- Martínez-Austria, P.F.; Bandala, E.R.; Patiño-Gómez, C. Temperature and heat wave trends in northwest Mexico. Phys. Chem. Earth 2015, 91, 20–26. [Google Scholar] [CrossRef]
- Şen, Z. Trend identification simulation and application. J. Hydrol. Eng. 2014, 19, 635–642. [Google Scholar] [CrossRef]
- Tabari, H.; Willems, P. Investigation of streamflow variation using an innovative trend analysis approach in northwest Iran. In Proceedings of the 36th IAHR World Congress, The Hague, The Netherlands, 28 June–3 July 2015. [Google Scholar]
- Caloiero, T. SPI Trend Analysis of New Zealand Applying the ITA Technique. Geosciences 2018, 8, 101. [Google Scholar] [CrossRef] [Green Version]
- Yilmaz, B. Analysis of hydrological drought trends in the gap region (Southeastern Turkey) by Mann Kendall test and Innovative Şen method. Appl. Ecol. Environ. Res. 2019, 17, 3325–3342. [Google Scholar] [CrossRef]
- Caloiero, T.; Aristodemo, F.; Ferraro, D.A. Trend analysis of significant wave height and energy period in southern Italy. Theor. Appl. Clim. 2019, 138, 917–930. [Google Scholar] [CrossRef]
- Sen, P.K. Estimates of the regression coefficient based on Kendall’s tau. J. Am. Stat. Assoc. 1968, 63, 1379–1389. [Google Scholar] [CrossRef]
- Mann, H.B. Nonparametric tests against trend. Econometrica 1945, 13, 245–259. [Google Scholar] [CrossRef]
- Kendall, M.G. Rank Correlation Methods; Hafner Publishing Company: New York, NY, USA, 1962. [Google Scholar]
- Achite, M. Sécheresse et Gestion des Ressources en Eau Dans le Bassin Versant de la Mina. Algérie. 2ème Colloque International Sur L’eau et L’Environnement. 30 et 31 Janvier 2007. Sidi Fredj. Alger (Algérie). Available online: https://www.worldwatercouncil.org/ (accessed on 21 April 2022).
- Alahacoon, N.; Edirisinghe, M.; Simwanda, M.; Perera, E.; Nyirenda, V.R.; Ranagalage, M. Rainfall Variability and Trends over the African Continent Using TAMSAT Data (1983–2020): Towards Climate Change Resilience and Adaptation. Remote Sens. 2022, 14, 96. [Google Scholar] [CrossRef]
- Lloyd-Hughes, B.; Saunders, M.A. Seasonal prediction of European spring precipitation from El Niño–Southern Oscillation and local sea surfaces temperatures. Int. J. Climatol. 2002, 22, 1–14. [Google Scholar] [CrossRef]
- Conte, M.; Giuffrida, A.; Tedesco, S. The Mediterranean Oscillation. Impact on Precipitation and Hydrology in Italy Climate Water; Academy of Finland: Helsinki, Finland, 1989. [Google Scholar]
- Martín-Vide, J.; Lopez-Bustins, J.A. The Western Mediterranean Oscillation and rainfall in the Iberian Peninsula. Int. J. Climatol. 2006, 26, 1455–1475. [Google Scholar] [CrossRef]
- Meddi, M.; Assani, A.A.; Meddi, H. Temporal variability of annual rainfall in the Macta and Tafna catchments, northwestern Algeria. Water Resour. Manag. 2010, 24, 3817–3833. [Google Scholar] [CrossRef]
- Schilling, J.; Freier, K.P.; Hertig, E.; Scheffran, J. Climate change, vulnerability, and adaptation in North Africa with focus on Morocco. Agric. Ecosyst. Environ. 2012, 156, 12–26. [Google Scholar] [CrossRef]
- Mariotti, A.; Pan, Y.; Zeng, N.; Alessandri, A. Long-term climate change in the Mediterranean region in the midst of decadal variability. Clim. Dyn. 2015, 44, 1437–1456. [Google Scholar] [CrossRef]
- Prudhomme, C.; Giuntoli, I.; Robinson, E.L.; Clark, D.B.; Arnell, N.W.; Dankers, R.; Fekete, B.M.; Franssen, W.; Gerten, D.; Gosling, S.N.; et al. Hydrological droughts in the 21st century, hotspots and uncertainties from a global multimodel ensemble experiment. Proc. Natl. Acad. Sci. USA 2014, 111, 3262–3267. [Google Scholar] [CrossRef] [Green Version]
- Lionello, P.; Scarascia, L. The relation between climate change in the Mediterranean region and global warming. Reg. Environ. Chang. 2018, 18, 1481–1493. [Google Scholar] [CrossRef]
- Tramblay, Y.; Jarlan, L.; Hanich, L.; Somot, S. Future Scenarios of Surface Water Resources Availability in North African Dams. Water Resour. Manag. 2018, 32, 1291–1306. [Google Scholar] [CrossRef]


| ID | Code | Name | Longitude | Latitude | Elevation (m) |
|---|---|---|---|---|---|
| S1 | 013306 | Oued Abtal | 0°40′33.97′′ E | 35°28′03.59′′ N | 354 |
| S2 | 013401 | Sidi Abdelkader Djillali | 0°34′08.35′′ E | 35°29′20.71′′ N | 225 |
| S3 | 013302 | Ain Hammara | 0°39′16.85′′ E | 35°23′15.39′′ N | 288 |
| S4 | 013001 | Kef Mehboula | 0°49′34.20′′ E | 35°18′40.72′′ N | 475 |
| S5 | 013304 | Takhmaret | 0°37′27.25′′ E | 35°06′49.01′′ N | 655 |
| ID | Code | Name | Basin Area (km2) | Longitude | Latitude |
|---|---|---|---|---|---|
| H1 | 013402 | Oued Abtal | 4126 | 0°41′00.49′′ E | 35°29′26.28′′ N |
| H2 | 013401 | Sidi Abdelkader Djillali | 480 | 0°35′19.99′′ E | 35°28′46.05′′ N |
| H3 | 013302 | Ain Hammara | 2480 | 0°40′33.19′′ E | 35°23′50.09′′ N |
| H4 | 013001 | Kef Mehboula | 680 | 0°50′47.89′′ E | 35°18′05.21′′ N |
| H5 | 013301 | Takhmaret | 1553 | 0°38′46.54′′ E | 35°06′20.08′′ N |
| Period | Oued Abtal | Sidi Abdelkader Djillali | Ain Hamara | Kef Mehboula | Takhmaret |
|---|---|---|---|---|---|
| September | 2.323 ** | 4.833 * | |||
| October | |||||
| November | 3.625 ** | ||||
| December | −2.294 * | ||||
| January | |||||
| February | |||||
| March | −7.455 ** | −5.800 ** | −11.211 ** | ||
| April | −8.250 ** | ||||
| May | −1.000 * | ||||
| June | −1.627 * | −0.526 * | −1.115 * | ||
| July | 0.435 *** | −0.774 ** | |||
| August | 0.943 * | ||||
| Year | −27.400 ** | −34.048 *** | |||
| Autumn | −6.900 * | ||||
| Winter | −12.000 *** | ||||
| Spring | −9.917 * | −9.000 ** | −7.385 ** | −17.759 *** | |
| Summer |
| Period | Oued Abtal | Sidi Abdelkader Djillali | Ain Hamara | Kef Mehboula | Takhmaret |
|---|---|---|---|---|---|
| September | −0.185 *** | −0.005 *** | −0.018 * | ||
| October | −0.191 * | −0.016 *** | |||
| November | −0.392 *** | −0.060 *** | |||
| December | −0.372 *** | −0.080 *** | −0.076 ** | ||
| January | −0.309 ** | −0.091 *** | −0.121 *** | −0.019 * | |
| February | −0.468 ** | −0.111 *** | −0.225 ** | −0.046 * | |
| March | −0.615 *** | −0.061 *** | −0.240 *** | −0.050 ** | |
| April | −0.482 *** | −0.034 *** | −0.150 ** | −0.040 ** | |
| May | −0.666 *** | −0.027 *** | −0.116 *** | ||
| June | −0.133 *** | −0.006 *** | −0.073 *** | ||
| July | −0.111 *** | −0.003 *** | −0.069 *** | −0.026 ** | |
| August | −0.108 *** | −0.001 ** | −0.051 *** | ||
| Year | −0.495 *** | −0.060 *** | 0.130 ** | ||
| Autumn | −0.188 ** | −0.033 *** | 0.306 ** | ||
| Winter | −0.497 *** | −0.113 *** | −0.094 ** | ||
| Spring | −0.752 *** | −0.062 *** | −0.127 ** | −0.038 * | |
| Summer | −0.210 *** | −0.003 *** | −0.072 *** |
Publisher’s Note: MDPI stays neutral with regard to jurisdictional claims in published maps and institutional affiliations. |
© 2022 by the authors. Licensee MDPI, Basel, Switzerland. This article is an open access article distributed under the terms and conditions of the Creative Commons Attribution (CC BY) license (https://creativecommons.org/licenses/by/4.0/).
Share and Cite
Achite, M.; Caloiero, T.; Toubal, A.K. Rainfall and Runoff Trend Analysis in the Wadi Mina Basin (Northern Algeria) Using Non-Parametric Tests and the ITA Method. Sustainability 2022, 14, 9892. https://doi.org/10.3390/su14169892
Achite M, Caloiero T, Toubal AK. Rainfall and Runoff Trend Analysis in the Wadi Mina Basin (Northern Algeria) Using Non-Parametric Tests and the ITA Method. Sustainability. 2022; 14(16):9892. https://doi.org/10.3390/su14169892
Chicago/Turabian StyleAchite, Mohammed, Tommaso Caloiero, and Abderrezak Kamel Toubal. 2022. "Rainfall and Runoff Trend Analysis in the Wadi Mina Basin (Northern Algeria) Using Non-Parametric Tests and the ITA Method" Sustainability 14, no. 16: 9892. https://doi.org/10.3390/su14169892