
Evaluation of Landfill Site Selection by Combining Fuzzy Tools in GIS-Based Multi-Criteria Decision Analysis: A Case Study in Diyarbakır, Turkey


Abstract
:1. Introduction
2. Materials and Method
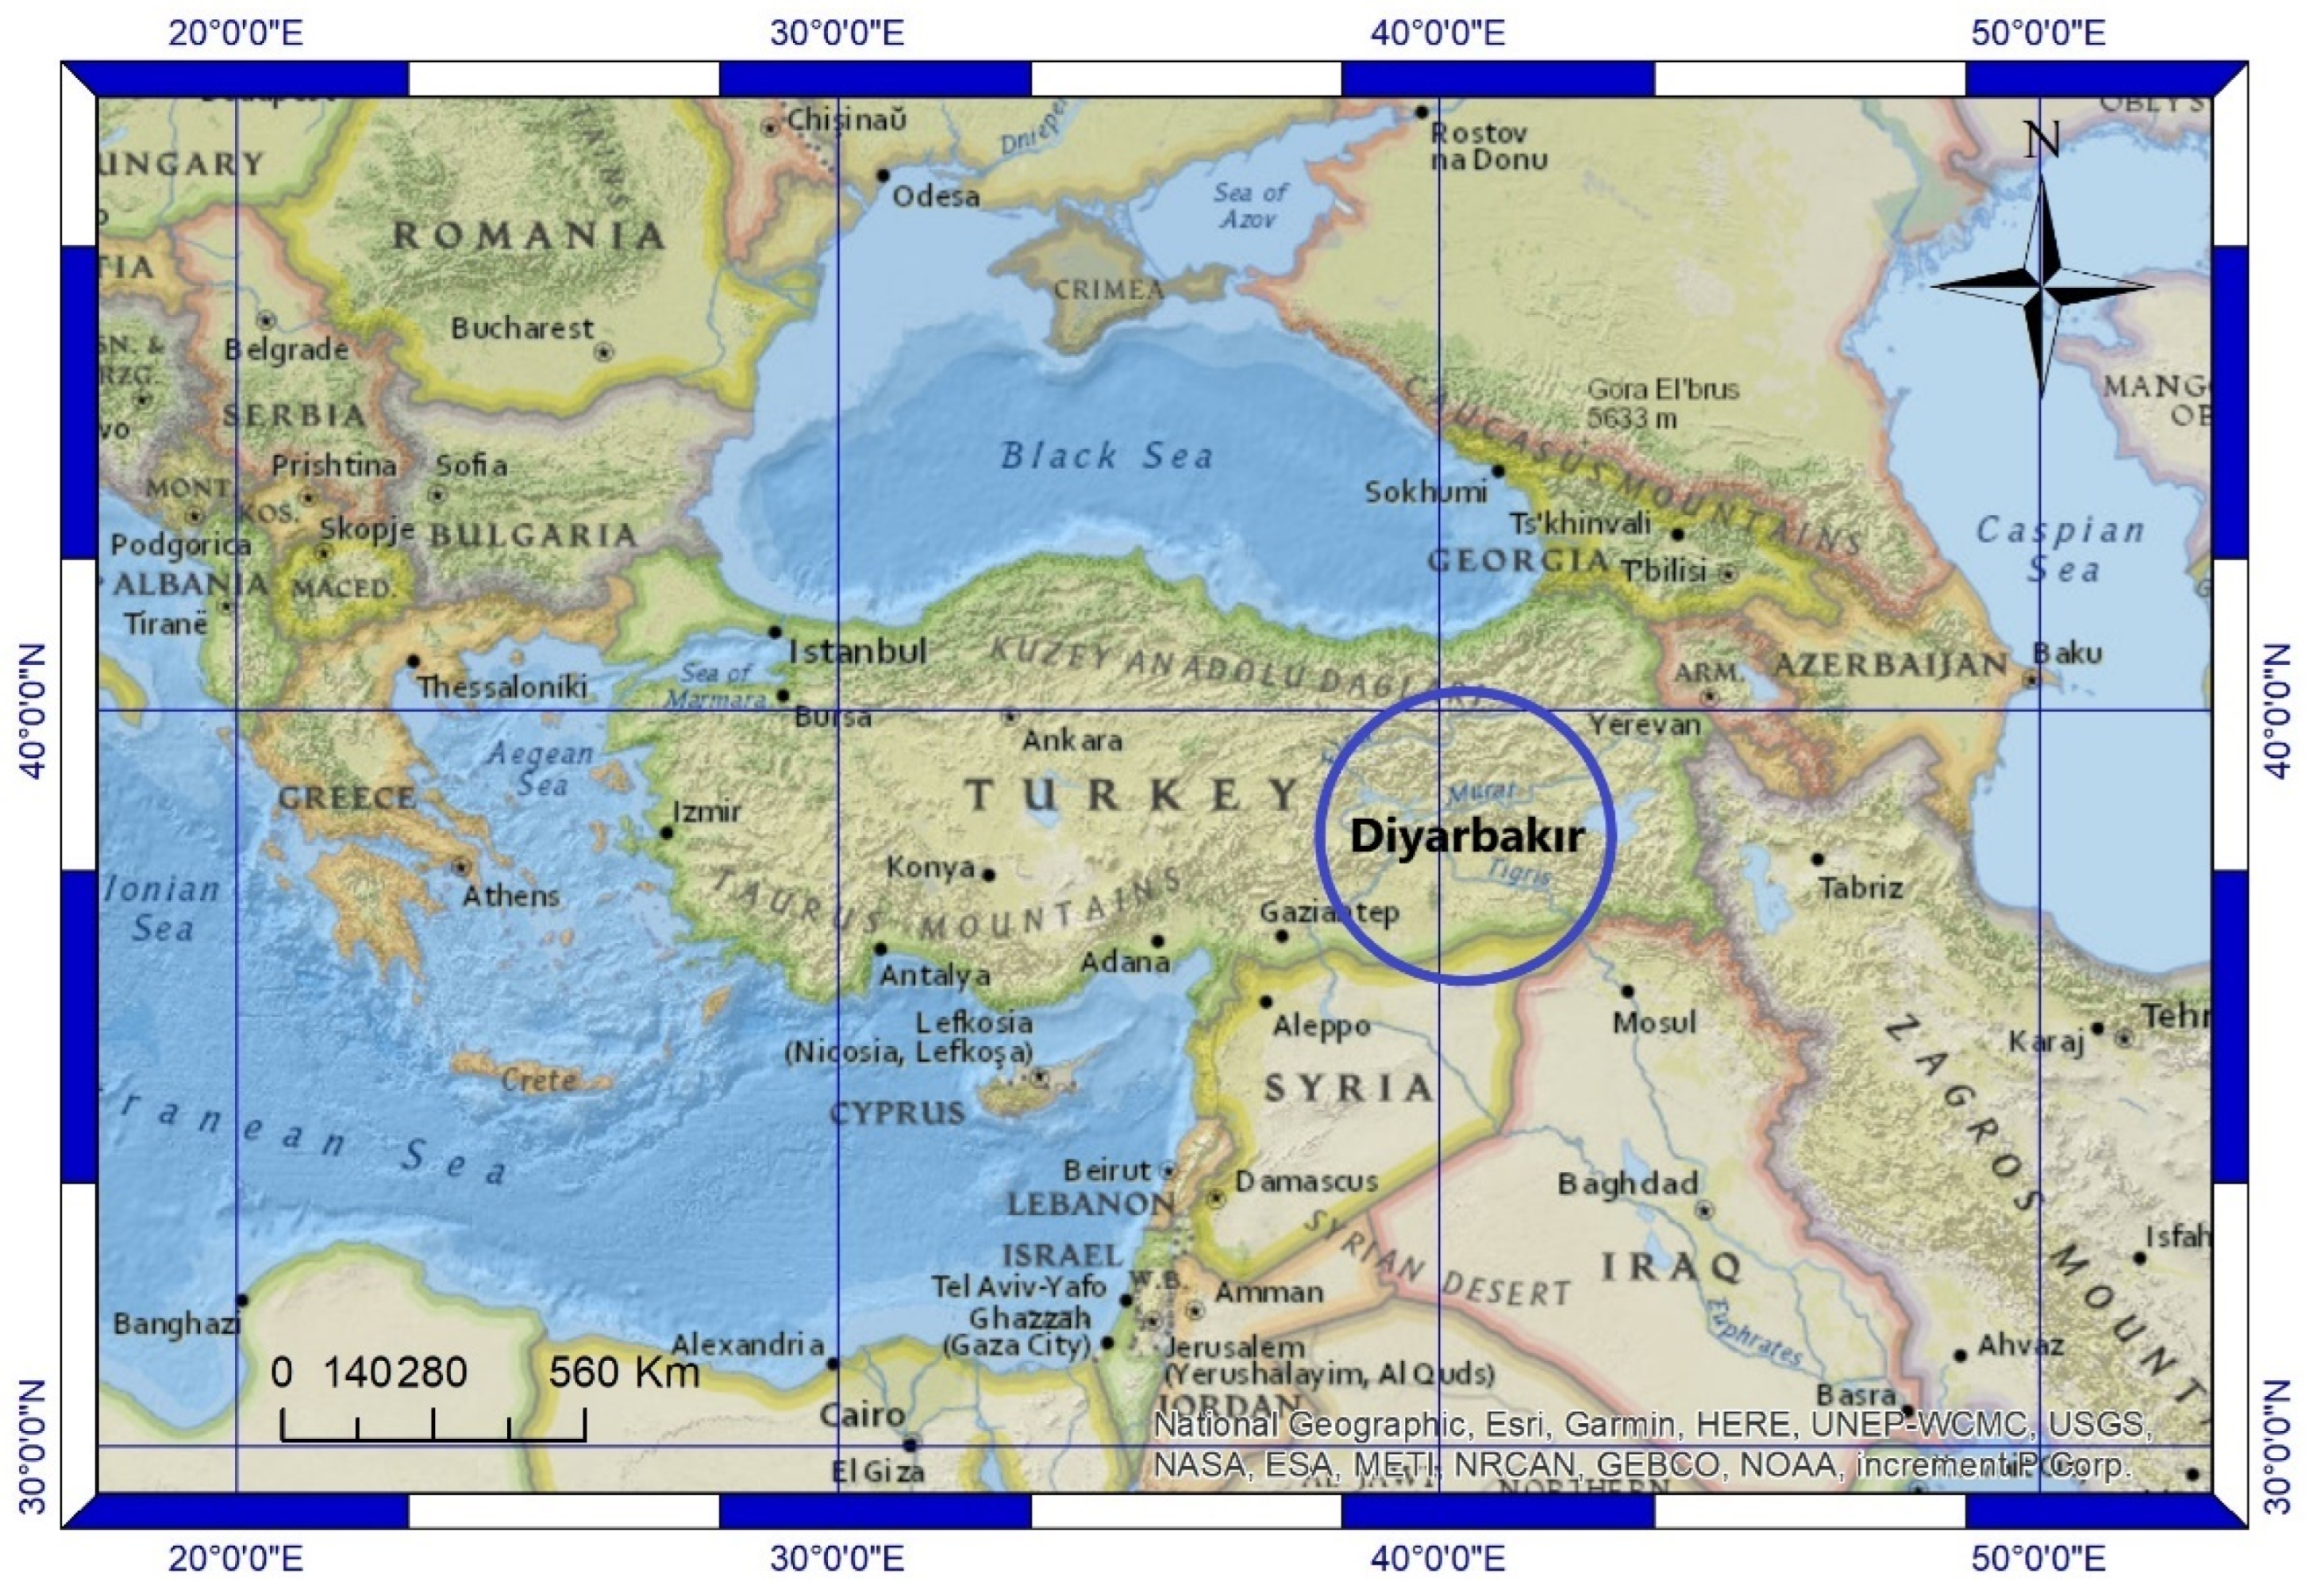
2.1. Study Zone
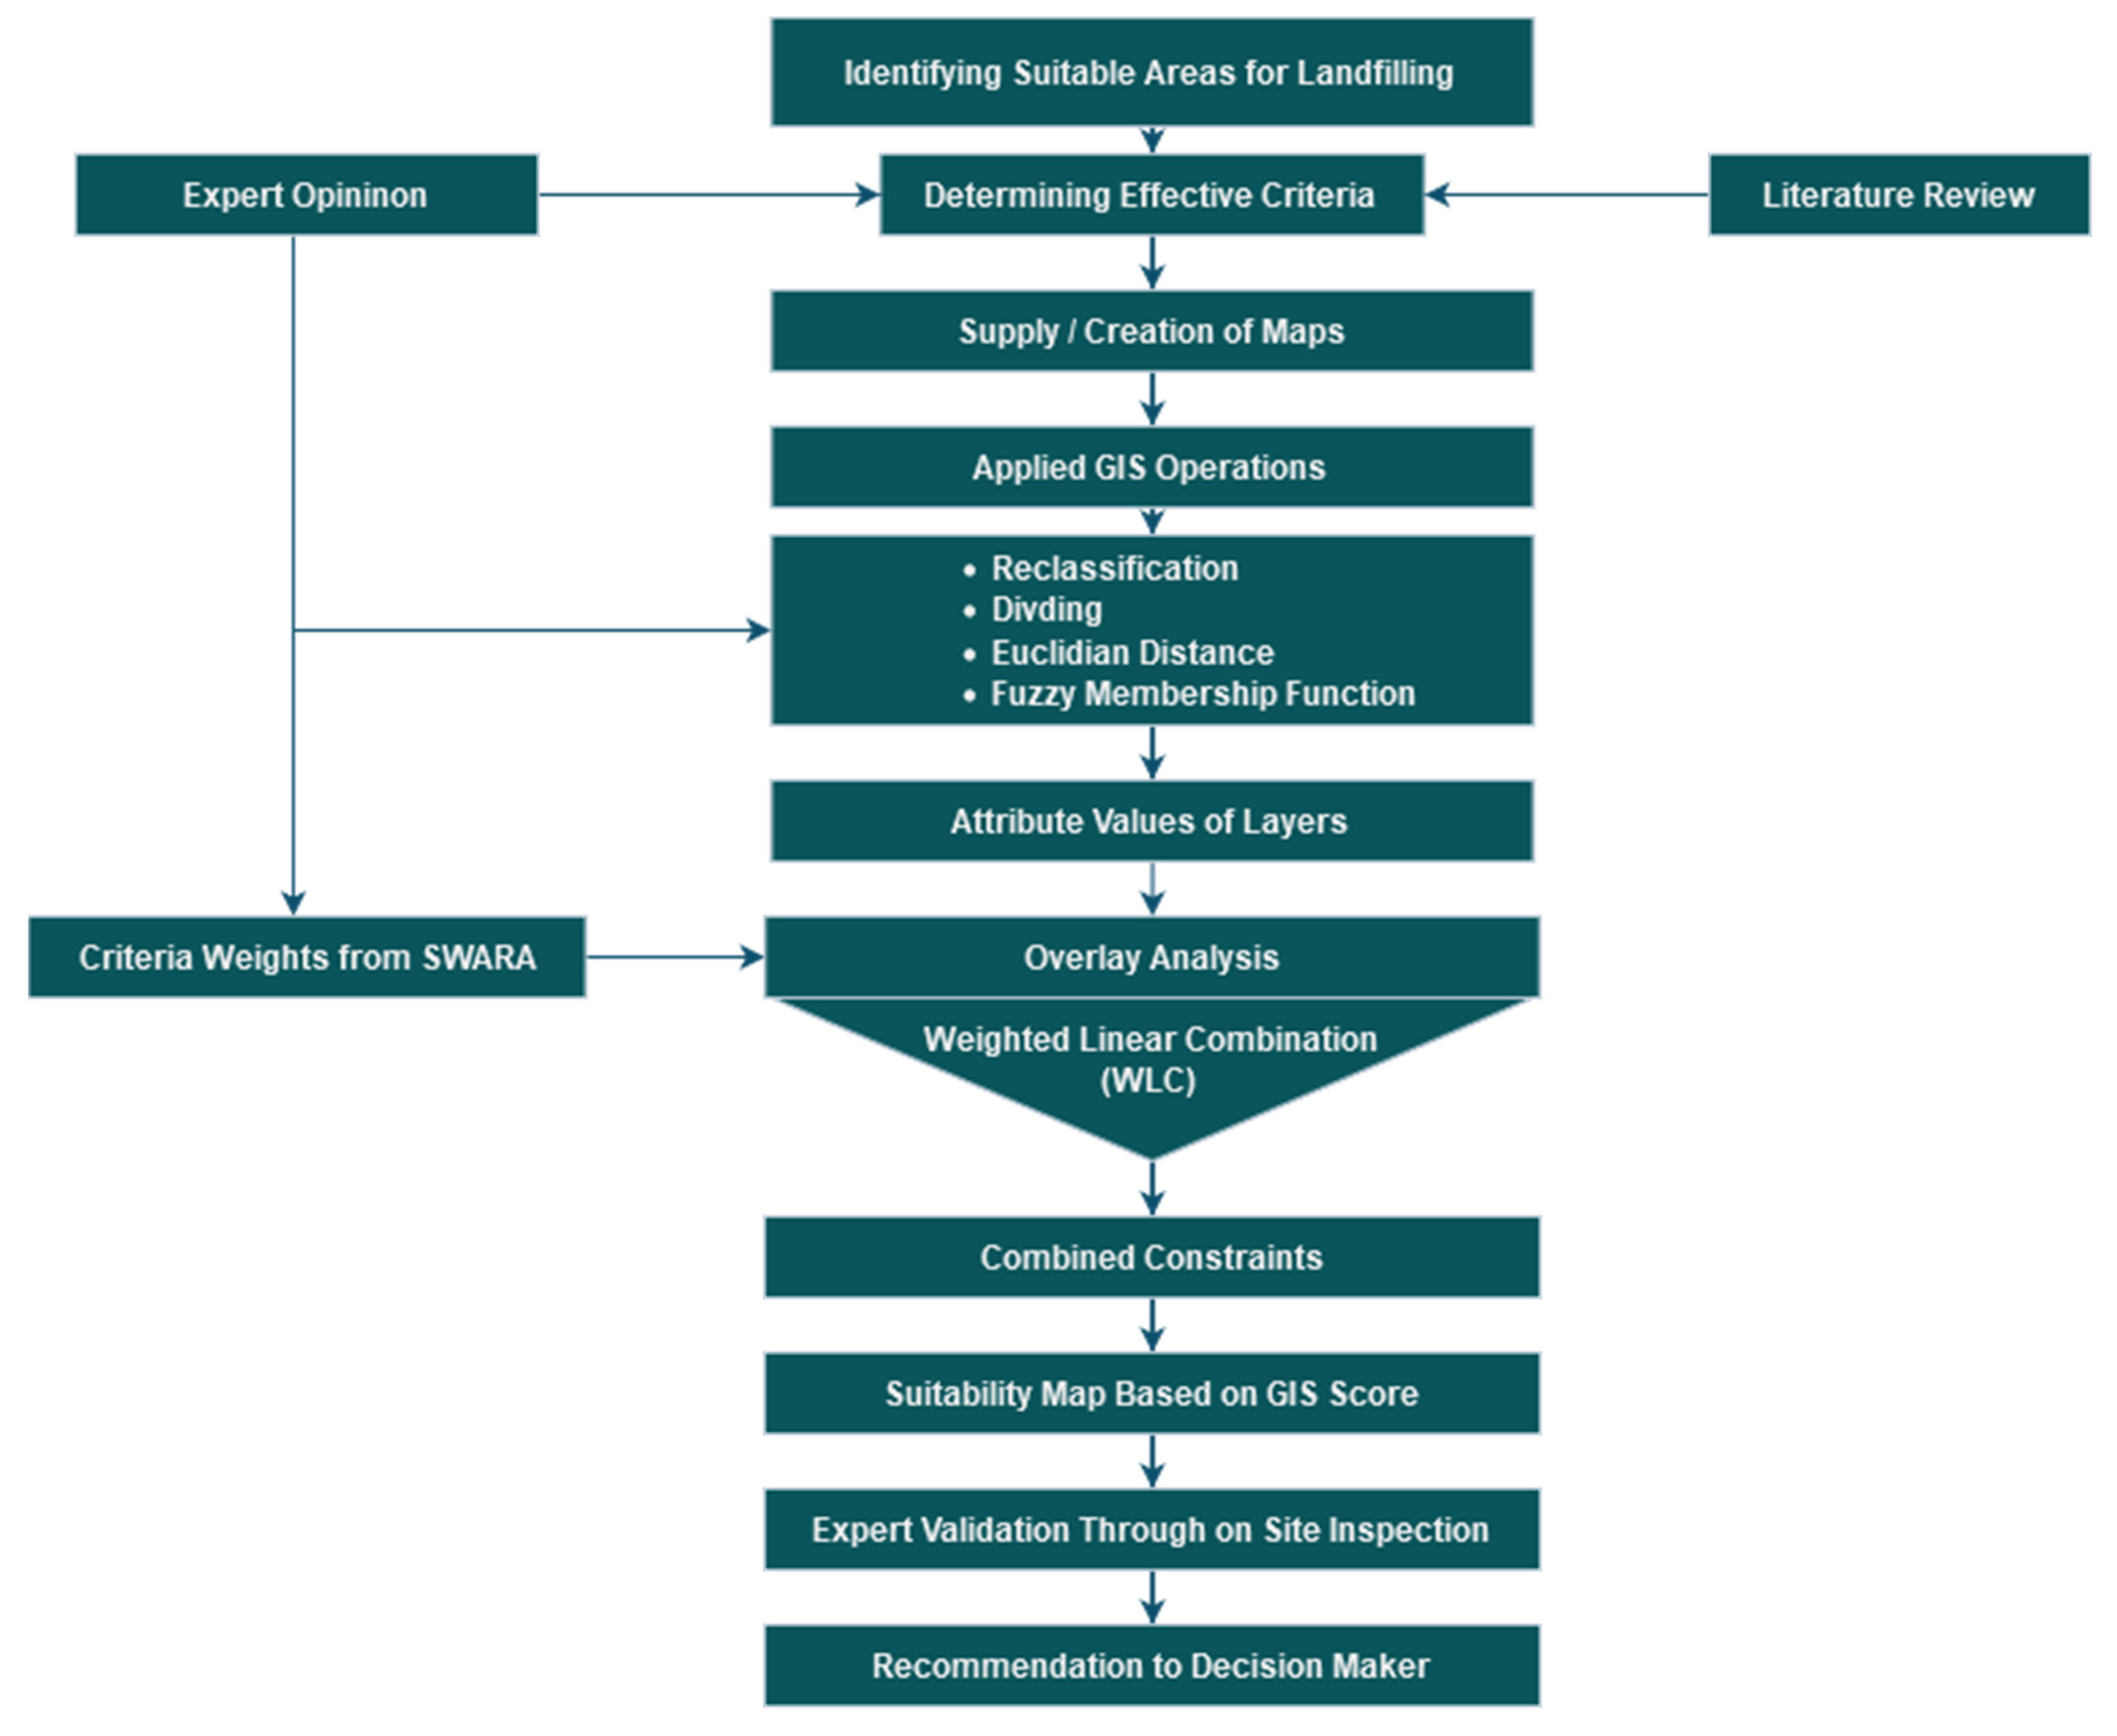
2.2. Study Steps
- The purpose of the research was determined and a criteria selection and evaluation commission consisting of experts on the subject was established.
- Site selection criteria suitable for the environmental and economic characteristics and priorities of the study area were determined with expert opinion and literature support.
- Thematic maps were obtained/created and uploaded to the database to make the determined criteria functional
- To apply membership functions to thematic maps, the following operations were applied, although with different combinations for each map:
- i.
- For each criterion requiring distance analysis, new raster maps were created using the Euclidean distance function.
- ii.
- In order to operate the fuzzy function on categorical data, firstly classification (Classify) functions, and then division (Divide) functions, in accordance with the desired sensitivity, were applied.
- Fuzzy membership function study parameters and class ranges were determined for each criterion.
- Constraint maps were determined to eliminate areas that are not strictly suitable, and the eliminated areas were obtained by combining the constraints.
- Criterion weights were obtained by using the SWARA method with expert opinions.
- WLC overlay analysis was performed on the criteria weights as a result of SWARA and maps obtained by fuzzy membership function were applied to each criterion, to obtain a criteria suitability map.
- The site suitability map was obtained by multiplying the constraint map and the criterion suitability map obtained by WLC.
- The model was tested and verified by an expert team visiting the appropriate areas identified by the proposed method.
2.3. Establishment and Studies of the Expert Commission
2.4. Criteria
2.4.1. Distance to Surface Waters (C1 & C2)
2.4.2. Groundwater (C3)
2.4.3. Distance to Residential Areas (C4)
2.4.4. Slope (C5)
2.4.5. Distance to Airports (C6)
2.4.6. Distance to Fault Lines (C7)
2.4.7. Land Use Status (C8)
2.4.8. Distance to Highways (C9)
2.4.9. Elevation (C10)
2.4.10. Aspect (C11)
2.4.11. Soil Cover (C12)
2.4.12. Geological Structure (C13)
2.4.13. Distance to Railways (C14)
2.5. Proposed Method
2.5.1. Fuzzy Membership Functions
2.5.2. Calculation of Criterion Weights with the SWARA Method
2.5.3. WLC Method
2.6. Constraint Layers
3. Results and Discussion
4. Conclusions
- The SWARA-GIS-2F methodology was developed in this study and was used for the first time to identify potential areas suitable for regular solid waste storage facilities in Diyarbakır.
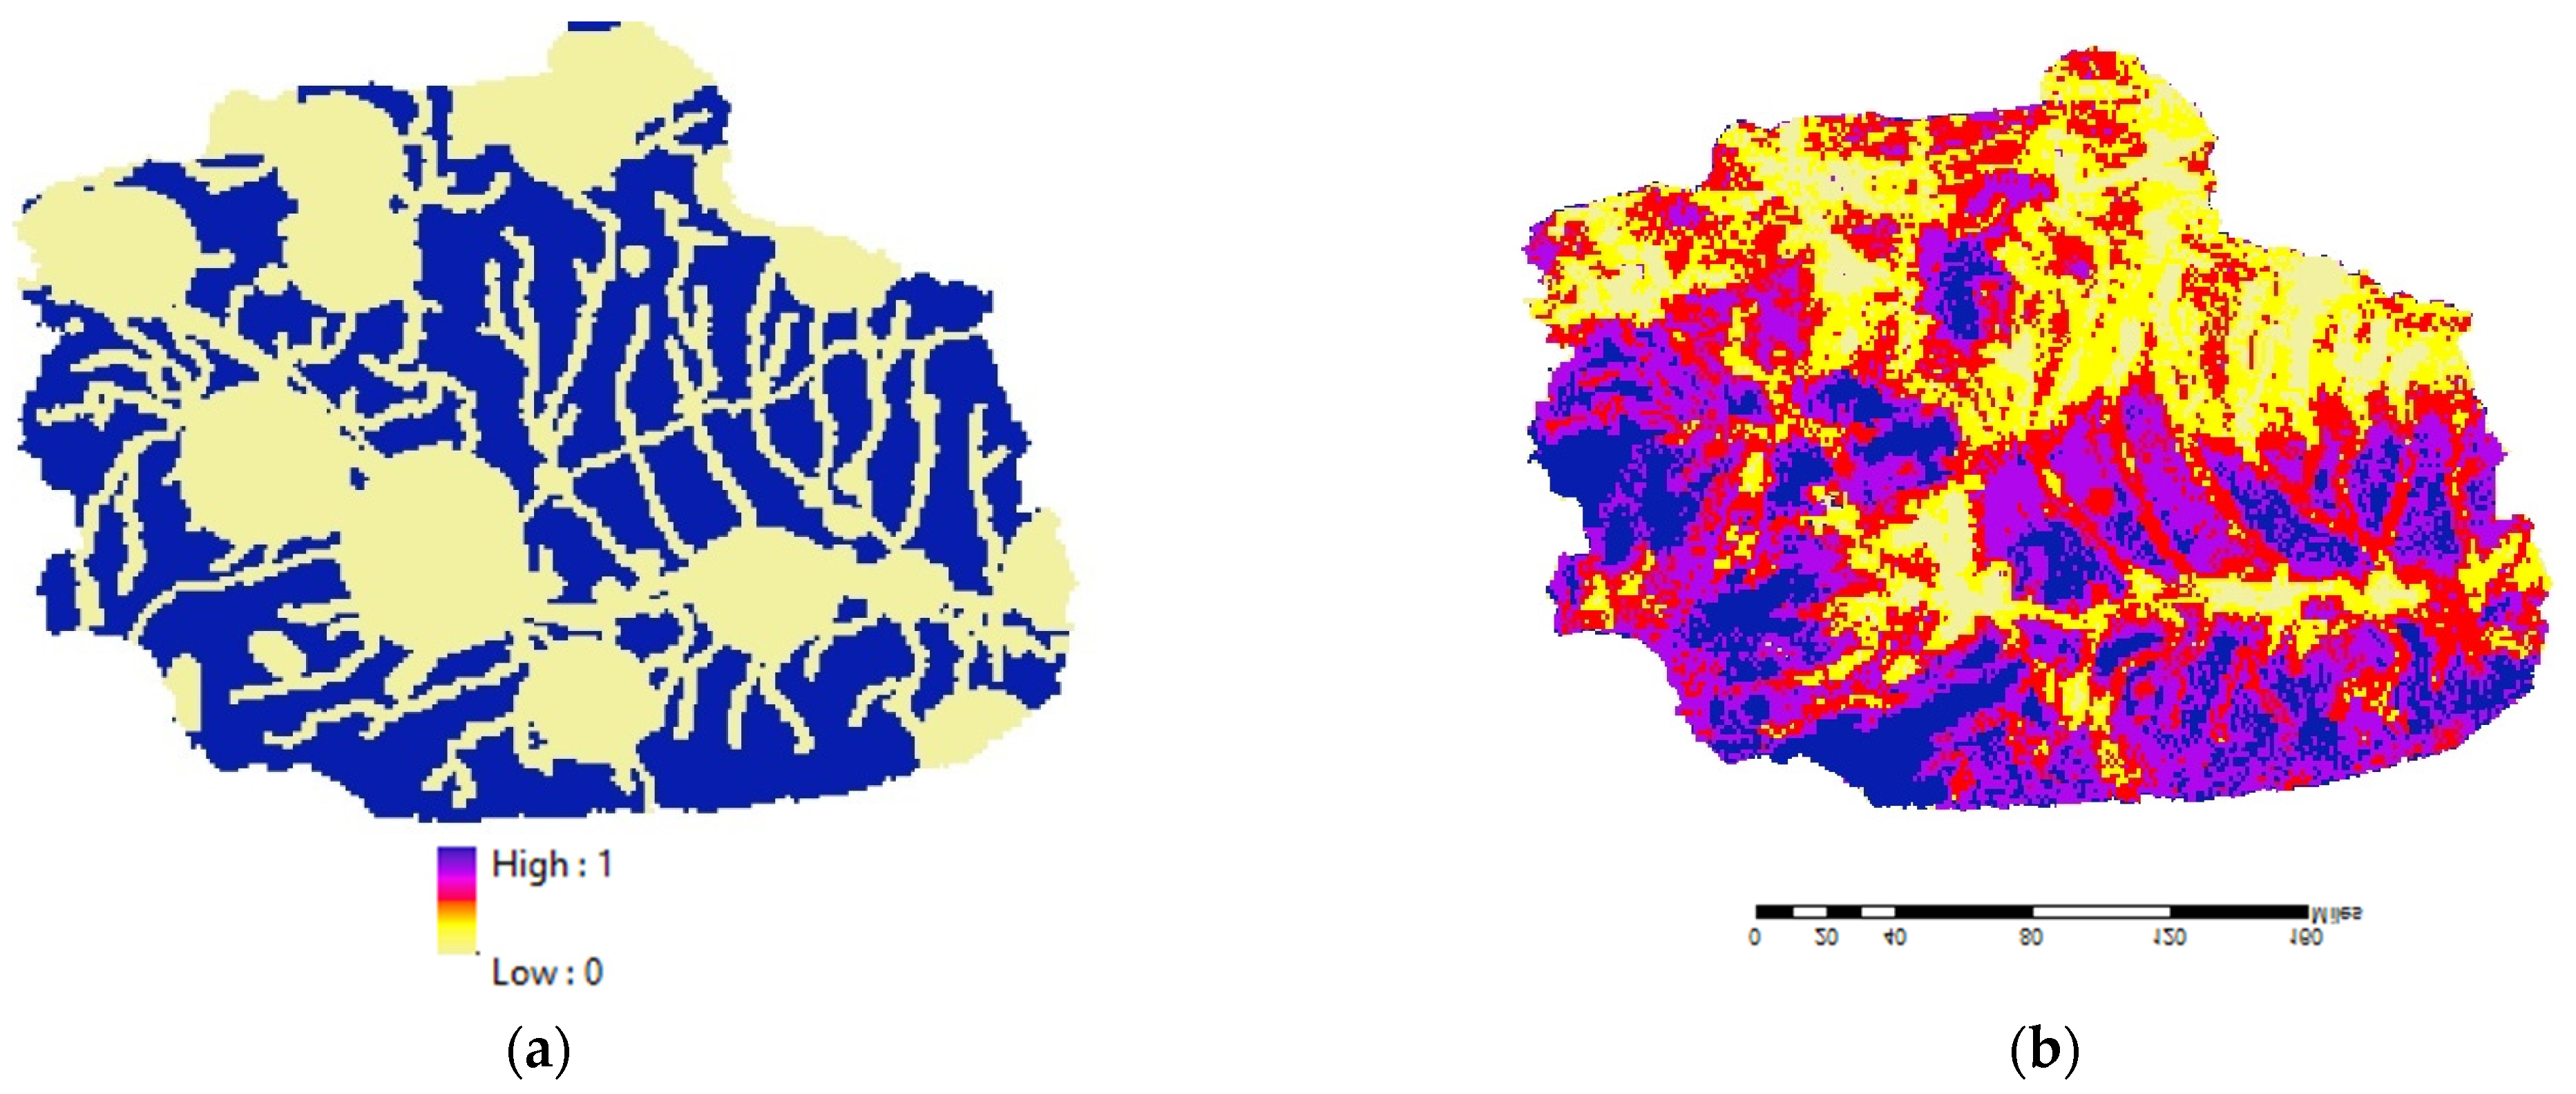
- The methodology has determined that it is not possible to use 55% of the land belonging to the Diyarbakır province for solid waste landfills.
- The developed methodology determined the GIS scores of the areas that can be used for landfill. According to these scores, 6 suitability levels were determined by reclassification. The percentage values of the sizes of the areas from the unsuitable to the most suitable were 54.68%, 13.59%, 14.37%, 7.76%, 6.16% and 3.44%, respectively.
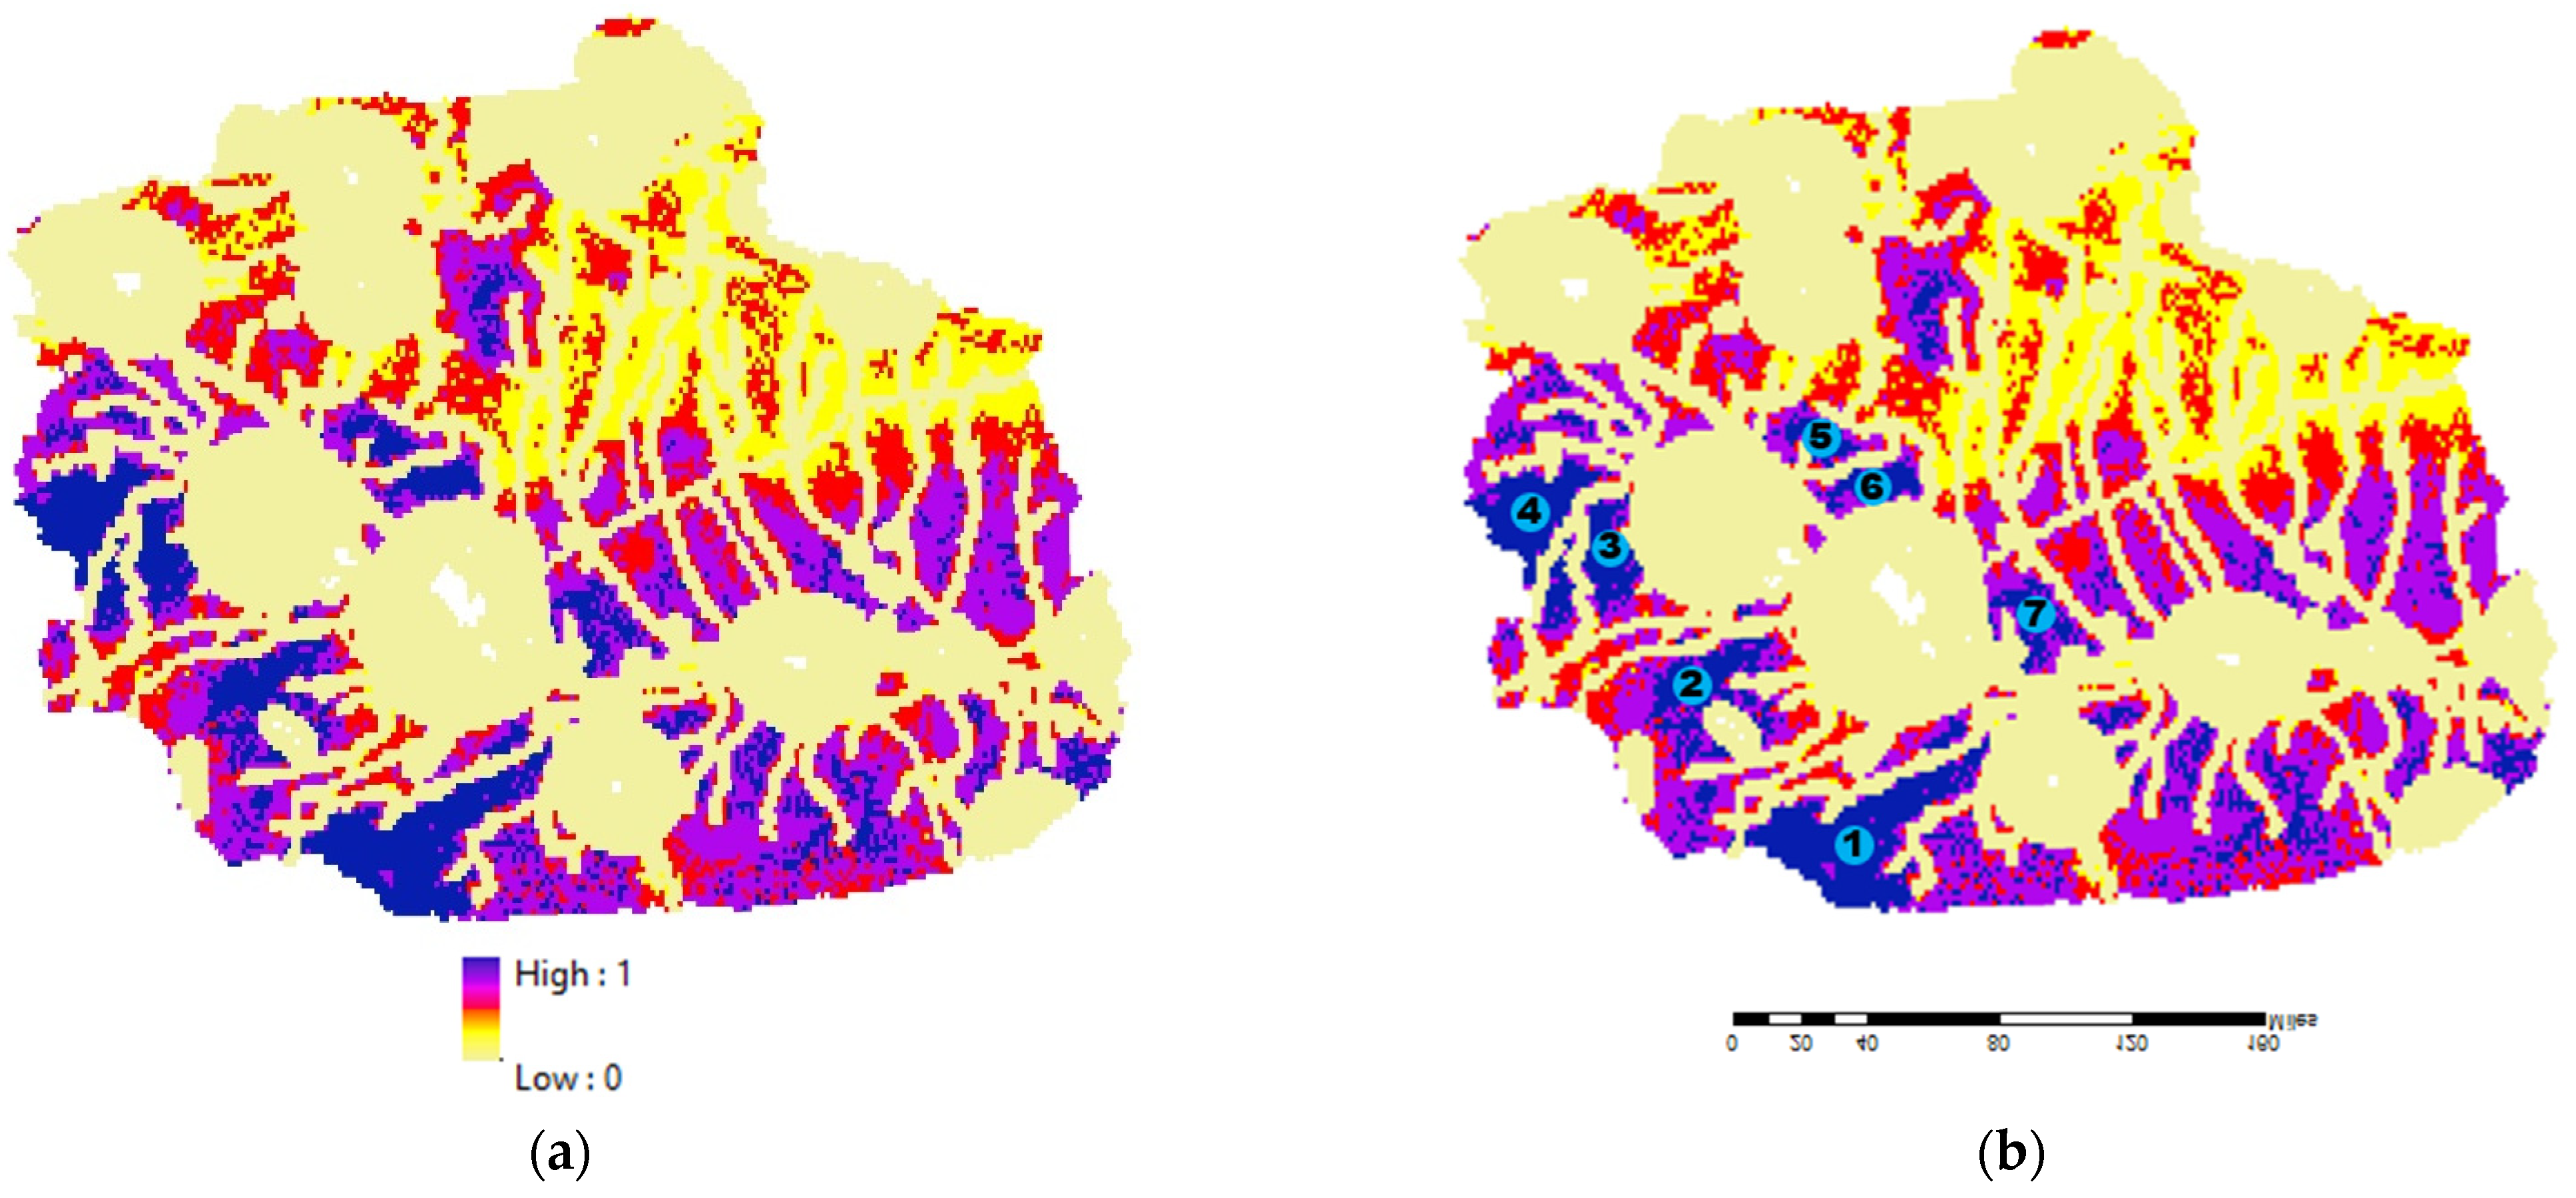
- The developed methodology determined 3.44% of the Diyarbakır province area as the most suitable place for sustainable landfills. The total size of these areas, which are clustered in 7 different regions of the city, is approximately 20,900 hectares.
- The most suitable areas were labeled 1 to 7 and referred to as candidate regions. The sizes of these candidate members, from candidate 1 to candidate 7, were 6796, 1738, 2629, 4969, 847, 1827 and 2094 hectares, respectively. Each of these seven candidate sites is more than enough to meet the needs of a landfill facility.
- These seven candidate sites, scattered across different parts of the city, have given city managers and decision makers a lot of freedom for landfill selection. City administrators who will make the final decisions can evaluate sensitivities involving social and political issues that were not covered in this study.
- The maps used to develop models reflect the situation at the time they were produced. However, land uses designed by public institutions and/or private companies will not be visible on the maps. In order to obtain more accurate results and to obtain more sustainable models, it is suggested that these planned land uses should be mapped and reflected in the model.
- It is suggested that publicly owned lands can be included in the model as a criterion so that the cost of land to be allocated for landfill will not be an economic burden to the municipality.
Author Contributions
Funding
Institutional Review Board Statement
Informed Consent Statement
Data Availability Statement
Conflicts of Interest
References
- United Nations World Urbanization Prospects: 2014 Revision; Department of Economic and Social Affairs, Population Division: New York, NY, USA, 2014.
- OECD. OECD Environmental Outlook to 2050: The Consequences of Inaction Key Facts and Figures. 2012. Available online: https://www.oecd.org/env/indicators-modelling-outlooks/oecdenvironmentaloutlookto2050theconsequencesofinaction-keyfactsandfigures.htm (accessed on 15 May 2022).
- Demesouka, O.; Vavatsikos, A.; Anagnostopoulos, K. GIS-based multicriteria municipal solid waste landfill suitability analysis: A review of the methodologies performed and criteria implemented. Waste Manag. Res. 2014, 32, 270–296. [Google Scholar]
- Magrinho, A.; Didelet, F.; Semiao, V. Municipal solid waste disposal in Portugal. Waste Manag. 2006, 26, 1477–1489. [Google Scholar]
- Khandelwal, H.; Dhar, H.; Thalla, A.K.; Kumar, S. Application of life cycle assessment in municipal solid waste management: A worldwide critical review. J. Clean. Prod. 2019, 209, 630–654. [Google Scholar]
- Kocasoy, G.; Curi, K. The Ümraniye-Hekimbaşi open dump accident. Waste Manag. Res. 1995, 13, 305–314. [Google Scholar]
- Yin, Y.; Li, B.; Wang, W.; Zhan, L.; Xue, Q.; Gao, Y.; Zhang, N.; Chen, H.; Liu, T.; Li, A. Mechanism of the December 2015 Catastrophic Landslide at the Shenzhen Landfill and Controlling Geotechnical Risks of Urbanization. Engineering 2016, 2, 230–249. [Google Scholar]
- National Fire Incident Reporting System. Landfill Fire, Their Magnitude, Characteristics and Mitigation; National fire data centre: Arlington, VA, USA, 2002; Volume 225, p. 2. Available online: https://www.sustainable-design.ie/fire/FEMA-LandfillFires.pdf (accessed on 24 February 2020).
- Bihałowicz, J.S.; Rogula-Kozłowska, W.; Krasuski, A. Contribution of landfill fires to air pollution–An assessment methodology. Waste Manag. 2021, 125, 182–191. [Google Scholar]
- Singh, N.; Hui, D.; Singh, R.; Ahuja, I.P.S.; Feo, L.; Fraternali, F. Fraternali, Recycling of plastic solid waste: A state of art review and future applications. Compos. Part B Eng. 2017, 115, 409–422. [Google Scholar]
- Bukhkalo, S.I.; Klemeš, J.J.; Tovazhnyanskyy, L.L.; Arsenyeva, O.P.; Kapustenko, P.O.; Perevertaylenko, O.Y. Eco-friendly synergetic processes of municipal solid waste polymer utilization. Chem. Eng. Trans. 2018, 70, 2047–2052. [Google Scholar]
- Anthraper, D.; McLaren, J.; Baroutian, S.; Munir, M.; Young, B.R. Hydrothermal deconstruction of municipal solid waste for solid reduction and value production. J. Clean. Prod. 2018, 201, 812–819. [Google Scholar]
- Alavi, N.; Goudarzi, G.; Babaei, A.A.; Jaafarzadeh, N.; Hosseinzadeh, M. Municipal solid waste landfill site selection with geographic information systems and analytical hierarchy process: A case study in Mahshahr County, Iran. Waste Manag. Res. 2013, 31, 98–105. [Google Scholar]
- Abdel-Shafy, H.I.; Mansour, M.S. Solid waste issue: Sources, composition, disposal, recycling, and valorization. Egypt. J. Pet. 2018, 27, 1275–1290. [Google Scholar]
- Rahimi, S.; Hafezalkotob, A.; Monavari, S.M.; Hafezalkotob, A.; Rahimi, R. Sustainable landfill site selection for municipal solid waste based on a hybrid decision-making approach: Fuzzy group BWM-MULTIMOORA-GIS. J. Clean. Prod. 2020, 248, 119186. [Google Scholar]
- Demesouka, O.E.; Anagnostopoulos, K.P.; Siskos, E. Spatial multicriteria decision support for robust land-use suitability: The case of landfill site selection in Northeastern Greece. Eur. J. Oper. Res. 2019, 272, 574–586. [Google Scholar]
- Aksoy, E.; San, B.T. Geographical information systems GIS and multi-criteria decision analysis MCDA integration for sustainable landfill site selection considering dynamic data source. Bull. Eng. Geol. Environ. 2019, 78, 779–791. [Google Scholar]
- Gorsevski, P.V.; Donevska, K.R.; Mitrovski, C.D.; Frizado, J.P. Integrating multi-criteria evaluation techniques with geographic information systems for landfill site selection: A case study using ordered weighted average. Waste Manag. 2012, 32, 287–296. [Google Scholar]
- Malczewski, J. GIS-based land-use suitability analysis: A critical overview. Prog. Plan. 2004, 62, 3–65. [Google Scholar]
- Liu, J.; Li, Y.; Xiao, B.; Jiao, J. Coupling Fuzzy Multi-Criteria Decision-Making and Clustering Algorithm for MSW Landfill Site Selection Case Study: Lanzhou, China. ISPRS Int. J. Geo-Inf. 2021, 10, 403. [Google Scholar] [CrossRef]
- Mallick, J. Municipal Solid Waste Landfill Site Selection Based on Fuzzy-AHP and Geoinformation Techniques in Asir Region Saudi Arabia. Sustainability 2021, 13, 1538. [Google Scholar] [CrossRef]
- Li, M.; Xu, Y.; Guo, J.; Li, Y.; Li, W. Application of a GIS-Based Fuzzy Multi-Criteria Evaluation Approach for Wind Farm Site Selection in China. Energies 2020, 13, 2426. [Google Scholar] [CrossRef]
- Özkan, B.; Özceylan, E.; Sarıçiçek, İ. GIS-based MCDM modeling for landfill site suitability analysis: A comprehensive review of the literature. Environ. Sci. Pollut. Res. 2019, 26, 30711–30730. [Google Scholar]
- Çelik, R. Temporal changes in the groundwater level in the Upper Tigris Basin, Turkey, determined by a GIS technique. J. Afr. Earth Sci. 2015, 107, 134–143. [Google Scholar]
- Çelik, R. Evaluation of groundwater potential by GIS-based multicriteria decision making as a spatial prediction tool: Case study in the Tigris River Batman-Hasankeyf Sub-Basin, Turkey. Water 2019, 11, 2630. [Google Scholar]
- Gil-García, I.C.; Ramos-Escudero, A.; García-Cascales, M.; Dagher, H.; Molina-García, A. Fuzzy GIS-based MCDM solution for the optimal offshore wind site selection: The Gulf of Maine case. Renew. Energy 2022, 183, 130–147. [Google Scholar]
- Eren, E.; Katanalp, B.Y. Fuzzy-based GIS approach with new MCDM method for bike-sharing station site selection according to land-use types. Sustain. Cities Soc. 2022, 76, 103434. [Google Scholar]
- Özkan, B.; Sarıçiçek, İ.; Özceylan, E. Evaluation of landfill sites using GIS-based MCDA with hesitant fuzzy linguistic term sets. Environ. Sci. Pollut. Res. 2020, 27, 42908–42932. [Google Scholar]
- Arabameri, A.; Rezaei, K.; Cerda, A.; Lombardo, L.; Rodrigo-Comino, J. GIS-based groundwater potential mapping in Shahroud plain, Iran. A comparison among statistical bivariate and multivariate, data mining and MCDM approaches. Sci. Total Environ. 2019, 658, 160–177. [Google Scholar]
- Saraswat, S.; Digalwar, A.K.; Yadav, S.; Kumar, G. MCDM and GIS based modelling technique for assessment of solar and wind farm locations in India. Renew. Energy 2021, 169, 865–884. [Google Scholar]
- Foroozesh, F.; Monavari, S.M.; Salmanmahiny, A.; Robati, M.; Rahimi, R. Assessment of sustainable urban development based on a hybrid decision-making approach: Group fuzzy BWM, AHP, and TOPSIS–GIS. Sustain. Cities Soc. 2022, 76, 103402. [Google Scholar]
- Keršulienė, V.; Zavadskas, E.K.; Turskis, Z. Selection of rational dispute resolution method by applying new step-wise weight assessment ratio analysis SWARA. J. Bus. Econ. Manag. 2010, 11, 243–258. [Google Scholar]
- Ghoushchi, S.J.; Bonab, S.R.; Ghiaci, A.M.; Haseli, G.; Tomaskova, H.; Hajiaghaei-Keshteli, M. Landfill Site Selection for Medical Waste Using an Integrated SWARA-WASPAS Framework Based on Spherical Fuzzy Set. Sustainability 2021, 13, 13950. [Google Scholar] [CrossRef]
- Mishra, A.R.; Rani, P.; Pandey, K.; Mardani, A.; Streimikis, J.; Streimikiene, D.; Alrasheedi, M. Novel Multi-Criteria Intuitionistic Fuzzy SWARA–COPRAS Approach for Sustainability Evaluation of the Bioenergy Production Process. Sustainability 2020, 12, 4155. [Google Scholar] [CrossRef]
- Panahi, M.; Jaafari, A.; Shirzadi, A.; Shahabi, H.; Rahmati, O.; Omidvar, E.; Lee, S.; Bui, D.T. Deep learning neural networks for spatially explicit prediction of flash flood probability. Geosci. Front. 2021, 12, 101076. [Google Scholar]
- Popovic, G.; Stanujkic, D.; Brzakovic, M.; Karabasevic, D. A multiple-criteria decision-making model for the selection of a hotel location. Land Use Policy 2019, 84, 49–58. [Google Scholar]
- Yücenur, G.N.; Ipekçi, A. SWARA/WASPAS methods for a marine current energy plant location selection problem. Renew. Energy 2021, 163, 1287–1298. [Google Scholar]
- Mostafaeipour, A.; Dehshiri, S.J.H.; Jahangiri, M. Prioritization of potential locations for harnessing wind energy to produce hydrogen in Afghanistan. Int. J. Hydrog. Energy 2020, 45, 33169–33184. [Google Scholar]
- Volvačiovas, R.; Turskis, Z.; Aviža, D.; Mikštienė, R. Multi-attribute selection of public buildings retrofits strategy. Procedia Eng. 2013, 57, 1236–1241. [Google Scholar]
- Pamucar, D.; Yazdani, M.; Montero-Simo, M.J.; Araque-Padilla, R.A.; Mohammed, A. Multi-criteria decision analysis towards robust service quality measurement. Expert Syst. Appl. 2021, 170, 114508. [Google Scholar]
- Ghenai, C.; Albawab, M.; Bettayeb, M. Sustainability indicators for renewable energy systems using multi-criteria decision-making model and extended SWARA/ARAS hybrid method. Renew. Energy 2020, 146, 580–597. [Google Scholar]
- Zolfani, S.H.; Aghdaie, M.H.; Derakhti, A.; Zavadskas, E.K.; Varzandeh, M.H.M. Decision making on business issues with foresight perspective; an application of new hybrid MCDM model in shopping mall locating. Expert Syst. Appl. 2013, 40, 7111–7121. [Google Scholar]
- Chen, W.; Panahi, M.; Tsangaratos, P.; Shahabi, H.; Ilia, I.; Panahi, S.; Li, S.; Jaafari, A.; Bin Ahmad, B. Applying population-based evolutionary algorithms and a neuro-fuzzy system for modeling landslide susceptibility. Catena 2019, 172, 212–231. [Google Scholar]
- TÜİK. Türkiye İstatistik Kurumu, Atık İstatistikleri. 2020. Available online: http://www.tuik.gov.tr (accessed on 10 May 2022).
- TÜİK. Türkiye İstatistik Kurumu, Nüfus İstatistikleri. 2020. Available online: https://data.tuik.gov.tr/Kategori/GetKategori?p=Nufus-ve-Demografi-109 (accessed on 10 May 2022).
- Bahrani, S.; Ebadi, T.; Ehsani, H.; Yousefi, H.; Maknoon, R. Modeling landfill site selection by multi-criteria decision making and fuzzy functions in GIS, case study: Shabestar. Iran. Environ. Earth Sci. 2016, 75, 1–14. [Google Scholar]
- Demesouka, O.; Vavatsikos, A.; Anagnostopoulos, K. Anagnostopoulos, Suitability analysis for siting MSW landfills and its multicriteria spatial decision support system: Method, implementation and case study. Waste Manag. 2013, 33, 1190–1206. [Google Scholar]
- Majid, M.; Mir, B.A. Landfill site selection using GIS based multi criteria evaluation technique. A case study of Srinagar city, India. Environ. Chall. 2021, 3, 100031. [Google Scholar]
- Fazal, S. Land re-organisation in relation to roads in an Indian city. Land Use Policy 2001, 18, 191–199. [Google Scholar]
- Rezaeisabzevar, Y.; Bazargan, A.; Zohourian, B. Landfill site selection using multi criteria decision making: Influential factors for comparing locations. J. Environ. Sci. 2020, 93, 170–184. [Google Scholar]
- Şener, Ş.; Şener, E.; Nas, B.; Karagüzel, R. Combining AHP with GIS for landfill site selection: A case study in the Lake Beyşehir catchment area Konya, Turkey. Waste Manag. 2010, 30, 2037–2046. [Google Scholar]
- Djokanović, S.; Abolmasov, B.; Jevremović, D. GIS application for landfill site selection: A case study in Pančevo, Serbia. Bull. Eng. Geol. Environ. 2016, 75, 1273–1299. [Google Scholar]
- Kontos, T.D.; Komilis, D.P.; Halvadakis, C.P. Siting MSW landfills with a spatial multiple criteria analysis methodology. Waste Manag. 2005, 25, 818–832. [Google Scholar]
- Malczewski, J. On the use of weighted linear combination method in GIS: Common and best practice approaches. Trans. GIS 2000, 4, 5–22. [Google Scholar]
- Kamdar, I.; Ali, S.; Bennui, A.; Techato, K.; Jutidamrongphan, W. Municipal solid waste landfill siting using an integrated GIS-AHP approach: A case study from Songkhla, Thailand. Resources. Conserv. Recycl. 2019, 149, 220–235. [Google Scholar]
- Torkayesh, A.E.; Zolfani, S.H.; Kahvand, M.; Khazaelpour, P. Landfill location selection for healthcare waste of urban areas using hybrid BWM-grey MARCOS model based on GIS. Sustain. Cities Soc. 2021, 67, 102712. [Google Scholar]
- Kapilan, S.; Elangovan, K. Potential landfill site selection for solid waste disposal using GIS and multi-criteria decision analysis MCDA. J. Cent. South Univ. 2018, 25, 570–585. [Google Scholar]
- Effat, H.A.; Hegazy, M.N. Mapping potential landfill sites for North Sinai cities using spatial multicriteria evaluation. Egypt. J. Remote Sens. Space Sci. 2012, 15, 125–133. [Google Scholar]


| Criterion Name and Operation Parameter | Criterion Weight | Fuzzy Function Graphic | Fuzzy Map |
|---|---|---|---|
| Groundwater Level (C3) Linear (30; 60) | 0.110 |  |  |
| Distance to Lakes (C1) Large (1750; 5) | 0.105 |  |  |
| Distance to Rivers (C2) Large (1100; 5) | 0.105 |  |  |
| Distance to Residential Areas (C4) Large (3500; 5) | 0.097 |  |  |
| Slope (C5) Small (10; 7) | 0.073 |  |  |
| Distance to Airports (C6) Large (10,000; 5) | 0.069 |  |  |
| Distance to Fault Lines (C7) Linear (500; 2000) | 0.063 |  |  |
| Land Use Status (C8) User-defined Linear (0;10) | 0.064 | The study area was classified with the Reclassify tool in an appropriate range (1–10) according to the current land uses and converted to the range [0,1] with a linear function. |  |
| Distance to Highways (C9) Linear (1000; 5000) | 0.067 |  |  |
| Aspect (C11) Gaussian (225; 5) | 0.047 |  |  |
| Elevation (C10) Trapezoid (550; 650 and 800; 700) | 0.045 |  |  |
| Geological Structure (C13) User-defined Linear (0; 9) | 0.055 | It has been reclassified to reflect the geological suitability of the study area. Next, the linear function was applied to convert the class values to the range [0,1]. |  |
| Soil Cover (C12) User-defined Linear (0; 10) | 0.061 | The study area was classified in the range (1–10) with the Reclassify tool according to its suitability for the landfill area and converted to the range [0,1] with a linear function. |  |
| Distance to Railways (C14) Linear (1000; 2000) | 0.037 |  |  |
 |
| Expert 1 | Expert 2 | Expert 3 | Expert 4 | ||||||||||||
|---|---|---|---|---|---|---|---|---|---|---|---|---|---|---|---|
| Cn | Kj | Qj | Wj | Cn | Kj | Qj | Wj | Cn | Kj | Qj | Wj | Cn * | Kj | Qj | Wj |
| C3 | 1.000 | 0.140 | C3 | 1.000 | 0.113 | C3 | 1.000 | 0.122 | C3 | 1.000 | 0.110 | ||||
| C1 | 1.000 | 1.000 | 0.129 | C7 | 1.000 | 1.000 | 0.102 | C1 | 1.110 | 0.901 | 0.100 | C1 | 1.000 | 1.000 | 0.100 |
| C2 | 1.000 | 1.000 | 0.129 | C1 | 1.100 | 0.909 | 0.093 | C2 | 1.000 | 0.901 | 0.100 | C2 | 1.000 | 1.000 | 0.100 |
| C4 | 1.000 | 1.000 | 0.129 | C2 | 1.000 | 0.909 | 0.093 | C4 | 1.200 | 0.751 | 0.083 | C4 | 1.000 | 1.000 | 0.100 |
| C5 | 1.000 | 1.000 | 0.129 | C6 | 1.000 | 0.909 | 0.093 | C8 | 1.000 | 0.751 | 0.083 | C6 | 1.000 | 1.000 | 0.100 |
| C12 | 1.400 | 0.714 | 0.092 | C4 | 1.200 | 0.758 | 0.078 | C5 | 1.200 | 0.626 | 0.069 | C9 | 1.000 | 1.000 | 0.100 |
| C9 | 1.400 | 0.510 | 0.066 | C11 | 1.000 | 0.758 | 0.078 | C6 | 1.000 | 0.626 | 0.069 | C7 | 1.450 | 0.690 | 0.069 |
| C8 | 1.250 | 0.408 | 0.053 | C8 | 1.200 | 0.631 | 0.065 | C7 | 1.000 | 0.626 | 0.069 | C8 | 1.200 | 0.575 | 0.057 |
| C10 | 1.330 | 0.307 | 0.040 | C9 | 1.200 | 0.526 | 0.054 | C13 | 1.000 | 0.626 | 0.069 | C13 | 1.000 | 0.575 | 0.057 |
| C13 | 1.000 | 0.307 | 0.040 | C13 | 1.000 | 0.526 | 0.054 | C12 | 1.000 | 0.626 | 0.069 | C5 | 1.200 | 0.479 | 0.048 |
| C11 | 1.500 | 0.205 | 0.026 | C14 | 1.000 | 0.526 | 0.054 | C9 | 1.450 | 0.431 | 0.048 | C10 | 1.000 | 0.479 | 0.048 |
| C6 | 2.000 | 0.102 | 0.013 | C5 | 1.200 | 0.438 | 0.045 | C11 | 1.000 | 0.431 | 0.048 | C14 | 1.000 | 0.479 | 0.048 |
| C7 | 1.000 | 0.102 | 0.013 | C10 | 1.000 | 0.438 | 0.045 | C10 | 1.000 | 0.431 | 0.048 | C11 | 1.250 | 0.383 | 0.038 |
| C14 | 1.000 | 0.102 | 0.013 | C12 | 1.000 | 0.438 | 0.045 | C14 | 1.500 | 0.288 | 0.032 | C12 | 1.000 | 0.383 | 0.038 |
| Expert 1 | Expert 2 | Expert 3 | Expert 4 | AVG | |
|---|---|---|---|---|---|
| Criteria | Wj | Wj | Wj | Wj | Wj |
| Distance to Lakes (C1) | 0.129 | 0.093 | 0.100 | 0.100 | 0.105 |
| Distance to Rivers (C2) | 0.129 | 0.093 | 0.100 | 0.100 | 0.105 |
| Groundwater (C3) | 0.129 | 0.102 | 0.111 | 0.100 | 0.110 |
| Distance to Residential Areas (C4) | 0.129 | 0.078 | 0.083 | 0.100 | 0.097 |
| Slope (C5) | 0.129 | 0.045 | 0.069 | 0.048 | 0.073 |
| Distance to Airports (C6) | 0.013 | 0.093 | 0.069 | 0.100 | 0.069 |
| Distance to Fault Lines (C7) | 0.013 | 0.102 | 0.069 | 0.069 | 0.063 |
| Land Use Status (C8) | 0.053 | 0.065 | 0.083 | 0.057 | 0.064 |
| Distance to Highways (C9) | 0.066 | 0.054 | 0.048 | 0.100 | 0.067 |
| Elevation (C10) | 0.040 | 0.045 | 0.048 | 0.048 | 0.045 |
| Aspect (C11) | 0.026 | 0.078 | 0.048 | 0.038 | 0.047 |
| Soil Cover (C12) | 0.092 | 0.045 | 0.069 | 0.038 | 0.061 |
| Geological Structure (C13) | 0.040 | 0.054 | 0.069 | 0.057 | 0.055 |
| Distance to Railways (C14) | 0.013 | 0.054 | 0.032 | 0.048 | 0.037 |
| Constraint Name | Working Ranges | Constraint Map |
|---|---|---|
| Distance to Lakes | 0, x < 400 1, x ≥ 400 |  |
| Distance to Rivers | 0, x < 400 1, x ≥ 400 |  |
| Distance to Residential Areas | 0, x < 1000 1, x ≥ 1000 |  |
| Distance to Airports | 0, x < 5000 1, x ≥ 5000 |  |
| Distance to Fault Lines | 0, x < 300 1, x ≥ 300 |  |
| Distance to Highways | 0, x < 500 1, x ≥ 500 |  |
| Distance to Railways | 0, x < 1000 1, x ≥ 1000 |  |
 |
| Index | Suitability Class | Area (ha) | Percentage (%) |
|---|---|---|---|
| 0 | Not Suitable | 332,500 | 54.68 |
| 1 | Poor Suitable | 82,600 | 13.59 |
| 2 | Less Suitable | 87,400 | 14.37 |
| 3 | Suitable | 47,200 | 7.76 |
| 4 | Very Suitable | 37,500 | 6.16 |
| 5 | Most Suitable | 20,900 | 3.44 |
| Area (ha) | Minimum | Maximum | Range | Mean | STD | |
|---|---|---|---|---|---|---|
| Candidate 1 | 6796 | 0.880 | 0.936 | 0.056 | 0.916 | 0.017 |
| Candidate 2 | 1738 | 0.880 | 0.922 | 0.042 | 0.893 | 0.008 |
| Candidate 3 | 2629 | 0.856 | 0.907 | 0.051 | 0.886 | 0.014 |
| Candidate 4 | 4969 | 0.880 | 0.946 | 0.067 | 0.916 | 0.020 |
| Candidate 5 | 847 | 0.857 | 0.916 | 0.059 | 0.877 | 0.018 |
| Candidate 6 | 1827 | 0.859 | 0.909 | 0.050 | 0.882 | 0.016 |
| Candidate 7 | 2094 | 0.856 | 0.880 | 0.024 | 0.868 | 0.007 |
Publisher’s Note: MDPI stays neutral with regard to jurisdictional claims in published maps and institutional affiliations. |
© 2022 by the authors. Licensee MDPI, Basel, Switzerland. This article is an open access article distributed under the terms and conditions of the Creative Commons Attribution (CC BY) license (https://creativecommons.org/licenses/by/4.0/).
Share and Cite
Şimşek, K.; Alp, S. Evaluation of Landfill Site Selection by Combining Fuzzy Tools in GIS-Based Multi-Criteria Decision Analysis: A Case Study in Diyarbakır, Turkey. Sustainability 2022, 14, 9810. https://doi.org/10.3390/su14169810
Şimşek K, Alp S. Evaluation of Landfill Site Selection by Combining Fuzzy Tools in GIS-Based Multi-Criteria Decision Analysis: A Case Study in Diyarbakır, Turkey. Sustainability. 2022; 14(16):9810. https://doi.org/10.3390/su14169810
Chicago/Turabian StyleŞimşek, Kasım, and Selçuk Alp. 2022. "Evaluation of Landfill Site Selection by Combining Fuzzy Tools in GIS-Based Multi-Criteria Decision Analysis: A Case Study in Diyarbakır, Turkey" Sustainability 14, no. 16: 9810. https://doi.org/10.3390/su14169810