Article

Exploring the Relationship between Data Analytics Capability and Competitive Advantage: The Mediating Roles of Supply Chain Resilience and Organization Flexibility

by
Ghazal Rezaei
1,
Seyed Mohammad Hassan Hosseini
2 and
Shib Sankar Sana
3,*
1
Department of Management and Economics, Science and Research Branch, Islamic Azad University, Tehran 1477893855, Iran
2
Department of Industrial Engineering and Management, Shahrood University of Technology, Shahrood 3619995161, Iran
3
Department of Mathematics, Kishore Bharati Bhagini Nivedita College, Ramkrishna Sarani, Kolkata 700060, India
*
Author to whom correspondence should be addressed.
Sustainability 2022, 14(16), 10444; https://doi.org/10.3390/su141610444
Submission received: 19 July 2022 / Revised: 17 August 2022 / Accepted: 19 August 2022 / Published: 22 August 2022

Abstract

:
In today’s business environment, data analytics capability has gained popularity among organizations as a source of competitive advantage. Furthermore, due to the current business outsourcing, supply chain management is known to be an extremely challenging task. Most previous studies focused on the relationship between data analytics capability and competitive advantage regardless of the role of organizational characteristics, particularly supply chain resilience. This paper aimed to assess the impact of data analytics capability on competitive advantage in the textile industry concerning the mediating role of supply chain resilience and organizational flexibility. To this end, a new conceptual model was developed to investigate the relationships and partial least squares–structural equation modeling (PLS-SEM) was applied for analysis. The population of this study comprised 450 qualified persons and four well-known brands of sleep products. In addition, a pilot survey was conducted with 30 respondents before the questionnaire was used for the final survey. Based on the results, data analytics capability positively affected competitive advantage, supply chain resilience, and organizational flexibility. Additionally, supply chain resilience and organizational flexibility played mediating roles in the relationship between data analytics capability and competitive advantage. Finally, some management insights are presented that are of interest to top managers. However, the results of this study were limited to the area of the textile industry (sleeping goods manufacturers) in Iran in order to maintain the uniformity of the research constructs.

1. Introduction

In today’s highly competitive environment, which is characterized by low-profit margins, high customer expectations for quality products, and short waiting times, companies are forced to take advantage of every opportunity to optimize their business processes. In this regard, managers have realized that the supply chain (SC) plays vital role in achieving sustainable competitive advantage (CA). Accordingly, companies consider themselves as part of supply chains that compete with other supply chains, rather than competing directly [1].
On the other hand, organizations evolve and change due to the evolution and diversity of products and services, and their survival depends on their ability to absorb and use information and knowledge about new technologies to create some advantage. In this way, top managers try to develop and properly manage information systems in order to timely receive and optimally use information and knowledge about new technologies [2]. To achieve a CA, based on the conditions in which they exist, organizations need specific skills that enable them to achieve their competitive goals. Many companies have not been able to develop their activities due to lack of experience, limited resources, and many other factors [3]. Many researchers are of the opinion that given the current changed conditions, companies cannot compete with the previous CAs. They have to move toward acquiring and maintaining dynamic competitiveness [4].
Dynamic environments and competitive pressures have reduced differentiation between companies and lost CA [5]. In dynamic environments, companies need to reconfigure their resources to meet changing needs to achieve more innovation and maintain CAs [6]. To sustain CA and succeed in developing a robust analytics platform, the dynamic capability (DC) supplements the resource-based view (RBV) by identifying, integrating, reconfiguring, gaining, and releasing resources to effectively cope with changing circumstances and to achieve new resource configurations as their markets advance [7]. While prior research has investigated the enablers, antecedents, and outcomes of DC, there is currently no research that investigated the impact of services systems’ analytics capabilities as resources that contribute to dynamic capabilities.
Furthermore, due to the globalization of businesses, organizations are increasingly in competition, and thus look for ways to build sustainable competitive performance to improve their competitive position [8]. Participation of organizations in the globalization process enables them to enjoy CAs with the help of advanced technologies, investments, and rich management experience [9]. It should also be noted that while globalization offers more development opportunities for organizations, it also poses a significant risk to organizations [10]. Hence, supply chains are becoming an essential element in the competition among many organizations.
Research has shown that every activity in the supply chain has inherent risks that may cause unexpected disruption [11]. These disturbances may be due to natural hazards such as earthquakes, floods, tsunamis, hurricanes, or other geological processes, or to artificial disasters such as terrorism, which have the potential to affect revenue and expenditure [12]. Thus, supply chain risk management remains a major topic of discussion in the field of academic research and manufacturing enterprise [13]. For example, the global COVID-19 outbreak has disrupted the supply chain of many companies and has led to the collapse of many businesses. Such issues can have irreversible and long-term effects on businesses. In this regard, resilience and flexibility can protect the supply chain from environmental pressures. As the results of existing studies emphasized, data analysis, information sharing, and supply chain visibility have significant effects on supply chain flexibility (SCF). However, studies have been conducted to understand how organizations use data analytics or supply chain analysis in supply chain disruptions [14]. Organizations need to know how to analyze information under supply chain disruptions, and this can help the organization’s competitive advantage. In this regard, this study aimed to investigate the effect of data analytics capability (DAC) on the CA of an organization with regard to the mediating role of supply chain resilience (SCR) and the organizational flexibility (OF).
As discussed above, in this study, four constructs were selected from the literature; namely, data analytics capability, supply chain resilience, organizational flexibility, and competitive advantage. The reason for selecting these constructs was their relevance to the current business environment, which is characterized by disrupted supply due to increasing uncertainty. Then, supported by previous studies, we built a conceptual model that related the above constructs.
Many studies have discussed the conceptual relationship between two or three of these constructs. However, to the best of our knowledge, no study has investigated the mediating role of supply chain resilience and organizational flexibility simultaneously in the relationship between data analytics capability and competitive advantage. Therefore, this study model raised three primary research questions. First, it asked whether data analytics capability affects supply chain resilience, organizational flexibility, and competitive advantage. Second, it asked whether supply chain resilience and organizational flexibility improve competitive advantage. Finally, it asked whether supply chain resilience and organizational flexibility mediate the influence of data analytics capability on competitive advantage.
In this regard, the textile industry was considered as the area of research due to its generality at the community level. The mediating variables of organizational flexibility and supply chain resilience were explored to innovate. We interviewed 207 Iranians working in the textile industry who comprised many elements of this industry. Therefore, the results can provide managers with valuable insight into opportunities to improve CA.
Figure 1 demonstrates a schematic diagram of the steps of the study. As shown, after the topic was selected, the related studies were reviewed. Later, the research gap was discussed and the problem definition was presented. Afterwards, data were collected using questionnaires and interviews. Subsequently, an analysis of the results was performed, and an appropriate discussion and conclusions are provided.

2. Literature Review

2.1. Competitive Advantage

Competitive advantage has been the main issue in discussing competitive strategies in recent years. From 1998 to 2021, about 346,607 articles were published about CA (see Figure 2). In this chart, it can be seen that from 2016 to 2021, the number of articles increased 1.7 times compared to five years ago.
Competitive advantage refers to a company’s superior position over its competitors in that industry. When a company consistently makes more profit than other companies that compete with that company in a similar industry, it is said to have competitive strength in that market [15,16].
Without achieving a CA, a company will have little economic feasibility to survive and will be in financial decline. In such an environment, only organizations that focus on all aspects of competition; namely, quality, cost, speed, customer responsiveness, and innovation, can survive and improve their positions in order to achieve sustainable CA and outperform their competitors [17]. Shan et al. proposed a conceptual model to identify the sources of CAs, the interrelationship of their components, and the mechanism for obtaining CAs. They showed that all dimensions of dynamic ability affected CA, but they influenced it in different ways [18].
Competitive advantage includes a set of factors or capabilities that always enable an organization to perform better than its competitors [19]. In other words, CA is a factor or combination that makes an organization much more successful than other organizations in a competitive environment in a way that competitors cannot easily imitate. Therefore, to achieve a CA, an organization must pay attention to its external position and internal capabilities [20]. Two points must be considered here. First, this path is a follow-up process that leads to excellent performance and competitiveness of the organization. The organization can use its competencies to create a sustainable CA that is valuable for customers and permanently superior to competitors. Second, due to increasing environment complexity and competitive intensity, CA is either easily imitated by competitors or fades in the view of customers and must be replaced by new advantages [21]. Kwak et al. indicated that cost, growth, reliability, quality, time-to-market, the introduction of new products, and order-filling rate are critical factors in improving CA [8].
Porter defined CA as the way in which an organization can select and implement general strategies to achieve or maintain an economic advantage [22]. In contrast, Peteraf argued that CA is an organization’s ability to maintain its returns above normal [23]. Porter proposed a value chain model to assess a firm’s CA [22]. However, Peteraf argued that there are four cornerstones of CA: heterogeneity, post-competitive constraints, imperfect mobility, and pre-competitive constraints [23]. Meanwhile, Barney argued that an organization can achieve a CA by creating strategic resource packages or capabilities [24]. Schilke argued that one of the most common indicators of CA is superior performance [25,26].
Competitive advantage is a representation of the economic value created by exploiting the resources and capabilities of a company [27]. Annarelli et al. emphasized that CA is an approach to achieving economic growth and a favorable and sustainable position in global markets [28]. Afraz et al. investigated the mediating effect of risk management capabilities on the relationship between supply chain innovation and CA and proposed a theoretical model for these relationships [29].

2.2. Data Analytics Capability

Data science and data analysis are the main issues for decision makers in today’s business environment. Due to a highly complex environment, organizational decision makers cannot trust themselves and their limited knowledge. As a result, organizations are increasingly turning to business analytics capabilities to improve the results of their decision making [30]. Figure 3 demonstrates the amount of research conducted in the field of data analysis in the supply chain from 1998 to 2021. In this chart, it can be seen that from 2016 to 2021, the number of articles almost doubled in the past five years.
The data analysis literature contains conflicting results. So, as indicated by existing research, researchers often use data analysis, big data analysis, supply chain analysis, and predictive analytics [31]. This capability enables organizations to collect, retain, and process data to leverage valuable insights that lead to CAs. The ability to analyze is a combination of tools, techniques, and processes that enable an organization to process and analyze data to generate valuable insights that enable managers to make effective decisions about the business and related operations. Srinivasan and Swink pointed out that data analysis increases the ability to process information by collecting data from various sources [32]. With the digital revolution, organizations have changed so rapidly that companies should find newer solutions to meet the needs of customers. Companies can obtain CAs by implementing such solutions [33].

2.3. Data Analytics and Competitive Advantage

Although the CA topic has remained a subjective term with multiple definitions and no clear definition has been agreed upon, there is consensus that data analysis enables organizations to achieve CA by improving organizational capabilities. Akter et al. discussed “transformed CA with the ability to analyze in-service systems” in their research. Their structural equation model analysis demonstrated that the ability to analyze led to increased CA in service systems. Of course, their study suggested this issue as a preliminary subject, and more studies are needed to understand how the DAC has a positive effect on CA [31]. Sheng et al. showed that big data analytics could allow companies to analyze large volumes of data and plan their strategies in a competitive environment [34]. Gunasekaran et al. also noted that the ability to analyze big data and forecast positively affected supply chain and organizational performance [35]. Shan et al. addressed the “compatibility of big data analysis and the CA of companies considering a dynamic capability perspective and resource-based theories”. Their study was conducted among Chinese manufacturing companies. The results showed that different dimensions of dynamic abilities affected CA. Two dimensions of dynamic capabilities directly affected CA, and strategy flexibility indirectly affected these. Moreover, three dimensions indirectly and positively affected CA by affecting dynamic capabilities [18].
O’Neill and Brabazon investigated the relationship between business analytics, organizational value, and CA. The data collected from a survey of 64 senior analysts from 17 departments confirmed a significant relationship between higher ability levels and the ability to generate organizational value and CA. Dubey et al. discussed the relationship between data analytics capability and OF complementary to SCR. The research hypotheses were tested using the responses of 213 Indian manufacturing organizations through a pre-tested survey-based tool. The results showed that the ability to analyze data was effective in gaining a CA. It was also mediated by resilience and flexibility [36].
Akter et al. studied transformed CA with the ability to analyze in-service systems. Their study was conducted among 251 members of service organizations. A structural equation model analysis showed that the ability to analyze led to an increased CA in service systems [31]. Mikalef et al. addressed the relationship between big data analytics capability and competitive performance: the mediating role of dynamic and operational capabilities. The authors used survey data from 202 senior information officers and IT managers working for Norwegian companies to test the proposed research model. Using the partial least squares structural equation model, the results showed that the ability to analyze big data could help companies create a CA. This effect was not direct, but was entirely mediated by dynamic capabilities that positively and significantly affected both types of operational capabilities [37]. Dahiya et al. investigated the effect of big data analysis on CA while considering company-specific knowledge. Their descriptive study showed that big data analysis led to a CA [38].
Yu et al. addressed the role of the ability to analyze big data in developing integrated hospital supply chains and operational flexibility. The results of the analysis of survey data from a sample of 105 senior hospital managers in China showed that the ability to analyze big data had a significant impact on three dimensions of hospital supply chain development: integration between performance, hospital–patient integration, and hospital–supplier integration. In addition, hospital–patient integration and hospital–supplier integration fully mediated the relationship between functional integration and operational flexibility [39].

2.4. Organizational Flexibility

Due to the important role of flexibility in organizational performance, it is receiving increasing attention in the field of academic research and in manufacturing enterprises. Some researchers have presented OF as a critical factor for companies to survive and succeed in uncertain environments and disruptions [40]. Flexibility means the variability to adapt an organization’s performance to the environment and its changes in different situations. The supply chain needs to be flexible, as its operations are always subject to uncertainties such as customer demand and supply [41]. Supply chain flexibility is the system’s ability to meet a variety of customer orders and expectations with minimal time and expense, operational loss, and organizational disruption [42].
Organizational flexibility is the ability that enables organizations to perform while experiencing various environmental changes and disruptions [32]. Volberda defined OF as the extent to which an organization has different managerial capabilities and the speed at which they are activated to increase the ability to control management and improve the controllability of the organization. From this, it can be concluded that OF is known as an organizational design task and management task [43]. The task of organizational design relates to the ability of organizations to respond in a timely manner to sudden external changes. It focuses on organizational controllability or variability, which often rely on creating the right conditions. Furthermore, the managerial task refers to the managerial capabilities that enable organizations to respond to a turbulent environment. OF, in terms of the supply chain, is defined as the ability of supply chain managers to quickly convert their internal supply chains to adapt to changing supply-and-demand market conditions.
Ghomi et al. recognized flexibility as the critical source of CA for companies operating in uncertain markets. They also claimed that although various studies have explored the antecedents and consequences of this desirable attribute, few works have examined the interaction between suppliers and customer flexibility [44].

2.5. Supply Chain Resilience

Significant events and ongoing issues have occurred in recent years that have significantly impacted the performance of organizations [45,46]. Such events have raised awareness among academics and manufacturing industries of the need to minimize the potentially devastating effects of disruptions by constructing more resilient supply chains. On the other hand, customer expectations are gradually becoming stricter as customers demand products with a precise quantity, time, and place [3]. Meanwhile, making a trade-off between the costs of acquiring the operational capabilities needed to deal with disruptions and an acceptable level of resilience is one of the major concerns of operations managers [3].
Various disruptions, such as vehicle breakdowns, labor strikes, or even adverse weather conditions affect normal daily operations. Although all chains are exposed to these unforeseen events, the same disruptions can affect different supply chains depending on their levels of resilience [3]. However, the number of studies conducted on SCR from 1998 to 2021 indicated that SCR is a relatively unknown field of research (see Figure 4). In this chart, it can be seen that from 2016 to 2021, the number of articles grew to 3.6 times as many as there were five years ago.
Adobor and McMullen stated that disruptions in supply chains can have significant economic effects. Hence, risk management and vulnerabilities associated with supply chains have attracted increasing attention from researchers and policymakers [47]. Holling defined resilience as the capacity of a system to adapt to change and cope with surprises while maintaining the primary function and structure of the system, and as an important aspect of supply chain risk and vulnerability management [48]. According to Ivano et al., resilience in the organizational context is an organizational ability to survive in a turbulent environment. In response to the increase in disruptions caused by unpredictable events, resilience has become very important in supply chain perspectives [12,49]. Resilient companies are not vulnerable to supply chain disruptions and are more capable of absorbing shocks from supply chain disruptions. SCR allows organizations to deliver their products and services to customers even in critical situations [50]. Supply chain resilience indicates the potential to recover from an unintentional performance to an arranged performance by taking actions toward recovery or adaptation [51].
In another definition, SCR can be described as the ability of the supply chain to return to its original state or move to a new state or an even more desirable one after exposure to disruption. In other words, the ability of the supply chain to prepare for unforeseen events, respond to disturbances, recover from them by maintaining continuity of operations at the desired level of continuity, and monitor its structure and performance are what define SCR. [52]. Abeysekara et al. investigated the effects of SCR on firm performance and CA while considering the Sri Lankan garment industry as a case study [53]. As a result of BDA capabilities, the supply chain became more resilient [54]. A safe way to overcome a crisis can be derived from emancipatory and innovative crisis management. Organizations can empower their SCR by developing relationships in the internal environment and with suppliers [51].
Previous research emphasized the importance of competitive advantages and key factors that affect them. Table 1 summarizes efforts on this topic and studies related to this work to identify the research gap and novelty of the present study. As is evident, this was the first attempt to address the mediating roles of supply chain resilience and organizational flexibility in the relationship between data analytics capability and CA. In addition, the textile industry considered in this study has not been considered in previous studies.

3. Materials and Methods
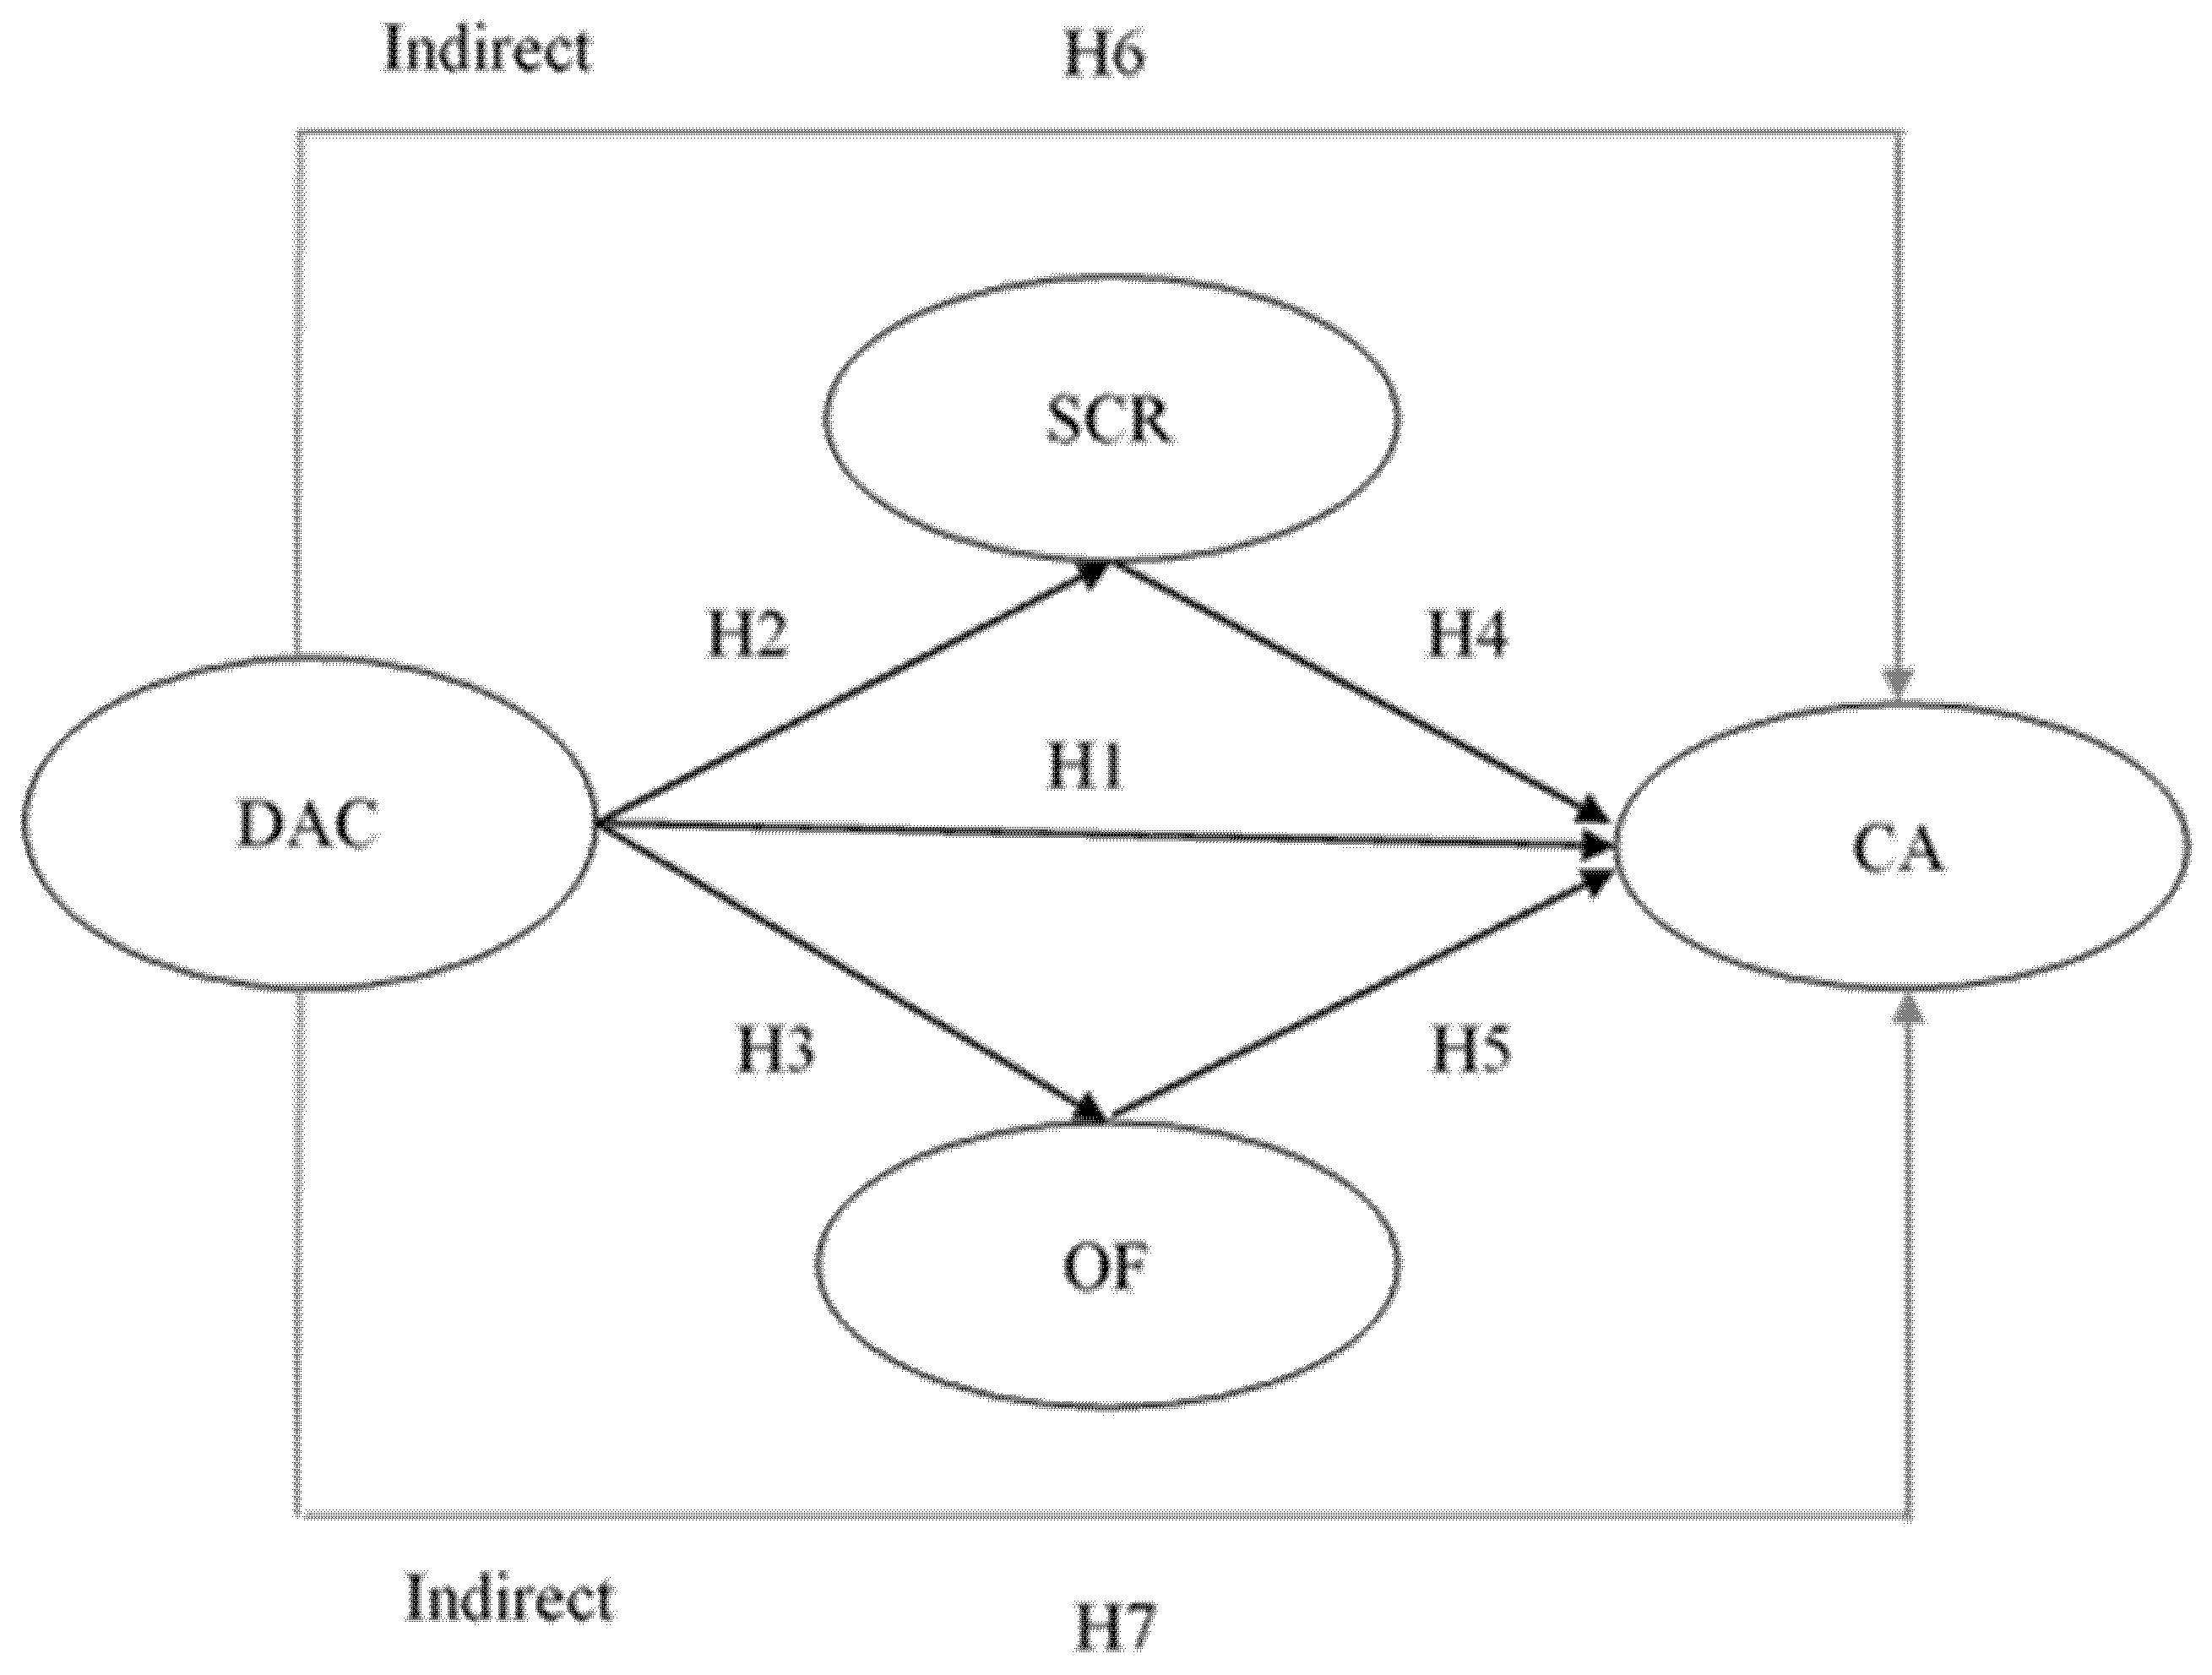
Due to the rapid change in business environments, data collection and analysis have become very important for managers and other decision makers. The popularity of this topic among management researchers is due to their desire to explore how a company’s resources and competencies can provide a CA in a highly uncertain environment. Srinivasan and Swink emphasized that organizations need to organize and utilize information effectively and efficiently when performing complex tasks [32]. To understand the degree of uncertainty, supply chain managers must collect data from customers and suppliers. Because supply chain disruptions can have a negative impact on financial results, supply chains must be resilient to reduce the risks of supply chain disruptions [57]. In this regard, CA refers to the degree of superiority of the organization over its competitors. Kwak et al. showed that the driving forces for improving CAs were cost, growth, reliability, quality, time to market, product introduction, product line width, order-filling rate, order information, and transportation [8]. LaValle et al. noted that organizations with a superior performance were five times more capable of data analysis than companies with a low performance [58]. Akter et al. showed that the ability to analyze big data had a positive effect on organizational performance [31]. In another study, Sheng et al. concluded that leading organizations increasingly used big data to improve their competitiveness [34].
As is evident in the existing literature, enterprise data analysis deals with organizational design, structures, and capabilities to meet information-processing needs. Organizational information-processing theory emphasizes that an organization needs to process information under increasing uncertainty to maintain a certain level of performance. Based on the literature review and the important role of data analysis in achieving CA, it is essential to understand these interactions while considering appropriate mediator variables such as SCR and organizational flexibility.
Hence, in this study, we addressed two main research gaps. First, we investigated the mediating role of SCR in the relationship between data analytics capability and CA. Second, we employed the proposed comprehensive construct and empirically validated it using survey data from the sleeping-goods manufacturing industry in Iran. We developed our conceptual model based on four main elements: DAC, CA, SCR, and OF. To this end, the conceptual model of the research is presented in Figure 5.

3.1. Hypotheses

In the following, the hypotheses of this study are developed along with the justifications from the prior literature.
Competitive advantage can be defined as any advantage a firm has over its competitors [22]. According to Chen et al., big data represents an incredible opportunity for achieving a CA [59]. In addition, analyzing the data allows an organization to understand its internal and external environment and analyze market behavior, customers, and competitors [39]. It might be possible for an organization to improve its performance with big data analytics if they are used prudently [60]. With this type of analysis, an organization can predict the future behavior of competitors and market demands. As a result, having this capability gives it a CA by being faster and more accurate than its competitors [39]. Following the preceding arguments, we proposed the following hypothesis for the Iranian textile industry:
Hypothesis 1 (H1).
DAC will have a positive effect on CA.
The capability of analysis as a combination of tools, techniques, and processes is understood to enable an organization to process, organize, visualize, and analyze data so that managers can make good decisions [32]. Moreover, information systems can be one of the factors that can reduce the negative effects of disorders in the supply chain [45]. SCR refers to how well a supply chain can cope with unpredictable events. A resilient supply chain will prevent undesirable conditions from developing in the chain. Taking advantage of this capability allows the supply chain to respond properly to risks and sudden events to avoid supply chain collapse. An organization with the capability of analyzing data has access to a huge amount of information that can be utilized to predict future conditions. In this context, information leads to an increase in resilience, and organizations can rely on this information to predict future events or prepare themselves for them [13]. Therefore, we argued that the more a firm is equipped with data analysis capabilities, the more resilient its supply chain will be. Thus, we hypothesized the following:
Hypothesis 2 (H2).
DAC will have a positive effect on SCR.
A higher flexibility of an organization allows it to better to respond to change. Flexible systems serve as connected indicators between the system and its foreign environment, and the ability to change and adapt as indicators of uncertainty can be considered [39]. OF has been introduced as a key driver for organizations to survive and succeed in volatile and unpredictable environments [40], and the ability to analyze the data describes the capabilities of organizations [30]. Therefore, it is expected that the greater the ability of an organization to analyze data, the more flexible it will be. Hence, we proposed the following hypothesis for the Iranian textile industry:
Hypothesis 3 (H3).
DAC will have a positive effect on OF.
The success of any organization depends on the supply chain’s resilience and ability to meet the challenges of the internal and external environment. However, to gain a CA, the supply chain should be agile, adaptable, and aligned [61]. In the same vein, we argued that an organization’s supply chain must be resilient to overcome uncertainties and enhance its CA. Abeysekara et al. argued that a firm’s CA in the apparel industry could be enhanced by increasing SCR [53]. In this way, it can be expected that firms in the textile industry can also gain a sustainable CA by focusing on SCR. Following the preceding arguments, we hypothesized that:
Hypothesis 4 (H4).
SCR will have a positive effect on CA.
A CA consists of agents or capabilities that will always enable a company to demonstrate better performance than its competitors [19]. Maury emphasized that CA is an economic value created by exploiting the company’s resources and capabilities [27]. Furthermore, CA is a combination of factors that enable a firm to participate in a highly successful competitive environment with other organizations and prevent the competitors from mimicking it easily [24]. On the other hand, flexibility is an organization’s dynamic capability to actively respond to a competitive environment, which may create a sustainable CA [55]. Thus, we proposed the following hypothesis for the Iranian textile industry:
Hypothesis 5 (H5).
OF will have a positive effect on CA.
The existence of resilience can serve as a prerequisite for creating CA. When organizations have a robust supply chain, the ability to analyze the data will have a stronger effect on the creation of CA [39]. In addition, organizations with the ability to analyze the data are far more flexible against environmental dynamics and can provide accurate responses to changes. This is also related to customers whose different needs change over time. In the case of access to information on environmental changes, organizations are flexible and can perform better than other competitors can [39]. As was evident in the literature review, data analytics capability, OF, and SCR have a positive effect on CA. However, we proposed the following hypotheses based on the mediating role of OF and SCR in the Iranian textile industry:
Hypothesis 6 (H6).
SCR mediates the effect of DAC on CA.
Hypothesis 7 (H7).
OF mediates the effect of DAC on CA.

3.2. The Importance of the Textile Industry in Iran

The textile industry is an ancient industry and is one of the most influential employment sectors in many countries [62]. The history of the textile industry in Iran is very long, and the remnants of the life of the people of Kashan, which is the oldest plain group in Iran, indicate the existence of stone and clay shops that shaped the mentality of the people of that time familiar with the textile industry. In Iran, 11 industries have been evaluated as the group of strategic industries; the textile industry has is ranked third in this classification, following the automotive and steel industries. It should be noted that this rank indicates its importance in the country’s strategic planning. On the other hand, the lack of attention to this industry in Iran has led to a significant recession. According to Iran Vision 2025, Iran’s textile industry should be ranked third in the region (Middle East) and 50th globally, relying on competitiveness, modernization, investment, technology development, and productivity enhancement. However, Iran is not among the top 50 countries in the world textile industry [63].
According to 2012 personal consumption data from the Statistics Center and a Thomson Reuters Institute report, the country’s annual consumption of various products in the textile, clothing, and leather industries is estimated at USD 20 billion. Moreover, according to the latest statistics from the Central Bank of Iran, the annual per capita consumption of urban household clothing by the Iranian people is USD 50,000, and the total consumption of the country’s current domestic market of clothing is estimated at more than USD 1 billion per year. It is evident that the global per capita consumption of textiles and clothing is much higher than the declared numbers. One of the reasons for the low level in Iran is the decline in people’s purchasing power and the economic recession. The top 10 global exporters of textiles, clothing, and footwear are China, Italy, Germany, India, the United States, Turkey, Bangladesh, Vietnam, Belgium, and France [64].
The sleeping-goods manufacturing industry is an essential field of the textile industry in Iran that includes about 8000 units in various parts of its production, distribution, and sales divisions. On the other hand, the production life with new methods in this sector in this country is very short, so it is not easy to provide accurate statistics for production units. However, the number of certified units in different sectors of the production of goods throughout Iran is about 2000 units. The rest are related to the service units of the subsidiary or are upstream of the sleeping-goods production industry [64]. There are approximately 22 large industrial units in Iran in this sector, and four companies with the brands Roya, Khoshkhab, Tanasai, and Royal have the highest market shares. The production capacity the Iranian sleeping-goods industry is such that the industry even competes with well-known manufacturers in Turkey that are known as competitors for Iranian products. The buyers of these products are home consumers and corporate consumers at hotels, guesthouses, accommodation centers, hospitals, sanatoriums, and rehabilitation centers.

3.3. Construct Measures

We developed the conceptual framework of this paper shown in Figure 5 while considering the set of hypotheses formulated in Section 3. This model was proposed based on the literature review, mainly the work by Dubey et al., who tested India’s manufacturing organizations [13].
After reviewing the extant literature on factors affecting CA in general, we explored this subject in the textile industry and proposed that the model mentioned above be tested using the manufacturing industry of sleeping goods, which is an important field of the textile industry in Iran. To evaluate a firm’s CA, we measured delivery, quality, reliability, inventive products, price/cost, and time to market [53].
This research was applied in terms of purpose, and descriptive research was applied in terms of data collection. The method of conducting surveys was a questionnaire. The statistical population of the research was the textile companies in Iran. Out of the production firms (22 large manufacturing companies), 4 companies with over 2000 employees were identified.
An established survey questionnaire and scales derived from literature (following Dubey et al.) were used to collect data on the hypothesized relationships between the considered constructs in the research [13]. The research questionnaire consisted of two main parts. The first part included general questions. The audience’s general population and demographic populations included gender, age, level of education, work experience, and job title. The second part comprised specific questions. This section contained 18 questions. Table 2 shows a summary description of the items used for measures. Consistent with the previous literature, we used a five-point Likert scale (with anchors 5 = very high and 1 = very low) for all measurement scales. A pilot survey of 30 respondents representing both the academic and professional fields was conducted prior to using the questionnaire for the final survey. Due to this study’s relatively small sample size, we sent our questionnaire online to all firms in the sample via e-mail to the selected respondents. Therefore, we obtained the questionnaire’s content validity, clarity, and readability prior to the final survey.

3.4. Study Population and Sample Selection

The population of this study comprised four well-known brands of sleeping goods, including Roya Corp, Khoshkhab, Tanasai, and Royal. We recognized 450 qualified persons to respond to the questionnaire, including chief executive officers (CEOs), general managers (GMs), deputy managers (DMs), planning managers and experts, logistic managers and experts, procurement and purchasing managers and experts, marketing managers, sales managers, and system managers at the time of data collection. To maintain the accuracy of responses, we selected only respondents with at least seven years of work experience, at least two years of management experience, or five years working as an expert, and educational background of at least a bachelor’s degree. According to the Cochran formula, the minimum sample size was equal to 207 persons for a significance level of 5%.
A survey questionnaire was developed for data collection (demonstrated in Appendix A in detail). Thirty respondents participated in the pilot survey that preceded the final survey. Based on the results of the pilot survey, we made some minor modifications to the questionnaire statements to improve their clarity and readability. Moreover, the final questionnaire was reviewed for clarity, readability, and content validity. Due to the COVID-19 pandemic, we sent 300 questionnaires via email and online and considered 207 complete questionnaires.

3.5. Methods of Data Analysis

We used structural equation modeling to develop the conceptual framework and measurement items for this study. Structural equation modeling is one of several advanced statistical methods that allow the study of the relationships between variables in a model.
To test the hypotheses of the proposed model, the partial least squares (PLS)–structural equation modeling (PLS-SEM) method was applied. An essential aspect of PLS software version 2.0 is its prediction-oriented approach, which enables researchers to assess the predictive accuracy of their hypotheses based on exogenous variables. It is the best tool for research analysis in which relationships between complex variables, small sample size, and data distribution are non-normal [70]. Thus, our two measurement metrics (validity and reliability) were evaluated as follows.
Indicator reliability was evaluated using the factor-loading method with a threshold greater than 0.4 [71]. The average variance extracted (AVE) assessed the convergent validity with a threshold value of 0.5 [72].
We used PLS-SEM with Smart PLS-2 software version 2.0 to test the research hypotheses in this study. PLS-SEM was chosen due to the relatively small sample size and complicated nature of the research model, which incorporated several mediating effects [73]. Based on our research, we proposed to observe an opinion or description strength of data analytics capability.

4. Data Analysis and Results

4.1. Evaluation of the Sample Profile

The period of this study was between October 2021 and January 2022. During this period, the first 207 usable responses out of 300 questionnaires sent were considered representative for the analysis. Table 3 presents the demographic information of the respondents. As can be seen, the majority of respondents were male (63.28%), which is common for top positions in the textile industry. Only 9.17% had less than 10 years of professional experience in management positions in the apparel industry. Additionally, more than 63% of respondents had a master’s degree or a Ph.D.

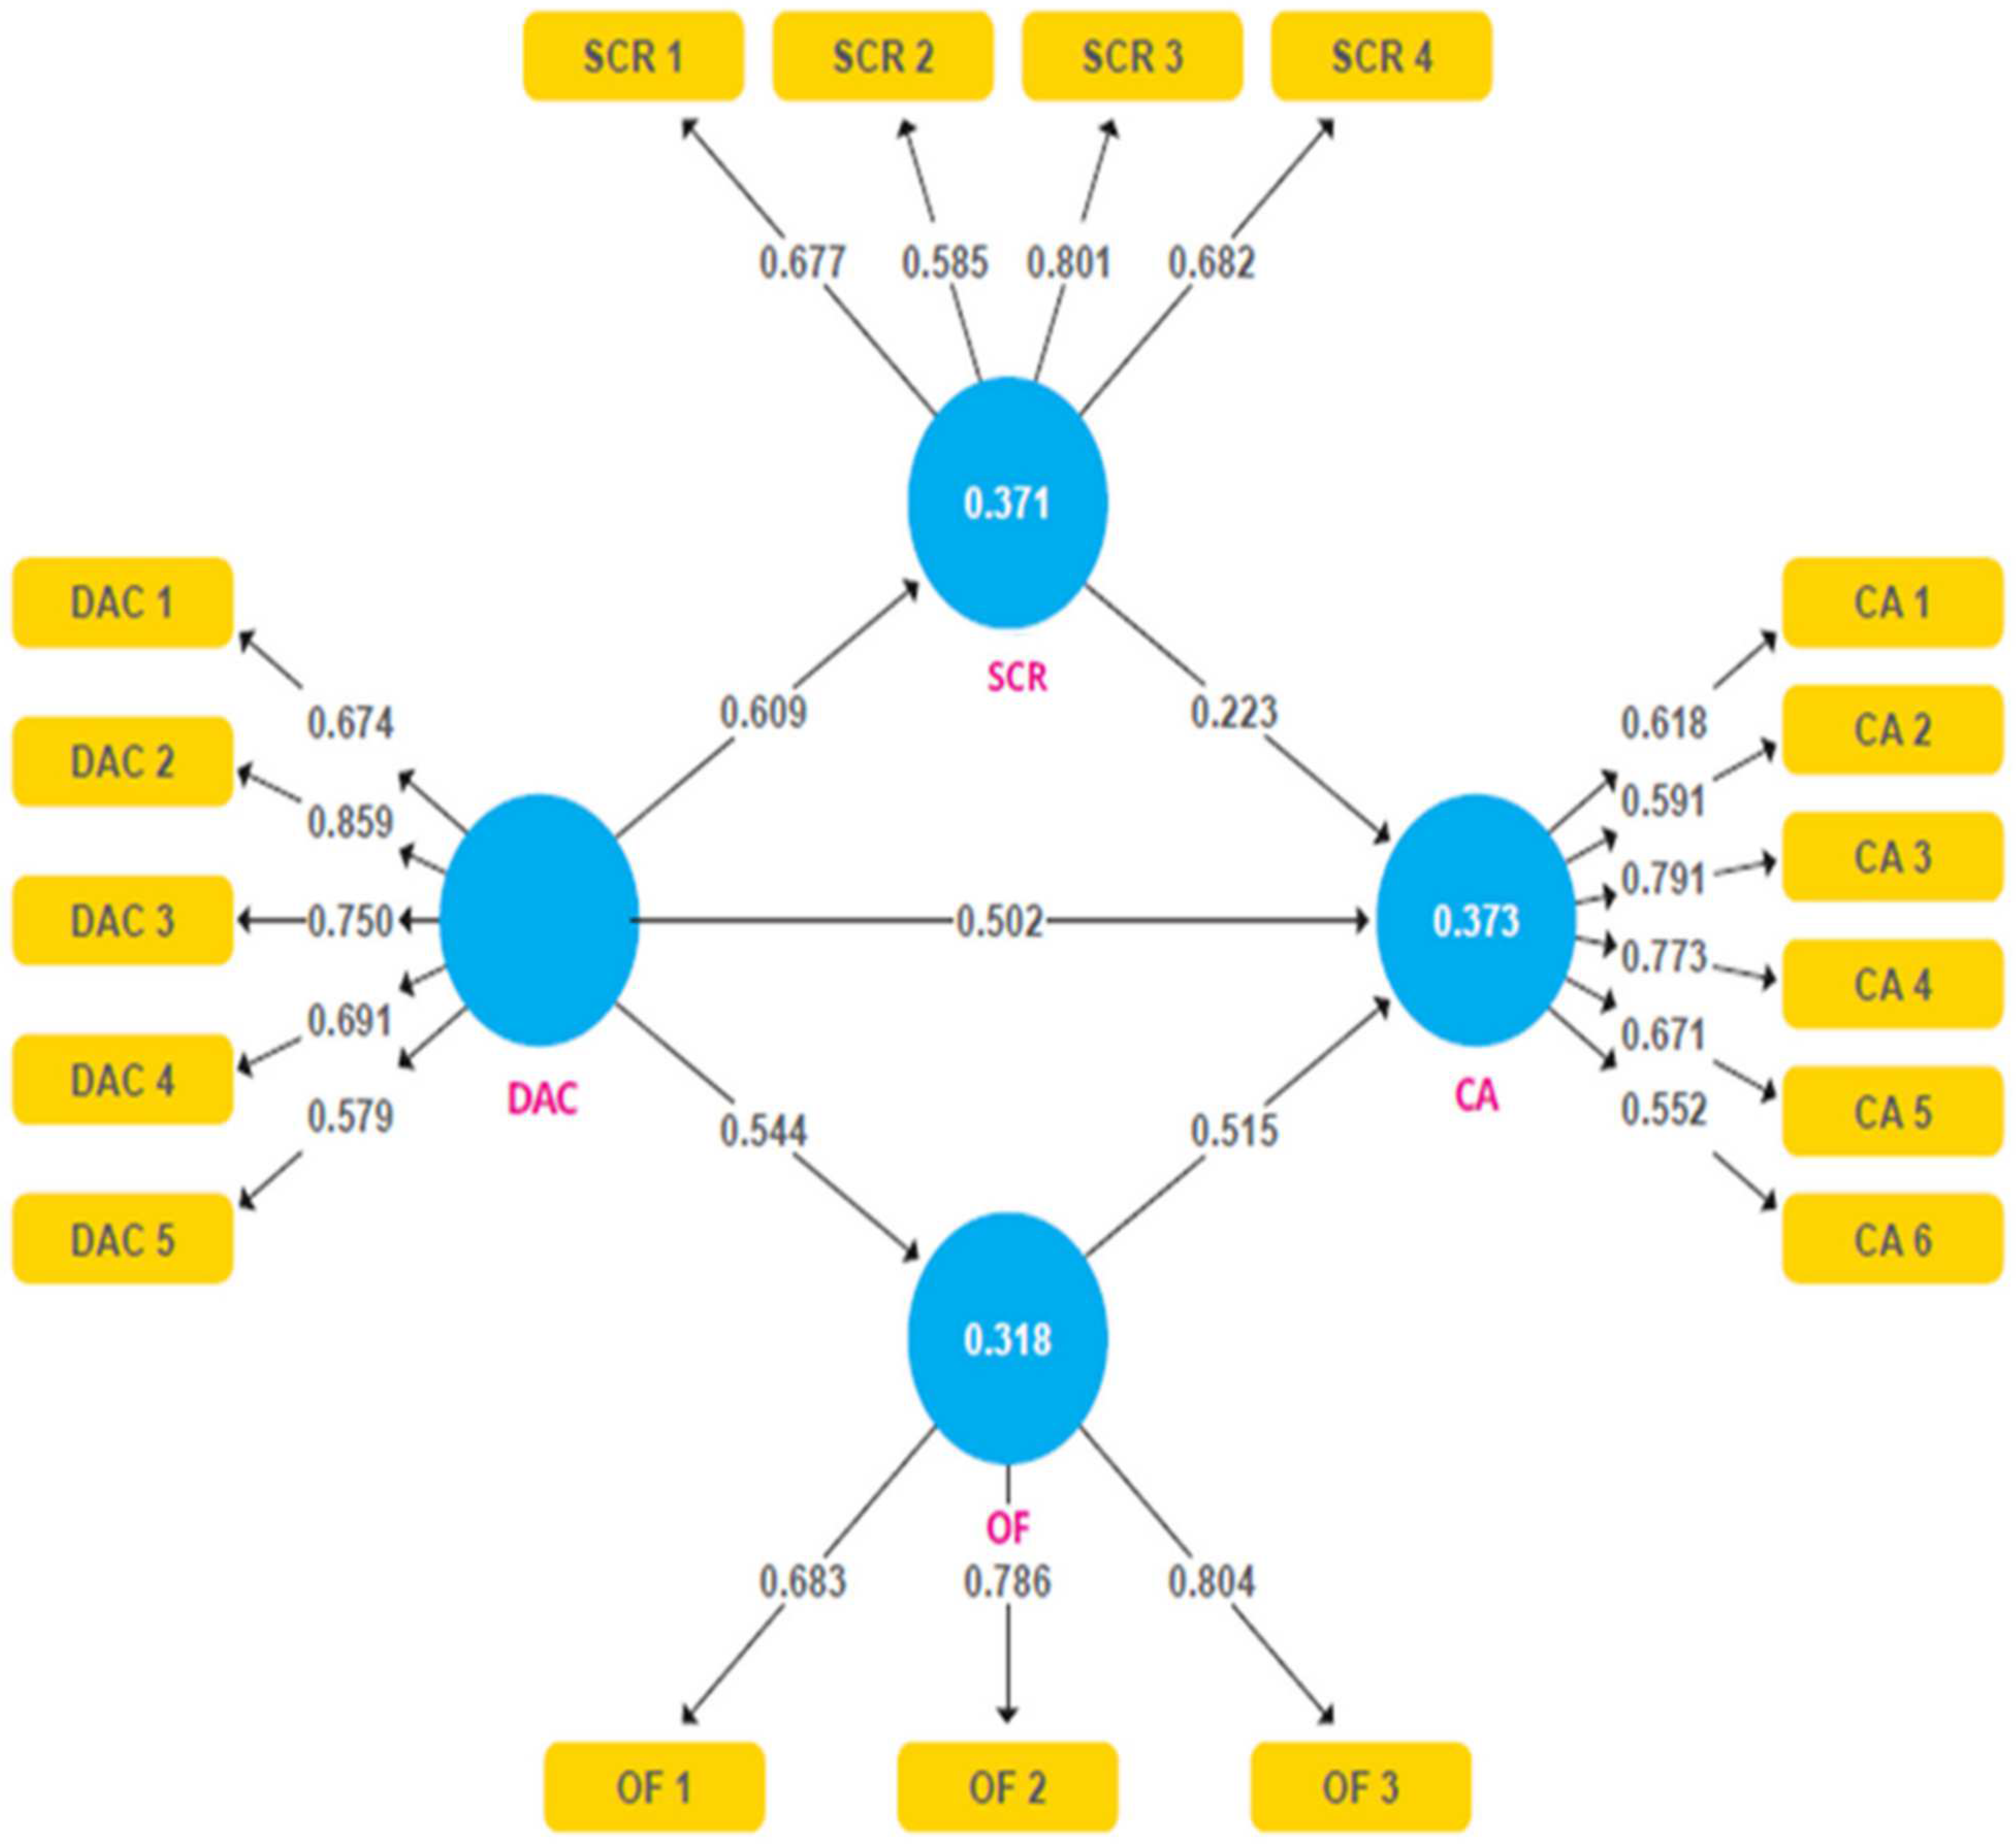
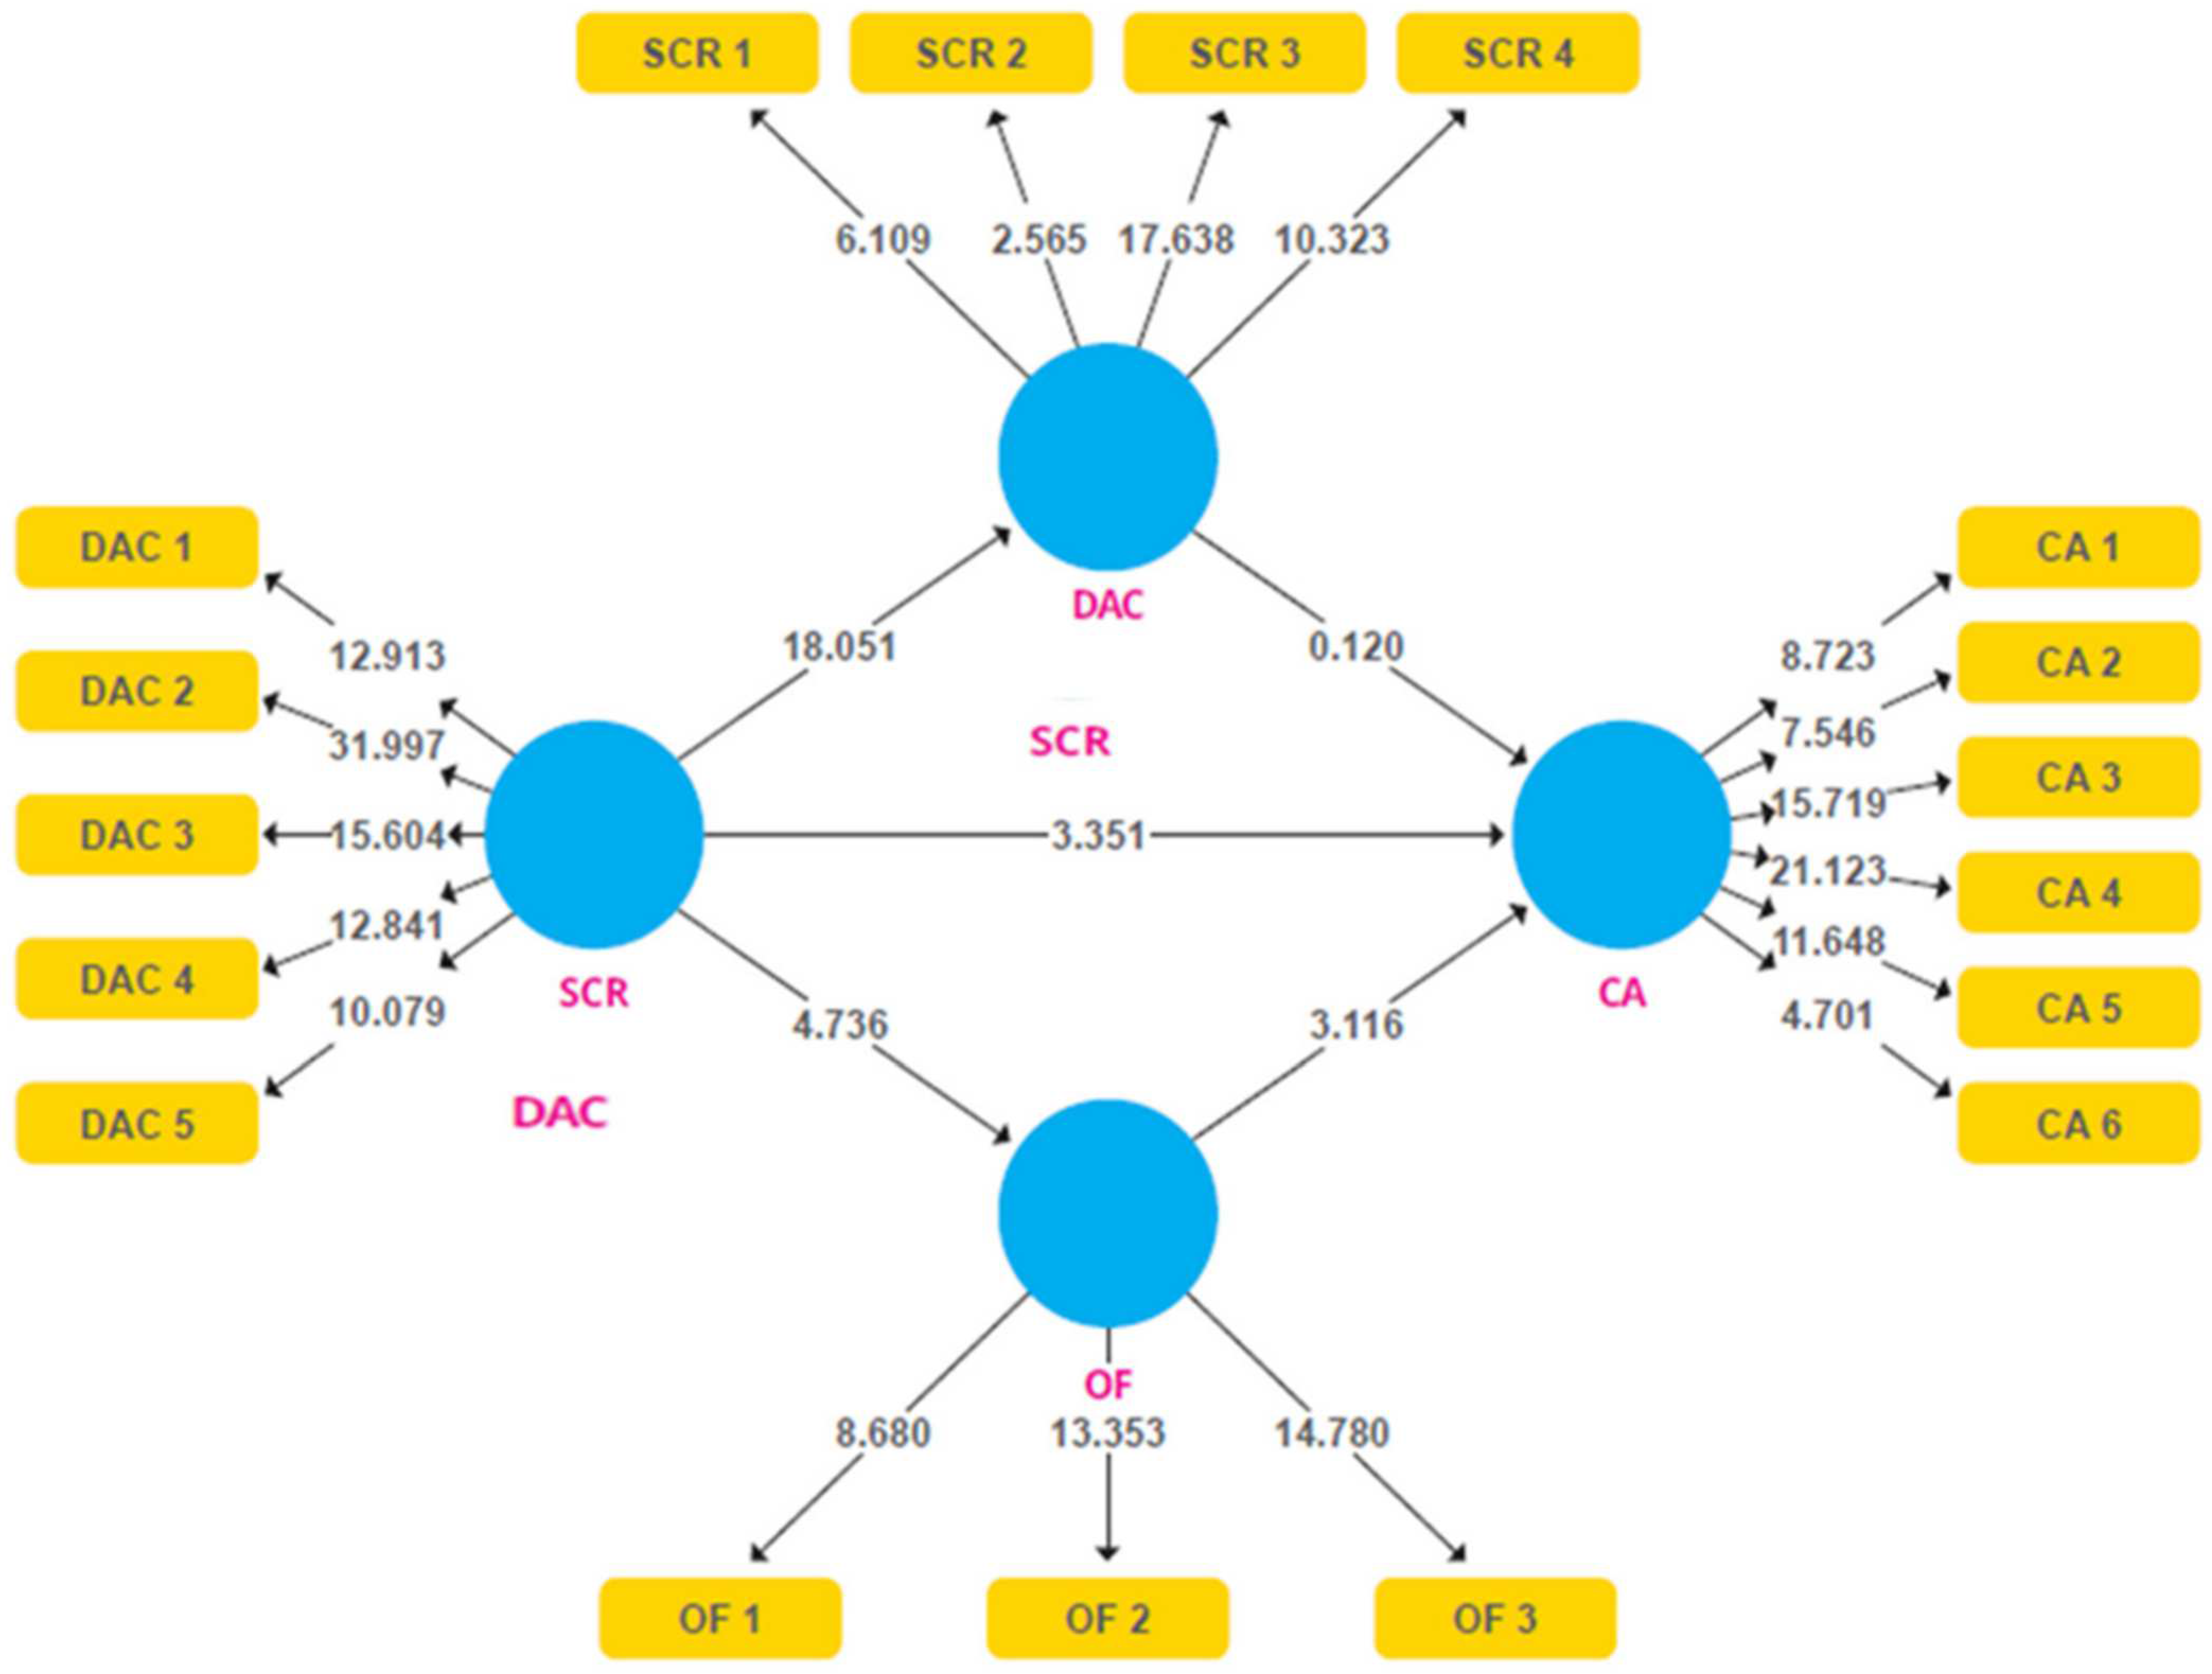
4.2. Measurement Model Assessment

Different assessment criteria were used to evaluate the measurement model. Reliability was assessed at the construct and item levels. At the construct level, we examined the Cronbach’s alpha and composite reliability values and established that their values were above the threshold of 0.70. Table 4 indicates that the Cronbach’s alpha (which ranged from 0.729 to 0.758) and composite reliability scores (which ranged from 0.718 to 0.838) were well above the commonly accepted cut-off value of 0.70 [39], which provided sufficient evidence of reliability.
Table 4 also shows that average variance extracted (AVE) values (which ranged from 0.512 to 0.577) exceeded the recommended cut-off value of 0.50 [72]. Thus, these results supported the convergent validity of the theoretical constructs in the model. As shown in Table 5, the square root of the AVE of each theoretical construct was greater than the inter-construct correlations, thus confirming the discriminant validity [72]. Therefore, the measurement model reflected the sound construct reliability and validity necessary for testing the structural model.
Finally, the CR should be more significant than the AVE (CR > AVE). In this case, the convergent validity condition existed. As shown in Table 4, all three conditions were confirmed, and we thus concluded that the questionnaire had convergent validity.

4.3. Structural Model Assessment

The structural model from the PLS analysis is summarized in Figure 6 and Table 4, in which the explained coefficient of determination (R2), Student’s t-test statistics, and the standardized path coefficients are presented after successful confirmation of the reliability and validity of the measurement model. The findings showed a standardized path coefficient of 0.60 from DAC to SCR, 0.544 from DAC to OF, 0.502 from DAC to CA, 0.515 from OF to CA, and 0.223 from SCR to CA. All these coefficients except that for SCR to CA were significant.
In addition, using the coefficient of determination, the study also estimated the overall variance explained by the model. The coefficient of determination index indicates the effect of an independent variable on a dependent variable. The R2 values for the latent constructs were calculated, and the supply chain resilience was 0.371, the flexibility in the supply chain was 0.318, and the competitive advantage was 0.373.
Following that, the predictive relevance (Q2) value estimate procedure was used to determine the predictive relevance of the inner model. If this indicator is positive, it is desirable [38]. The value of Q2 for the supply chain resilience was 0.270; for flexibility in the supply chain, it was 0.277; and for competitive advantage, it was 0.269, which was positive and at the desired level. Accordingly, the model’s predictive power was desired in the case of variables (Table 5). Table 5 also shows that the correlations for each construct were below the unity threshold level, which justified the discriminant validity of the research constructs.
In the least-squares method, prior to testing the hypotheses, it is necessary to examine the fitting of the measurement models, the structural model, and the overall model of the research [74]. We tested the goodness of fit (GOF) using the index introduced by Tennen House et al., as given in Equation (1) [70]:
GOF = communality ¯ × R 2 ¯  
The value of this indicator is between zero and one. The higher the value of this indicator, the greater the fitness. According to the GOF criteria, the fit index of the sample model was 0.434, which was of great size. Therefore, based on these findings, we concluded that the model examined in the sample had a suitable fitting.
GOF = communality ¯ × R 2 ¯ = 0.534 × 0.354 = 0.434

4.4. Hypotheses Testing

In this section, a summary of the tests of the present research hypotheses are given in detail while considering the results provided in Table 4, Table 5, Table 6 and Figure 7.
The first outcome was that data analytics capability (DAC) positively affected CA (H1). The significance statistic between the DAC and the organization’s CA was 3.531, which was greater than the value of 1.96. This result indicated that the influence of the analysis of data on the organization’s CA was significant at the confidence level (95%). Moreover, the path coefficient (β) between the two variables was 0.502, and the positive effect of data analysis indicated the organization’s CA. This study supported previous researchers [14,31,36,37,38,39] who stated that DAC impacted CA in companies. This meant that the ability to analyze the data had a positive and significant effect on an organization’s CA.
Data analytics capability also positively affected SCR (H2). The significance statistic between the DAC and the SCR was 18.051, which was greater than the value of 1.96. This result showed that the influence of the analysis of data on the resilience of an organization was significant at the confidence level (95%). The path coefficient (β) between the two variables was 0.609, and the positive effect of data analysis indicated an organization’s resilience. Previous studies [13,39] also found that DAC positively affected SCR. This meant that the ability to analyze the data had a positive and significant effect on SCR.
The result of the third hypothesis test (H3) demonstrated that data analytics capability had a positive effect on OF. The significance statistic between the DAC and the supply chain flexibility was 4.736, which was greater than the value of 1.96. This indicated that the influence of the analysis of data on the organizational flexibility was significant at the confidence level (95%). The path coefficient (β) between the two variables was 0.544. This meant that the ability to analyze the data had a positive and significant effect on the supply chain’s flexibility, as shown in previous studies [13,39].
As evident in Table 6, the SCR did not have a direct and statistically significant relationship with the CA at the confidence level of 95% (t-value = 0.12). The path coefficient (β) between the two variables was 0.223. In other words, changing a unit in the SCR would increase the organization’s CA by 0.223. This showed the positive but poor (not significant) effect of a supply chain’s resilience on an organization’s CA.
Table 6 also shows significant positive effects of OF on CA (H5) at the confidence level of 95% (T-value = 3.116). The path coefficient (β) between the two variables was 0.515, indicating the positive effects of OF on the CA. This study supported previous researchers [39,55,56] who stated that OF affected CA in companies.
Mediation analysis of the last two hypotheses showed that data analytics capability positively affected CA, which was mediated by a positive effect on SCR (H6), as accepted in [39]. The result indicated that the path coefficient for the direct impact of data analysis on the organization’s CA was 0.502. However, the moderator effect verified that the total impact was equal to 0.637 (because it was greater than 0.5). The VAF index was also calculated (0.211). According to the VAF coefficient, the organization’s CA through SCR explained 21% of the total effect of data analysis.
In addition, data analytics capability had a positive impact on CA and was mediated by a positive effect on OF (H7). This study supported previous researchers [39]. The path coefficient for the direct effect of data analysis on the organization’s CA was 0.502. The total effect was equal to 0.782. The VAF index was also calculated and was 0.35. According to the VAF coefficient, 35% of the full effect of data analysis was explained by the organization’s CA through supply chain flexibility.

5. Conclusions and Discussion

5.1. Theoretical Implications

Competitive advantage is an attribute that enables a company to outperform its competitors. This allows a company to achieve superior margins compared to its competitors and creates value for the company and its shareholders. In addition, CA must be difficult to duplicate. The aim of this study was to investigate the effects of data analytics capability on the CA in the Iranian textile industry concerning the mediating role of SCR and organization flexibility. The primary research gap that the study aimed to fill was the insufficient conceptualization and unavailability of a comprehensive measure of SCR, data analytics capability, and organizational flexibility. These developments were based on a strong theoretical underpinning. Furthermore, as was evident in the related literature, little attention has been paid to analyzing the mediation effect of SCR and OF toward CA in the textile industry.
Our study extended the literature on SCR comprehensively. It investigated the mediation effects of SCR and OF on the relationship between data analytics capability and CA. Although some scholars (e.g., [53]) investigated the relationship between data analytics capability and CA, there was a lack of studies on the direct and intermediate effects of SCR and OF as two vital new features in the manufacturing industry.

5.2. Managerial Implications

The results of this study proved that data analytics capability, organizational flexibility, and supply chain resilience significantly affect the performance and competitive advantages of companies in the textile industry. Accordingly, companies in the textile industry should be able to apply new data analysis methods, increase their flexibility, and increase SCR. To this end, we recommend that top managers to use new Enterprise Resource and Demand Planning packages to improve organizational flexibility and supply chain resilience simultaneously. We also suggest that companies develop their innovation capabilities to survive and facilitate growth. Developing a resilient supply chain can also develop other skills to mitigate supply chain risks and improve business performance.
In addition, manufacturing managers should monitor their firms’ supply chain environments and take steps toward flexibility and adaptability to better identify threats and make changes accordingly. Previous studies provided similar suggestions. For instance, Kamalahmadi and Parast recommended that managers who are directly involved in the supply chain and daily operations have an adequate understanding of the business and its changing patterns to adapt and create a resilient environment in the organization [75].
Based on the results, we recommend that responsible managers improve their companies’ flexible capabilities and capacity reserves by considering internal and external risk factors to which they are exposed within their supply chains; e.g., price hikes in raw materials, political upheavals, regulations, etc. Furthermore, additional resources can be allocated to integrate operational management functions and excellent responsiveness.
Employees, groups, suppliers, competitors, and customers play crucial roles in resilience and flexibility, among other factors. Therefore, the relevant managers are advised to pay special attention to them. They should build closer vertical relationships with key customers, internal channels across processes, and suppliers. Additionally, horizontal collaboration with competitors and non-competitors, which are essential to identifying their strengths, weaknesses, and opportunities, can improve organizational resilience and flexibility.

5.3. Limitations and Future Research

Despite the contributions of the present study, this work had some limitations that future research should address. The Iranian textile industry was considered the scope of this research, and companies that manufacture sleep products were considered the research community. Similar to many other studies, this work used perceptual data. However, the use of auditing techniques can indicate bias and ensure that the actual data is consistent with respondents’ perceptions. We tackled this issue by instructing respondents to consult other experts within their organizations that might be better equipped to answer specific questions. Although this study relied on qualified respondents, sampling multiple respondents within a single firm would be useful to check inter-rater validity and improve internal validity.
Additionally, future research may attempt to validate and use the same conceptual model using a large sample in an expanded population of firms beyond the sleeping-goods sector. Moreover, although this study investigated the effects of three important variables on CA, it is important that future research discuss the direct and mediating effect of other key factors such as agility on CA. Finally, the present study had some limitations, particularly in relation to the population and the variables involved. We suggest that further studies on the current topic involve variables such as management of supply chain risks and customer relationships to cover more stakeholders and functions involved in the supply chain network.

Author Contributions

Conceptualization, S.M.H.H. and S.S.S.; Data curation, G.R.; Methodology, G.R.; Project administration, S.M.H.H.; Software, G.R.; Supervision, S.M.H.H. and S.S.S.; Validation, G.R.; Writing—original draft, S.M.H.H.; Writing—review & editing, S.S.S. All authors have read and agreed to the published version of the manuscript.

Funding

This research received no external funding.

Institutional Review Board Statement

Not applicable.

Informed Consent Statement

Informed consent was obtained from all subjects involved in the study.

Data Availability Statement

All data are included in this manuscript.

Conflicts of Interest

The authors declare no conflict of interest.

Appendix A. Survey Questionnaire

Please indicate the extent of your agreement or disagreement. (From 1 “very low” to 5 “very high”).
Supply Chain Resilience
  • SCR1: Our organization can easily recover the flow of material.
  • SCR2: It is quick to retrieve the normal functioning of our organization.
  • SCR3: The supply chain quickly returns to its original state.
  • SCR4: Our organization can quickly cope with the disorders.
Organizational Flexibility
  • OF1: We can quickly change organizational structure to respond to supply chain disorders.
  • OF2: Our organization can respond efficiently to supply chain disorders.
  • OF3: Our organization is more flexible than our competitors in changing organizational structure are.
Competitive Advantage
  • CA1: Our customers are satisfied with our product quality.
  • CA2: We offer our customers the value.
  • CA3: We hand over what our customers want at the right time.
  • CA4: Growth of our market share is significant compared to our customers.
  • CA5: We are capable of attracting new customers.
  • CA6: We have reached our financial goals.
Data Analytics Capability
  • DAC1: We use advanced tools and analytical techniques (for example, simulation, optimization, regression) to make decisions.
  • DAC2: Use the extracted data from different data sources to decide.
  • DAC3: We use the data visualization technique (for example, dashboard) to assist users or decision-makers in understanding complex information.
  • DAC4: Our system shows the information that is useful to accomplish recognition.
  • DAC5: We have connected applications or data with the manager’s communication devices.

References

  1. Hooshmandi Maher, M.; Amiri, M.; Olfat, L. An Integrated Approach for Supplier Selection in a Supply Chain: IT Capabilities Approach. J. Ind. Manag. Perspect. 2013, 2, 91–115. [Google Scholar]
  2. Ramezanian, M.; Basaghzadeh, N. The effect of organizational culture and ability to attract employees to the successful implementation of IS in Gilan province production companies. Inf. Technol. Manag. 2013, 3, 41–68. [Google Scholar]
  3. Li, D.Y.; Liu, J. Dynamic capabilities, environmental dynamism, and competitive advantage: Evidence from China. J. Bus. Res. 2014, 67, 2793–2799. [Google Scholar] [CrossRef]
  4. Akbari, M.; Esmaeilzadeh, M. Role of Dynamic Capabilities in Creating Competitive Advantage. Bus. Manag. Landsc. 2013, 12, 107–122. [Google Scholar]
  5. Mahdi, O.R.; Almsafir, M.K. The role of strategic leadership in building sustainable competitive advantage in the academic environment. Procedia-Soc. Behav. Sci. 2014, 129, 289–296. [Google Scholar] [CrossRef] [Green Version]
  6. Kim, M.; Song, J.; Triche, J. Toward an integrated framework for innovation in service: A resource-based view and dynamic capabilities approach. Inf. Syst. Front. 2015, 17, 533–546. [Google Scholar] [CrossRef]
  7. Ambrosini, V.; Bowman, C.; Collier, N. Dynamic capabilities: An exploration of how firms renew their resource base. Br. J. Manag. 2009, 20, S9–S24. [Google Scholar] [CrossRef]
  8. Kwak, D.W.; Seo, Y.J.; Mason, R. Investigating the relationship between supply chain innovation, risk management capabilities and competitive advantage in global supply chains. Int. J. Oper. Prod. Manag. 2018, 38, 2–21. [Google Scholar] [CrossRef]
  9. Chen, J.; Sohal, A.S.; Prajogo, D.I. Supply chain operational risk mitigation: A collaborative approach. Int. J. Prod. Res. 2013, 51, 2186–2199. [Google Scholar] [CrossRef]
  10. Brusset, X.; Bertrand, J.L. Hedging weather risk and coordinating supply chains. J. Oper. Manag. 2018, 64, 41–52. [Google Scholar] [CrossRef]
  11. Dolgui, A.; Ivanov, D.; Sokolov, B. Ripple effect in the supply chain: An analysis and recent literature. Int. J. Prod. Res. 2018, 56, 414–430. [Google Scholar] [CrossRef] [Green Version]
  12. Ivanov, D.; Sokolov, B.; Dolgui, A. The Ripple effect in supply chains: Trade-off ‘efficiency-flexibility-resilience’in disruption management. Int. J. Prod. Res. 2014, 52, 2154–2172. [Google Scholar] [CrossRef]
  13. Dubey, R.; Gunasekaran, A.; Childe, S.J. Big data analytics capability in supply chain agility: The moderating effect of organizational flexibility. Manag. Decis. 2018, 57, 1–38. [Google Scholar] [CrossRef] [Green Version]
  14. Fan, H.; Li, G.; Sun, H.; Cheng, T.C.E. An information processing perspective on supply chain risk management: Antecedents, mechanism, and consequences. Int. J. Prod. Econ. 2017, 185, 63–75. [Google Scholar] [CrossRef]
  15. Alilou, P.; Saeednia, H.R.; Badi Zadeh, A. Studying the Effective Factors in Brand Value Creation from the Perspective of Customers, Organizations and Stakeholders (Case study: Iranian Textile Industry). J. Syst. Manag. 2021, 7, 23–47. [Google Scholar] [CrossRef]
  16. Bleoca, L. Knowledge Management, Innovation and Intellectual Capital for Corporate Value in the United States. J. Bus. Econ. 2014, 5, 1614–1636. [Google Scholar] [CrossRef]
  17. David, F.; David, F.R. Strategic Management: A Competitive Advantage Approach, Concepts and Cases; Pearson: London, UK, 2016. [Google Scholar]
  18. Shan, S.; Luo, Y.; Zhou, Y.; Wei, Y. Big data analysis adaptation and enterprises’ competitive advantages: The perspective of dynamic capability and resource-based theories. Technol. Anal. Strateg. Manag. 2019, 31, 406–420. [Google Scholar] [CrossRef]
  19. Chiu, C.N.; Yang, C.L. Competitive advantage and simultaneous mutual influences between information technology adoption and service innovation: Moderating effects of environmental factors. Struct. Chang. Econ. Dyn. 2019, 49, 192–205. [Google Scholar] [CrossRef]
  20. Ge, B.; Yang, Y.; Jiang, D.; Gao, Y.; Du, X.; Zhou, T. An empirical study on green innovation strategy and sustainable competitive advantages: Path and boundary. Sustainability 2018, 10, 3631. [Google Scholar] [CrossRef] [Green Version]
  21. Davis, D.F.; Golicic, S.L. Gaining comparative advantage in supply chain relationships: The mediating role of market-oriented IT competence. J. Acad. Mark. Sci. 2010, 38, 56–70. [Google Scholar] [CrossRef]
  22. Porter, M.E. Competitive Advantage: Creating and Sustaining Superior Performance; Free Press: New York, NY, USA, 1985. [Google Scholar]
  23. Peteraf, M.A. The cornerstones of competitive advantage: A resource-based view. Strateg. Manag. J. 1993, 14, 179–191. [Google Scholar] [CrossRef]
  24. Barney, J. Competitive advantage. J. Manag. 1991, 17, 99–120. [Google Scholar]
  25. Aydiner, A.S.; Tatoglu, E.; Bayraktar, E.; Zaim, S.; Delen, D. Business analytics and firm performance: The mediating role of business process performance. J. Bus. Res. 2019, 96, 228–237. [Google Scholar] [CrossRef]
  26. Schilke, O. On the contingent value of dynamic capabilities for competitive advantage: The nonlinear moderating effect of environmental dynamism. Strateg. Manag. J. 2014, 35, 179–203. [Google Scholar] [CrossRef]
  27. Maury, B. Sustainable competitive advantage and profitability persistence: Sources versus outcomes for assessing advantage. J. Bus. Res. 2018, 84, 100–113. [Google Scholar] [CrossRef]
  28. Annarelli, A.; Battistella, C.; Nonino, F. Competitive advantage implication of different Product Service System business models: Consequences of ‘not-replicable’capabilities. J. Clean. Prod. 2020, 247, 119–121. [Google Scholar] [CrossRef]
  29. Afraz, M.F.; Bhatti, S.H.; Ferraris, A.; Couturier, J. The impact of supply chain innovation on competitive advantage in the construction industry: Evidence from a moderated multi-mediation model. Technol. Forecast. Soc. Change 2021, 162, 120370. [Google Scholar] [CrossRef]
  30. Acharya, A.; Singh, S.K.; Pereira, V.; Singh, P. Big data, knowledge co-creation and decision making in fashion industry. Int. J. Inf. Manag. 2018, 42, 90–101. [Google Scholar] [CrossRef]
  31. Akter, S.; Gunasekaran, A.; Wamba, S.F.; Babu, M.M.; Hani, U. Reshaping competitive advantages with analytics capabilities in service systems. Technol. Forecast. Soc. Change 2020, 159, 120180. [Google Scholar] [CrossRef]
  32. Srinivasan, R.; Swink, M. An investigation of visibility and flexibility as complements to supply chain analytics: An organizational information processing theory perspective. Prod. Oper. Manag. 2018, 27, 1849–1867. [Google Scholar] [CrossRef]
  33. Shah, T.R. Can big data analytics help organisations achieve sustainable competitive advantage? A developmental enquiry. Technol. Soc. 2022, 68, 101801. [Google Scholar] [CrossRef]
  34. Sheng, J.; Amankwah-Amoah, J.; Wang, X. A multidisciplinary perspective of big data in management research. Int. J. Prod. Econ. 2017, 191, 97–112. [Google Scholar] [CrossRef]
  35. Gunasekaran, A.; Papadopoulos, T.; Dubey, R.; Wamba, S.F.; Childe, S.J.; Hazen, B.; Akter, S. Big data and predictive analytics for supply chain and organizational performance. J. Bus. Res. 2017, 70, 308–317. [Google Scholar] [CrossRef]
  36. O’Neill, M.; Brabazon, A. Business analytics capability, organisational value and competitive advantage. J. Bus. Anal. 2019, 2, 160–173. [Google Scholar] [CrossRef]
  37. Mikalef, P.; Krogstie, J.; Pappas, I.O.; Pavlou, P. Exploring the relationship between big data analytics capability and competitive performance: The mediating roles of dynamic and operational capabilities. Inf. Manag. 2020, 57, 103169. [Google Scholar] [CrossRef]
  38. Dahiya, R.; Le, S.; Ring, J.K.; Watson, K. Big data analytics and competitive advantage: The strategic role of firm-specific knowledge. J. Strategy Manag. 2021, 15, 1–34. [Google Scholar] [CrossRef]
  39. Yu, W.; Zhao, G.; Liu, Q.; Song, Y. Role of big data analytics capability in developing integrated hospital supply chains and operational flexibility: An organizational information processing theory perspective. Technol. Forecast. Soc. Change 2021, 163, 120417. [Google Scholar] [CrossRef]
  40. Sopelana, A.; Kunc, M.; Hernáez, O.R. Towards a dynamic model of organisational flexibility. Syst. Pract. Action Res. 2014, 27, 165–183. [Google Scholar] [CrossRef]
  41. Chan, H.K.; Chan, F.T. Comparative study of adaptability and flexibility in distributed manufacturing supply chains. Decis. Support Syst. 2010, 48, 331–341. [Google Scholar] [CrossRef]
  42. Chuu, S.-J. Interactive group decision-making using a fuzzy linguistic approach for evaluating the flexibility in a supply chain. Eur. J. Oper. Res. 2011, 213, 279–289. [Google Scholar] [CrossRef]
  43. Volberda, H.W. Toward the flexible form: How to remain vital in hypercompetitive environments. Organ. Sci. 1996, 7, 359–374. [Google Scholar] [CrossRef]
  44. Ghomi, V.; Gligor, D.; Parast, M.; Shokoohyar, S.; Esfahani, M.G. Antecedents and consequences of customer flexibility: Establishing the link to firm competitive advantage. J. Retail. Consum. Serv. 2021, 62, 102609. [Google Scholar] [CrossRef]
  45. Carvalho, H.; Cruz-Machado, V. A supply chain resilience assessment model. In Proceedings of the 18th International Annual EurOMA Conference, Cambridge, UK, 3–6 July 2011; University of Cambridge: Cambridge, UK, 2011. [Google Scholar]
  46. Sawik, T. Selection of resilient supply portfolio under disruption risks. Omega 2013, 41, 259–269. [Google Scholar] [CrossRef]
  47. Adobor, H.; McMullen, R.S. Supply chain resilience: A dynamic and multidimensional approach. Int. J. Logist. Manag. 2018, 29, 1451–1471. [Google Scholar] [CrossRef]
  48. Holling, C.S. Resilience and stability of ecological systems. Annu. Rev. Ecol. Syst. 1973, 4, 1–23. [Google Scholar]
  49. Piya, S.; Shamsuzzoha, A.; Khadem, M. Analysis of supply chain resilience drivers in oil and gas industries during the COVID-19 pandemic using an integrated approach. Appl. Soft Comput. 2022, 121, 108756. [Google Scholar] [CrossRef]
  50. Ambulkar, S.; Blackhurst, J.; Grawe, S. Firm’s resilience to supply chain disruptions: Scale development and empirical examination. J. Oper. Manag. 2015, 33, 111–122. [Google Scholar]
  51. Ozdemir, D.; Sharma, M.; Dhir, A.; Daim, T. Supply chain resilience during the COVID-19 pandemic. Technol. Soc. 2022, 68, 101847. [Google Scholar] [CrossRef]
  52. Brandon-Jones, E.; Squire, B.; Autry, C.W.; Petersen, K.J. A contingent resource-based perspective of supply chain resilience and robustness. J. Supply Chain Manag. 2014, 50, 55–73. [Google Scholar] [CrossRef] [Green Version]
  53. Abeysekara, N.; Wang, H.; Kuruppuarachchi, D. Effect of supply-chain resilience on firm performance and competitive advantage: A study of the Sri Lankan apparel industry. Bus. Process Manag. J. 2019, 25, 1673–1695. [Google Scholar] [CrossRef]
  54. Bahrami, M.; Shokouhyar, S.; Seifian, A. Big data analytics capability and supply chain performance: The mediating roles of supply chain resilience and innovation. Mod. Supply Chain Res. Appl. 2022, 4, 62–84. [Google Scholar] [CrossRef]
  55. Tarigan, Z.J.H.; Siagian, H.; Jie, F. Impact of internal integration, supply chain partnership, supply chain agility, and supply chain resilience on sustainable advantage. Sustainability 2021, 13, 5460. [Google Scholar] [CrossRef]
  56. Jin, Y.; Vonderembse, M.; Ragu-Nathan, T.S.; Smith, J.T. Exploring relationships among IT-enabled sharing capability, supply chain flexibility, and competitive performance. Int. J. Prod. Econ. 2014, 153, 24–34. [Google Scholar] [CrossRef]
  57. Brusset, X.; Teller, C. Supply chain capabilities, risks, and resilience. Int. J. Prod. Econ. 2017, 184, 59–68. [Google Scholar] [CrossRef]
  58. LaValle, S.; Lesser, E.; Shockley, R.; Hopkins, M.S.; Kruschwitz, N. Big data, analytics and the path from insights to value. MIT Sloan Manag. Rev. 2011, 52, 21–32. [Google Scholar]
  59. Chen, H.; Chiang, R.H.; Storey, V.C. Business intelligence and analytics: From big data to big impact. MIS Q. 2012, 1, 1165–1188. [Google Scholar] [CrossRef]
  60. Raffoni, A.; Visani, F.; Bartolini, M.; Silvi, R. Business performance analytics: Exploring the potential for performance management systems. Prod. Plan. Control 2018, 29, 51–67. [Google Scholar] [CrossRef]
  61. Lee, H.L. The triple-A supply chain. Harv. Bus. Rev. 2004, 82, 102–113. [Google Scholar]
  62. Ebrahimi, M.; Rasouliyan, M.; Panahiyan, H.; Ghodrati, H. Designing the Evaluation Model for Sustainable Technology in the Textile Industry. J. Syst. Manag. 2021, 7, 143–161. [Google Scholar] [CrossRef]
  63. Shokouhi, M.; Morovati, A. The textile industry in Iran from the past to today; challenges and opportunities. In Proceedings of the 2nd National Conference of Management Dynamics, Economic Development and Financial Management, Shiraz, Iran, 20 October 2014; Available online: https://civilica.com/doc/316813 (accessed on 25 June 2022).
  64. Strategic Documents: Industrial Development in Textile Industry in Iran. 2020. Available online: http://fanni.info/News/19040/ (accessed on 25 June 2022).
  65. Gligor, D.M.; Esmark, C.L.; Holcomb, M.C. Performance outcomes of supply chain agility: When should you be agile? J. Oper. Manag. 2015, 33, 71–82. [Google Scholar] [CrossRef]
  66. Sethi, A.K.; Sethi, S.P. Flexibility in manufacturing: A survey. Int. J. Flex. Manuf. Syst. 1990, 2, 289–328. [Google Scholar] [CrossRef]
  67. Upton, D.M. The management of manufacturing flexibility. Calif. Manag. Rev. 1994, 36, 2–89. [Google Scholar] [CrossRef]
  68. Tracey, M.; Vonderembse, M.A.; Lim, J.S. Manufacturing technology and strategy formulation: Keys to enhancing competitiveness and improving performance. J. Oper. Manag. 1999, 17, 411–428. [Google Scholar] [CrossRef]
  69. Vorhies, D.W.; Morgan, N.A. Benchmarking marketing capabilities for sustainable competitive advantage. J. Mark. 2005, 69, 80–94. [Google Scholar] [CrossRef]
  70. Tenenhaus, M.; Vinzi, V.E.; Chatelin, Y.M.; Lauro, C. PLS path modeling. Comput. Satistics Data Anal. 2005, 48, 159–205. [Google Scholar] [CrossRef]
  71. Hair, J.F., Jr.; Hult, G.T.M.; Ringle, C.M.; Sarstedt, M. A Primer on Partial Least Squares Structural Equation Modeling (PLS-SEM); Sage Publications: Thousand Oaks, CA, USA, 2021. [Google Scholar]
  72. Fornell, C.; Larcker, D.F. Evaluating structural equation models with unobservable variables and measurement error. J. Mark. Res. 1981, 18, 39–50. [Google Scholar] [CrossRef]
  73. Chin, W.W.; Marcolin, B.L.; Newsted, P.R. A partial least squares latent variable modeling approach for measuring interaction effects: Results from a Monte Carlo simulation study and an electronic-mail emotion/adoption study. Inf. Syst. Res. 2003, 14, 189–217. [Google Scholar] [CrossRef] [Green Version]
  74. Davari, A.; Rezazadeh, A. Structural Equation Modeling with PLS; Jahad University: Tehran, Iran, 2013; Volume 215, p. 224. [Google Scholar]
  75. Kamalahmadi, M.; Parast, M.M. A review of the literature on the principles of enterprise and supply chain resilience: Major findings and directions for future research. Int. J. Prod. Econ. 2016, 171, 116–133. [Google Scholar] [CrossRef]
Figure 1. Flow chart of research.
Sustainability 14 10444 g001
Figure 2. The published studies about the Competitive Advantage from 1998 to 2021.
Sustainability 14 10444 g002
Figure 3. The published studies in the field of data analytics capability from 1998 to 2021.
Sustainability 14 10444 g003
Figure 4. The published studies in the field of supply chain resilience from 1998 to 2021.
Sustainability 14 10444 g004
Figure 5. The research model.
Sustainability 14 10444 g005
Figure 6. Structural model.
Sustainability 14 10444 g006
Figure 7. Student’s t-tests showed a significant correlation between the hypotheses.
Sustainability 14 10444 g007
Table 1. Summary of research history.
Ref.Independent Variable(s)Dependent Variable(s)Mediator Variable(s)Analysis MethodSoftwareCase Study
[39]Big data analysisIntegrated hospital supply chains,
operational flexibility
----Structural equation modeling Chinese hospitals
[38]Big data analysisCompetitive advantageSpecial knowledge of the companyDescriptive method ----
[55]Internal integration,
supply chain participation,
supply chain agility,
supply chain flexibility
Sustainable advantage----Structural equation modelingSmartPLS version 3.3Manufacturing
companies
[37]Big data analytics capabilityCompetitive performanceDynamic and operational
capabilities
Structural equation modelingSmartPLS
version 3
Norwegian companies
[31]Data analytics capabilityCompetitive advantages----Structural equation modelingSmartPLS
version 3.0
Service organizations
[13]Data analytics capabilityCompetitive advantageOrganizational flexibility,
supply chain resilience
Structural equation modelingSmartPLS
Wrap PLS 5.0
Manufacturing
organizations in India
[36]Business analysis capabilityOrganizational value, competitive advantage----Structural equation modeling Working section
[53]Impact of supply chain
resilience
Firm performance, competitive advantage----Structural equation modelingSmartPLS
version 3.0
Sri Lankan garment
Industry
[18]Big data analysisCompetitive advantagesFlexibilityStructural equation modelingAMOS
version 24
Manufacturing
organizations in India
[56]Shared capabilitySupply chain flexibility,
competitive performance
----Structural equation modelingAMOSU.S. manufacturers
This studyData analytics capabilityCompetitive advantageOrganizational flexibility,
supply chain resilience
Structural equation modelingSmartPLS
version 2.0
Textile industry
Table 2. Descriptions of the items used for measures.
ConstructReferenceItemDescription
SCR[65]SCR1Quick recovery of the material flow
SCR2Quick recovery of the organization’s normal functioning
SCR3Fast return to the primary mode of supply chain
SCR4Fast coping with disorders
OF[66,67]OF1Changing organizational structure quickly to respond to disorders
OF2An effective response to supply chain disorders
OF3Flexibility in organizational structure changes
CA[68,69]CA1Customer satisfaction with product quality
CA2The value-to-client presentation
CA3Deliver the client’s demand at the right time
CA4Market share growth compared to customers
CA5Ability to attract new customers
CA6Achieving financial goals
DAC[31,32]DAC1Use advanced tools and analytical techniques for decision making
DAC2Make decisions based on data extracted from different sources
DAC3Use the data visualization technique to assist users or decision makers in understanding complex information
DAC4Useful information to carry out the required recognition
DAC5Connecting applications or data with the manager’s communication devices
Table 3. Profiles of the respondents from the organizations.
Respondent’s ProfileStudy Sample (n = 207)
FrequencyPercentage
Gender
Male13163.28
Female7636.71
Age
Below 30 years4220.28
31–40 years7134.29
41–50 years3215.45
Above 50 years6229.95
Level of education
Bachelor’s degree7636.71
Master’s degree12258.93
Ph.D.94.34
Industrial working experience
Below 10 years199.17
11–20 years8541.06
21–30 years6832.85
Above 30 years3516.90
Job title
CEO, GM, DM157.24
Planning manager157.24
Logistic manager104.83
Merchandising manager2210.62
Expert14570.4
Table 4. Student’s t-test, AVE, composite reliability, Cronbach’s α, Q2, and R2.
ItemPath CoefficientStudent’s t-TestAverage Variance Extracted (AVE)Composite Reliability (CR)Cronbach’s (α)Predictive
Relevance ( Q 2 )
Coefficient of Determination ( R 2 )
SCRSCR1
SCR2
SCR3
SCR4
0.677
0.585
0.801
0.682
6.109
2.565
17.638
10.323
0.5120.7180.7570.2700.371
OFOF1
OF2
OF3
0.683
0.786
0.804
8.680
13.353
14.780
0.5770.8030.7470.2770.318
CACA1
CA2
CA3
CA4
CA5
CA6
0.618
0.591
0.791
0.773
0.671
0.552
8.723
7.746
15.719
21.123
11.687
4.701
0.5350.8170.7290.2120.370
DACDAC1
DAC2
DAC3
DAC4
DAC5
0.674
0.859
0.750
0.691
0.579
12.913
31.997
15.604
12.841
10.079
0.5140.8380.7580.269----
Table 5. Correlations among major constructs.
OFSCRCADAC
OF0.577
SCR0.5420.512
CA0.5370.4830.535
DAC0.4190.4970.4470.514
Table 6. The results of the test of the hypotheses.
HypothesisPath Coefficient (β)t-ValueResult
H10.5023.351Accepted
H20.60918.051Accepted
H30.5444.736Accepted
H40.2230.120Not accepted
H50.5153.116Accepted
Mediator HypothesisDirectIndirectTotalVAFResult
H60.5020.223 × 0.609 = 0.1350.6370.211Accepted
H70.5020.515 × 0.544 = 0.2800.7820.35Accepted
Publisher’s Note: MDPI stays neutral with regard to jurisdictional claims in published maps and institutional affiliations.

