
Convergence between Indicators for Measuring Sustainable Development and M&A Performance in the Energy Sector


Abstract
:1. Introduction
2. Materials and Methods
- -
- Which indicators measure sustainable development in the energy sector?
- -
- Which indicators measure M&A performance in the energy sector?
- -
- How do these indicators relate?
- Preselected keywords are in the title, keywords section, or abstract of the article;
- Studies are published in a scientific peer-reviewed journal;
- Studies are published in the environmental sciences, management, energy fuels, engineering environmental, green sustainable science technology, business, environmental studies, business finance, ecology, or economics WoS database categories.
3. Results
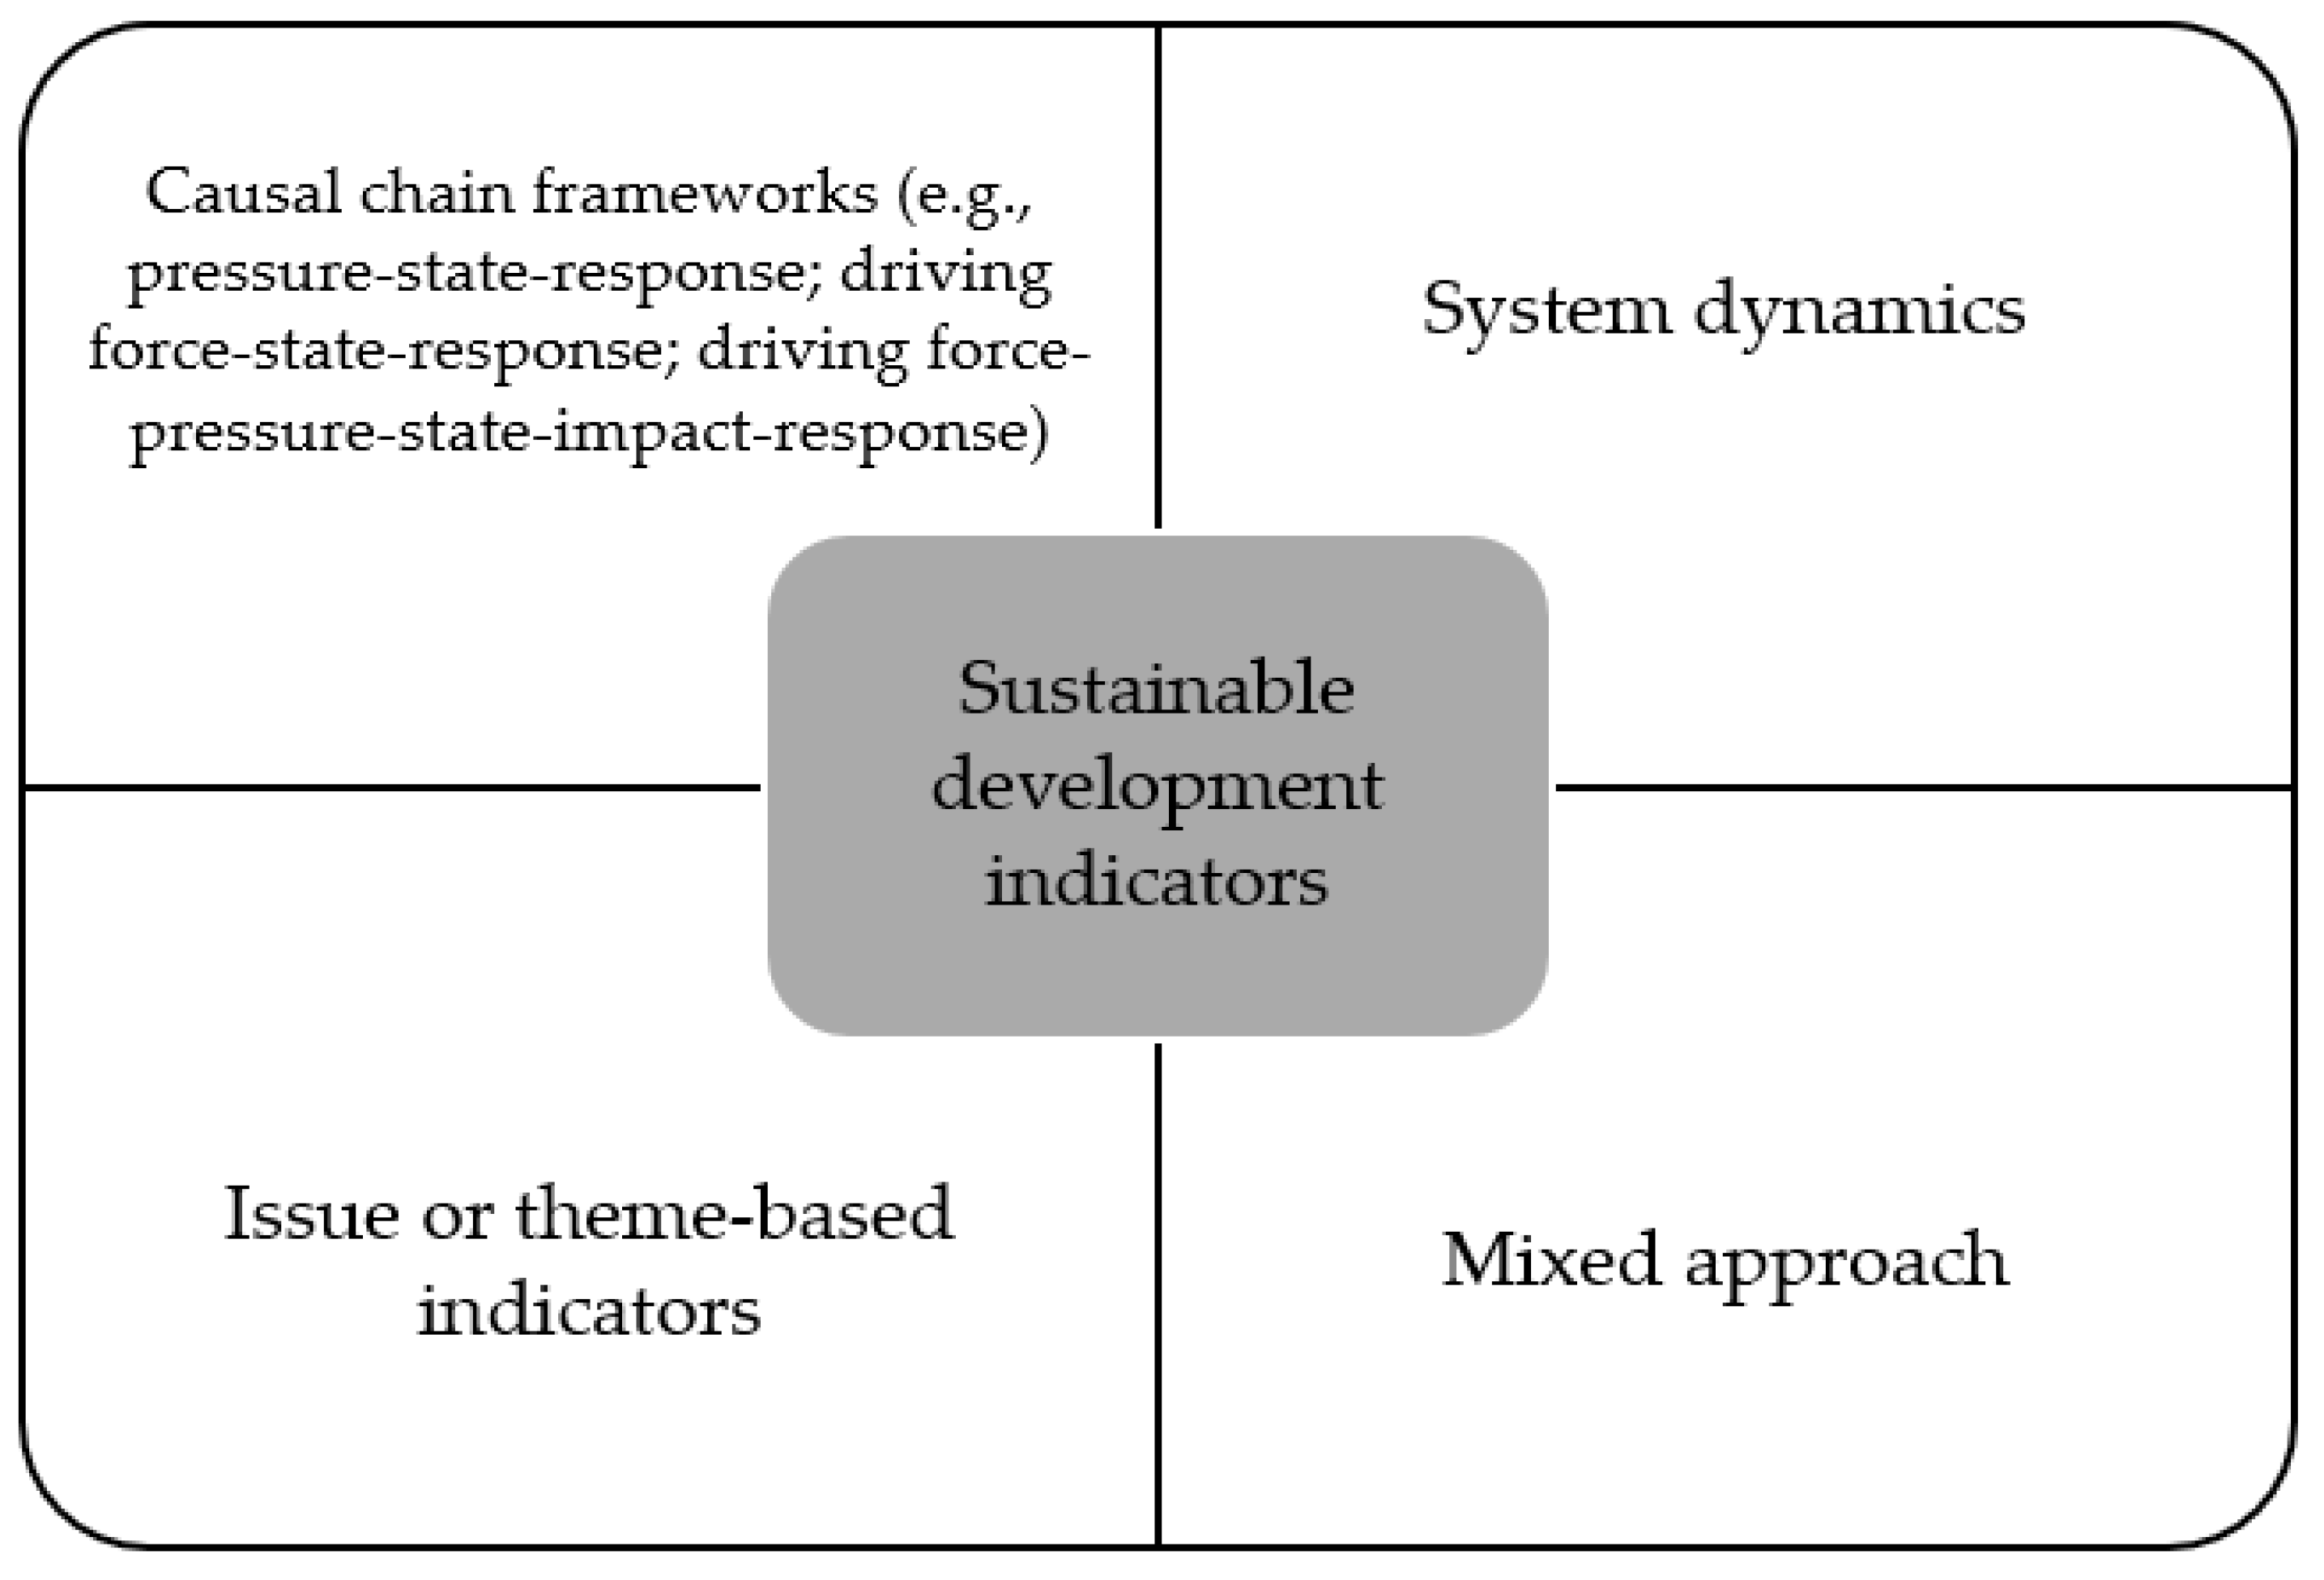
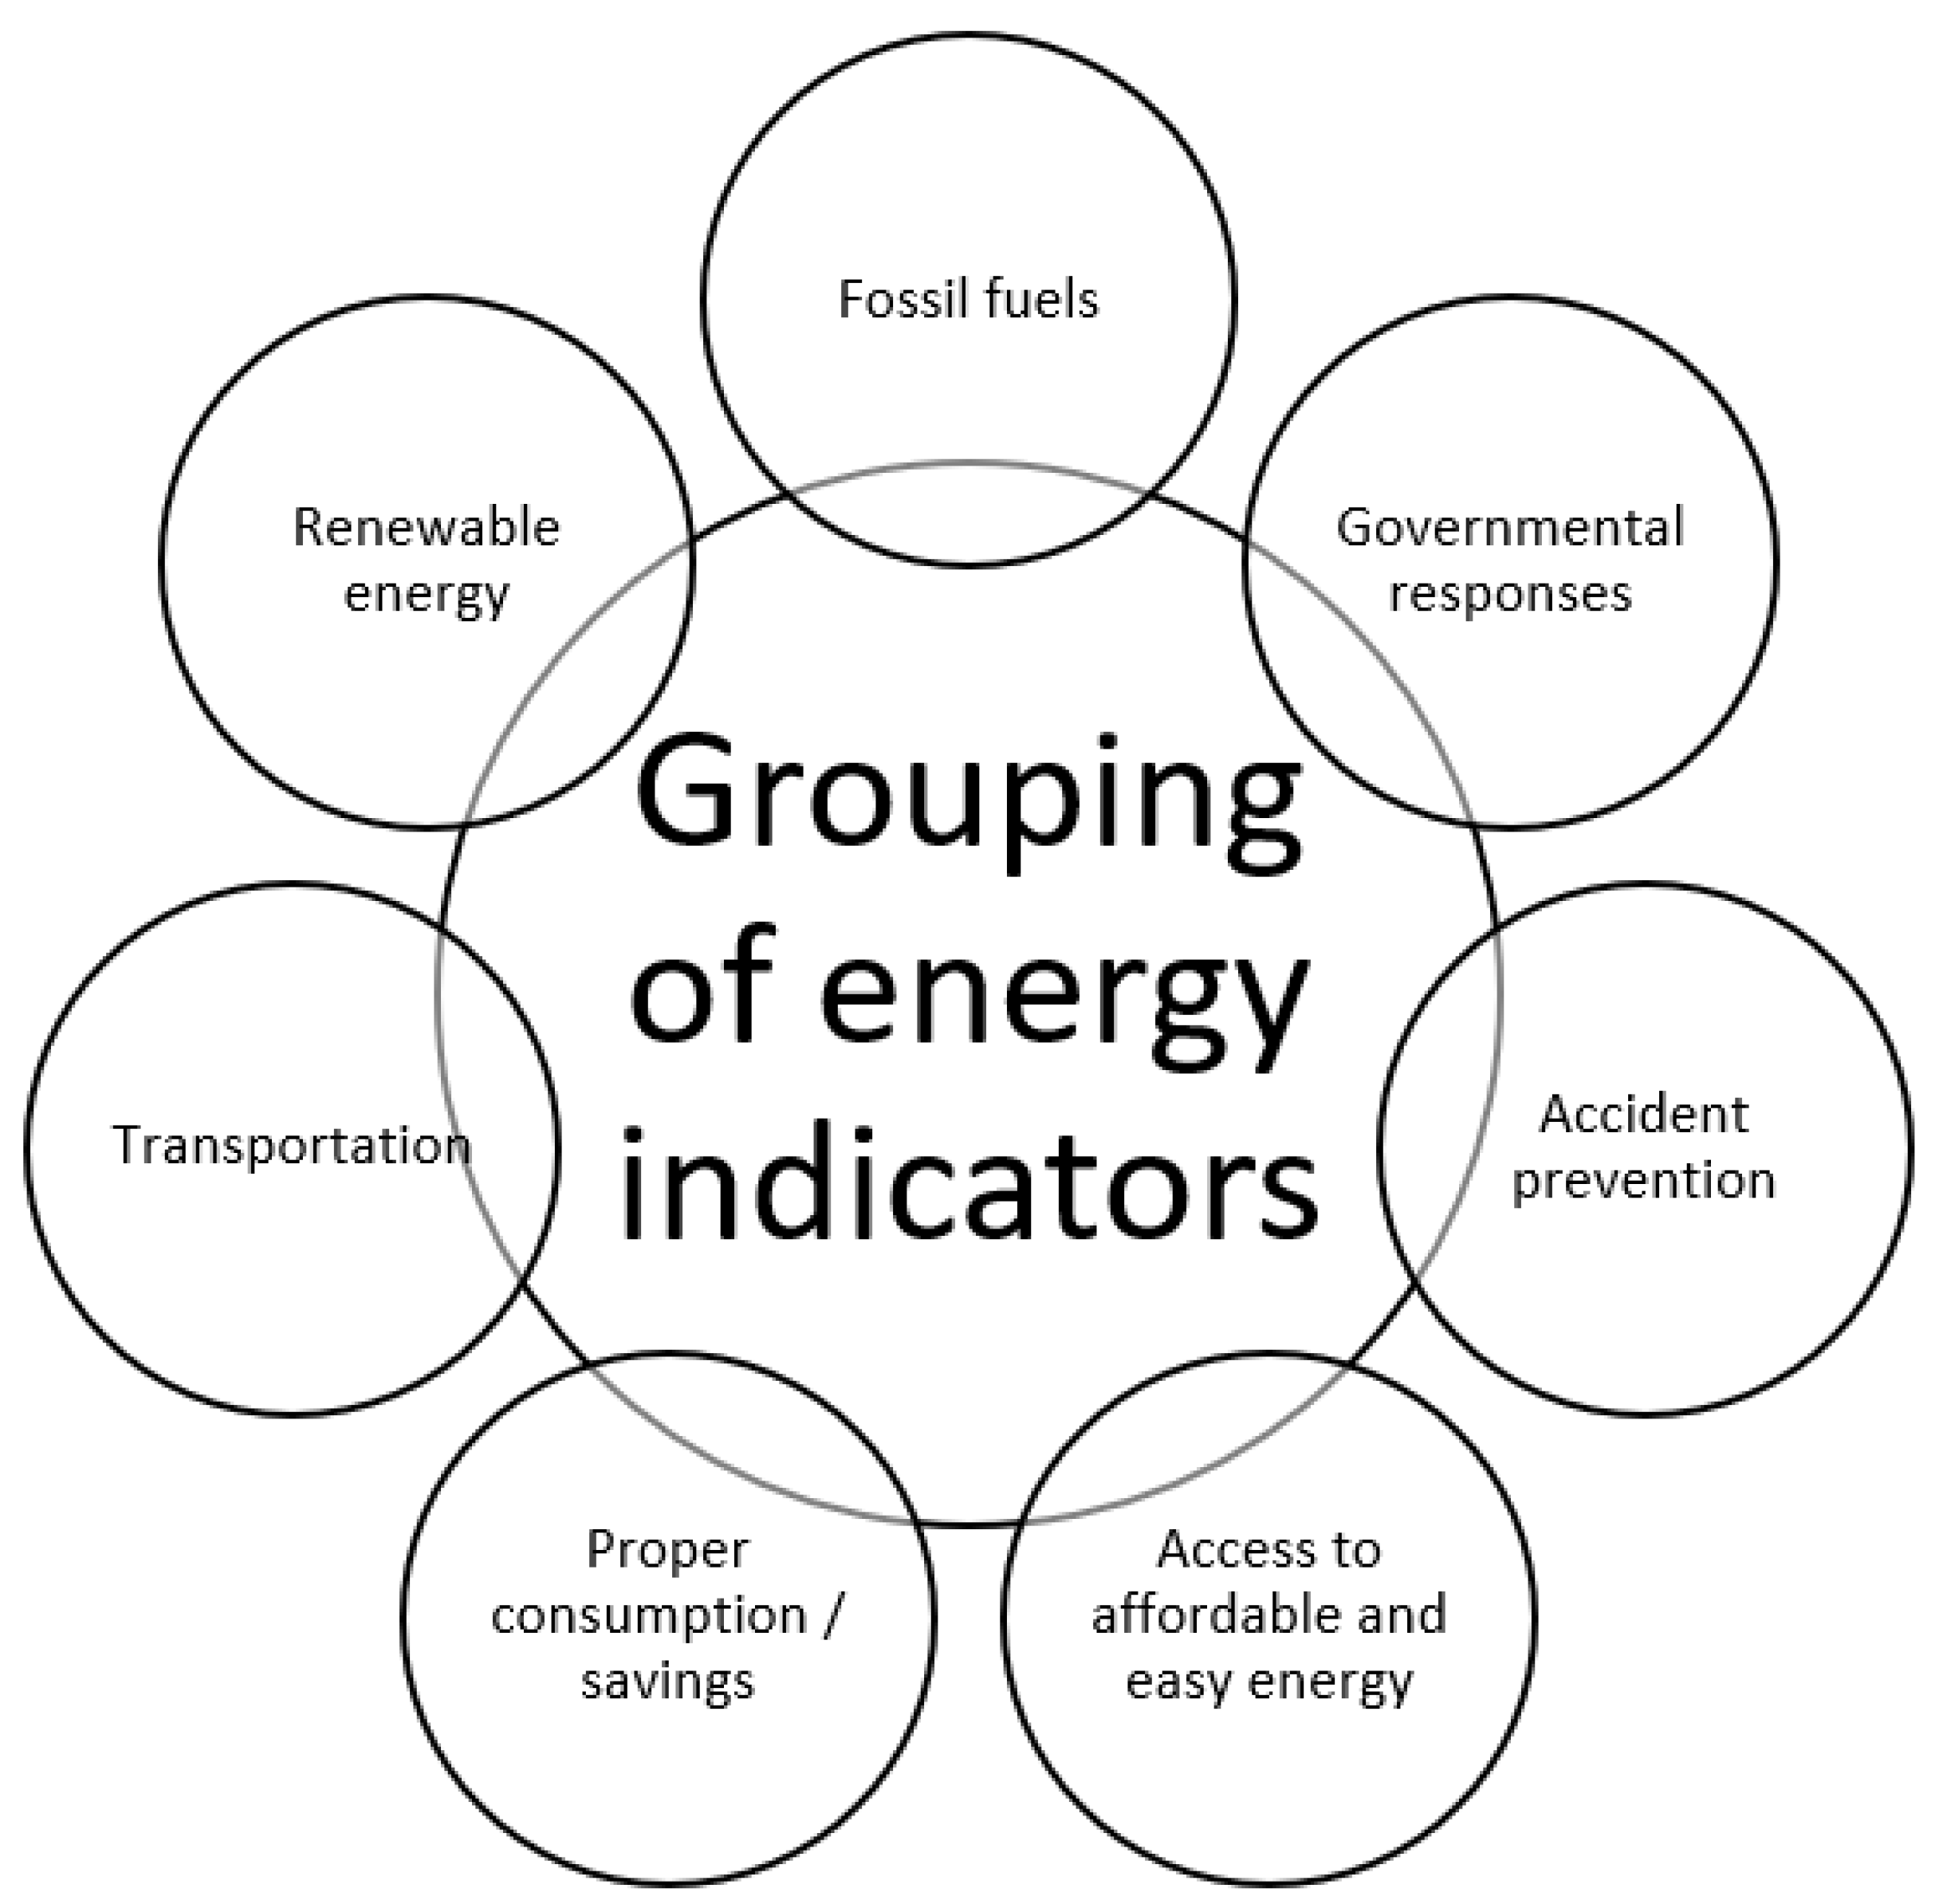
3.1. Indicators for Measuring Sustainable Development
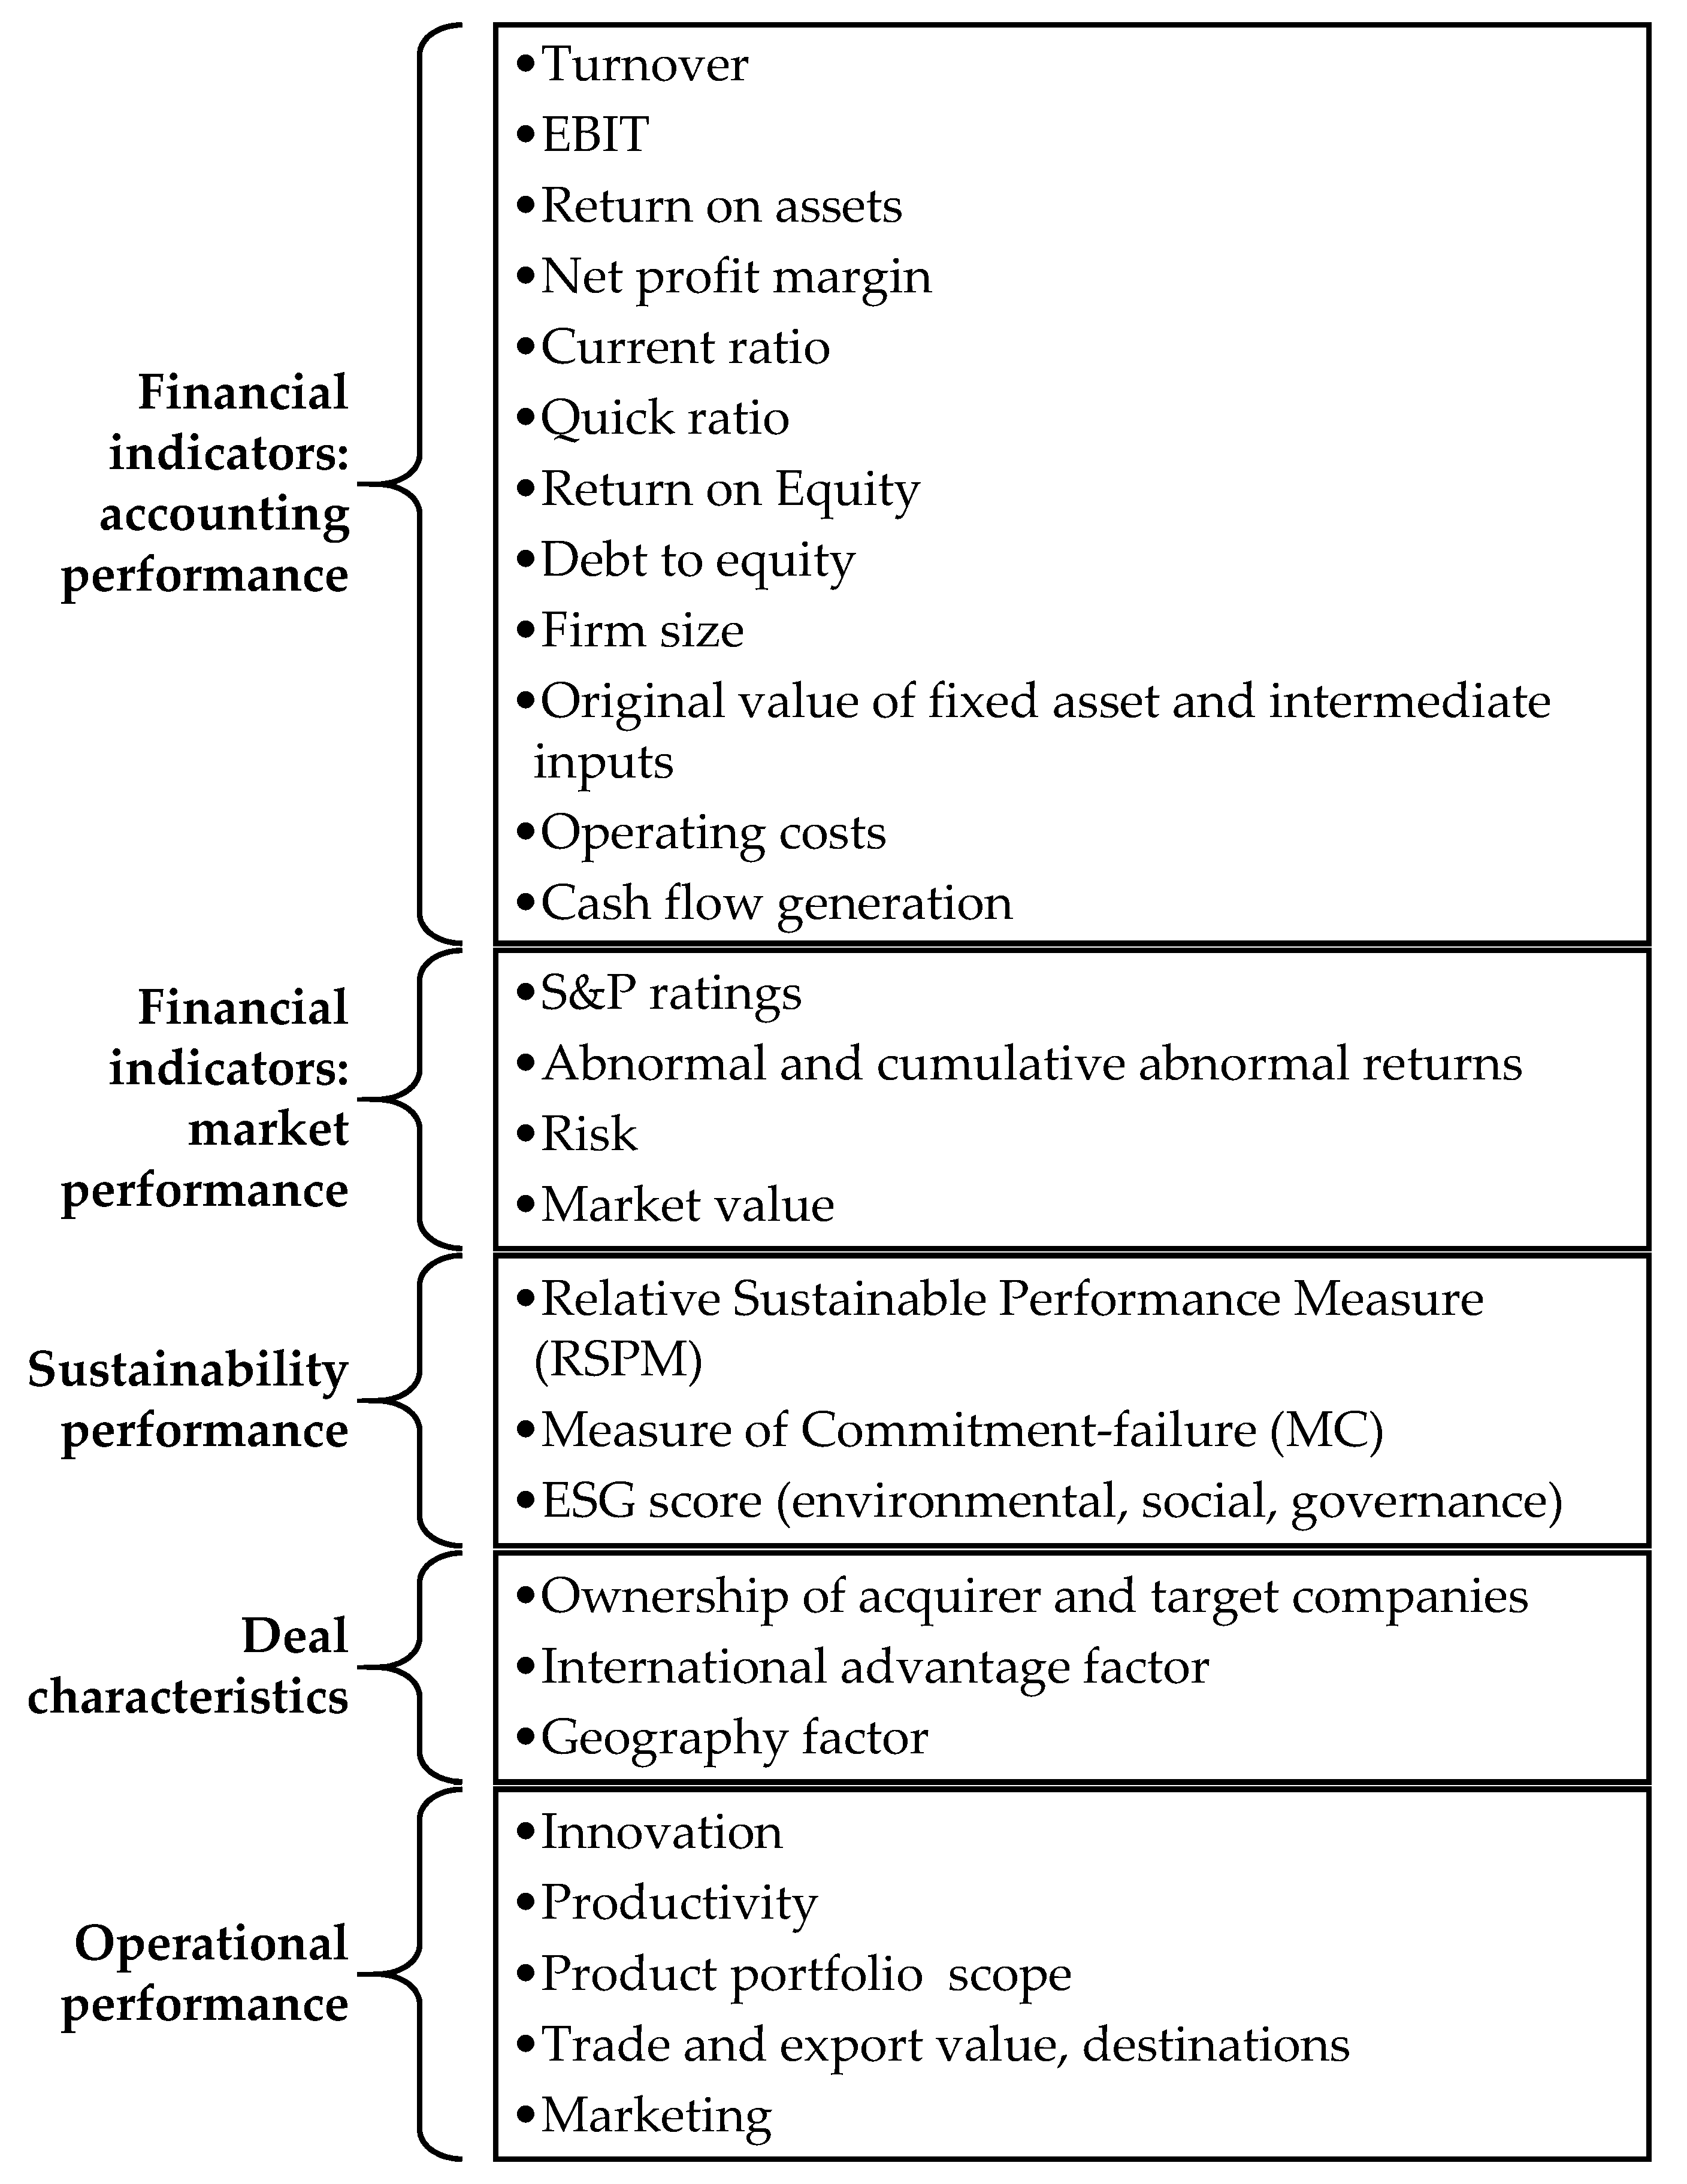
3.2. M&A Performance Indicators
- The industry and geographical area where M&As took place and where M&A performance was measured differs;
- Most popular are quantitative analyses that employ either secondary data (e.g., from databases) or primary data (e.g., surveys). Less popular are cases studies or laboratory and field experiments;
- The time scale of M&A performance measurement. From this perspective, it is a common practice to group the indicators into the following three categories: short-, medium-, and long-term time scales. Short term usually employs event-study methodology and reflect M&A performance during a duration to up to one year. Medium-term studies usually analyze M&A performance in one to three years. This time window is usually motivated by the consideration that it should be a sufficient period for the M&A integration processes. The studies analyzing M&A performance in excess of three years are referred to, and are accounted to estimate M&A performance, in the long term.
4. Discussion
5. Conclusions
Author Contributions
Funding
Institutional Review Board Statement
Informed Consent Statement
Data Availability Statement
Conflicts of Interest
Abbreviations
| Abbreviation | Full term |
| M&A | Merger and acquisition |
| SDG7 | Sustainable development goal 7 |
| UN | United Nations |
| SED | Sustainable energy development |
| IMAA | Institute of mergers, acquisitions, and alliances |
| SLR | Systematic literature review |
| SALSA | Search, appraisal, synthesis, and analysis |
| PRISMA | Preferred reporting items for systematic reviews and meta-Analyses |
| PSALSAR | Protocol, search, appraisal, synthesis, analysis, and report |
| WDI | World development indicators |
| HDI | Human development index |
| EF | Ecological footprint |
| EPI | Environmental performance index |
| SSI | Sustainable society index |
| IAEA | International atomic energy agency |
| ISED | Indicators for sustainable energy development |
| EISD | Energy indicators for sustainable development |
| SEDI | Sustainable energy development composite index |
| IEA | International energy agency |
| SMART | Specific, measurable, achievable, relevant and time-bound |
Appendix A

| Author/Study | HDI | GDP | Access to Clean Energy and Technologies | Access to Technological Innovation | ISED by IAEA | Composite SEDI | Ecological Footprints and Carrying Capability | TSDI. Weighted-Sum Method | WDI and FDP | Index of Sustainable Economic Welfare | Genuine Progress Indicator | Price, Renewables, Innovation, R&D | GPI | Other 1 | Other 2 | Other 3 | Other 4 | Other 5 |
|---|---|---|---|---|---|---|---|---|---|---|---|---|---|---|---|---|---|---|
| [1] | + | + | + | |||||||||||||||
| [24] | + | |||||||||||||||||
| [25] | + | + | + | |||||||||||||||
| [26] | + | |||||||||||||||||
| [27] | + | |||||||||||||||||
| [28] | + | |||||||||||||||||
| [29] | + | |||||||||||||||||
| [30] | + | |||||||||||||||||
| [31] | + | |||||||||||||||||
| [33] | + | |||||||||||||||||
| [34] | + | |||||||||||||||||
| [35] | + | |||||||||||||||||
| [36] | + | |||||||||||||||||
| [37] | + | + | + | |||||||||||||||
| [38] | + | |||||||||||||||||
| [40] | + | + | ||||||||||||||||
| [41] | + | |||||||||||||||||
| [57] | + | + | + | + | ||||||||||||||
| [54] | + | |||||||||||||||||
| [55] | + | |||||||||||||||||
| [56] | + | |||||||||||||||||
| [58] | + |
References
- Gunnarsdottir, I.; Davidsdottir, B.; Worrell, E.; Sigurgeirsdottir, S. Sustainable energy development: History of the concept and emerging themes. Renew. Sustain. Energy Rev. 2021, 141, 110770. [Google Scholar] [CrossRef]
- Nerini, F.F.; Tomei, J.; To, L.S.; Bisaga, I.; Parikh, P.; Black, M.; Borrion, A.; Spataru, C.; Castán Broto, V.; Anandarajah, G.; et al. Mapping synergies and trade-offs between energy and the Sustainable Development Goals. Nat. Energy 2018, 3, 10–15. [Google Scholar] [CrossRef]
- Gunnarsdottir, I.; Davidsdottir, B.; Worrell, E.; Sigurgeirsdottir, S. Review of indicators for sustainable energy development. Renew. Sustain. Energy Rev. 2020, 133, 110294. [Google Scholar] [CrossRef]
- Mak, K.N. Editorial: Energy indicators for sustainable development. In Natural Resources Forum; Blackwell Publishing Ltd.: Oxford, UK, 2005; p. 269. [Google Scholar]
- Kemmler, A.; Spreng, D. Energy indicators for tracking sustainability in developing countries. Energy Policy 2007, 35, 2466–2480. [Google Scholar] [CrossRef]
- Botis, S. Mergers and Acquisitions in the International Banking. Econ. Sci. 2013, 6, 119–126. [Google Scholar]
- Zollo, M.; Meier, D. What Is M&A Performance? Acad. Manag. Perspect. 2008, 22, 55–77. [Google Scholar] [CrossRef]
- Choi, J.; Shin, N.; Soo Lee, H. Exploring the Dynamics between M&A Activities and Industry-Level Performance. Sustainability 2020, 12, 4399. [Google Scholar] [CrossRef]
- Cefis, E. The impact of M&A on technology sourcing strategies. Econ. Innov. New Technol. 2010, 19, 27–51. [Google Scholar]
- Wang, D.; Moini, H. Performance Assessment of Mergers and Acquisitions: Evidence from Academic Field and Fieldwork. E-Leader Berlin. 2012. Available online: http://www.g-casa.com/conferences/berlin/papers/Wang.pdf (accessed on 12 May 2022).
- Rahman, M.; Lambkin, M. Creating or destroying value through mergers and acquisitions: A marketing perspective. Ind. Mark. Manag. 2015, 46, 24–35. [Google Scholar] [CrossRef]
- Bruner, R.F. Does M&A pay? A survey of evidence for the decision-maker. J. Appl. Financ. 2002, 12, 48–68. [Google Scholar]
- Cartwright, S.; Schoenberg, R. Thirty years of mergers and acquisitions research: Recent advances and future opportunities. Br. J. Manag. 2006, 17, S1–S5. [Google Scholar] [CrossRef]
- Meglio, O.; Risberg, A. Mergers and acquisitions-Time for a methodological rejuvenation of the field? Scand. J. Manag. 2010, 26, 87–95. [Google Scholar] [CrossRef]
- Wan, W.; Yiu, D. From crisis to opportunity: Environmental jolt, corporate acquisitions, and firm performance. Strateg. Manag. J. 2009, 30, 791–801. [Google Scholar] [CrossRef]
- Salvi, A.; Petruzzella, F.; Giakoumelou, A. Green M&A Deals and Bidders’ Value Creation: The Role of Sustainability in Post-Acquisition Performance. Int. Bus. Res. 2018, 11, 96–105. [Google Scholar]
- Mengist, W.; Soromessa, T.; Legese, G. Method for conducting systematic literature review and meta-analysis for environmental science research. MethodsX 2020, 7, 100777. [Google Scholar] [CrossRef]
- Grant, M.J.; Booth, A. A Typology of Reviews: An Analysis of 14 Review Types and Associated Methodologies. Health Inf. Libr. J. 2009, 26, 91–108. [Google Scholar] [CrossRef]
- Booth, A.; Sutton, A.; Papaioannou, D. Systematic Approaches to a Successful Literature Review; Sage: Los Angeles, CA, USA, 2016; 336p, ISBN 1473952808. [Google Scholar]
- Moher, D.; Liberati, A.; Tetzlaff, J.; Altman, D.G. Preferred reporting items for systematic reviews and meta-analyses: The PRISMA statement. Int. J. Surg. 2010, 8, 336–341. [Google Scholar] [CrossRef]
- Malinauskaite, L.; Cook, D.; Daviosdottir, B.; Ogmundardottir, H.; Roman, J. Ecosystem services in the Arctic: A thematic review. Ecosyst. Serv. 2019, 36, 100898. [Google Scholar] [CrossRef]
- Jacobides, M.G.; Cennamo, C.; Gawer, A. Towards a theory of ecosystems. Strateg. Manag. J. 2018, 39, 2255–2276. [Google Scholar] [CrossRef]
- Xu, G.; Wu, Y.; Minshall, T.; Zhou, Y. Exploring innovation ecosystems across science, technology, and business: A case of 3D printing in China. Technol. Forecast. Soc. Chang. 2018, 136, 208–221. [Google Scholar] [CrossRef]
- Vera, I.A.; Langlois, L.M.; Rogner, H.H.; Jalal, A.I.; Toth, F.L. Indicators for sustainable energy development: An initiative by the International Atomic Energy Agency. In Natural Resources Forum; Blackwell Publishing Ltd.: Oxford, UK, 2005; Volume 29, pp. 274–283. [Google Scholar]
- Khalid, M.A.; Sharma, S.; Dubey, K.A. Developing an indicator set for measuring sustainable development in India. In Natural Resources Forum; Blackwell Publishing Ltd.: Oxford, UK, 2018; pp. 185–200. [Google Scholar] [CrossRef]
- Streimikiene, D. Indicators for sustainable energy development in Lithuania. In Natural Resources Forum; Blackwell Publishing Ltd.: Oxford, UK, 2005; pp. 322–333. [Google Scholar]
- Todoc, J.L.; Todoc, M.J.; Lefevre, T. Indicators for sustainable energy development in Thailand. In Natural Resources Forum; Blackwell Publishing Ltd.: Oxford, UK, 2005; pp. 343–359. [Google Scholar]
- Medina-Ross, J.A.; Mata-Sandoval, J.C.; Lopez-Perez, R. Indicators for sustainable energy development in Mexico. In Natural Resources Forum; Blackwell Publishing Ltd.: Oxford, UK, 2005; Volume 29. [Google Scholar]
- Salimov, S. Energy Indicators for Sustainable Development of Azerbaijan Republic-Economic Dimension. Eur. J. Sustain. Dev. 2018, 7, 236–248. [Google Scholar] [CrossRef]
- Ledoux, L.; Mertens, R.; Wolff, P. EU sustainable development indicators: An overview. In Natural Resources Forum; Blackwell Publishing: Oxford, UK, 2005; Volume 29, pp. 392–403. [Google Scholar]
- Iddrisu, I.; Bhattacharyya, S.C. Sustainable Energy Development Index: A multi-dimensional indicator for measuring sustainable energy development. Renew. Sustain. Energy Rev. 2015, 50, 513–530. [Google Scholar] [CrossRef]
- Pinter, L.; Hardi, P.; Bartelmus, P. Sustainable Development Indicators: Proposals for a way forward. International Institute for Sustainable Development. 2005. Available online: https://www.iisd.org/pdf/2005/measure_indicators_sd_way_forward.pdf (accessed on 17 May 2022).
- Chen, Y.; Chen, C.Y.; Hsieh, T. Exploration of sustainable development by applying green economy indicators. Environ. Monit. Assess. 2011, 182, 279–289. [Google Scholar] [CrossRef]
- Unander, F. Energy indicators and sustainable development: The International Energy Agency approach. In Natural Resources Forum; Blackwell Publishing Ltd.: Oxford, UK, 2005; Volume 29, pp. 377–391. [Google Scholar]
- Tsai, W.T. Energy sustainability from analysis of sustainable development indicators: A case study in Taiwan. Renew. Sustain. Energy Rev. 2010, 14, 2131–2138. [Google Scholar] [CrossRef]
- Li, X.; Yu, Z.; Salman, A.; Ali, Q.; Hafeez, M.; Aslam, M.S. The role of financial development indicators in sustainable development-environmental degradation nexus. Environ. Sci. Pollut. Res. 2021, 28, 33707–33718. [Google Scholar] [CrossRef]
- Lucia, U.; Grisolia, G. Exergy inefficiency: An indicator for sustainable development analysis. Energy Rep. 2019, 5, 62–69. [Google Scholar] [CrossRef]
- Razmjoo, A.A.; Sumper, A.; Davarpanah, A. Development of sustainable energy indexes by the utilization of new indicators: A comparative study. Energy Rep. 2019, 5, 375–383. [Google Scholar] [CrossRef]
- Schöne, N.; Heinz, B. Sustainable Development Goal indicators as the foundation for a holistic impact assessment of access-to-energy projects. J. Sustain. Dev. Energy Water Environ. Syst. 2022, 10, 1090400. [Google Scholar] [CrossRef]
- Cook, D.; Davíðsdóttir, B.; Gunnarsdóttir, I. A Conceptual Exploration of How the Pursuit of Sustainable Energy Development Is Implicit in the Genuine Progress Indicator. Energies 2022, 15, 2129. [Google Scholar] [CrossRef]
- Stankowska, A. Sustainability Development: Assessment of Selected Indicators of Sustainable Energy Development in Poland and in Selected EU Member States Prior to COVID-19 and Following the Third Wave of COVID-19. Energies 2022, 15, 2135. [Google Scholar] [CrossRef]
- Morck, R.; Yeung, B. The puzzle of the harmonious stock prices. World Econ.-Henley Thames 2002, 3, 105–120. [Google Scholar]
- Cubas-Díaz, M.; Martínez Sedano, M.Á. Do Credit Ratings Take into Account the Sustainability Performance of Companies? Sustainability 2018, 10, 4272. [Google Scholar] [CrossRef]
- Jing, Y. Do mergers and acquisitions promote trade? Evidence from China. J. Int. Trade Econ. Dev. 2018, 27, 792–805. [Google Scholar] [CrossRef]
- Kumaraswamy, S.; Ebrahim, R.; Nasser, H. Impact of corporate restructuring on the financial performance of Gulf cooperation council firms. Pol. J. Manag. Stud. 2019, 19, 262–272. [Google Scholar] [CrossRef]
- Mihaiu, D.M.; Serban, R.-A.; Opreana, A.; Tichindelean, M.; Brătian, V.; Barbu, L. The Impact of Mergers and Acquisitions and Sustainability on Company Performance in the Pharmaceutical Sector. Sustainability 2021, 13, 6525. [Google Scholar] [CrossRef]
- Brahma, S.; Boateng, A.; Ahmad, S. Motives of Mergers and Acquisitions in the European Public Utilities: An Empirical Investigation of the Wealth-anomaly. Int. J. Public Sect. Manag. 2017, 31, 599–616. [Google Scholar] [CrossRef]
- Krishnan, C.N.V.; Wu, J. Market Misreaction? Evidence from Cross-Border Acquisitions. J. Risk Financ. Manag. 2022, 15, 93. [Google Scholar] [CrossRef]
- Ibrahimi, M.; Meghouar, H. Sources of value creation and destruction in horizontal mergers and acquisitions. Manag. Financ. 2019, 45, 1398–1415. [Google Scholar] [CrossRef]
- José, L.C.E.; Fernando, J.C.R.; Antonio, G.T. Size and sector in the efficiency of mergers involving unlisted companies. Span. J. Financ. Account./Rev. Española Financ. Contab. 2012, 41, 51–87. [Google Scholar] [CrossRef]
- Hong, X.; Lin, X.; Fang, L.; Gao, Y.; Li, R. Application of Machine Learning Models for Predictions on Cross-Border Merger and Acquisition Decisions with ESG Characteristics from an Ecosystem and Sustainable Development Perspective. Sustainability 2022, 14, 2838. [Google Scholar] [CrossRef]
- Jones, E.; Xu, B.; Kamp, K. Agency costs in the market for corporate control: Evidence from UK takeovers. Rev. Account. Financ. 2021, 20, 23–52. [Google Scholar] [CrossRef]
- Caiado, R.G.G.; De Freitas Dias, R.; Mattos, L.V.; Quelhas, O.L.G.; Filho, W.L. Towards sustainable development through the perspective of eco-efficiency-A systematic literature review. J. Clean. Prod. 2017, 165, 890–904. [Google Scholar] [CrossRef]
- Ansari, A.K.; Unar, I.N. Sustainable Development Indicators for Energy in Pakistan. In Energy, Environment and Sustainable Development; Uqaili, M., Harijan, K., Eds.; Springer: Vienna, Austria, 2012. [Google Scholar] [CrossRef]
- Streimikiene, D.; Ciegis, R.; Grundey, D. Energy indicators for sustainable development in Baltic States. Renew. Sustain. Energy Rev. 2007, 11, 877–893. [Google Scholar] [CrossRef]
- Schaeffer, R.; Szklo, A.S.; Cima, F.M.; Machado, G. Indicators for sustainable energy development: Brazil’s case study. In Natural Resources Forum; Blackwell Publishing Ltd.: Oxford, UK, 2005; Volume 29, pp. 284–297. [Google Scholar]
- Alola, A.A.; Ozturk, I.; Bekun, F.V. Is Clean Energy prosperity and Technological Innovation Rapidly Mitigating Sustainable Energy-Development Deficit in Selected Sub-saharan Africa A Myth or Reality. Energy Policy 2021, 158, 112520. [Google Scholar] [CrossRef]
- Hannan, M.A.; Begum, R.A.; Abdolrasol, M.G.; Lipu, M.H.; Mohamed, A.; Rashid, M.M. Review of baseline studies on energy policies and indicators in Malaysia for future sustainable energy development. Renew. Sustain. Energy Rev. 2018, 94, 551–564. [Google Scholar] [CrossRef]


| Steps | Main Task and Method | Outcome | |
|---|---|---|---|
| PSALSAR framework | Protocol | Define study scope | Indicators for measuring sustainable development and M&A performance PICOC (population, intervention, comparison, outcome, and context) method [19] |
| Search | Search for studies | Search databases with preselected keywords | |
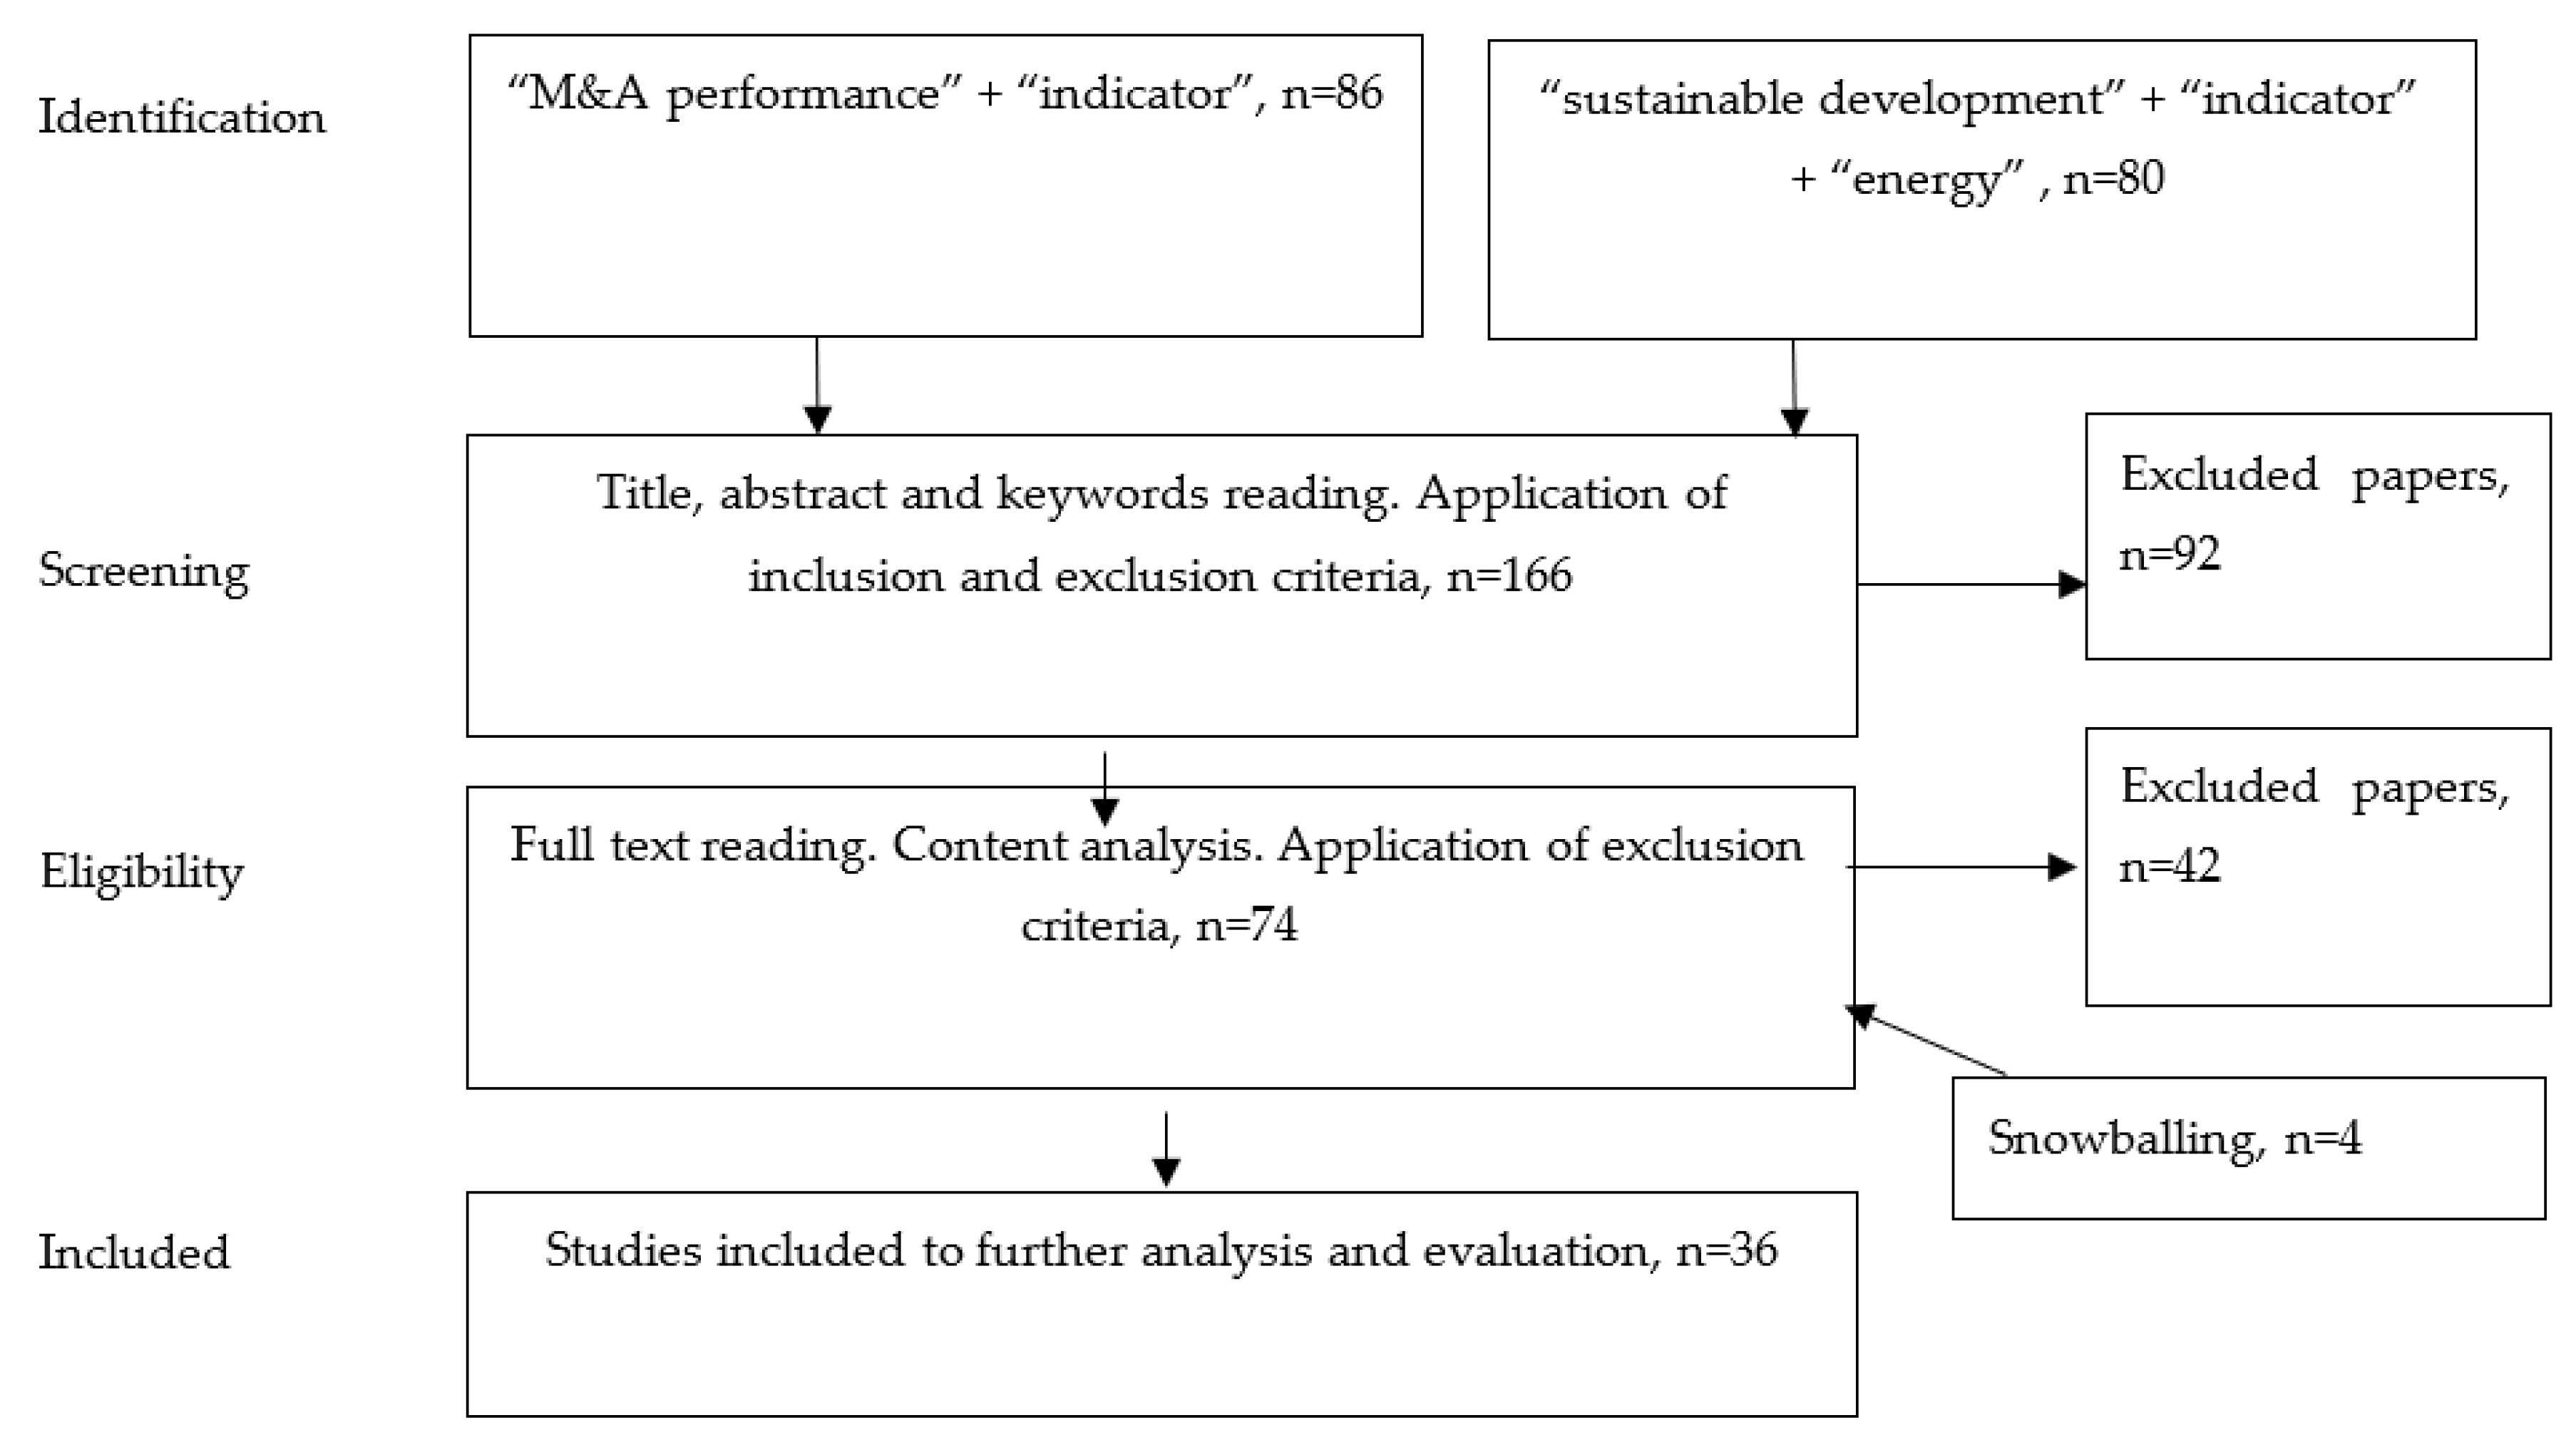
| Appraisal | Selecting studies | Inclusion and exclusion criteria based on PRISMA statement (papers identification, screening, eligibility, and included papers) [20] Snowballing technique [21] | |
| Quality assessment of studies | |||
| Synthesis | Extract data | Template construction for data extraction | |
| Categorize data | Arranging data for further analysis | ||
| Analysis | Data analysis | Quantitative categories, description, and narrative analysis of the organized data | |
| Result and discussion | Trend identifications, gap acknowledgement, and comparison of results | ||
| Conclusion | Conclusion and recommendation | ||
| Report | Conducting a report | Summary of results using PRISMA methodology |
| Concept | Definition According to [19] | Application |
|---|---|---|
| Population | Research studies dealing with sustainable development measurement indicators or/and M&A performance measurement indicators | Research-based studies dealing with indicators, systems, or other measures to evaluate sustainable development and/or M&A performance |
| Intervention | Search for studies | Search databases with preselected keywords |
| Comparison | Selecting studies | Inclusion and exclusion criteria based on PRISMA statement (papers identification, screening, eligibility, and included papers) [20] Snowballing technique [21] |
| Quality assessment of studies | ||
| Outcome | Extract data | Template construction for data extraction |
| Categorize data | Arranging data for further analysis | |
| Context | Report writing | Summary of results using PRISMA methodology |
| Indexes | Origin | Application/Description |
|---|---|---|
| WDI (world development indicators) | World Bank | A comprehensive set of data and statistics published annually by the World Bank that allows for the evaluation of the development of most countries in the world. |
| Eurostat sustainable development indicators | Eurostat | Progress towards sustainable developments by EU member states. |
| HDI (human development index) | UN | Measures the process of enlarging people’s freedoms, opportunities, and improving their well-being. |
| EF (ecological footprint) | Global footprint network | Employs an ecological accounting system and measures a nation’s human effects on Earth’s ecosystem. |
| EPI (environmental performance index) | Yale University, Columbia University, and World Economic Forum | Indicated national progress towards environmental sustainability. |
| SSI (sustainable society index) | Van de Kerk and Manuel | Integrates human well-being and environmental well-being. Reflects a nation’s sustainability progress. |
| Study | Methodology | Case Study Location (Region/Country) | Aim of the Study/Issue Addressed | Indicators |
|---|---|---|---|---|
| Cubas-Díaz and Martínez [43] | Fixed-effects ordered probit analysis | Worldwide | Credit rating of the potential investment | S&P ratings Relative sustainable performance measure (RSPM) and the measure of commitment-failure (MC) |
| Jing [44] | Reduced form estimation method | China | Relationship between the M&A and the exports | Ownership, firm size, original value of the fixed asset, and intermediate inputs. Product, export, export destinations, the identity of Chinese exporter, and the trade regime |
| Kumaraswamy and Ebrahim [45] | Ordinary least square regression method | Gulf region | Assessment of the M&A impact on the overall performance of the Gulf cooperation council (GCC) firms using profitability, liquidity, and leverage measures | Liquidity: Current ratio (CR) and quick ratio (QR) Profitability: Net profit margin and return on equity (ROE) Debt ratios: Debt to equity (D/E) |
| Mihau et al. [46] | Score function/methods: Statistical models and AI-based models | Pharmaceutical sector | M&A impact and ESG sustainability scores of companies | Financial performance: Profitability, liquidity and solvency, assets and debt management, and market value Non-financial performance: ESG score |
| Brahma et al. [47] | Berkovitch and Narayanan (1993) model | European utility sector | M&A motives and performance | Five accounting indicators of operating performance: Growth of turnover, growth of earning before interests and taxes (EBIT), return on assets (ROA), net profit margin, and growth in fixed assets |
| Krishnan and Jialun [48] | Bootstrap DEA (data envelopment analysis) model | Cross-border mergers involving U.S. acquirers | Acquirers’ operating efficiencies around and after cross-border acquisitions | Cumulative abnormal returns (CARs) |
| Ibrahimi and Meghouar [49] | Stepwise regression method/variation of indicator | France | Value creation and destruction in horizontal M&A | Turnover (Tv) and operating cost (OpC); Investment cost of fixed assets (FA) and financial charges (FiC); Profit tax (Tax); Debt capacity (Debt); Financial risk |
| José et al. [50] | Counterfactual methodology. Analysis of accounting data | Spain | Contrast between merging and non-merging companies | Business profitability and technical efficiency: Economic profitability, financial profitability, and productivity Cash-flow generation capacity/liquidity: earnings before interest, taxes, depreciation, and amortization (EBITDA)/total assets and earnings before interest, taxes, depreciation, and amortization (EBITDA)/turnover Financial structure of the company: Operating costs, personnel costs, and financial |
| Hong et al. [51] | Machine learning method. AdaBoost and SVM methods | A total of 25 developed countries plus 26 emerging market countries and regions | Prediction model of cross-border M&A activities from a sustainable development and ecosystem perspective | Macroeconomics, geography, climate, cultural and law, deal and payment, ESG, and financial indicators, with a focus on the exploration of their predictability of success for M&A International advantage factor; geography factor; climate factors; deal factor; payment factor; ESG factor; size factor; growth factor; profitability factor; cash flow factor; leverage factor; investment factor; valuation factor; culture and law factor; information factor |
| Jones et al. [52] | Cox proportional hazards model (takeover likelihood study); Accelerated failure time model | UK | 1. Does underperformance result in increased takeover hazard in the disciplinary set? 2. Within the disciplinary set, which agency cost indicators are associated with market discipline? | Stock return and market return. Asset utilization, operating expense divided by net sales, cash dividends paid, capital expenditure, leverage, ROA, sales growth, and assets growth |
Publisher’s Note: MDPI stays neutral with regard to jurisdictional claims in published maps and institutional affiliations. |
© 2022 by the authors. Licensee MDPI, Basel, Switzerland. This article is an open access article distributed under the terms and conditions of the Creative Commons Attribution (CC BY) license (https://creativecommons.org/licenses/by/4.0/).
Share and Cite
Andriuškevičius, K.; Štreimikienė, D.; Alebaitė, I. Convergence between Indicators for Measuring Sustainable Development and M&A Performance in the Energy Sector. Sustainability 2022, 14, 10360. https://doi.org/10.3390/su141610360
Andriuškevičius K, Štreimikienė D, Alebaitė I. Convergence between Indicators for Measuring Sustainable Development and M&A Performance in the Energy Sector. Sustainability. 2022; 14(16):10360. https://doi.org/10.3390/su141610360
Chicago/Turabian StyleAndriuškevičius, Karolis, Dalia Štreimikienė, and Irena Alebaitė. 2022. "Convergence between Indicators for Measuring Sustainable Development and M&A Performance in the Energy Sector" Sustainability 14, no. 16: 10360. https://doi.org/10.3390/su141610360