Article

Investigation of Mono-Crystalline Photovoltaic Active Cooling Thermal System for Hot Climate of Pakistan

1
Department of Mechanical Engineering, University of Engineering & Technology, Lahore 39161, Pakistan
2
Institute of Sustainable Energy, University Tenaga Nasional, Kajang 43000, Malaysia
3
Faculty of Engineering and IT, University of Technology Sydney, Ultimo, NSW 2007, Australia
*
Authors to whom correspondence should be addressed.
Sustainability 2022, 14(16), 10228; https://doi.org/10.3390/su141610228
Submission received: 6 June 2022 / Revised: 23 July 2022 / Accepted: 25 July 2022 / Published: 17 August 2022

Abstract

:
Climate change is causing adverse and diverse effects on human beings in term of severe diseases, melting of ice, and increase temperatures, which are directly linked to the consumption of traditional fossil fuels. These fuels can only be replaced by exploring renewable energy technologies, and photovoltaic solar modules are the most promising choice among them. This paper investigates electrical output in term of efficiency and power of a monocrystalline photovoltaic module under climatic conditions of Lahore, Pakistan in an effort to enhance electrical performance based on laminar and turbulent flow boundary conditions. A computational model of a PV module was designed and investigated, when the solar irradiance was observed to be maximum at 920.64 W/m2. Initially, the total flux received and absorbed by PV module was observed to be at 179.37 W/m2 after ray tracing analysis in Trace Pro; thereafter, the module’s temperature increased to 65.86 °C, causing an electrical efficiency drops to 15.65% from 19.40% without applying active cooling schemes. A coupling of Ansys Fluent and Steady State Thermal Analysis was performed for thermal management of a PV module by selecting water and air as a coolant at inlet temperature of 25 °C through microchannels contingent upon varying Reynolds numbers. The results maintained that the optimum coolant outlet temperature (49.86 °C), average PV cell’s layer temperature (32.42 °C), and temperature uniformity (4.16 °C) are achieved by water at 224, 6710, and 4200 Reynolds numbers respectively. In addition, again water maintained 18.65% of electrical efficiency and 33.65 W power output at 6710 Reynolds number. On the other hand, air-based cooling lagged behind water by 14% in term of efficiency and power output at maximum Reynolds number (6710).

1. Introduction

Energy is the bedrock for the existence and growth of the society with prolonged and entrenched industrialization. In order to meet energy demands, the global village is relying obtaining more than 80% of its energy from fossil fuels, natural gas, oil, and coal [1,2]. Unprecedently, the consumption of non-renewables have led to the increased emissions of greenhouse gases, which is having negative social and environmental impacts on societal sustainable development [3]. CO2 emission accounts for more than 60% of total greenhouse gases emitted in the atmosphere [4], and 25–30% of CO2 is emitted by the transport sector of a country [5]. To avoid the worst climatic impact of fossil fuels [6], renewable energy resources [7,8], particularly solar energy, is attracting greater attention for electricity generation due to clean, sustainable, and cost-effective sources [9,10,11] with a worldwide capacity of 733 GW by 2020, and accounted for 26% of renewable sources [12]. Furthermore, the earth atmosphere receives 1367 W/m2 of energy from the Sun [13] and earth absorbs 1.8 × 10¹¹ MW which is enough to meet the global energy demands [14]. To efficiently utilize the solar potential under real climatic conditions, photovoltaic (PV) systems have been developed to mitigate the impact of CO2, due to electricity production from conventional sources. PV modules are used to convert photons of sunlight into electricity; made up of different materials, such as crystalline silicon (mono-crystalline and poly crystalline) and thin film (amorphous silicon, copper indium gallium selenide, cadmium telluride) [15,16]. The multijunction solar cells have higher conversion efficiency of about 45% [17,18], and so are used in the concentrating of photovoltaic systems. Since solar cells consisting of multi junction require complex services condition; therefore, thin film technologies are preferred over them [19]. Thin film panels require more surface area to generate same amount of output leading to increased land area and hence increased capital cost [20]. Crystalline silicon PV modules accounted for 94% of PV production [21]. Multi-crystalline silicon modules are relatively cheaper, additional defects regarding crystals and metal contaminations slightly reduce their conversion efficiency [22]. Monocrystalline PV modules are the commercially most commonly used PV modules [23], but the efficiency is not more than 20% due to heating effect [24] leading to increase PV module temperature, and hence decreases the PV module efficiency [25]. Therefore, it is mandatory to maintain module temperature enough to achieve higher output. Environmental stresses (temperature, wind speed, humidity, dust) are crucial parameters for PV system performance and by controlling these parameters; the efficiency can be improved to a maximum level which then improve the reliability, energy production, capacity factor of PV system [26,27,28,29] stated by IEA [30] as well. The output of the PV module is highly affected by module temperature, as the output power of the module is decreased by increasing module temperature [31]. One study [32] investigated the impact of temperature and wavelength on output parameters of crystalline silicon solar cells; and determined 0.65% and 0.08% drop in power and efficiency respectively with each (1) K rise in cell temperature. Furthermore, the authors [33] investigated how efficiency is dependent on module temperature; reported that the around 15% module efficiency was stabilized for modules having high temperature values, and recorded the maximum efficiency values (peaks of 29.6% as compared to without cooling case) for temperature values of modules ranging between 20 °C and 30 °C. It was interpreted that increasing module’s temperature negatively impact the module performance. Another comparative study was performed to determine the performance of four different PV systems under meteorological conditions of Spain; decrease in daily electrical efficiency was found by 5.0, 5.4, 6.5, and 7.6% for of amorphous silicon, cadmium telluride, microcrystalline, and poly crystalline silicon module, respectively, with respect to rated values of efficiencies for each module [34]. The experimental results of a research revealed that the heat generated by the PV panel was as a result of the prolonged exposure of Sun on panel, causing to affect the output voltage in negative manner, thereby power generated by the PV module is affected [35]. The reduction in PV module temperature can enhance electrical output; therefore, the PV module temperature must be close to 25 °C during operating hours to achieve better performance [36]. A numerical thermal model was developed by Aly et al. [37] to predict the effect of environmental factors on panel temperature; resulted in increase of approximately 1 °C cell temperature due to 1 °C rise in ambient temperature. An experimental study was carried out under Agadir (Morocco) climatic conditions to study the performance of crystalline PV modules; revealed that electrical efficiency of monocrystalline PV module to be 10.9%, which is approximately 40% less than its rated value due to increase in panel temperature [38]. Moreover, a research study conducted in Poland revealed that increased air temperature and direct heating increased the module temperature, and this rise in temperature dropped module efficiency [39]. One study [40] determined the effect of module temperature on the output parameters of monocrystalline PV module; reported 0.01% drop in electrical efficiency and output power of module with each increase of module temperature by 1 °C. Hadidi et al. [41] studied the effect of arid climatic conditions on performance of PV system and found that PV cells are more affected by the temperature among environmental parameters.
In addition, various research studies have been conducted to lower the module temperature [42,43,44,45,46]. A three-dimensional (3D) model was developed for polycrystalline silicon PV module which analyzed that the temperature distribution curve showed the maximum temperature (331.76 K) near the module center. The results of a numerical study represented a decrement of 10 °C in average temperature of panel due to heat sink, validated by experimental setup and maximum power increased by 18.67% [47]. The researchers [48] studied that the by increasing temperature of a module reduce its performance, but module temperature is lowered by the cooling mechanism, due to which a net energy gain of 7.69% was obtained and an improvement in performance ratio was observed by 7.14%. Chandra et al. [49] observed negative impact of module temperature on module’s performance and observed that performance ratio was improved by 3.4%. It was found that experimental values of energy for thermally cooled and not cooled module were 431.28 Wh and 410.44 Wh, respectively, and validated these values against simulations. A research work was conducted to evaluate distribution of temperature pattern in PV module under different conditions of surrounding environment; results showed that PV system efficiency was decreased by about 3.8–6.5% with the increase of module temperature in range of 10–15 °C [50]. One more experimental setup was made to lower the temperature of two 250 W PV panels to around 20 °C by air and water cooling, resulted in enhancing the module efficiency more than 3% and output power to 20.96 W [36]. The impact of water spray cooling effect was observed on the performance of monocrystalline PV module; improved the efficiency and output power by 14.1% and 16.3% respectively caused by reduced temperature from 54 °C to 24 °C [51]. An experimental study was performed to study the impact of operating parameters on panel performance; observed a decrease in output power and electrical efficiency of 0.37 W and 0.06% for every 1 °C rose in cell temperature. To minimize the impact of temperature, a cooling technique was presented, leading to reduction in temperature by 60% and hence, increased output power and efficiency by 8.04 W and 1.23%, respectively [52]. The performance of the polycrystalline PV module was experimentally determined with and without water circulation in copper tubes; it showed that panel temperature reduced to 15.23%, and hence electrical efficiency increased to 6.08% by a water flow of 0.0166 kg/s [53]. Ebrahimi et al. [54] analyzed an effect of natural vapor temperature on cooling performance of solar cells under solar simulator; results indicated that PV cell’s temperature was dropped approximately 7 °C to 16 °C when flow rate was increased to 1.6 to 5 gr·min−1 and caused increase in electrical efficiency to around 12.12% to 22.9%. Arcuri et al. [55] investigated the performance of PV panels, using cooling airflow systems in which a numerical model was developed for 4 solar device configurations and validated through experimental results with a sample weather data of Algiers site (a sunny day in Summer) and flow rate of air was 0.023 kg/s. The results regarding numerical criterion showed that the daily average of overall energy efficiency for PV module, conventional hybrid solar air collector, glazed hybrid solar air collector and glazed double-pass hybrid solar air collector was reached to 29.63%, 51.02%, 69.47% and 74% respectively [56]. Khanjari et al. [57] proposed a numerical model of PV/T system consisting of nano fluids and coolant fluids (pure water, Ag-water nanofluid and Aluminum-water nanofluid) through computational fluid dynamics (CFD) technique; they considered the conduction and convection heat transfer mechanisms, and the results showed that the maximum increased percentage of heat transfer coefficient versus volume fraction for Ag-water nanofluid and alumina-water were 43% and 12% respectively. The experiment yielded the following result: for alumina-water comparing to pure water, an increment of 8–10% was noted by the heat transfer coefficient with respect to fluid velocity at inlet. While this value for Ag-water nanofluid varies from 28% to 45% which is greatly greater than alumina-water. Zia R Tahir et al. [58] published an article for measured solar radiation data (hourly) at three stations of Pakistan; this study shows the availability of solar radiation data for the country. The Pakistan has huge potential for solar energy because of its geographical location and environmental conditions, moreover the solar energy is consistent throughout the country [59].
The aforementioned literature shows that cooling is an effective method to increase PV module efficiency and ensure energy security. Potential research could find temperature impact on PV modules by applying coolant devices. The solar irradiance profile is observed for a whole day of 1 May 2022 and the value at 12:00 p.m. is considered for the simulation in this research study. Furthermore, three-dimensional (3D) model of monocrystalline PV unit was developed to study the impact of temperature on its output. Trace pro simulations were also performed to check the optical behavior of the module under ray analysis. In addition, thermal analysis performed using Steady State Thermal Analysis to check the temperature profile, which further was coupled with Ansys Fluent to observe the improved temperature profile when air and water is passed through microchannels. Overall, improvement in the PV module’s electrical output and power profile were observed with respect to Reynolds number, in addition both laminar and turbulent flow boundary conditions were being assessed. This study is an addition to research work for investigation of mono-crystalline PV active cooling thermal system, this is first of its kind study for hot climate conditions of Pakistan as per author’s best knowledge. The contributions of this study will help researchers and specialists of renewable energy field, especially solar energy.

2. Methodology

Model Description

The performance of monocrystalline PV module was examined according to the environmental conditions of Lahore, Pakistan. The latitude and longitude of the selected place are 74.3587° E and 31.5204° N, respectively. The climatic conditions were contingent upon ambient and sky temperatures, wind speed, solar radiations, conductive and convective heat transfer coefficients for the day of 1 May 2022 at 12:00 p.m. only. Figure 1 shows the proposed model of 35 W output power equipped with monocrystalline photovoltaic technology, in addition to model. The operating temperature of module ranges between 40 °C to 85 °C as set by the manufacturer while voltage and current at maximum power are of 10 V and 3.5 A, whereas rest of the specifications of PV module can be seen in the Table 1. The back sheet of the proposed panel is replaced with aluminum absorber followed by aluminum base engrooved with 17 microchannels, their thermophysical properties can be observed in Table 2.
The microchannels arrangements were used in order to maintain working fluid flow through them so that PV panel’s performance can be enhanced. The description of microchannels, and the thermo-physical properties of selected working fluids are given in Table 3. In addition, water and air were chosen to be working fluids at room temperature (25 °C), and their flow was regulated mechanically to obtain the optimum results. Moreover, laminar and turbulent boundary conditions were maintained to check optimum temperature uniformity values, as various studies mentioned that lower values of temperature uniformity led the system towards higher lifecycle of the PV module.
Different studies declared that, if the working fluid has better thermophysical properties, especially density, then the cooling rate will definitely be higher, while some also equally emphasized the values of thermal conductivity, which can lead towards optimum heat transfer rates. In this research study, both of the values are higher and noticeable for water coolant. Fluid’s initial temperature is another critical parameter which has also greater importance towards heat dissipation. Optical properties are presented in Table 4, these properties have more attraction towards module’s cooling in term of conduction, and convection heat transfer mechanism. The given optical properties were utilized during simulation work inside Steady State Thermal Analysis (SSTA) for temperature profile, whereas for active cooling the coupling of SSTA with Ansys Fluent was made in an effort to perform analysis at various Reynolds number having range of 11 to 6710, which can be assessed in the results and also in discussion sections.

3. Numerical Approach

In this section, a numerical approach was opted in order to find out exact value of solar irradiance for the desired day for 1 May 2022. The following Equations (1)–(25) were used during this process, and are discussed here [60]:
G o n = G s c   1 + 0.033 cos 360   n 365   G s c   ( 1.000110 + 0.034221 cos β + 0.001280 sin β + 0.000719 cos 2 β + 0.000077 sin 2 β )  
β = ( n   1 )   360   365
where in Equation (1), Gon is the extra-terrestrial radiations falling on a specific plane during nth day of any year, while Gsc is solar constant approximately equals to 1367 W/m2. This decrement noted in this value per year is 0.02% in terms of frequency, n is a specific day (121 for present study). On the next hand β is a slope of the module, in this case it has been taken to be 0. The declination angle can either be determined by using Equation (3).
δ = 23.45   ×   sin 360   n + 284   365
In Equation (3), δ is declination angle for the proposed system, and the incidence angle plays an important role in designing the solar system geometry at any location across the globe. Thereafter, most of the design surfaces concerned about angle of incidence which is as follows:
cos θ = sin δ sin lcos β + cos δ cos lcos β cos ω sin δ sin β cos lcos γ + cos δ sin β sin γ sin ω + cos δ sin lsin β cos γ cos ω
In Equation (4), θ is the incidence angle, while γ is the surface azimuth angle. If the incidence angle greater than 90° is observed, it indicates that surface of the panel does not directly face Sun rather it is on back side of this surface. For zenith angle ( θ z ), Sunset hour angle ( ω s ), and solar hour angle ( ω ) are calculated by using Equations (5)–(7) respectively.
cos θ z = cos δ cos l cos ω + sin l sin ( δ )
cos ω s =   sin l   sin ( δ )     cos l   cos ( δ )   = tan l tan ( δ )
ω = 15   ( T s t 12 )
Furthermore, Equations (8)–(17) are also used to evaluate final figure of values for specified irradiance profile. The atmosphere has greater impact on radiation’s scattering and absorption time to time depending on weather casualties and air mass ratio. For an instance, clear sky conditions on the other hand have importance towards precise estimation. That’s why under these conditions the beam irradiance atmospheric transmittance ( τ b ) and some other correction factors are assessed by Equations (8)–(14) as per given below:
τ b = a 1 + a 2 exp K c o s θ z
a 1 = 0.4237 0.00821 6 A 2
a 2 = 0.5055 + 0.00595 6.5 A 2
K = 0.2711 + 0.01858 2.5 A 2
r 1 = a 1 a 1
r 2 = a 2 a 2
r K = K K
where K , a 1 , a 2 , K ,   a 1 , a 2 , are the atmospheric constants, and r 1 , r 2 , and r K are the correction factors depending upon varying climates that can be seen in Table 5 as well. In addition, A is the altitude of the location, which is taken to be 215 m for Lahore, Pakistan. Moreover, for beam and diffused radiations, the expressions are as follows, where the beam radiations ( G c n b ), the horizontal components ( G c b ), hourly beam radiations ( I b ), atmospheric transmittance for diffused radiations ( τ d ), diffuse radiations ( G c n d ), diffused horizontal components ( G c d ) and diffuse hourly radiations ( I d ), were calculated by using Equations (15)–(22) respectively at 12:00 p.m. of the selected day.
G c n b = G o n × τ b
G c b = G o n × τ b × c o s θ z
I b = I 0 × τ b × c o s θ z
τ d = 0.271 0.294   τ b
G c n d = G o n × τ d
G c d = G o n × τ d × c o s θ z
I d = I 0 × τ d × c o s θ z
I t = I b + I d
where I t is the total irradiance value of 920.64 W/m2 for at 12:00 p.m.
Finally, the temperature uniformity, electrical output and efficiency is found by Equations (23)–(26).
T u n i = T m a x T m i n
n r = V m p I m p A p v I t
n i e = n r 1 β T s c 25   ° C
P o u t = ( n ie   A p v I t ) / 100
where T u n i ,     T m a x ,   and   T m i n are temperature uniformity, maximum and minimum temperatures at the surface of the module, whereas, V m p ,   I m p , and A p v represent voltage and current at maximum power, and surface area of the PV module. Similarly, n r ,   n i e ,   β ,   and   T s c are the rated electrical efficiency (19.40%), improved electrical efficiency, temperature coefficient (0.47%/°C) and average temperature of the silicon layer.
A 3D modelling of the module is undertaken in Solidworks after finalizing major steps, and then simulation of the model was performed using Ansys Workbench 2020 R1 and Trace Pro 7.3.4 releases.

4. Results and Discussion

This section contains the results performed under following domains; as of irradiance profile (using equations), Trace Pro and Ansys Workbench software, which are discussed as under:

4.1. Irradiance Profile

The following figurative trend in Figure 2 shows irradiance profile for the whole day between 05:00 a.m. to 05:00 p.m. on 1 May 2022, obtained as per above mentioned equations. The day was considered to be under cloudless or clear sky conditions. The irradiance profile seems to be regular in pattern as the values started from 72.65 W/m2 at 06:00 a.m. with a smooth rise to 920.64 W/m2 at 12:00 p.m., thereafter same values received with downward trend and reached at same of initial at 04:00 p.m., can be seen clearly in the figure. Moreover, the beam irradiance had higher values as compared to diffuse irradiance because of no overcast atmospheric conditions, while diffuse irradiance can only be higher during cloudy weather. In addition, it is mentioned that the rating efficiency of a panel is 19.40%, that’s why merely 178.57 W/m2 is converted into electrical output while 742.7 W/m2 is available for heat generation at the surface of a PV module.

4.2. Irradiance Distribution

The entire geometry was imported into Trace Pro software, where a calculated irradiance value was used as an input parameter during ray tracing analysis which was performed for 1000 rays. The results are shown in Figure 3, where an irradiance map for absorbed flux emphasized that the average irradiance value on the panel surface is of 915.16 W/m2, while total flux and incident flux efficiency are observed to be 179.37 W/m2 and 99.405%, respectively. Second, the vertical and horizontal components of the incident flux on the center line of the module at 0-0 horizontal line can be seen at the right portion of the same figure.

4.3. Temperature Profile

In this section temperature contours at desired boundary conditions for PV module at 12:00 p.m. are simulated to estimate the panel temperature without active colling. It is obvious that the panel temperature varies around 65 °C at the top and middle surface of silicon cell’s layer which is liable for electrical generation. At this stage because of no cooling schemes, the efficiency of a panel found to be 15.65% which is ~20% less as compared to rated efficiency which can be notify in the Figure 4. On the other hand, the output power here is calculated to be 28.32 W. Although the temperature uniformity at no cooling stage is so small as that of 0.721 °C, but the results of active cooling are also important from investigation point of view, because the efficiency at this condition is not favorable.

4.4. Active Cooling at 2240 Re

For active cooling, water and air is selected as a coolant, for a case, in the following Figure 5 the temperature contours of only monocrystalline PV cell’s layer at Reynolds number of 2240 under water-based cooling condition through microchannels arrangements is available. It can be seen that maximum module temperature decreases to 48.078 °C showing temperature reduction around 27%. Moreover, the temperature of the PV cells layer is lower on inlet side of the microchannel heat sinks, where the efficiency would be higher while on higher temperature side just between the center and the outlet side of the panel the efficiency would be lower. The temperature uniformity as a whole model found to be 11.684 °C, which is inappropriate for this study, that’s why this study moved towards higher Reynolds number under turbulent boundary conditions. Similarly, Figure 6 represents temperature contours using air at room temperature (25 °C) with the same Reynolds number of 2240. In addition, it is noted that PV cell’s layer’s temperature is ranging between 71.716–36.892 °C, and the temperature uniformity is 34.871 °C. As compared to water, the results of air cooling through microchannels is found to be worthless.

4.5. Average Inlet Velocity and Coolant Outlet Temperature

Average inlet velocity and outlet temperature of a working fluid are important and has variant relationship with Reynolds number from 11 to 6710. In the Figure 7 the average inlet velocity of the water and air found to be at 0.01 and 0.17, 0.1 and 1.63, 0.2 and 3.3, 0.5 and 8.18, 1.0 and 16.36, 2.0 and 32.7, 4 and 60, and 6.0 m/s and 98 m/s with respect to Reynolds numbers of 11, 112, 224, 560, 1120, 2240, 4200, and 6710 respectively. Similarly, for coolant outlet temperatures, water shows a minimum value of 32.62 °C at 6710 Reynolds number, while a highest of 49.86 °C at 224 Reynolds number. In addition, for air as a coolant the difference in outlet temperature observed to be consistent with lower and higher temperature values are at 34.542 °C and 35.029 °C at 6710 and 11 Reynolds numbers.
Figure 4. Temperature contours on PV layer at desired boundary conditions before active cooling.
Sustainability 14 10228 g004
Figure 5. Temperature contours of PV layer under water cooling at Re = 2240.
Sustainability 14 10228 g005
Figure 6. Temperature contours of PV layer under air cooling at Re = 2240.
Sustainability 14 10228 g006
Figure 7. Average inlet velocity and outlet temperature of working fluids at different Reynolds number.
Sustainability 14 10228 g007
Moreover, water outlet temperature represents an appropriate relation with Reynolds number at turbulent boundary conditions above 4200, whereas air at outlet depicts remark-less changes in the temperature.

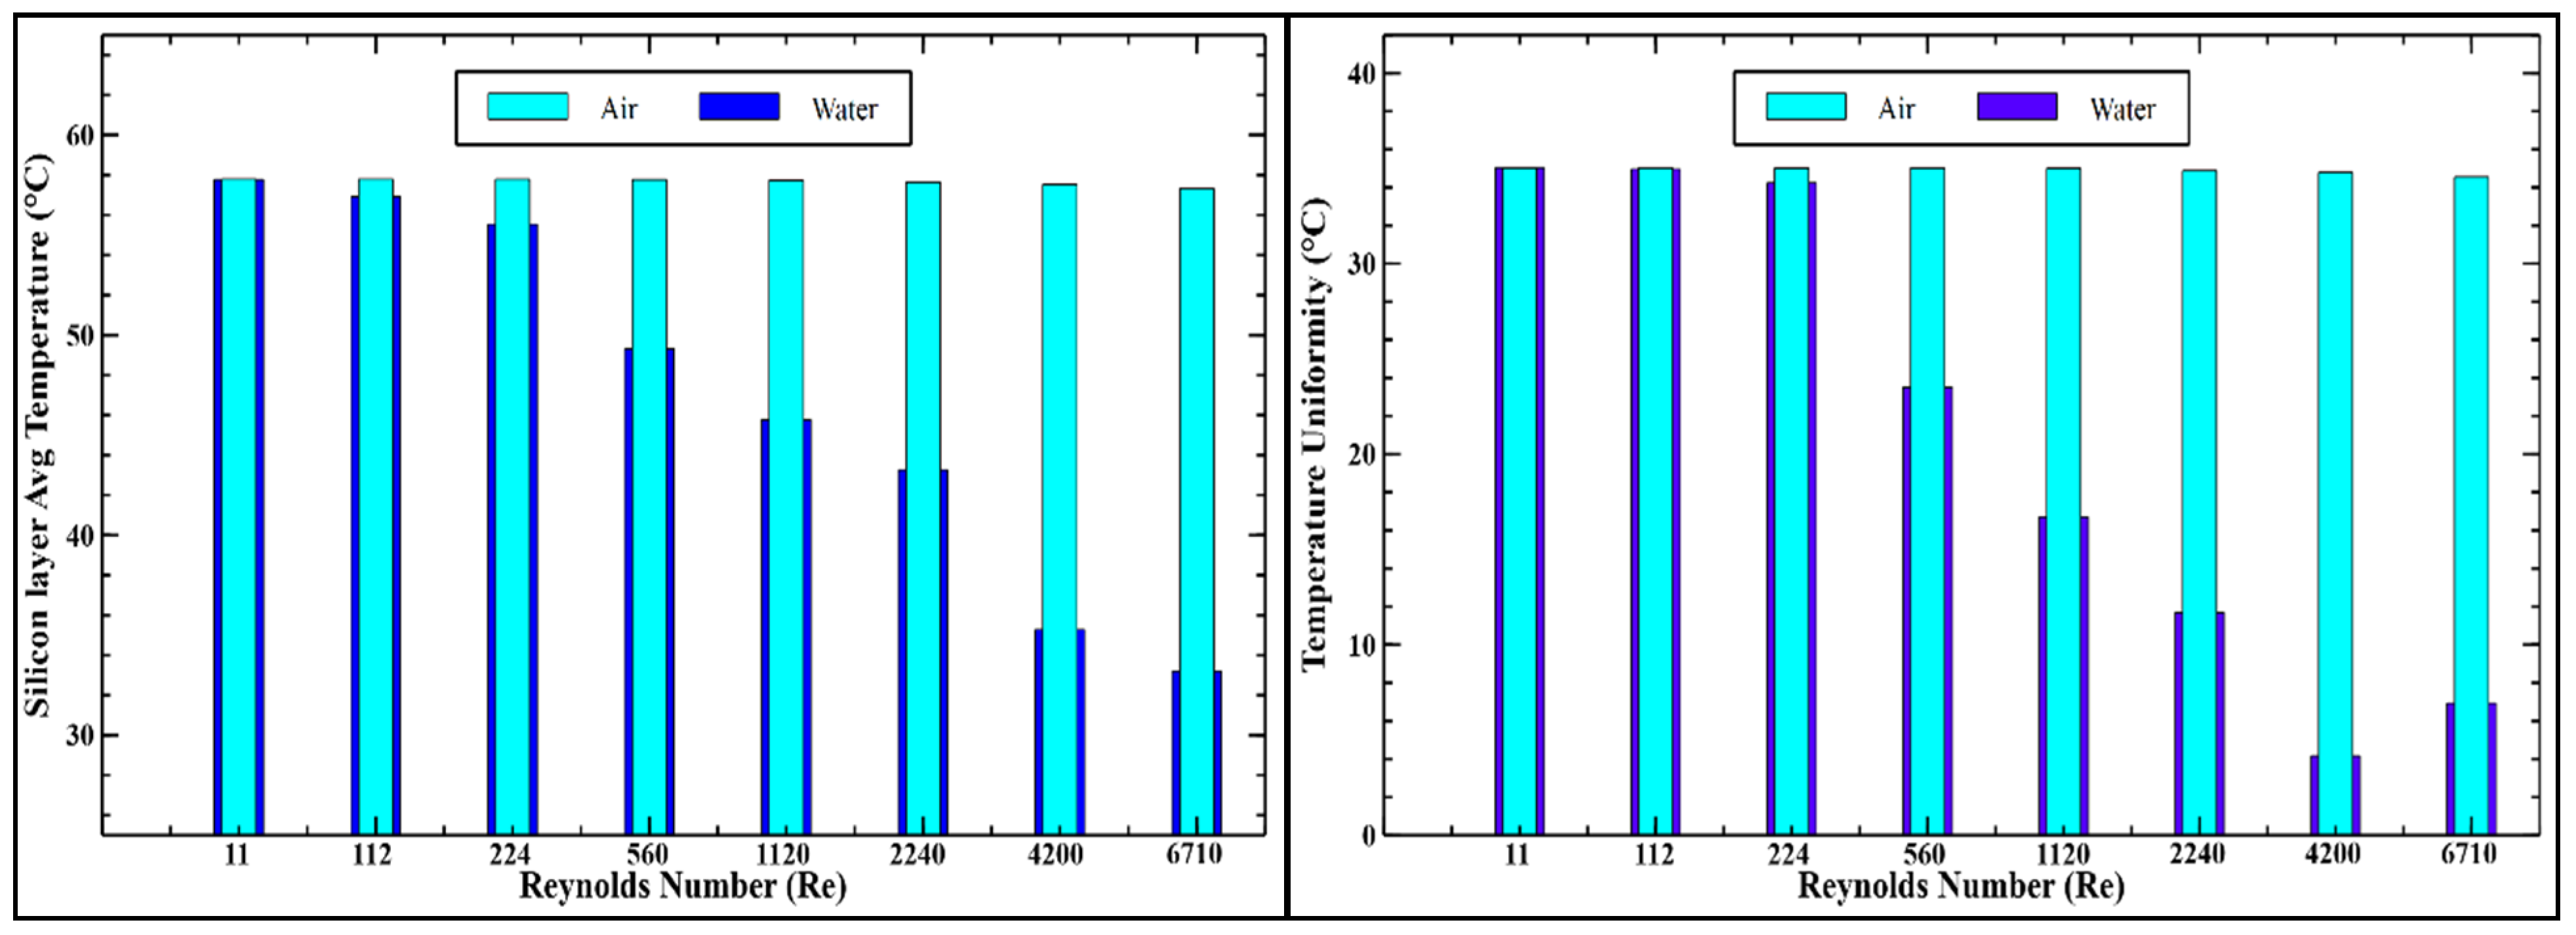
4.6. PV Cell’s Layer Average Temperature and Temperature Uniformity

Monocrystalline PV cell’s layer, which is responsible for power production mainly contingent upon the solar cell’s layer temperature. In this section the Figure 8 highlights the importance of how Reynolds number is conducive regarding lower temperature on the PV cell’s layer. In addition, PV layer’s temperature is decreasing from 57.77 °C to 33.21 °C at 11 to 6710 Reynold numbers, whereas air shows no improvement in term of temperature reduction of the PV layer as the digits were around 57.5 °C throughout the whole simulations. The graphical representation of both the graphs is same, however in an effort towards temperature uniformity the values for water-based cooling as compared to air cooling are much more efficient. At 4200 Reynolds number the temperature uniformity was optimum, means the value was 4.16 °C followed by 6.93 °C at 6710 Reynolds number. Furthermore, in case of air the values of temperature uniformity were between 35.029 °C to 34.542 °C during entire investigation, which shows less tendency towards air-based cooling. Overall, at maximum Reynolds number of 6710, the reduction in the PV layer’s temperature is found to be 32.42 °C for water and 8.31 °C for air, that’s why a better and effective option to increase performance of monocrystalline silicon PV module is water cooling in comparison with air.

4.7. Electrical Efficiency and Power Output

Electrical efficiency and power are implicated in the major findings of this study, because every single move is maintained in order to achieve as much as maximum and appropriate results. The below Figure 9 shows that the power output and electrical efficiency of the PV module at different values of Reynolds number varies efficiently. For example, the power output and electrical efficiency of PV module is found at 28.31 W and 15.65% respectively when no cooling technique is employed. In addition, when cooling of water took place through microchannels, the module efficiency increases from 16.40% to 18.65% with rise in Reynolds number from 11 to 6710 respectively. The maximum increment in efficiency is found 18.65% at Re = 6710 or 6 m/s with respect to the module efficiency at without cooling. Secondly, when air cooling option opted, the module efficiency observed to be increased by 5.8% as compared to that of without cooling but remained constant with different Reynolds numbers. Moreover, the water-cooling technique had shown 14.0% more effectiveness than air-cooling method to improve an electrical efficiency of monocrystalline PV module. It can also be observed that water-cooling technique enhances the module output power dramatically from laminar to turbulent flow boundary conditions, while air-cooling technique does not contribute much more to improve output power. Regarding power output, the highest value (33.65 W) is achieved by water at 6710 Reynolds number, while air marked in power to 29.68 W only by the same highest Reynolds number.

5. Conclusions

The electrical efficiency and output of a monocrystalline PV module is investigated and enhanced through thermal management under real operating conditions of Lahore, Pakistan at the midday of May 1st, 2022 in this research study. The technical data of PV modules with a capacity of 35 W is taken at standard test conditions from manufacturers’ datasheets. Initially, the complete model was designed with minor changes at the bottom layers, where base protective sheet was replaced with Aluminium absorber and heat sinks layer made up of Aluminium with 17 microchannels. Thereafter, a location-based irradiance profile (920.64 W/m2) was calculated by using multiple equations from the literature and imported to a Trace pro software followed by Ansys Workbench. The ray tracing analysis was performed for 1000 rays inside a Trace pro software and observed optical properties: a total flux absorbed by the surface found to be 179.37 W/m2. The steady state thermal analysis was performed and temperature profile over a whole model is observed and temperature profile of only PV layer was displayed. Moreover, the PV cell’s layer’s temperature was found to be ~65 °C and at this situation the efficiency and power dropped down to 15.65% and 28.32 W from 19.40% and 35 W respectively. A coupling of steady state thermal analysis and Ansys fluent was developed to perform cooling practices. Water and air were used as a coolant through microchannel heatsinks at varying Reynolds number from 11 to 6710. In addition, both laminar and turbulent boundary flow conditions applied to check out the most prominent coolant at 25 °C inlet and back flow temperature during the simulation. Throughout all the simulations, water-based cooling is observed to be practical instead of air-based cooling because of the higher density of the water. The results declared that during laminar flow boundary conditions, water achieved maximum outlet temperature of 49.86 °C and 48.71°C as a coolant at 224 and 560 Reynolds numbers respectively as compared to turbulent flow boundary conditions. The second coolant air on the other hand represented a remark-less trend at outlet with almost consistent values (47.805 °C) during turbulent flow boundary condition. Interestingly, the trend in PV cell’s layer average temperature and temperature uniformity is identical in observation; the PV cell’s temperature reduces directly to Reynolds numbers, and the most prominent case was observed at 6710 Reynolds number, where an optimum value of 32.42 °C is maintained for PV cell’s layer, whereas, for temperature uniformity, the value of 4.16 °C is achieved by water only. Similarly, for electrical efficiency and power output, again the water showed remarkable progression as that of air, because highest values are achieved at maximum Reynolds number of 6710, where electrical efficiency and power output retrieved to 18.65% and 33.65 W respectively from 15.65% and 28.31 W respectively. Overall, the values maintained by water found to be 14.00% more than that of air, which led this study in support of water only.

Author Contributions

Conceptualization, M.A. (Muhammad Asim); Formal analysis, J.M. and M.A.M.; Funding acquisition, A.H.S.; Investigation, H.I.K.; Software, M.A.M. and M.A.K.; Validation, M.A. (Muhammad Abdullah); Writing—original draft, M.A. (Muhammad Asim); Writing—review & editing, J.M., H.I.K., M.H.T., M.A.M., A.H.S., M.A. (Muhammad Abdullah) and M.A.K. All authors have read and agreed to the published version of the manuscript.

Funding

This research was funded by KETTHA 201801, UNITEN.

Institutional Review Board Statement

Not applicable.

Informed Consent Statement

Not applicable.

Data Availability Statement

Not applicable.

Acknowledgments

The authors would like to extend their sincere appreciation to KETTHA 201801, UNITEN for helping us to complete this project.

Conflicts of Interest

The authors declare no conflict of interest.

Nomenclature

Acronyms
PVPhotovoltaic
STCStandard test conditions
SSTASteady state thermal test analysis
Symbols
PmaxPeak power
VmpVoltage at peak power
ImpCurrent at peak power
VocOpen circuit voltage
IscShort circuit current
GonExtraterrestrial radiation (W/m2)
GscSolar constant value (W/m2)
GcnbBeam radiation (W/m2)
GcbBeam horizontal component (W/m2)
GcndDiffuse radiation (W/m2)
GcdDiffuse horizontal component (W/m2)
IbHourly beam radiation (W/m2)
IdHourly diffuse radiation (W/m2)
τdAtmospheric transmittance for diffuse radiation
ItTotal irradiance (W/m2)
TuniTemperature uniformity (°C)
TmaxMaximum temperature (°C)
TminMinimum temperature (°C)
ApvSurface area of PV module (m2)
ICurrent (A)
kStephan Boltzmann constant, 1.3807 × 10⁻²³ (J/K)
nDay of year
AAltitude
TTemperature (°C)
TsSky Temperature (°C)
tTime (s)
Greek symbols
ηrRated electrical efficiency (%)
ηieImproved electrical efficiency (%)
τTransmissivity
αAbsorptivity
ρDensity (kg/m3)
ϵEmissivity
θAngle of Incidence
θzZenith angle
ωSolar-hour angle
ωsSunset-hour angle
βSlope of module
δDeclination angle
γSurface azimuth angle
σStefan–Boltzmann constant (5.670 × 10⁻⁸ W/m2·K4)
Subscript
maxMaximum
minMinimum
uniUniform
mpMaximum power
ieImproved efficiency
refReference conditions
ocOpen circuit
scshort circuit

References

  1. Mostafaeipour, A.; Bidokhti, A.; Fakhrzad, M.-B.; Sadegheih, A.; Mehrjerdi, Y.Z. A new model for the use of renewable electricity to reduce carbon dioxide emissions. Energy 2021, 238, 121602. [Google Scholar] [CrossRef]
  2. Tian, J.; Yu, L.; Xue, R.; Zhuang, S.; Shan, Y. Global low-carbon energy transition in the post-COVID-19 era. Appl. Energy 2021, 307, 118205. [Google Scholar] [CrossRef] [PubMed]
  3. Abbasi, K.R.; Shahbaz, M.; Zhang, J.; Irfan, M.; Alvarado, R. Analyze the environmental sustainability factors of China: The role of fossil fuel energy and renewable energy. Renew. Energy 2022, 187, 390–402. [Google Scholar] [CrossRef]
  4. Wang, X.; Yan, L. Driving factors and decoupling analysis of fossil fuel related-carbon dioxide emissions in China. Fuel 2022, 314, 122869. [Google Scholar] [CrossRef]
  5. Asim, M.; Usman, M.; Abbasi, M.S.; Ahmad, S.; Mujtaba, M.A.; Soudagar, M.E.M.; Mohamed, A. Estimating the Long-Term Effects of National and International Sustainable Transport Policies on Energy Consumption and Emissions of Road Transport Sector of Pakistan. Sustainability 2022, 14, 5732. [Google Scholar] [CrossRef]
  6. Pérez, J.C.; González, A.; Díaz, J.P.; Expósito, F.J.; Felipe, J. Climate change impact on future photovoltaic resource potential in an orographically complex archipelago, the Canary Islands. Renew. Energy 2018, 133, 749–759. [Google Scholar] [CrossRef]
  7. Asim, M.; Muhammad, S.; Amjad, M.; Abdullah, M.; Mujtaba, M.A.; Kalam, M.A.; Mousa, M.; Soudagar, M.E.M. Design and Parametric Optimization of the High-Speed Pico Waterwheel for Rural Electrification of Pakistan. Sustainability 2022, 14, 6930. [Google Scholar] [CrossRef]
  8. Tahir, Z.u.R.; Asim, M.; Azhar, M.; Moeenuddin, G.; Farooq, M. Correcting solar radiation from reanalysis and analysis datasets with systematic and seasonal variations. Case Stud. Therm. Eng. 2021, 25, 100933. [Google Scholar] [CrossRef]
  9. Tahir, Z.u.R.; Amjad, M.; Asim, M.; Azhar, M.; Farooq, M.; Ali, M.J.; Ahmad, S.U.; Amjad, G.M.; Hussain, A. Improving the accuracy of solar radiation estimation from reanalysis datasets using surface measurements. Sustain. Energy Technol. Assess. 2021, 47, 101485. [Google Scholar] [CrossRef]
  10. Tahir, Z.u.R.; Hafeez, S.; Asim, M.; Amjad, M.; Farooq, M.; Azhar, M.; Amjad, G.M. Estimation of daily diffuse solar radiation from clearness index, sunshine duration and meteorological parameters for different climatic conditions. Sustain. Energy Technol. Assess. 2021, 47, 101544. [Google Scholar] [CrossRef]
  11. Tahir, Z.; Ahmad, S.U.; Asim, M.; Hayat, N.; Azhar, M.; Hussain, A. Evaluation of solar radiation from MERRA, MERRA-2, ERA-Interim and CFSR reanalysis datasets against surface observations for Multan, Pakistan. In Proceedings of the ISES EuroSun 2018 Conference—12th International Conference on Solar Energy for Buildings and Industry, EuroSun 2018/ISES Conference, Rapperswil, Switzerland, 10–13 September 2018. [Google Scholar] [CrossRef]
  12. International Renewable Energy Agency. Renewable Capacity Highlights; International Renewable Energy Agency: Abu Dhabi, United Arab Emirates, 2021. [Google Scholar]
  13. Liu, L. Comment on “Recent progress in thermodynamics of radiation—Exergy of radiation, effective temperature of photon and entropy constant of photon”. Sci. China Ser. E Technol. Sci. 2009, 52, 1809–1810. [Google Scholar] [CrossRef]
  14. Shah, A.S.B.M.; Yokoyama, H.; Kakimoto, N. High-Precision Forecasting Model of Solar Irradiance Based on Grid Point Value Data Analysis for an Efficient Photovoltaic System. IEEE Trans. Sustain. Energy 2015, 6, 474–481. [Google Scholar] [CrossRef]
  15. Hasan, A.; Sarwar, J.; Shah, A.H. Concentrated photovoltaic: A review of thermal aspects, challenges and opportunities. Renew. Sustain. Energy Rev. 2018, 94, 835–852. [Google Scholar] [CrossRef]
  16. Allouhi, A.; Saadani, R.; Buker, M.; Kousksou, T.; Jamil, A.; Rahmoune, M. Energetic, economic and environmental (3E) analyses and LCOE estimation of three technologies of PV grid-connected systems under different climates. Sol. Energy 2018, 178, 25–36. [Google Scholar] [CrossRef]
  17. Jones, R.K.; Ermer, J.H.; Fetzer, C.M.; King, R.R. Evolution of Multijunction Solar Cell Technology for Concentrating Photovoltaics. Jpn. J. Appl. Phys. 2012, 51, 10ND01. [Google Scholar] [CrossRef]
  18. Cotal, H.; Fetzer, C.; Boisvert, J.; Kinsey, G.; King, R.; Hebert, P.; Yoon, H.; Karam, N. III–V multijunction solar cells for concentrating photovoltaics. Energy Environ. Sci. 2009, 2, 174–192. [Google Scholar] [CrossRef]
  19. Bagher, A.M.; Vahid, M.M.A.; Mohsen, M. Types of solar cells and application. Am. J. Opt. Photonics 2015, 3, 94–113. [Google Scholar] [CrossRef]
  20. Zhou, J.; Yi, Q.; Wang, Y.; Ye, Z. Temperature distribution of photovoltaic module based on finite element simulation. Sol. Energy 2015, 111, 97–103. [Google Scholar] [CrossRef]
  21. Kichou, S.; Wolf, P.; Silvestre, S.; Chouder, A. Analysis of the behaviour of cadmium telluride and crystalline silicon photovoltaic modules deployed outdoor under humid continental climate conditions. Sol. Energy 2018, 171, 681–691. [Google Scholar] [CrossRef]
  22. Jestin, Y. 1.26—Down-Shifting of the Incident Light for Photovoltaic Applications. In Comprehensive Renewable Energy; Sayigh, A., Ed.; Elsevier: Oxford, UK, 2012; pp. 563–585. [Google Scholar]
  23. Saleem, M.W.; Abbas, A.; Asim, M.; Uddin, G.M.; Chaudhary, T.N.; Ullah, A. Design and cost estimation of solar powered reverse osmosis desalination system. Adv. Mech. Eng. 2021, 13, 16878140211029090. [Google Scholar] [CrossRef]
  24. Ameur, A.; Berrada, A.; Loudiyi, K.; Adomatis, R. Chapter 6—Performance and energetic modeling of hybrid PV systems coupled with battery energy storage. In Hybrid Energy System Models; Berrada, A., El Mrabet, R., Eds.; Academic Press: Cambridge, MA, USA, 2021; pp. 195–238. [Google Scholar]
  25. Dubey, S.; Sarvaiya, J.N.; Seshadri, B. Temperature Dependent Photovoltaic (PV) Efficiency and Its Effect on PV Production in the World—A Review. Energy Procedia 2013, 33, 311–321. [Google Scholar] [CrossRef]
  26. Mekhilef, S.; Saidur, R.; Kamalisarvestani, M. Effect of dust, humidity and air velocity on efficiency of photovoltaic cells. Renew. Sustain. Energy Rev. 2012, 16, 2920–2925. [Google Scholar] [CrossRef]
  27. Amelia, A.; Irwan, Y.M.; Leow, W.Z.; Irwanto, M.; Safwati, I.; Zhafarina, M. Investigation of the effect temperature on photovoltaic (PV) panel output performance. Int. J. Adv. Sci. Eng. Inf. Technol. 2016, 6, 682–688. [Google Scholar]
  28. Bora, B.; Kumar, R.; Sastry, O.S.; Prasad, B.; Mondal, S.; Tripathi, A.K. Energy rating estimation of PV module technologies for different climatic conditions. Sol. Energy 2018, 174, 901–911. [Google Scholar] [CrossRef]
  29. Mussard, M.; Amara, M. Performance of solar photovoltaic modules under arid climatic conditions: A review. Sol. Energy 2018, 174, 409–421. [Google Scholar] [CrossRef]
  30. Ameur, A.; Sekkat, A.; Loudiyi, K.; Aggour, M. Performance evaluation of different photovoltaic technologies in the region of Ifrane, Morocco. Energy Sustain. Dev. 2019, 52, 96–103. [Google Scholar] [CrossRef]
  31. Chakraborty, V.; Yadav, S.K.; Bajpai, U. Thermal Regulation of Solar Photovoltaic Modules by Incorporating Phase Change Materials to Enhance the Yield. In Proceedings of the Symposium on Power Electronic and Renewable Energy Systems Control; Springer: Singapore, 2021. [Google Scholar]
  32. Radziemska, E. The effect of temperature on the power drop in crystalline silicon solar cells. Renew. Energy 2003, 28, 1–12. [Google Scholar] [CrossRef]
  33. Congedo, P.M.; Malvoni, M.; Mele, M.; De Giorgi, M.G. Performance measurements of monocrystalline silicon PV modules in South-eastern Italy. Energy Convers. Manag. 2013, 68, 1–10. [Google Scholar] [CrossRef]
  34. Cañete, C.; Carretero, J.; Sidrach-De-Cardona, M. Energy performance of different photovoltaic module technologies under outdoor conditions. Energy 2014, 65, 295–302. [Google Scholar] [CrossRef]
  35. Chidubem, E.A.; Uhunmwangho, R.; Big-Alabo, A.; Omorogiuwa, E. Impact of ambient temperature on the power output of a photovoltaic module in Kaduna state, Nigeria. J. Eng. 2021, 18, 294–303. [Google Scholar]
  36. Idoko, L.; Anaya-Lara, O.; McDonald, A. Enhancing PV modules efficiency and power output using multi-concept cooling technique. Energy Rep. 2018, 4, 357–369. [Google Scholar] [CrossRef]
  37. Aly, S.P.; Ahzi, S.; Barth, N. Effect of physical and environmental factors on the performance of a photovoltaic panel. Sol. Energy Mater. Sol. Cells 2019, 200, 109948. [Google Scholar] [CrossRef]
  38. Tihane, A.; Boulaid, M.; Elfanaoui, A.; Nya, M.; Ihlal, A. Performance analysis of mono and poly-crystalline silicon photovoltaic modules under Agadir climatic conditions in Morocco. Mater. Today Proc. 2019, 24, 85–90. [Google Scholar] [CrossRef]
  39. Zdyb, A.; Gulkowski, S. Performance Assessment of Four Different Photovoltaic Technologies in Poland. Energies 2020, 13, 196. [Google Scholar] [CrossRef]
  40. Amar, S.; Bahich, M.; Bentahar, Y.; Afifi, M.; Barj, E. A Study of the Temperature Influence on Different Parameters of Mono-Crystalline Silicon Photovoltaic Module. J. Power Energy Eng. 2021, 9, 29–42. [Google Scholar] [CrossRef]
  41. Hadidi, A.; Blal, M.; Saba, D. The study of the arid climate effect on the performance of photovoltaic system. Energy Syst. 2021, 1–20. [Google Scholar] [CrossRef]
  42. Mustafa, R.J.; Gomaa, M.R.; Al-Dhaifallah, M.; Rezk, H. Environmental Impacts on the Performance of Solar Photovoltaic Systems. Sustainability 2020, 12, 608. [Google Scholar] [CrossRef]
  43. Gangopadhyay, U.; Jana, S.; Das, S. State of Art of Solar Photovoltaic Technology. Conf. Pap. Energy 2013, 2013, 764132. [Google Scholar] [CrossRef]
  44. Nader, N.; Al-Kouz, W.; Al-Dahidi, S. Assessment of Existing Photovoltaic System with Cooling and Cleaning System: Case Study at Al-Khobar City. Processes 2019, 8, 9. [Google Scholar] [CrossRef]
  45. Shukla, A.; Kant, K.; Sharma, A.; Biwole, P.H. Cooling methodologies of photovoltaic module for enhancing electrical efficiency: A review. Sol. Energy Mater. Sol. Cells 2017, 160, 275–286. [Google Scholar] [CrossRef]
  46. Siecker, J.; Kusakana, K.; Numbi, B. A review of solar photovoltaic systems cooling technologies. Renew. Sustain. Energy Rev. 2017, 79, 192–203. [Google Scholar] [CrossRef]
  47. Arifin, Z.; Tjahjana, D.D.D.P.; Hadi, S.; Rachmanto, R.A.; Setyohandoko, G.; Sutanto, B. Numerical and Experimental Investigation of Air Cooling for Photovoltaic Panels Using Aluminum Heat Sinks. Int. J. Photoenergy 2020, 2020, 1–9. [Google Scholar] [CrossRef]
  48. Chandra, S.; Agrawal, S.; Chauhan, D. Effect of ambient temperature and wind speed on performance ratio of polycrystalline solar photovoltaic module: An experimental analysis. Int. Energy J. 2018, 18, 2. [Google Scholar]
  49. Chandra, S.; Agrawal, S.; Chauhan, D. Soft computing based approach to evaluate the performance of solar PV module considering wind effect in laboratory condition. Energy Rep. 2018, 4, 252–259. [Google Scholar] [CrossRef]
  50. Jaszczur, M.; Hassan, Q.; Teneta, J.; Majewska, E.; Zych, M. An Analysis of Temperature Distribution in Solar Photovoltaic Module under Various Environmental Conditions. In MATEC Web of Conferences; EDP Sciences: Les Ulis, France, 2018. [Google Scholar]
  51. Nižetić, S.; Čoko, D.; Yadav, A.; Grubišić-Čabo, F. Water spray cooling technique applied on a photovoltaic panel: The performance response. Energy Convers. Manag. 2016, 108, 287–296. [Google Scholar] [CrossRef]
  52. Rahman, M.; Hasanuzzaman, M.; Rahim, N. Effects of various parameters on PV-module power and efficiency. Energy Convers. Manag. 2015, 103, 348–358. [Google Scholar] [CrossRef]
  53. Singh, K.; Singh, S.; Kandpal, D.C.; Kumar, R. Experimental performance study of photovoltaic solar panel with and without water circulation. Mater. Today Proc. 2021, 46, 6822–6827. [Google Scholar] [CrossRef]
  54. Ebrahimi, M.; Rahimi, M.; Rahimi, A. An experimental study on using natural vaporization for cooling of a photovoltaic solar cell. Int. Commun. Heat Mass Transf. 2015, 65, 22–30. [Google Scholar] [CrossRef]
  55. Arcuri, N.; Reda, F.; De Simone, M. Energy and thermo-fluid-dynamics evaluations of photovoltaic panels cooled by water and air. Sol. Energy 2014, 105, 147–156. [Google Scholar] [CrossRef]
  56. Slimani, M.E.-A.; Amirat, M.; Kurucz, I.; Bahria, S.; Hamidat, A.; Chaouch, W.B. A detailed thermal-electrical model of three photovoltaic/thermal (PV/T) hybrid air collectors and photovoltaic (PV) module: Comparative study under Algiers climatic conditions. Energy Convers. Manag. 2017, 133, 458–476. [Google Scholar] [CrossRef]
  57. Khanjari, Y.; Pourfayaz, F.; Kasaeian, A. Numerical investigation on using of nanofluid in a water-cooled photovoltaic thermal system. Energy Convers. Manag. 2016, 122, 263–278. [Google Scholar] [CrossRef]
  58. Tahir, Z.u.R.; Asim, M.; Azhar, M.; Amjad, G.M.; Ali, M.J. Hourly global horizontal irradiance data of three stations in Punjab, Pakistan. Data Brief 2021, 38, 107371. [Google Scholar] [CrossRef] [PubMed]
  59. Tahir, Z.u.R.; Azhar, M.; Blanc, P.; Asim, M.; Imran, S.; Hayat, N.; Shahid, H.; Ali, H. The evaluation of reanalysis and analysis products of solar radiation for Sindh province, Pakistan. Renew. Energy 2020, 145, 347–362. [Google Scholar] [CrossRef]
  60. Duffie, J.A.; Beckman, W.A. Solar Engineering of Thermal Processes; John Wiley & Sons: Hoboken, NJ, USA, 2013. [Google Scholar]
Figure 1. Reference and proposed model for selected monocrystalline silicon PV module.
Sustainability 14 10228 g001
Figure 2. Solar irradiance profile for a whole day of 1 May 2022.
Sustainability 14 10228 g002
Figure 3. Incident absorbed flux along with solar irradiance profile at center of PV module in horizontal and vertical components.
Sustainability 14 10228 g003
Figure 8. Silicon layer average temperature and its temperature uniformity at varying Reynolds number.
Sustainability 14 10228 g008
Figure 9. Electrical-efficiency and power-output of monocrystalline PV module at different Reynolds number.
Sustainability 14 10228 g009
Table 1. Specifications of proposed model.
Dimension560 mm × 350 mm × 25 mm
Peak Power (Pmax)35 W
Voltage at Pmax (Vmp)10 V
Current at Pmax (Imp)3.5 A
Open Circuit Voltage (Voc)12 V
Short Circuit Current (Isc)3.85 A
Working temperature−40–85 °C
Standard Test Conditions (STC)1000 W/m2, 1.5 a.m., 25 °C Cell temperature
Table 2. Thermo-physical properties of different layers of monocrystalline PV module.
Material LayersThickness
(mm)
Density
(kg/m3)
Thermal Conductivity
(W/m·K)
Heat Capacity
(J/kg·K)
Top-glass3.2030000.980820
Front-EVA0.159600.3102090
PV-cell0.22330150712
Back-EVA0.159600.312090
Aluminium-absorber12719202.4871
Aluminium-base62719202.4871
Table 3. Dimensions of microchannels and thermophysical properties of working fluids.
No. of MicrochannelsMaterialDimensions
(mm)
Working-FluidThermal-Conductivity
(W/m-K)
Density of Fluid (kg/m3)Inlet Temperature (°C)
17Aluminium1.0 × 1.0 × 570Water0.6271925
17Aluminium1.0 × 1.0 × 570Air0.02421.22525
Table 4. Optical-parameters for specified layers.
ComponentCoefficient/ParametersValues
GlassTransmittivity0.9
Emissivity0.93
Absorptivity0.1
Solar CellAbsorptivity0.9
Emissivity0.9
Transmittivity0.02
Aluminium Absorber PlateEmissivity0.25
Absorptivity0.95
Table 5. Correction-factors for different climate types.
Climate-Typer1r2rk
Tropical0.950.981.02
Midlatitude summer0.970.991.02
Subarctic summer0.990.991.01
Midlatitude winter1.031.011
Publisher’s Note: MDPI stays neutral with regard to jurisdictional claims in published maps and institutional affiliations.

