
A Comprehensive Performance Evaluation of Chinese Energy Supply Chain under “Double-Carbon” Goals Based on AHP and Three-Stage DEA

Abstract
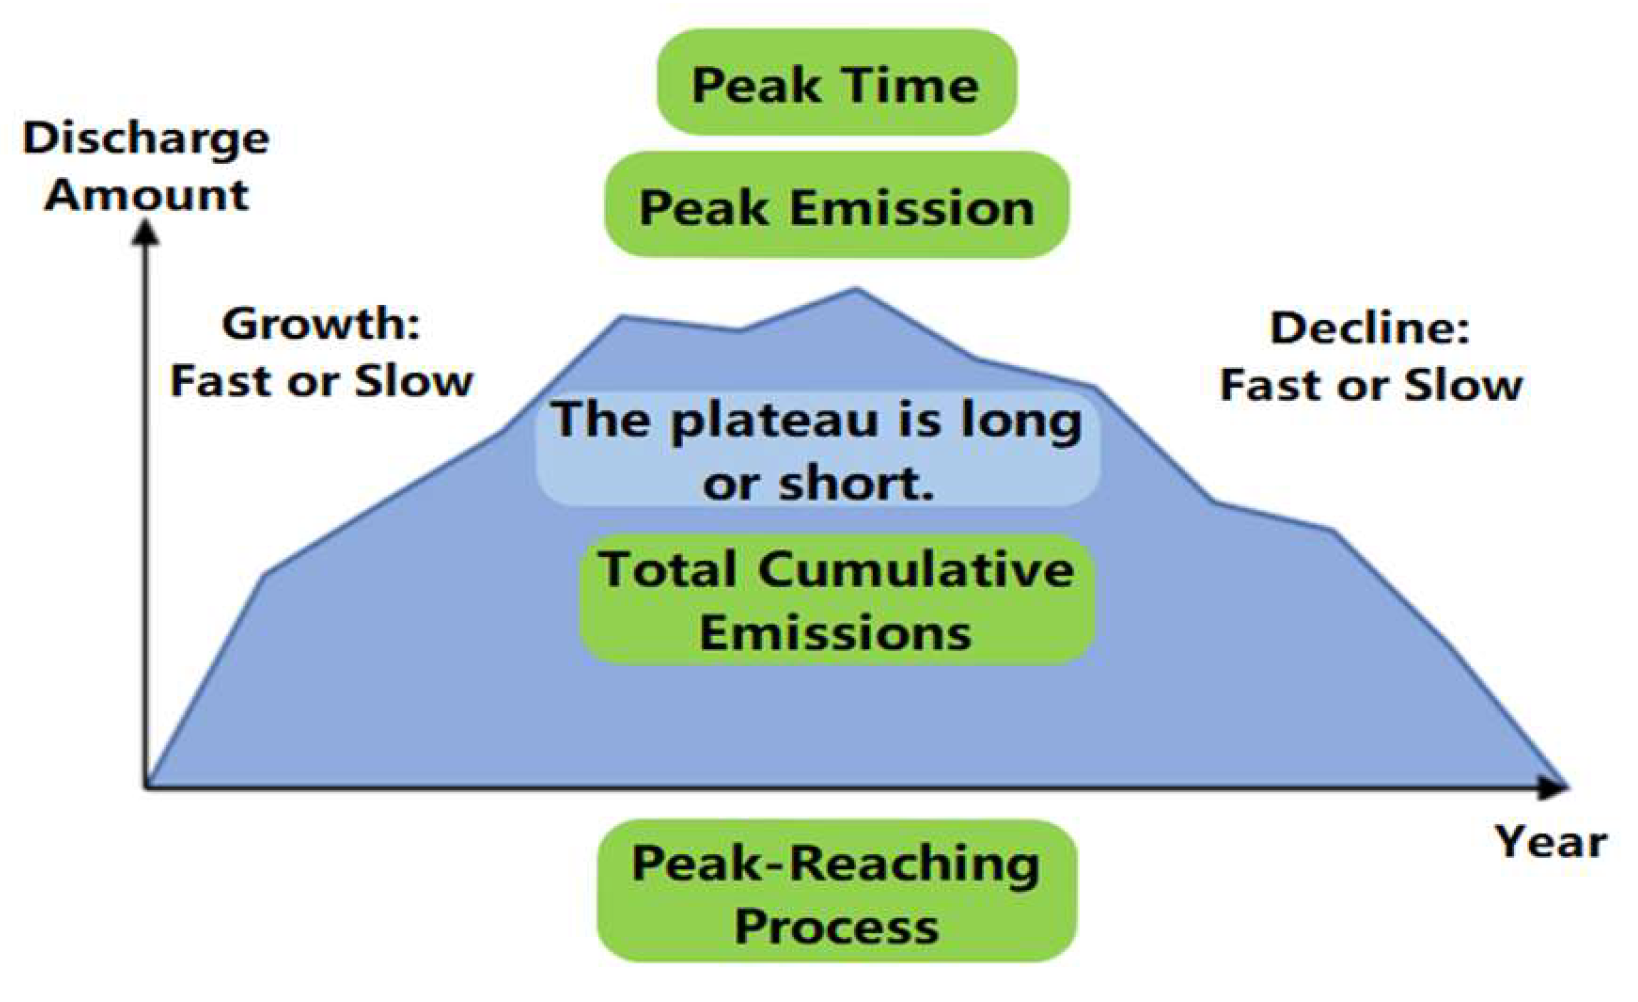
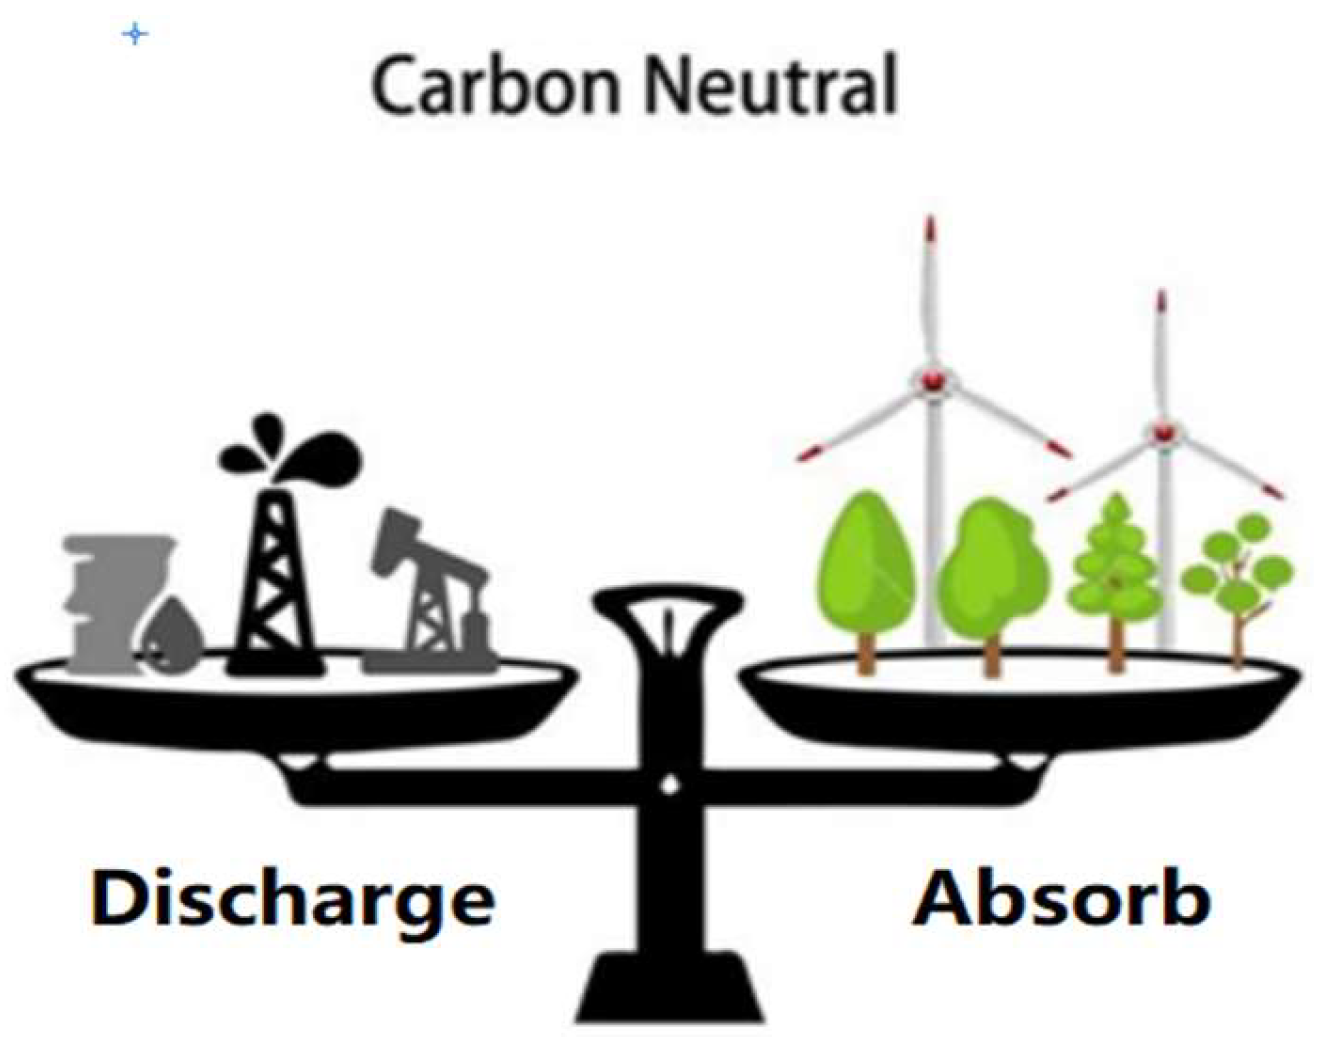
:1. Introduction
2. Literature Review
3. Materials and Methods
3.1. Theoretical Model
3.1.1. Analytic Hierarchy Process (AHP)
Establishing a Hierarchical Structure Model
Constructing a Judgment Matrix
Hierarchical Single Sorting and Its Consistency Test
General Ranking and Its Consistency Test
3.1.2. Three-Stage DEA Analysis
The First Stage: Measuring the Initial Efficiency Value Using DEA-BCC Model and DEA-CCR Model
The Second Stage: SFA Regression Analysis Eliminates the Influence of Environmental Noise Interference
The Third Stage: Calculate the Adjusted DEA Model Efficiency Value
3.2. Comprehensive Performance Evaluation Model Based on AHP and Three-Stage DEA
- Using the AHP method, calculate the weight of each first-level index relative to the total target;
- Classify the secondary indicators and construct the evaluation set of decision-making units of each indicator;
- Considering the influence of two environmental variables, which are the GDP growth rate and the total population growth rate at the end of the year, this paper uses a three-stage DEA model to calculate the technical efficiency () under the fixed return on scale model (namely the model, hereinafter abbreviated CRS) and the technical efficiency () and scale efficiency () under the variable return on scale model (i.e., the model, hereinafter abbreviated VRS) of each first-level index, respectively, indicating that the jth energy supply chain has an impact on the ith first-level index.
- Using the weight obtained by the above calculation and the efficiency evaluation values, we calculate and compare the comprehensive efficiency values , and of the jth energy supply chain (, where means the Chinese energy supply chain in 2010 and so on). The calculation formulas are as follows:
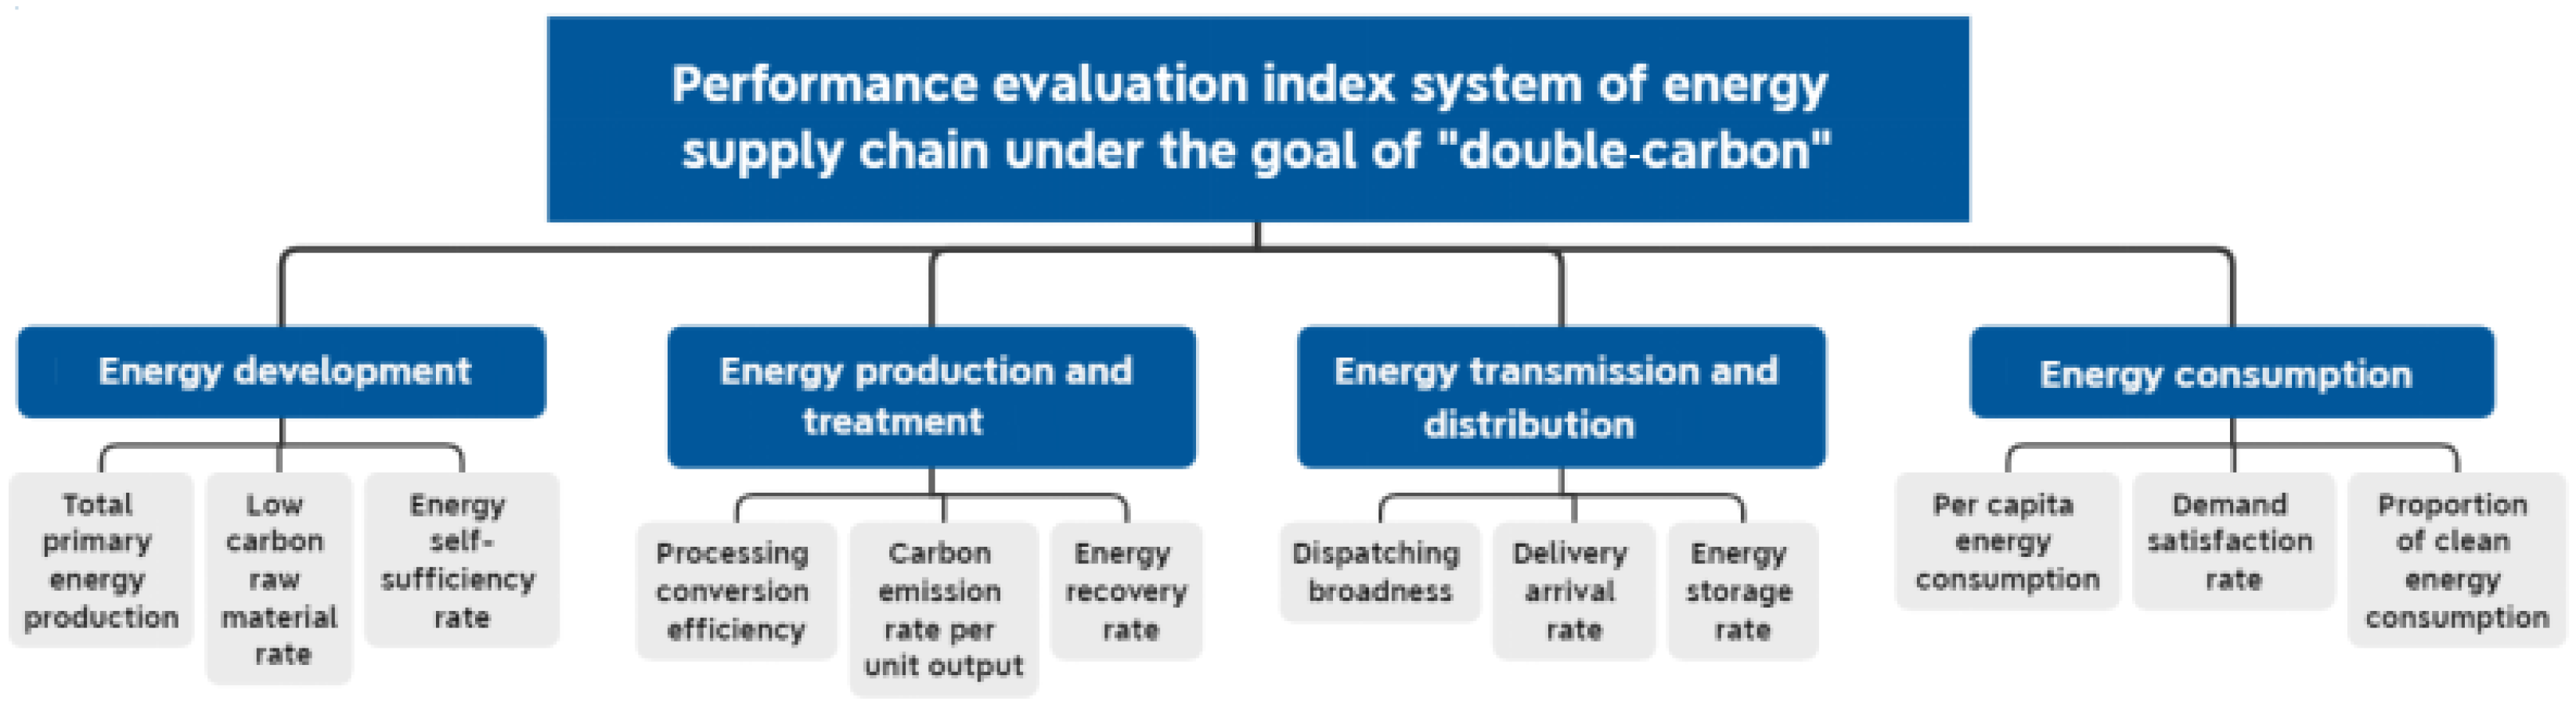
4. Construction of Performance Evaluation Index System of Energy Supply Chain under “Double-Carbon” Goals
4.1. Constructing an Index System Based on Energy Supply Chain Architecture
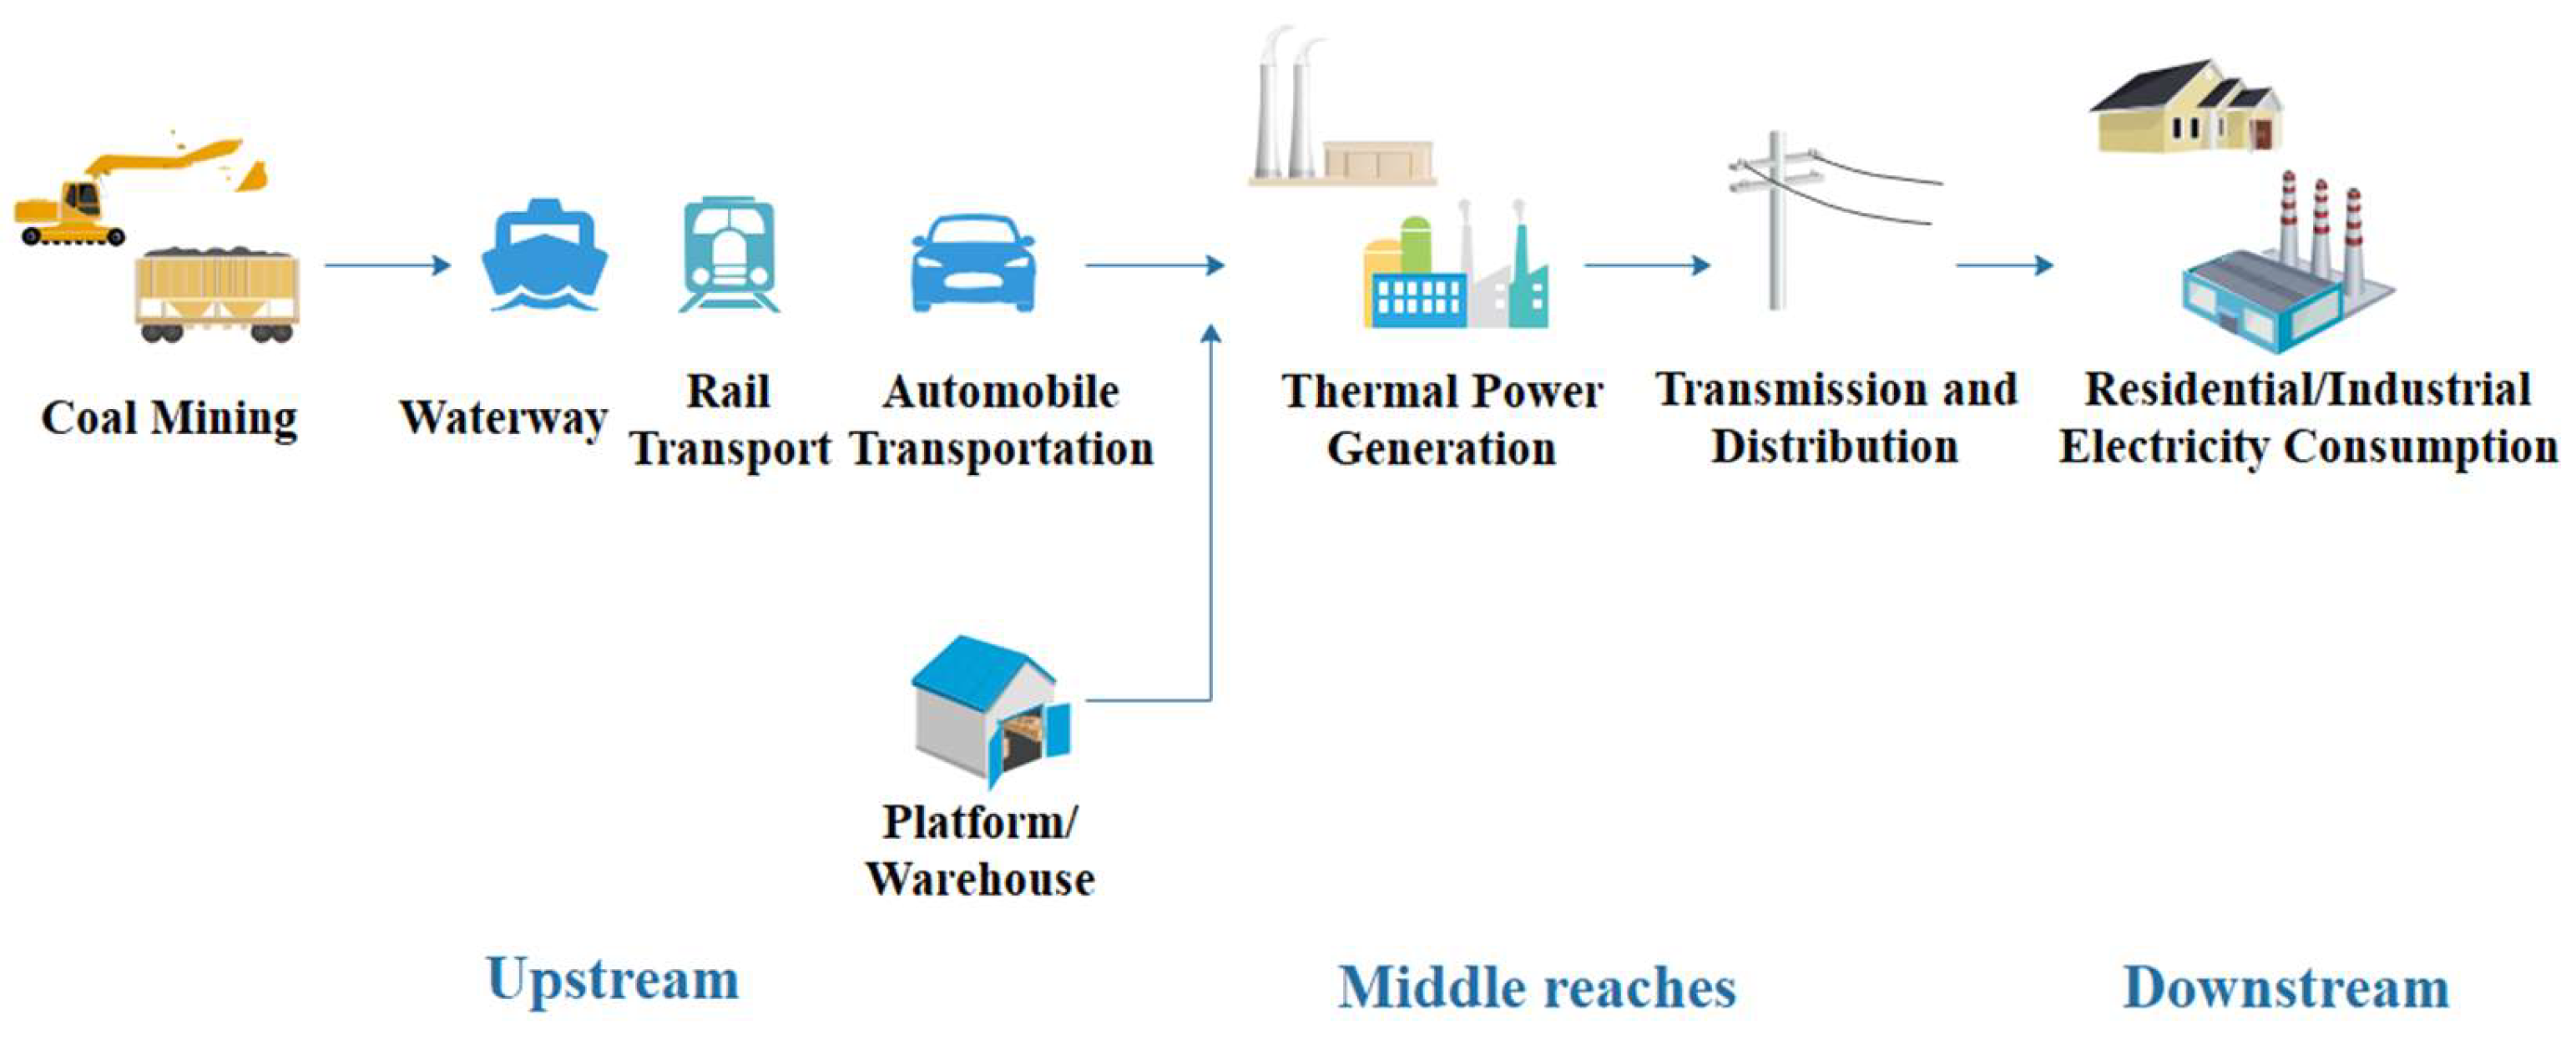
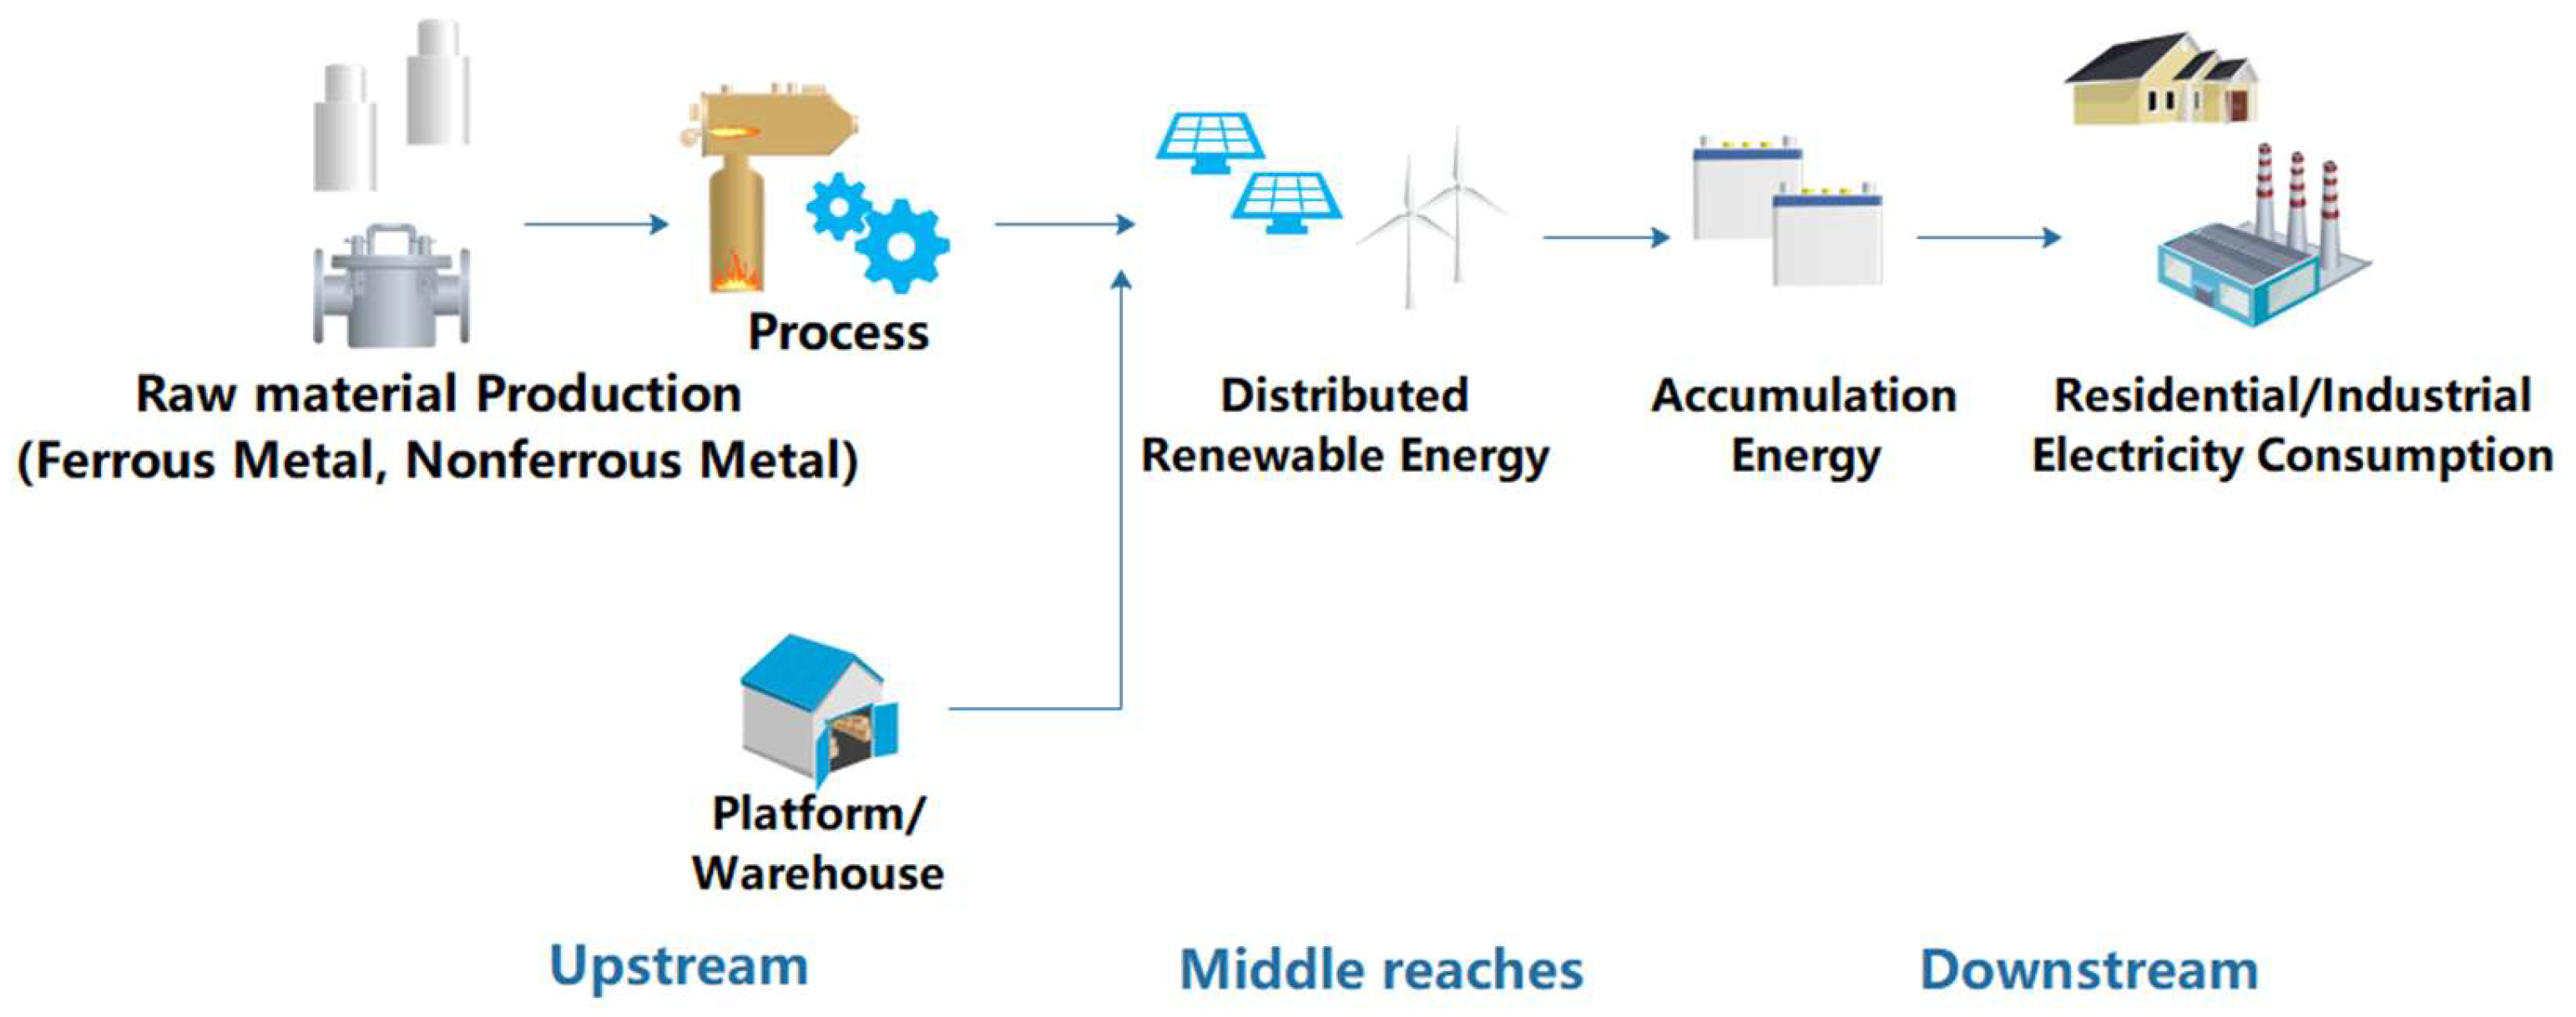
4.1.1. Energy Supply
4.1.2. Energy Production and Treatment
4.1.3. Energy Transmission and Distribution
4.1.4. Energy Consumption
4.2. Performance Evaluation Index System of Energy Supply Chain under the Goal of “Double- Carbon”
5. Relative Performance Evaluation of Chinese Energy Supply Chain Based on Three-Stage DEA
5.1. Data Acquisition and Description
5.2. Determination of First-Level Index Weight
5.3. Relative Performance Evaluation of Chinese Energy Supply Chain
5.3.1. Establishment of Input–Output Index Evaluation Set
5.3.2. Relative Performance Evaluation of Chinese Energy Supply Chain
5.4. Comparative Analysis of Traditional Energy Supply Chain and New Energy Supply Chain
6. Discussion
6.1. Level of Energy Supply
6.2. Level of Energy Production and Treatment
6.3. Level of Energy Transmission and Distribution
6.4. Level of Energy Consumption
7. Conclusions
- (1)
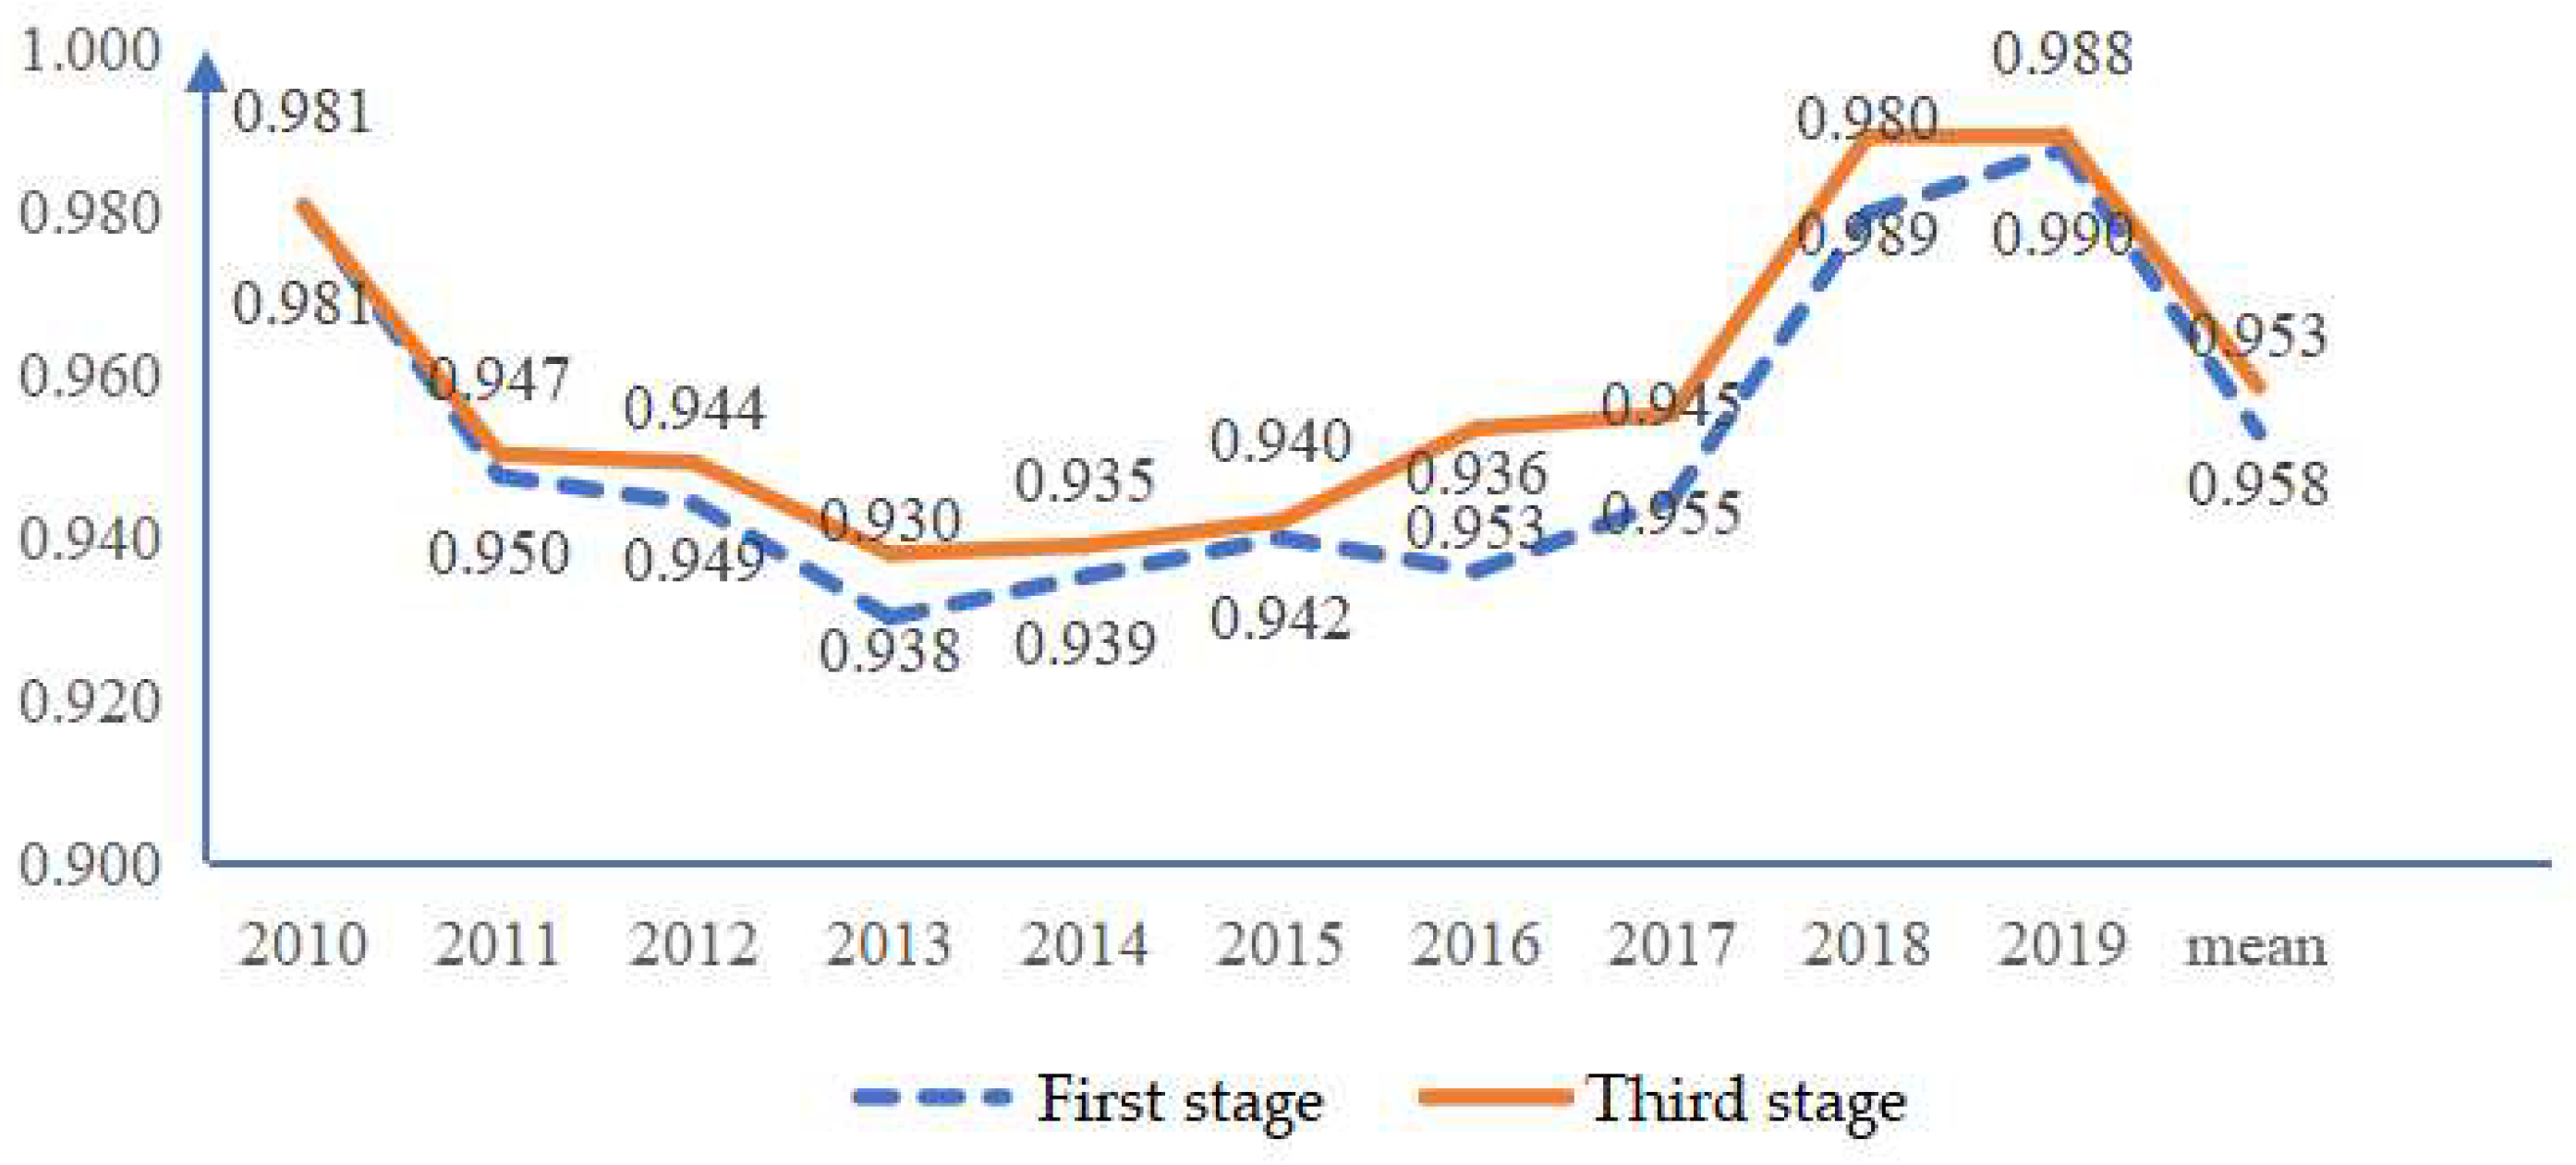
- Based on the analysis of three-stage DEA and after excluding environmental variables, we found that the comprehensive efficiency of the Chinese energy supply chain showed a trend of increasing year on year on the whole, but there was a downward trend from 2010 to 2013; the comprehensive technical efficiency and comprehensive scale efficiency reached the lowest value in 2013 and began to rise after 2013. Compared with other years, 2019 can be considered the efficiency frontier in the development of the Chinese energy industry. Looking back on the development process of the Chinese energy industry management system, China established a sound and systematic energy management system combining professional supervision and comprehensive management in 2013. In 2013, the coal industry entered a period of structural optimization and various policies have been issued to support the use of clean energy and curb the consumption of coal, including an action plan for the prevention and control of air pollution, issued by the State Council in 2013, and the 2014–2015 action plan for energy conservation, emission reduction and low-carbon development (GBF [2014] No. 23). The support of a reasonable energy industry management system and energy conservation and emission reduction policies was conducive to the efficient operation of the Chinese energy supply chain, which also provided financial support and an efficiency guarantee to help it carry out a green and low-carbon transformation. From 2017 to 2018, the efficiency of the Chinese energy supply chain increased significantly and reached the efficiency frontier in 2019.
- (2)
- Through data analysis, we found that the comprehensive performance of the energy supply chain has improved since 2016. In order to achieve the “double-carbon” goals, although the Chinese energy transmission and distribution infrastructure needed to be continuously improved and gradually expanded to cover the whole country in 2016 and the energy-storage technology had only entered the initial stage of commercialization, China had begun to introduce new environmentally friendly energy transmission and distribution infrastructure. We should innovate and develop double-carbon energy-storage technologies, realize the full marketization of new energy storage, increase the investment in clean raw materials at the source of energy production, develop clean energy conversion efficiency and so on. We also need to reduce the consumption and import of primary energy, such as coal and oil, improve production efficiency so as to increase the output of finished energy products and lay a solid foundation for achieving “double-carbon” goals.
Author Contributions
Funding
Institutional Review Board Statement
Informed Consent Statement
Data Availability Statement
Conflicts of Interest
References
- BP. Renewable Energy—Statistical Review of World Energy 2021. Available online: https://www.bp.com/content/dam/bp/business-sites/en/global/corporate/pdfs/energy-economics/statistical-review/bp-stats-review-2021-full-report.pdf (accessed on 5 January 2022).
- General Secretary Xi. Speeches at the General Debate of the 75th United Nations General Assembly. Available online: http://www.rmzxb.com.cn/c/2022-03-03/3062746.shtmlf (accessed on 3 March 2022).
- Darton, A. The causes of risk in fuel supply chains and their role in energy security. J. Clean. Prod. 2021, 324, 129254. [Google Scholar] [CrossRef]
- Nyga-Lukaszewska, H.; Aruga, K.; Stala-Szlugaj, K. Energy Security of Poland and Coal Supply: Price Analysis. Sustainability 2020, 12, 2541. [Google Scholar] [CrossRef]
- Park, H. Quantitative Assessment of Energy Supply Security: Korea Case Study. Sustainability 2021, 13, 1854. [Google Scholar] [CrossRef]
- Van der Linden, R.; Ryvo Octaviano, H.B.; Busking, T. Security of Supply in Gas and Hybrid Energy Networks. Energies 2021, 14, 792. [Google Scholar] [CrossRef]
- Horak, D.; Hainoun, A.; Neumann, H. Techno-economic optimisation of long-term energy supply strategy of Vienna city. Energy Policy 2021, 158, 112554. [Google Scholar] [CrossRef]
- Chaudry, M.; Jayasuriya, L.; Jenkins, N. Modelling of integrated local energy systems: Low-carbon energy supply strategies for the Oxford-Cambridge arc region. Energy Policy 2021, 157, 112474. [Google Scholar] [CrossRef]
- Tsao, Y.; Thanh, V.; Jy, L.; Hs, W. A risk-sharing-based resilient renewable energy supply net-work model under the COVID-19 pandemic. Sustain. Prod. Consum. 2021, 25, 484–498. [Google Scholar] [CrossRef]
- Rafique, R.; Jat, M.; Hakeem-Ur-Rehman, C.; Muhammad, A.Z. Bioenergy supply chain optimization for addressing energy deficiency: A dynamic model for large-scale network designs. J. Clean. Prod. 2021, 318, 128495. [Google Scholar] [CrossRef]
- Gernaat David, E.H.J.; de Boer, H.S.; Daioglou, V.; Yalew, S.G.; Müller, C.; Van Vuuren, D.P. Climate change impacts on renewable energy supply. Nat. Clim. Chang. 2021, 11, 119–125. [Google Scholar] [CrossRef]
- Iqbal, M.W.; Kang, Y. Waste-to-energy supply chain management with energy feasibility condition. J. Clean. Prod. 2021, 291, 125231. [Google Scholar] [CrossRef]
- Monsberger, C.; Fina, B.; Auer, H. Profitability of Energy Supply Contracting and Energy Sharing Concepts in a Neighborhood Energy Community: Business Cases for Austria. Energies 2021, 14, 921. [Google Scholar] [CrossRef]
- Murele, O.C.; Zulkafli, N.I.; Kopanos, G.M.; Hart, P.; Hanak, D.P. Integrating biomass into energy supply chain networks. J. Clean. Prod. 2020, 248, 119246. [Google Scholar] [CrossRef]
- Barragán-Escandón, E.A.; Zalamea-León, E.F.; Terrados-Cepeda, J.; Vanegas-Peralta, P.F. Energy self-supply estimation in intermediate cities. Renew. Sustain. Energy Rev. 2020, 129, 128495. [Google Scholar] [CrossRef]
- Meng, H.; Ju, Z.; Huang, Y. Analysis of Energy Supply Chain in Steel Industry Self-provided Power Plant. J. Phys. Conf. Ser. 2021, 1910, 012024. [Google Scholar] [CrossRef]
- Rimsan, M.; Mahmood, A.K. Application of Blockchain to Ensure Temper-Proof Data Availability for Energy Supply Chain. In Proceedings of the 2020 International Conference on Computational Intelligence (ICCI), Virtual, 8–9 October 2020. [Google Scholar]
- Emenike, S.N.; Falcone, G. A review on energy supply chain resilience through optimization. Renew. Sustain. Energy Rev. 2020, 134, 110088. [Google Scholar] [CrossRef]
- Zhang, X. Research on Risk Influencing Factors of Chinese Energy Supply Chain under the Background of the “the Belt and Road”; Harbin Engineering University: Harbin, China, 2018. [Google Scholar]
- Yang, Y.; Xu, L.; Haohao, F. Research on elasticity of energy supply chain based on Bayesian posterior probability. Soft Sci. 2018, 32, 103–107. [Google Scholar]
- Yu, G.; Jiang, X.; Dai, J.; Wan, L.; Pen, T. Reflections on Chinese energy development and energy sec- urity under the goals of “double-carbon”. Int. Pet. Econ. 2021, 29, 1–8. [Google Scholar]
- Popp, J.; Kovács, S.; Olah, J.; Divéki, Z.; Balàzs, E. Bioeconomy: Biomass and biomass-based energy supply and demand. New Biotechnol. 2021, 60, 76–84. [Google Scholar] [CrossRef]
- Sarkar, M.; Seo, Y.W. Renewable energy supply chain management with flexibility and automation in a production system. J. Clean. Prod. 2021, 324, 129149. [Google Scholar] [CrossRef]
- Allman, A.; Lee, C.; Mart, M.; Zhang, Q. Biomass waste-to-energy supply chain optimization with mobile production modules. Comput. Chem. Eng. 2021, 150, 107326. [Google Scholar] [CrossRef]
- Roozbeh Nia, A.; Awasthi, A.; Bhuiyan, N. Industry 4.0 and demand forecasting of the energy supply chain: A literature review. Comput. Ind. Eng. 2021, 154, 107128. [Google Scholar] [CrossRef]
- Banker, R.D.; Charnes, A.; Cooper, W.W. Some models for estimating technical and scale in efficiencies in data envelopment analysis. Manag. Sci. 1984, 30, 1078–1092. [Google Scholar] [CrossRef]
- Charnes, A.; Cooper, W.; Rhodes, E. Measuring the efficiency of decision making units. Eur. J. Oper. Res. 1978, 2, 429–444. [Google Scholar] [CrossRef]
- Wang, Q. Research on supply chain financial efficiency of new energy vehicle industry based on Three-stage DEA model. Hebei Enterp. 2021, 10, 106–109. [Google Scholar] [CrossRef]
- Ye, W. Research on Performance Evaluation of Low Carbon Supply Chain Based on DEA-AHP; Hebei Engineering University: Handan, China, 2013. [Google Scholar]
- Yang, J. Urgently reshaping the energy industry chain and supply chain to achieve carbon peak and carbon neutralization. China Energy 2021, 43, 14–19. [Google Scholar]
- Ahmadi, E.; McLellan, B.; Ogata, S.; Mohammadi-Ivatloo, B.; Tezuka, T. An integrated planning framework for sustainable water and energy supply. Sustainability 2020, 12, 4295. [Google Scholar] [CrossRef]
- Zhang, Z.; Yu, L. Dynamic Optimization and Coordination of Cooperative Emission Reduction in a Dual-Channel Supply Chain Considering Reference Low-Carbon Effect and Low-Carbon Goodwill. Int. J. Environ. Res. Public Health 2021, 18, 539. [Google Scholar] [CrossRef]
- Struve, B.; Anke, T.C.; Klumpp, M. DEA Sustainability Evaluation in Automotive Supply Chains. In Lecture Notes in Logistics; Springer: Berlin/Heidelberg, Germany, 2019; pp. 203–220. [Google Scholar]
- Moghaddas, Z.; Vaez-Ghasemi, M.; Lotfi, F.H. A novel dea approach for evaluating sustainable supply chains with undesirable factors. Econ. Comput. Econ. Cybern. Stud. Res. 2021, 55, 177–192. [Google Scholar]
- Abdelfattah, W.; Cherif, M.S. Incorporation of Preferences into Supply Chains DEA Efficiency: A Geometric Attribution Approach. Pak. J. Stat. Oper. Res. 2020, 16, 761–774. [Google Scholar] [CrossRef]
- Luo, D. Notes on the ineffectiveness estimation of Three-stage DEA model management. Stat. Res. 2012, 29, 104–107. [Google Scholar] [CrossRef]
- Khiavi, S.A.; Dastghiri, S.S. The design of inverse network DEA model for measuring the bullwhip effect in supply chain with uncertain demands. J. Optim. Ind. Eng. 2021, 14, 203–214. [Google Scholar] [CrossRef]
- Chen, R.; Xu, Z. Efficiency evaluation of green supply chains based on fuzzy chance constrained three-stage DEA model. IOP Conf. Ser. Earth Environ. Sci. 2021, 770, 012039. [Google Scholar] [CrossRef]
- Xiong, C.; Devlin, A.G.; Gupta, J.N.D.; Liu, X. Effect of price reduction on renewable energy technology supply chain performance and contract design. J. Oper. Res. Soc. 2022, 73, 822–839. [Google Scholar] [CrossRef]
- Rokicki, T.; Perkowska, A. Changes in Energy Supplies in the Countries of the Visegrad Group. Sustainability 2020, 12, 7916. [Google Scholar] [CrossRef]
- Ferrara, C.; de Feo, G. Environmental Assessment of the Recycled Paper Production: The Effects of Energy Supply Source. Sustainability 2021, 13, 4841. [Google Scholar] [CrossRef]
- Kang, P.; Lao, J.; Yu, M.; Song, H.; Wang, C. Reliable Prediction on Emerging Energy Supply for National Sustainability and Stability: A Case Study on Coal Bed Gas Supply in China Based on the Dual-LSTM Model. IEEE Access 2021, 9, 100694–100707. [Google Scholar] [CrossRef]
- Tsao, Y.; Thanh, V.; Chang, Y.; Wei, H. COVID-19: Government subsidy models for sustainable energy supply with disruption risks. Renew. Sustain. Energy Rev. 2021, 150, 111425. [Google Scholar] [CrossRef]
- Li, Y.; Yang, L.; Wang, D.; Zhou, Y.; He, W.; Li, B.; Yang, Y.; Lv, H. Identifying the critical transmission sectors with energy-water nexus pressures in China’s supply chain networks. J. Environ. Manag. 2021, 289, 112518. [Google Scholar] [CrossRef]
- Abdali, H.; Sahebi, H.; Pishvaee, M. The water-energy-food-land nexus at the sugarcane-to-bioenergy supply chain: A sustainable network design model. Comput. Chem. Eng. 2021, 145, 107199. [Google Scholar] [CrossRef]
- Wang, S.; Cao, T.; Chen, B. Identifying critical sectors and supply chain paths for virtual water and energy-related watertrade in China. Appl. Energy 2021, 299, 117294. [Google Scholar] [CrossRef]
- Riboldi, L.; Alves, E.F.; Pilarczyk, M.; Tedeschi, E.; Nord, L.O. Optimal Design of a Hybrid Energy System for the Supply of Clean and Stable Energy to Offshore Installations. Front. Energy Res. 2020, 8, 607284. [Google Scholar] [CrossRef]
- Helm, C.; Mier, M. Steering the energy transition in a world of intermittent electricity supply: Optimal subsidies and taxes for renewables and storage. J. Environ. Econ. Manag. 2021, 109, 102497. [Google Scholar] [CrossRef]
- Cao, Y.; Wei, W.; Chen, L.; Wu, Q.; Mei, S. Supply Inadequacy Risk Evaluation of Stand-Alone Renewable Powered Heat-Electricity Energy Systems: A Data-Driven Robust Approach. IEEE Trans. Ind. Inform. 2021, 17, 1937–1947. [Google Scholar] [CrossRef]
- Abdullah, F.B.; Iqbal, R.; Ahmad, S.; El-Affendi, M.A.; Abdullah, M. An Empirical Analysis of Sustainable Energy Security for Energy Policy Recommendations. Sustainability 2022, 14, 6099. [Google Scholar] [CrossRef]
- Majid, A.; Mortazavi-Naeini, M.; Hall, J.W. Efficient pathways to zero-carbon energy use by water supply utilities: An example from London, UK. Environ. Res. Lett. 2021, 16, 105010. [Google Scholar] [CrossRef]
- Wu, X.; Wu, Y.; Wang, Y.; Feng, X.; Chen, G. A multi-periods offshore wind farm optimization method for supplying energy in a natural gas hydrates exploitation platform. J. Clean. Prod. 2021, 316, 128238. [Google Scholar] [CrossRef]
- Buller, L.S.; Sganzerla, W.G.; Berni, M.D.; Brignoli, S.C.; Forster-Carneiro, T. Design and techno-economic analysis of a hybrid systtem for energy supply in a wastewater treatment plant: A decentralized energy strategy. J. Environ. Manag. 2021, 305, 114389. [Google Scholar] [CrossRef]
- Capitanescu, F. Evaluating reactive power reserves scarcity during the energy transition toward 100% renewable supply. Electr. Power Syst. Res. 2021, 190, 106672. [Google Scholar] [CrossRef]
- Karapekmez, A.; Dincer, I. Development of a multigenerational energy system for clean hydrogen generation. J. Clean. Prod. 2021, 299, 126909. [Google Scholar] [CrossRef]
- Khan, S. Environmental sustainability: A clean energy aspect versus poverty. Environ. Sci. Pollut. Res. Int. 2021, 28, 13097–13104. [Google Scholar] [CrossRef]
- Ghabri, Y.; Ayadi, A.; Guesmi, K. Fossil energy and clean energy stock markets under COVID-19 pandemic. Appl. Econ. 2021, 53, 4962–4974. [Google Scholar] [CrossRef]
- Tarhan, C.; Çil, M.A. A study on hydrogen, the clean energy of the future: Hydrogen storage methods. J. Energy Storage 2021, 40, 102676. [Google Scholar] [CrossRef]
- Wang, Z.; Teng, Y.; Jin, H.; Chen, Z. Urban Waste Disposal Capacity and its Energy Supply Performance Optimal Model Based on Multi-Energy System Coordinated Operation. IEEE Access 2021, 9, 32229–32238. [Google Scholar] [CrossRef]
- Rossi, M.; Spedaletti, S.; Lorenzetti, M.; Salvi, D.; Renzi, M.; Comodi, G.; Caresana, F.; Pelagalli, L. A methodology to estimate average flow rates in Water Supply Systems (WSSs) for energy recovery purposes through hydropower solutions. Renew. Energy 2021, 180, 1101–1113. [Google Scholar] [CrossRef]
- Rachidi, N.R.; Nwaila, G.T.; Zhang, S.E.; Bourdeau, J.E.; Ghorbani, O. Assessing cobalt supply sustainabil-lity through production forecasting and implications for green energy policies. Resour. Policy 2021, 74, 102423. [Google Scholar] [CrossRef]


| Scale | Meaning |
|---|---|
| 1 | The factor has the same influence as the factor. |
| 3 | The factor has a slightly stronger influence than the factor. |
| 5 | The factor has a stronger influence than the factor. |
| 7 | The factor has a obviously stronger influence than the factor. |
| 9 | The influence of the factor is extremely stronger than the factor. |
| 2, 4, 6, 8 | The median value of the above adjacent judgment |
| reciprocal | The judgment of comparing factor with is , and the judgment of comparing factor with . |
| 1 | 2 | 3 | 4 | 5 | 6 | 7 | 8 | |
| RI | 0 | 0 | 0.52 | 0.89 | 1.12 | 1.26 | 1.36 | 1.41 |
| Year | Energy Supply | Energy Production and Treatment | Energy Transmission and Distribution | Energy Consumption | ||||||||
|---|---|---|---|---|---|---|---|---|---|---|---|---|
| 1 | 2 | 3 | 4 | 5 | 6 | 7 | 8 | 9 | 10 | 11 | 12 | |
| 2010 | 312,125 | 10.40 | 88.10 | 72.50 | 2.46 | 2.87 | 438,732.00 | 99.82 | 0.0013 | 2696 | 86.55 | 11.75 |
| 2011 | 340,178 | 9.60 | 86.30 | 72.20 | 2.43 | 2.97 | 474,937.00 | 99.77 | 0.0007 | 2880 | 87.89 | 13.00 |
| 2012 | 351,041 | 11.20 | 85.60 | 72.70 | 2.43 | 3.20 | 505,640.00 | 99.56 | 0.0017 | 2977 | 87.29 | 14.50 |
| 2013 | 358,784 | 11.80 | 84.60 | 73.00 | 2.45 | 3.72 | 543,896.00 | 98.36 | 0.0019 | 3071 | 86.06 | 15.50 |
| 2014 | 362,212 | 13.30 | 84.00 | 73.10 | 2.44 | 4.03 | 577,605.00 | 97.32 | 0.0025 | 3140 | 84.48 | 17.00 |
| 2015 | 362,193 | 14.50 | 84.20 | 73.40 | 2.46 | 4.01 | 607,643.00 | 96.95 | 0.0035 | 3166 | 83.27 | 18.00 |
| 2016 | 345,954 | 16.80 | 79.40 | 73.50 | 2.57 | 4.41 | 645,609.00 | 96.50 | 0.0056 | 3202 | 78.38 | 19.50 |
| 2017 | 358,867 | 17.40 | 80.00 | 73.00 | 2.52 | 4.43 | 685,567.00 | 96.35 | 0.0082 | 3288 | 78.76 | 20.80 |
| 2018 | 378,859 | 18.00 | 79.00 | 72.80 | 2.47 | 5.43 | 724,788.00 | 96.85 | 0.0176 | 3388 | 79.89 | 22.10 |
| 2019 | 397,317 | 18.40 | 81.70 | 73.30 | 2.40 | 5.38 | 759,465.00 | 97.09 | 0.0207 | 3488 | 81.44 | 23.40 |
| Primary Index | Input/Output Index | Secondary Index |
|---|---|---|
| Energy supply (0.2685) | Input index | Total primary energy production |
| Output index | Low carbon raw material rate | |
| Energy self-sufficiency rate | ||
| Energy production and treatment (0.5531) | Input index | Carbon emission rate per unit output |
| Output index | Energy processing conversion efficiency | |
| Energy recovery rate | ||
| Energy transmission and distribution (0.1201) | Input index | Dispatching broadness |
| Output index | Delivery arrival rate | |
| Energy storage rate | ||
| Energy consumption (0.0583) | Input index | Per capita energy consumption |
| Output index | Demand satisfaction rate | |
| Proportion of clean energy consumption | ||
| environmental index | GDP growth rate | |
| Total population growth at the end of the year | ||
| Year | Output Index | Input Index | Environmental Variables | ||
|---|---|---|---|---|---|
| Energy Processing Conversion Efficiency | Energy Recovery Rate | Carbon Emission Rate per Unit Output | GDP Growth Rate | Total Population Growth at the End of the Year | |
| 2010 | 72.50 | 2.87 | 2.46 | 0.1825 | 0.0048 |
| 2011 | 72.20 | 2.97 | 2.43 | 0.1840 | 0.0048 |
| 2012 | 72.70 | 3.20 | 2.43 | 0.1038 | 0.0050 |
| 2013 | 73.00 | 3.72 | 2.45 | 0.1010 | 0.0049 |
| 2014 | 73.10 | 4.03 | 2.44 | 0.0853 | 0.0052 |
| 2015 | 73.40 | 4.01 | 2.46 | 0.0704 | 0.0050 |
| 2016 | 73.50 | 4.41 | 2.57 | 0.0835 | 0.0059 |
| 2017 | 73.00 | 4.43 | 2.52 | 0.1147 | 0.0053 |
| 2018 | 72.80 | 5.43 | 2.47 | 0.1049 | 0.0038 |
| 2019 | 73.30 | 5.38 | 2.40 | 0.0731 | 0.0033 |
| DMU | Cj | Vj | Sj |
|---|---|---|---|
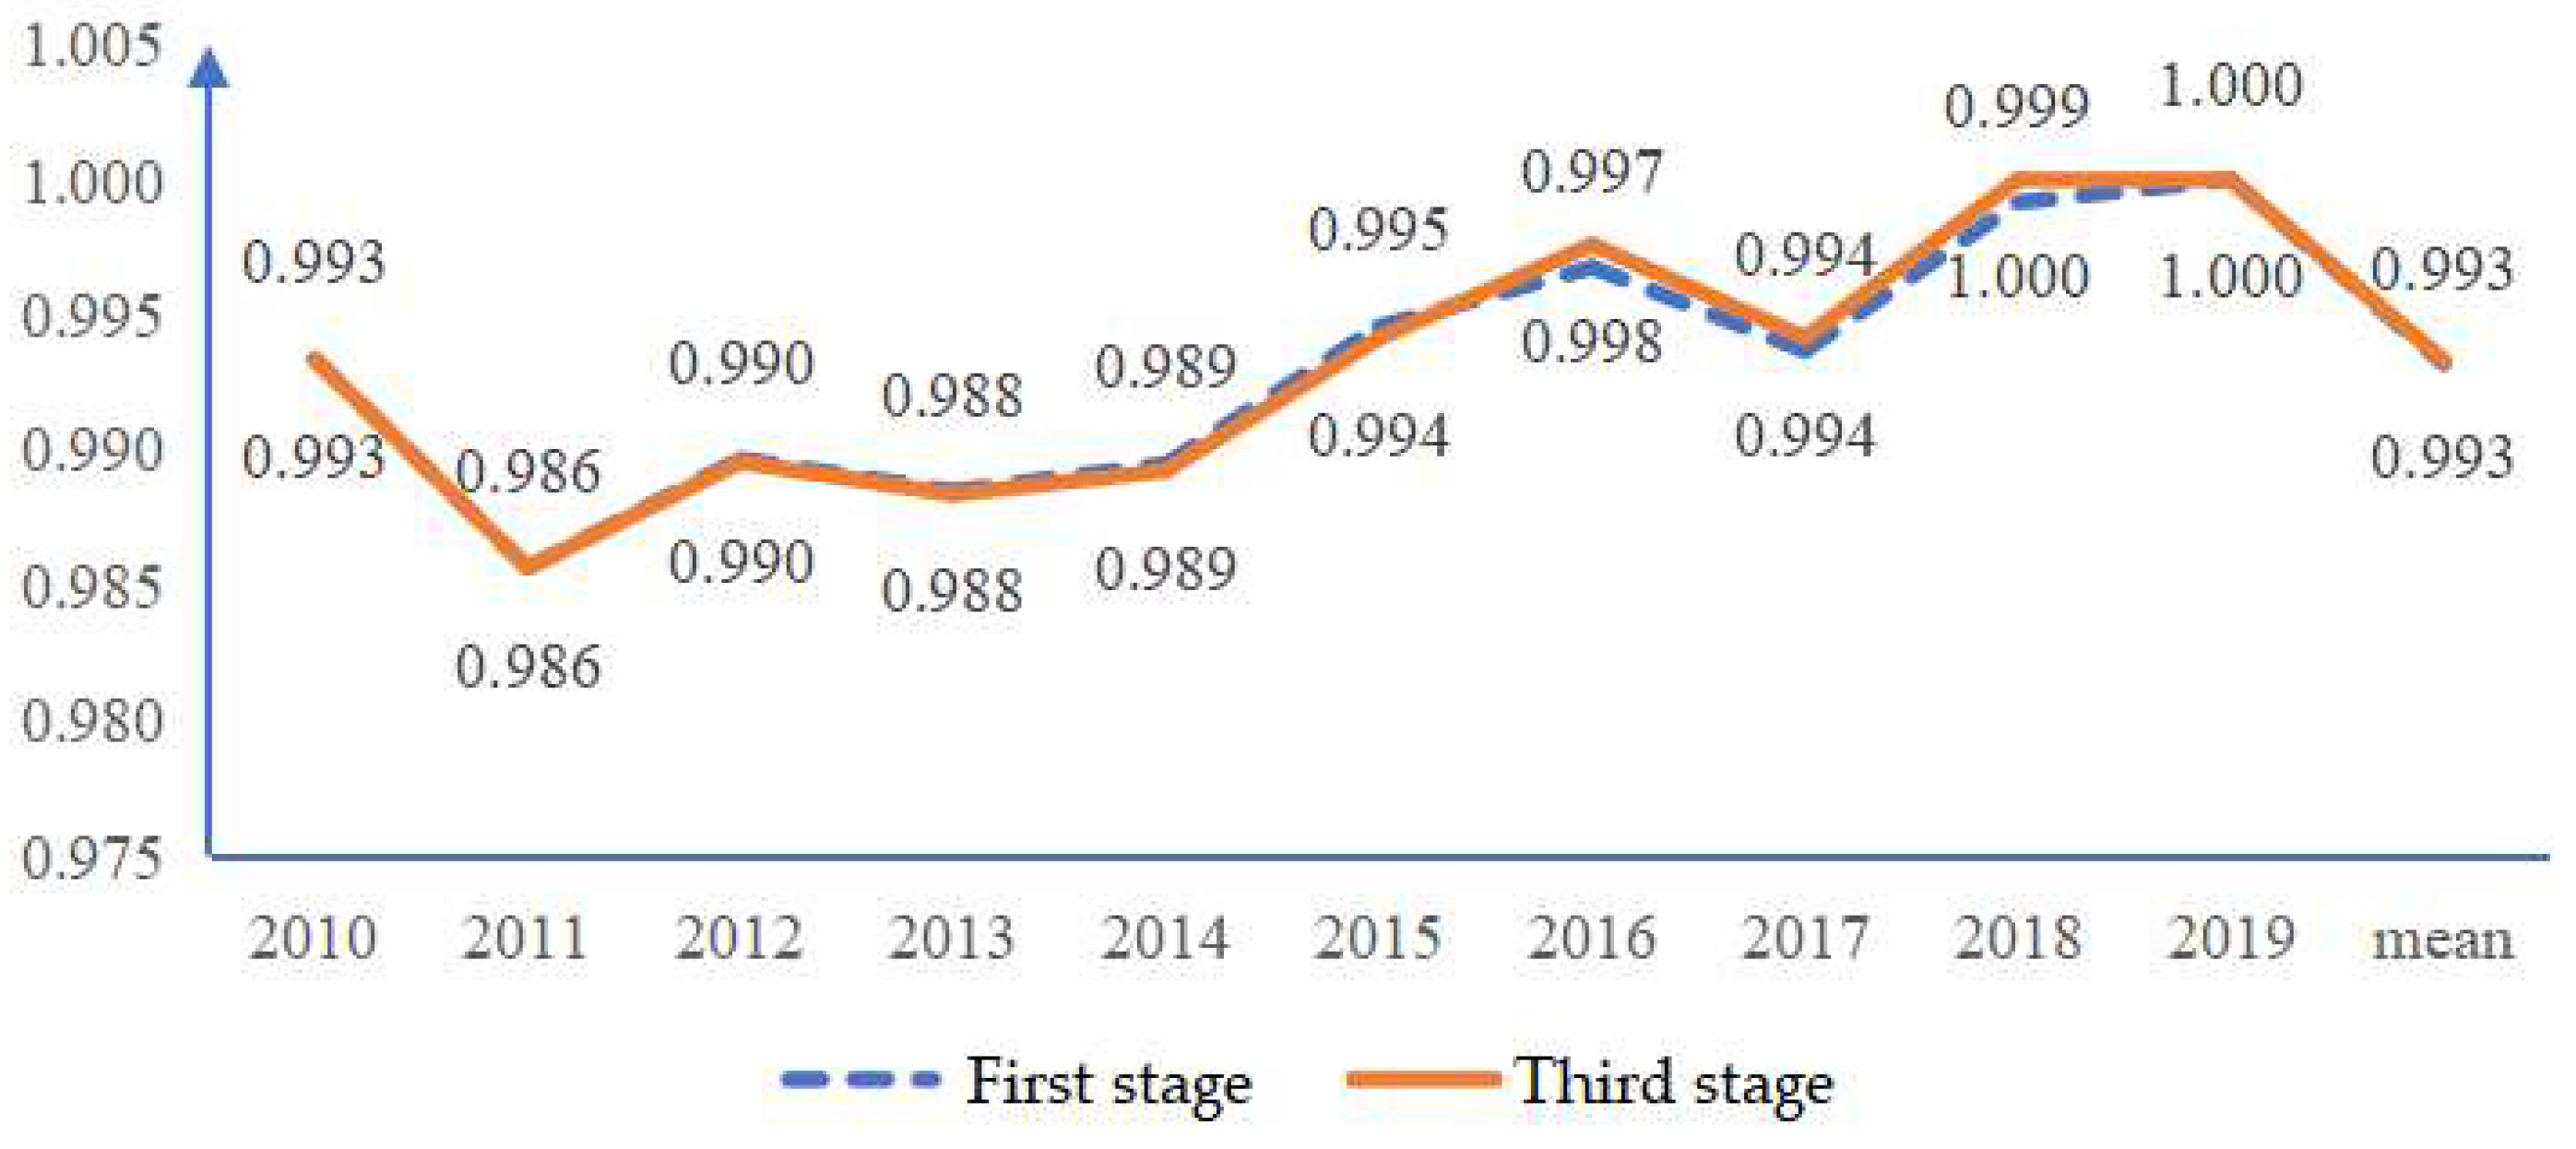
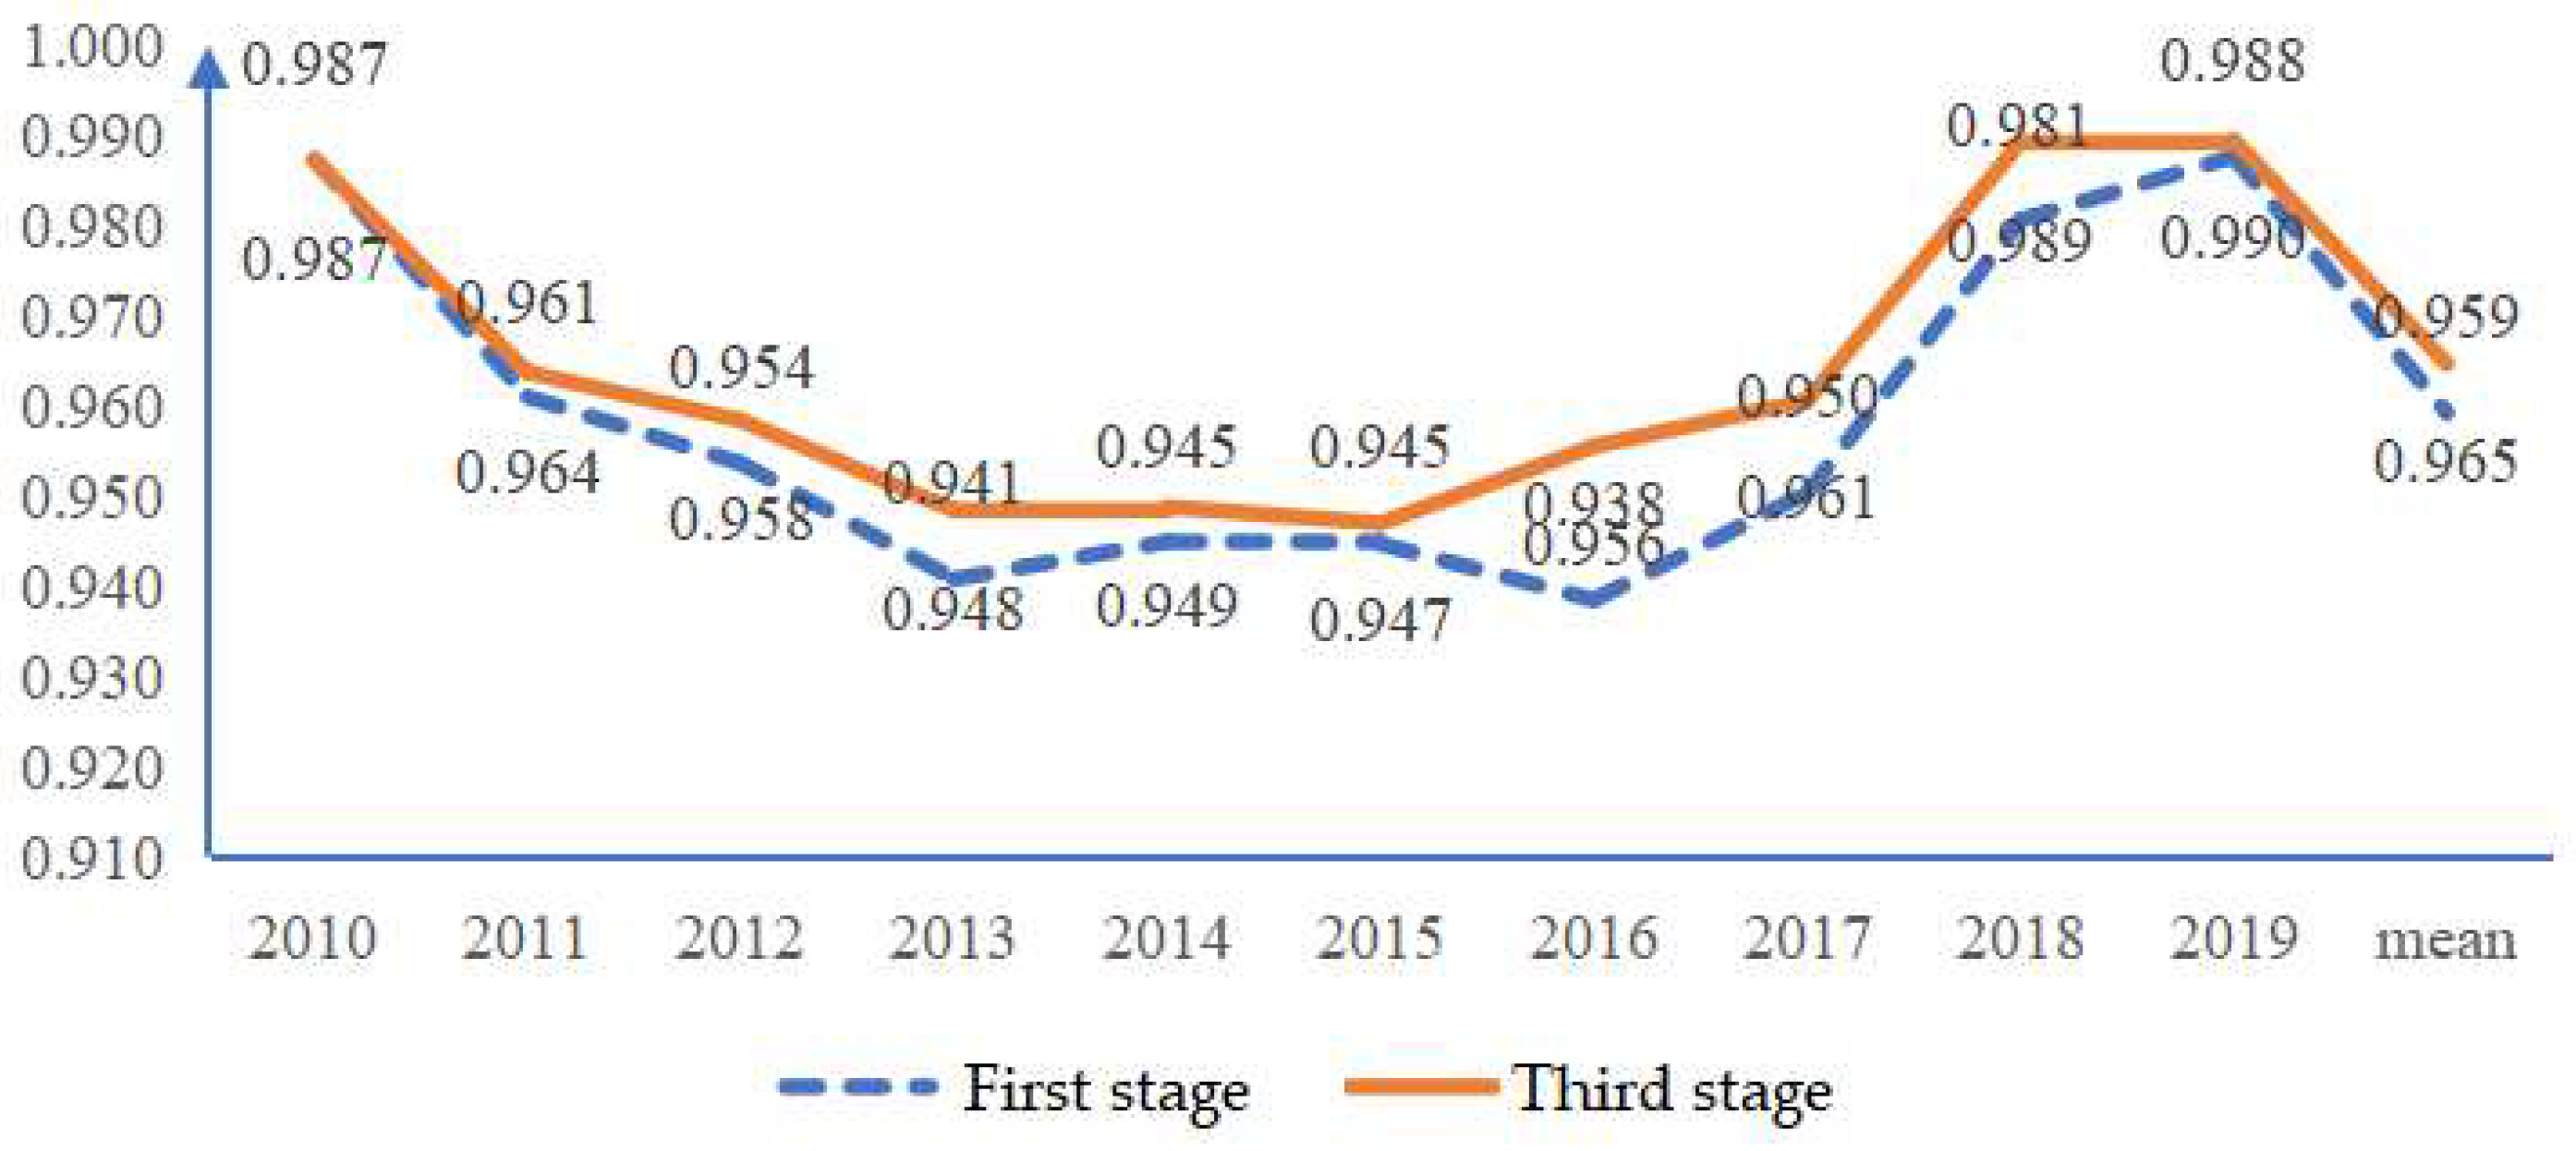
| 2010 | 0.981 | 0.993 | 0.987 |
| 2011 | 0.947 | 0.986 | 0.961 |
| 2012 | 0.944 | 0.990 | 0.954 |
| 2013 | 0.930 | 0.988 | 0.941 |
| 2014 | 0.935 | 0.989 | 0.945 |
| 2015 | 0.940 | 0.995 | 0.945 |
| 2016 | 0.936 | 0.997 | 0.938 |
| 2017 | 0.945 | 0.994 | 0.950 |
| 2018 | 0.980 | 0.999 | 0.981 |
| 2019 | 0.988 | 1.000 | 0.988 |
| mean | 0.953 | 0.993 | 0.959 |
| DMU | Number | Time | Investment in Fixed Assets | GDP Growth Rate | Total Population Growth at the End of the Year |
|---|---|---|---|---|---|
| 2010 | 1 | 1 | −0.0038 | 18.2490 | 0.4803 |
| 2011 | 2 | 1 | −0.0040 | 18.3978 | 0.4803 |
| 2012 | 3 | 1 | −0.0028 | 10.3783 | 0.4965 |
| 2013 | 4 | 1 | 0.0001 | 10.0975 | 0.4933 |
| 2014 | 5 | 1 | −0.0029 | 8.5334 | 0.5218 |
| 2015 | 6 | 1 | −0.0049 | 7.0382 | 0.4971 |
| 2016 | 7 | 1 | −0.0020 | 8.3525 | 0.5885 |
| 2017 | 8 | 1 | −0.0009 | 11.4740 | 0.5330 |
| 2018 | 9 | 1 | 0.0005 | 10.4857 | 0.3813 |
| 2019 | 10 | 1 | −0.0030 | 7.3138 | 0.3347 |
| Total Primary Energy Production | Carbon Emission Rate Per Unit Output | Scheduling Reasonable Rate | Per Capita Energy Consumption | |
|---|---|---|---|---|
| coefficient | 25,920.2670 | −0.0001 | 152,152.2900 | 11.3765 |
| GDP growth rate | −607.7949 | −0.0001 | 7079.2817 | −0.2083 |
| Total population growth at the end of the year | −30,857.7520 | −0.0022 | −621,362.4300 | −15.6923 |
| sigma-squared | 365,948,740.0000 | 0.0000 | 344,854,240.0000 | 217.1391 |
| gamma | 1.0000 | 0.0500 | 0.0495 | 1.0000 |
| DMU | Cj | Vj | Sj |
|---|---|---|---|
| 2010 | 0.981 | 0.993 | 0.987 |
| 2011 | 0.950 | 0.986 | 0.964 |
| 2012 | 0.949 | 0.990 | 0.958 |
| 2013 | 0.938 | 0.988 | 0.948 |
| 2014 | 0.939 | 0.989 | 0.949 |
| 2015 | 0.942 | 0.994 | 0.947 |
| 2016 | 0.953 | 0.998 | 0.956 |
| 2017 | 0.955 | 0.994 | 0.961 |
| 2018 | 0.989 | 1.000 | 0.989 |
| 2019 | 0.990 | 1.000 | 0.990 |
| mean | 0.958 | 0.993 | 0.965 |
| DMU | Energy Supply (0.2685) | Energy Production and Treatment (0.5513) | Energy Transmission and Distribution (0.1021) | Energy Consumption (0.0583) | ||||||||
|---|---|---|---|---|---|---|---|---|---|---|---|---|
| cij | vij | sij | cij | vij | sij | cij | vij | sij | cij | vij | sij | |
| 2010 | 1 | 1 | 1 | 0.965 | 0.988 | 0.977 | 1 | 1 | 1 | 1 | 1 | 1 |
| 2011 | 0.901 | 0.98 | 0.92 | 0.973 | 0.984 | 0.988 | 0.941 | 0.999 | 0.942 | 0.979 | 1 | 0.979 |
| 2012 | 0.904 | 0.981 | 0.921 | 0.98 | 0.991 | 0.988 | 0.892 | 0.997 | 0.894 | 0.982 | 1 | 0.982 |
| 2013 | 0.892 | 0.975 | 0.914 | 0.98 | 0.995 | 0.985 | 0.832 | 0.985 | 0.844 | 0.969 | 0.994 | 0.975 |
| 2014 | 0.914 | 0.982 | 0.931 | 0.981 | 0.996 | 0.985 | 0.784 | 0.975 | 0.804 | 0.974 | 0.988 | 0.985 |
| 2015 | 0.947 | 0.994 | 0.953 | 0.977 | 1 | 0.977 | 0.75 | 0.971 | 0.772 | 0.982 | 0.987 | 0.995 |
| 2016 | 1 | 1 | 1 | 0.94 | 1 | 0.94 | 0.9 | 0.98 | 0.918 | 0.975 | 1 | 0.975 |
| 2017 | 0.999 | 1 | 0.999 | 0.952 | 0.994 | 0.958 | 0.858 | 0.979 | 0.876 | 0.982 | 1 | 0.982 |
| 2018 | 0.993 | 1 | 0.993 | 0.985 | 1 | 0.985 | 1 | 1 | 1 | 0.99 | 1 | 0.99 |
| 2019 | 0.977 | 1 | 0.977 | 1 | 1 | 1 | 0.964 | 1 | 0.964 | 1 | 1 | 1 |
| mean | 0.953 | 0.991 | 0.961 | 0.973 | 0.995 | 0.978 | 0.892 | 0.989 | 0.901 | 0.983 | 0.997 | 0.986 |
Publisher’s Note: MDPI stays neutral with regard to jurisdictional claims in published maps and institutional affiliations. |
© 2022 by the authors. Licensee MDPI, Basel, Switzerland. This article is an open access article distributed under the terms and conditions of the Creative Commons Attribution (CC BY) license (https://creativecommons.org/licenses/by/4.0/).
Share and Cite
Huang, X.; Lu, X.; Sun, Y.; Yao, J.; Zhu, W. A Comprehensive Performance Evaluation of Chinese Energy Supply Chain under “Double-Carbon” Goals Based on AHP and Three-Stage DEA. Sustainability 2022, 14, 10149. https://doi.org/10.3390/su141610149
Huang X, Lu X, Sun Y, Yao J, Zhu W. A Comprehensive Performance Evaluation of Chinese Energy Supply Chain under “Double-Carbon” Goals Based on AHP and Three-Stage DEA. Sustainability. 2022; 14(16):10149. https://doi.org/10.3390/su141610149
Chicago/Turabian StyleHuang, Xiaoqing, Xiaoyong Lu, Yuqi Sun, Jingui Yao, and Wenxing Zhu. 2022. "A Comprehensive Performance Evaluation of Chinese Energy Supply Chain under “Double-Carbon” Goals Based on AHP and Three-Stage DEA" Sustainability 14, no. 16: 10149. https://doi.org/10.3390/su141610149