Article

Sustainable Development Goals: A Regional Overview Based on Multi-Criteria Decision Analysis

by
Idiano D’Adamo
1,* and
Massimo Gastaldi
2
1
Department of Computer, Control and Management Engineering, Sapienza University of Rome, Via Ariosto 25, 00185 Rome, Italy
2
Department of Industrial Engineering, Information and Economics, University of L’Aquila, Via G. Gronchi 18, 67100 L’Aquila, Italy
*
Author to whom correspondence should be addressed.
Sustainability 2022, 14(15), 9779; https://doi.org/10.3390/su14159779
Submission received: 8 July 2022 / Revised: 5 August 2022 / Accepted: 7 August 2022 / Published: 8 August 2022
(This article belongs to the Special Issue Prospects and Challenges of Bioeconomy Sustainability Assessment)

Abstract

:
The Sustainable Development Goals (SDGs) have the ambitious goal of protecting the planet, eradicating poverty and providing peace and prosperity for all citizens. The challenge is certainly very ambitious and it is necessary to monitor progress toward these SDGs over time. This work is based on the multi-criteria decision analysis and aims to build a framework that can be replicated. A necessary condition for this aim is that the data are available and that they are as recent as possible. This work is based on 28 targets with data mainly from 2019 to 2020 and related to Italian regions. The results show that Trentino Alto Adige and Valle d’Aosta have the best performance and, in general, the northern territory has several realities that perform positively toward the SDGs. Important results are also present at the level of central Italy (in particular Marche and Toscana), while at the southern level the situation is not flourishing, with the sole exception of Abruzzo. The policy implications thus drive the need for targeted green investments for southern regions, projects that nationally promote the “green, bio and circular Made in Italy” brand that can enhance territorial distinctiveness, and the necessary collaboration among regions to be poles of excellence based on available resources and skills.

1. Introduction

The 2030 Agenda for Sustainable Development, adopted by all member states of the United Nations in 2015, aims to achieve peace and prosperity across the world. These aspects are even more amplified by a global disruption brought about by the COVID-19 pandemic that has resulted in the deaths of many people, but has also changed the socio-economic system.
The 17 SDGs require urgent action by all countries—developed and developing—through a global partnership [1]. The theme is very broad, and therefore needs to be declined in all areas. There is a demand for an interdisciplinary approach that can combine artificial intelligence with the water–energy–food nexus [2], that frames the contribution of sustainability from a technological perspective [3], that identifies the role of eco-systems innovation [4], how public administrations implement sustainable practices [5], circular approaches [6], businesses that optimize resources by following principles of competitiveness and value-added [7], responsible consumer behavior [8], and the contribution of culture [9] and tourism [10] towards human welfare. These are all actions that should lead to a reduction in greenhouse gas emissions [11] using new approaches based on the circular economy and bioeconomy [12,13]. New approaches that rely on the important role of sustainable approaches [14], the contribution of new generations through training [15], and the role of stakeholder engagement and renewable communities thus assume a key role [16]. In this context, society demands to adopt a model based on the sustainable hand [17]. In addition, it is important to emphasize the strategic role of human resources on how certain characteristics, such as capability, motivation and opportunity, impact performance [18].
The topic of the SDGs has acquired a key role in the literature [19,20]. The approach toward the SDGs calls for developing new approaches [21], but the problem remains difficult to define given that the goals address different scales and each SDG has multiple aspects to consider [22]. All territories, regardless of their size, are called upon to achieve the SDGs [23]. However, each territory has its own peculiarities and characteristics, so it becomes important to identify and adopt a National Strategy for Sustainable Development [24]. Following this perspective, several approaches are considered, since the areas of analysis are very broad [7,25,26].
The role of indicators within the sustainability assessment literature is very important. The purpose of an indicator is to provide summary information, to gather different perspectives, and to identify outputs and relationships useful to stakeholders. Similarly, they play a role in increasing the awareness and responsibility of territories toward achieving the SDGs. However, the complexity of countries’ paths to sustainable development cannot be fully understood by resorting to a single multifunctional ranking indicator [27]. An overall indicator can be based on partial indicators, but then it is necessary to aggregate the different information [28]. Analyses are conducted at the local level [29] and at the global level [30]. Particular emphasis is placed on Europe aiming for the ambitious goal of being climate neutral [31,32]. Some authors highlight the need for active input not only from member states, but also at the central level of European institutions [33]. In this direction, however, the European Green Deal calls for great efforts, and therefore needs policies that know how to have models implemented that actually follow sustainable principles.
Sustainable goals are as cross-cutting as they are specific, making it necessary to adopt methods that can aggregate them [34,35]. The literature shows that ranking among different alternatives is likely to increase both awareness and accountability toward achieving the SDGs [36,37].
Multi-criteria decision analysis (MCDA) seems to be a suitable approach to provide real support to public decision makers in policy making [38]. MCDA is an established method in the literature that can assess sustainable performance and can be used to aggregate contributions from different sustainable indicators. MCDA based on data obtained from the main databases can be aggregated with each other in order to provide an aggregate indicator and ranking. The level of accuracy of the result increases as the number of available data increases, but also depending on the objective to be constructed. This research is based on a strand of research that aims to provide results and critical interpretations of values to frame the performance of certain territorial realities. The method has been applied in Italy at the level of individual regions [39] or at the level of individual cities [40]. In addition, the methodological approach has been used to measure the economic performance of European countries by demonstrating that gross domestic product cannot interpret the economic sustainability of a country [41]. This research follows this strand of analysis, in which the gap of providing new recent data, assessing spatial performance and identifying new methodological steps is filled. In addition, some works give particular attention to the role of targets toward the SDGs [42,43]. In this way, the focus of this work is duplicative. From a methodological point of view, it aims to provide a sustainable framework that can be useful for policy makers, but, in general, for all citizens to control and monitor the progress of their territory towards the SDGs. From a managerial point of view, the ranking analysis and decomposition of the final result according to sustainability dimension and geographic macro-area is useful to identify practices, actions and policies to be implemented.

2. Materials and Methods

The MCDA method is very useful in decision-making processes because it has the advantage of synthesizing a large amount of data. The decision maker can use the synthesized elements calculated in order to make a choice among different alternatives. The method has the advantage of being easy to use, well established in the literature, and used in various fields, including those related to sustainability [44,45]. MCDA is based on the identification of suitable criteria to achieve the objective. The main disadvantage is that it does not consider dynamic aspects and does not provide direct assessments of interactions between variables.
MCDA is a methodology that is part of the field of operations research and is defined as a method that considers conflicting criteria within a decision-making process to identify the best among alternative solutions [46]. The method can have characteristics of objectivity when the criteria are measurable, allowing a fair comparison between the same alternatives [47,48]. The output is a synthesis of multiple data, which, only through decomposition can be understood whether they are convergent or divergent. The literature shows how countries can be considered alternatives. In fact, if comparing products and technologies, the expected result of MCDA is to see, for example, the most profitable project or the one with the best quality. Instead, when analyzing countries, a ranking can be proposed to define the strengths and weaknesses of individual performances and to understand possible relationships [39,49,50].
Section 1 showed how the MCDA applies to European countries, which are then identified as alternatives. In this paper, the analysis focuses on Italian regions. The highest value identifies the region that best performs from a sustainability perspective [39]. The criteria selected depend primarily on data availability. Other papers have used an approach based on European or national statistical data [51,52], while in this paper we chose to use data released by ASviS (Italian Alliance for Sustainable Development) [42,53]. The rationale is due to the use of the most recent data and the active role that ASviS plays in the country.
Specifically, the latest report shows values for 28 Targets attributable to 16 of the 17 SDGs [54]—Table 1.
It is shown that most of the targets (22 out of 28) have a time referring to 2019. The division of the 28 targets among the different SDGs is not fair: there are in fact four associated with SDG 4, one with SDG 1, SDG 5, SDG 10, SDG 12, SDG 13, and SDG 14, and two with the remaining nine SDGs. SDG 17 does not present any criteria. The choice of targets used matches all those that are reported in the ASviS report. We also want to emphasize that the latest available data are proposed.
All values are compared with each other and it emerges that they are homogeneous, so no changes need to be made in order to make the more populous regions comparable with the less populous ones. The aggregate sustainability indicator is based on the product between a value and a weight associated with the different criteria and calculated for all alternatives.
There are twenty-one alternatives, as all nineteen regions are considered, while the two provinces Bolzano and Trento are proposed for the Trentino Alto Adige region. We want to underline that in the result figures proposed in Section 3, the average value for the Trentino Alto Adige region will be proposed as an average value between two provinces. The values associated with the different criteria follow the normalized 0–1 method [41]: the least performing value among all twenty-one alternatives is assigned the value 0, while the best performing one is assigned the value 1. Finally, an intermediate value is calculated for all the remaining alternatives by interpolation—Table 2A,B. It should be specified that the 14.5 target was calculated only for ten regions (Liguria, Friuli, Toscana, Lazio, Abruzzo, Campania, Puglia, Calabria, Sicilia and Sardegna), while for the others the relevant target and associated SDG were not counted.
Two distinct methods are proposed for weights [39]:
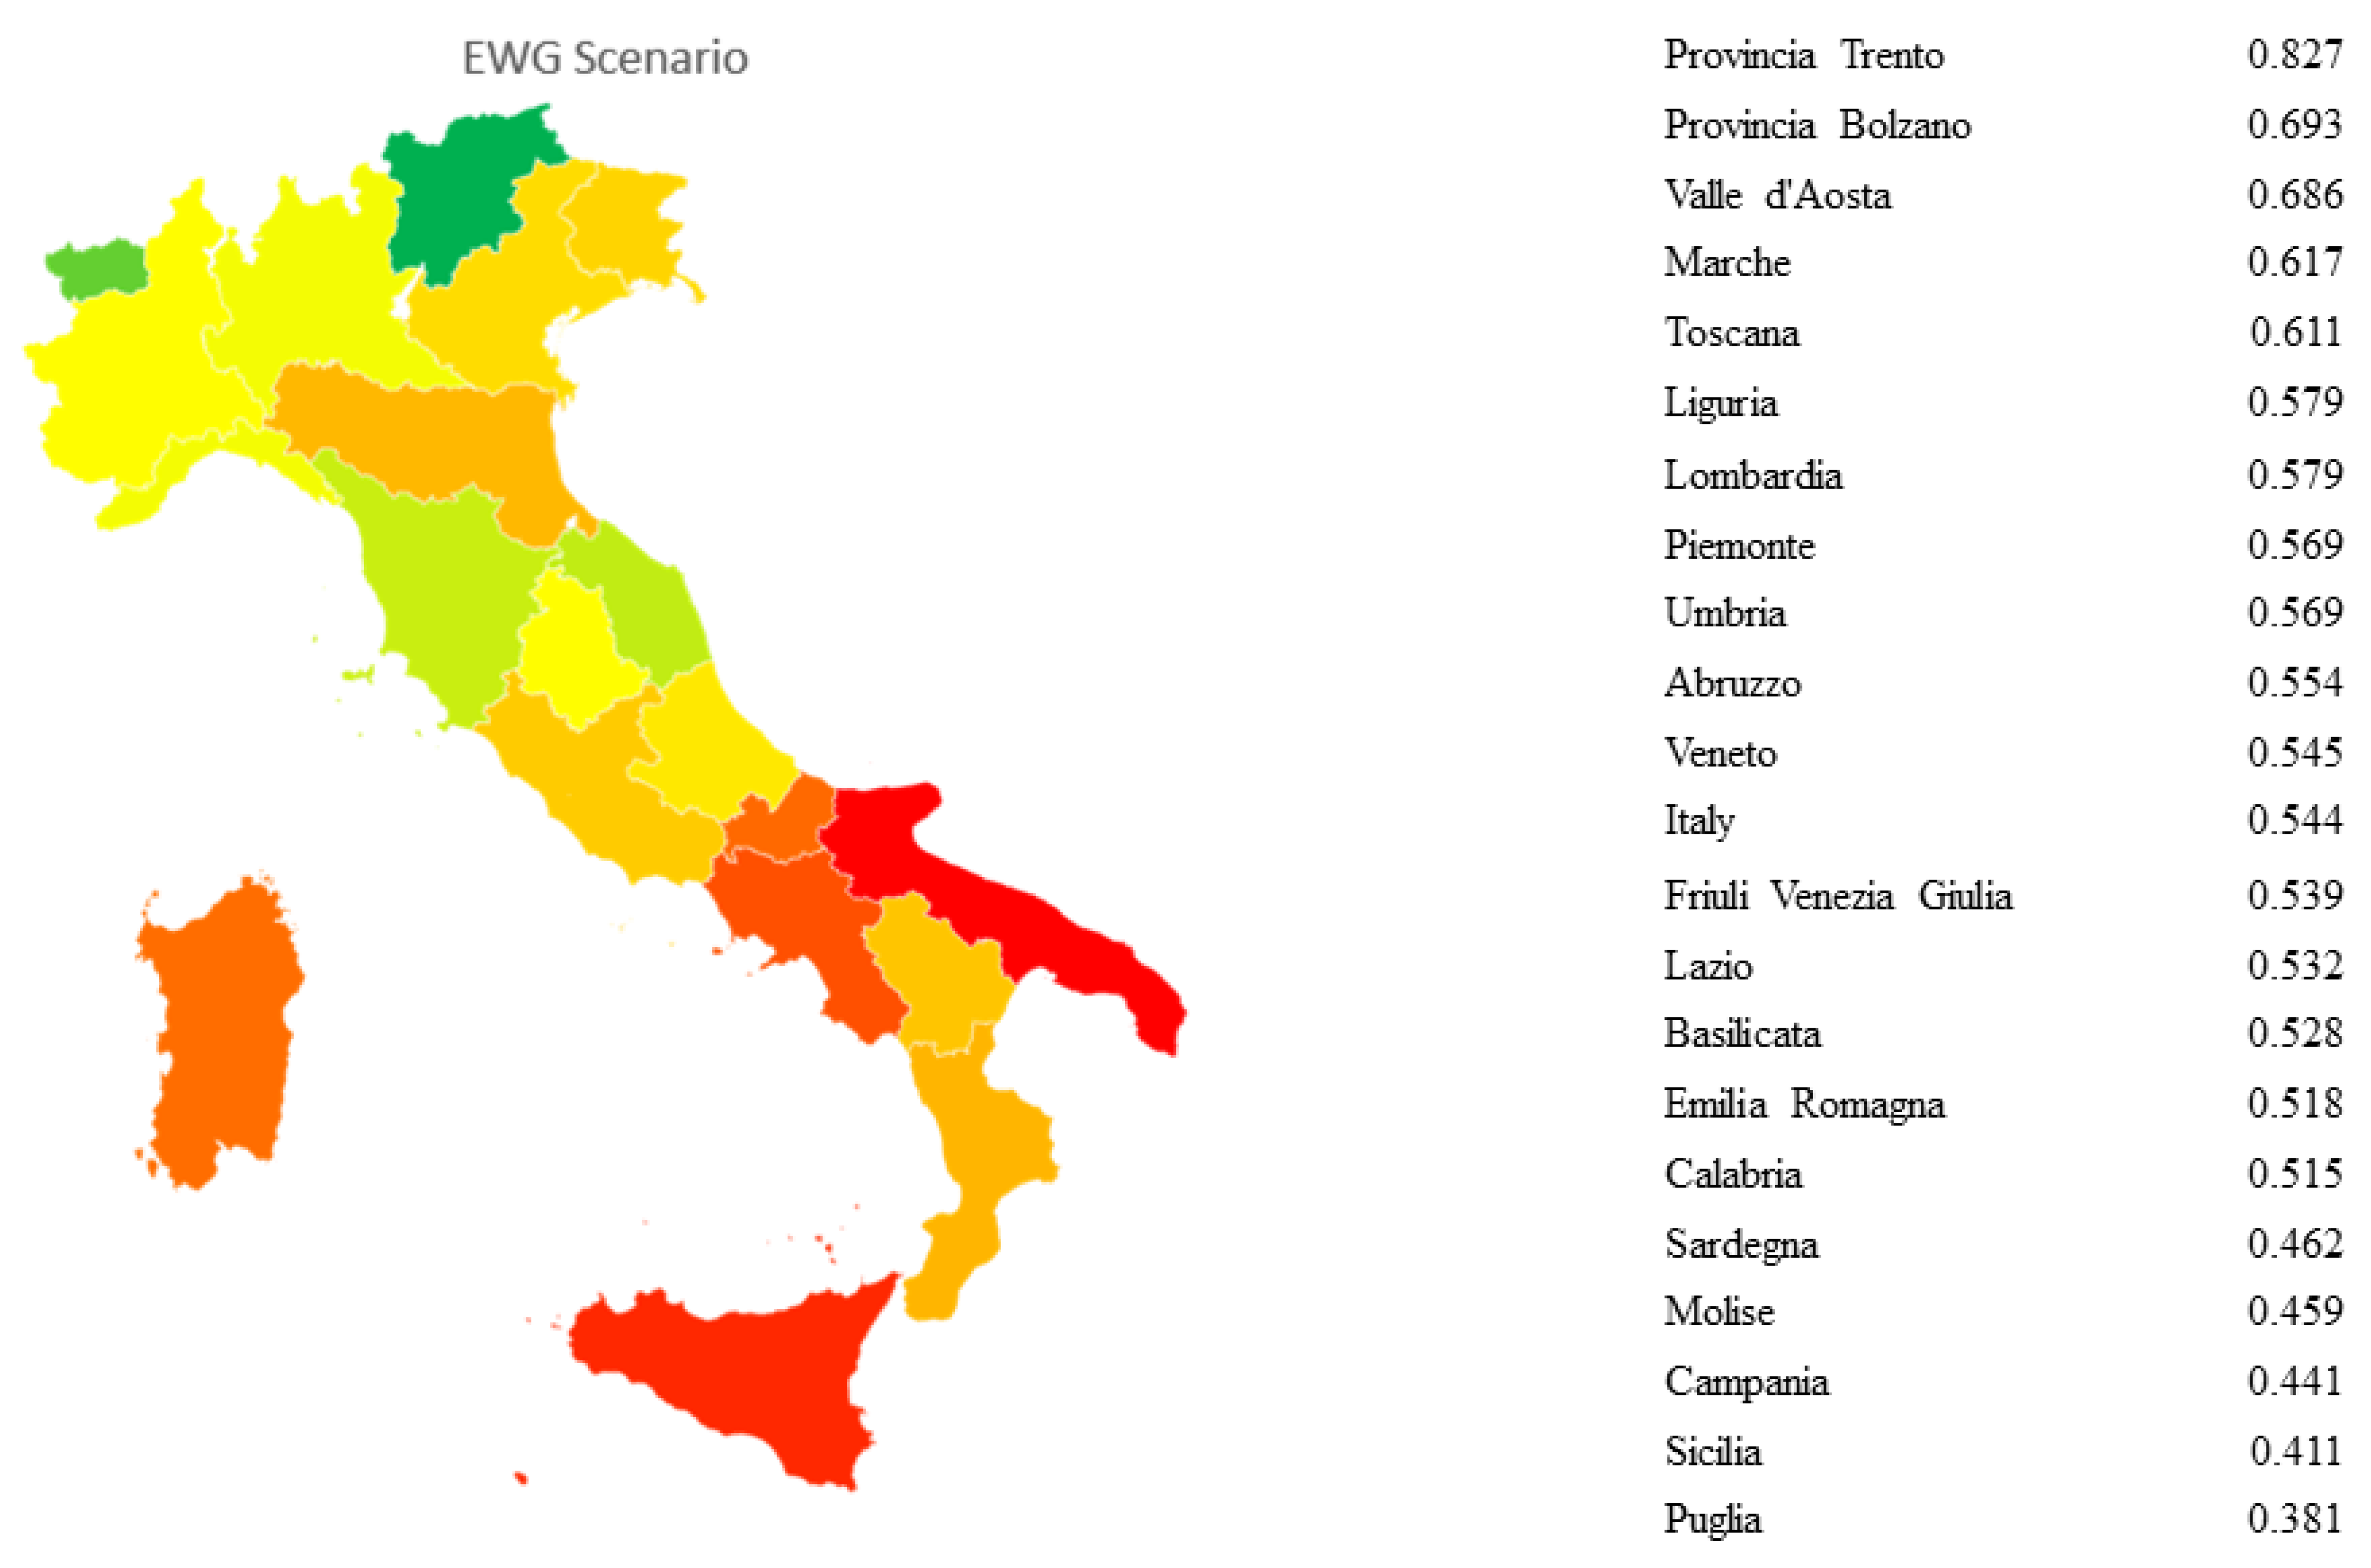
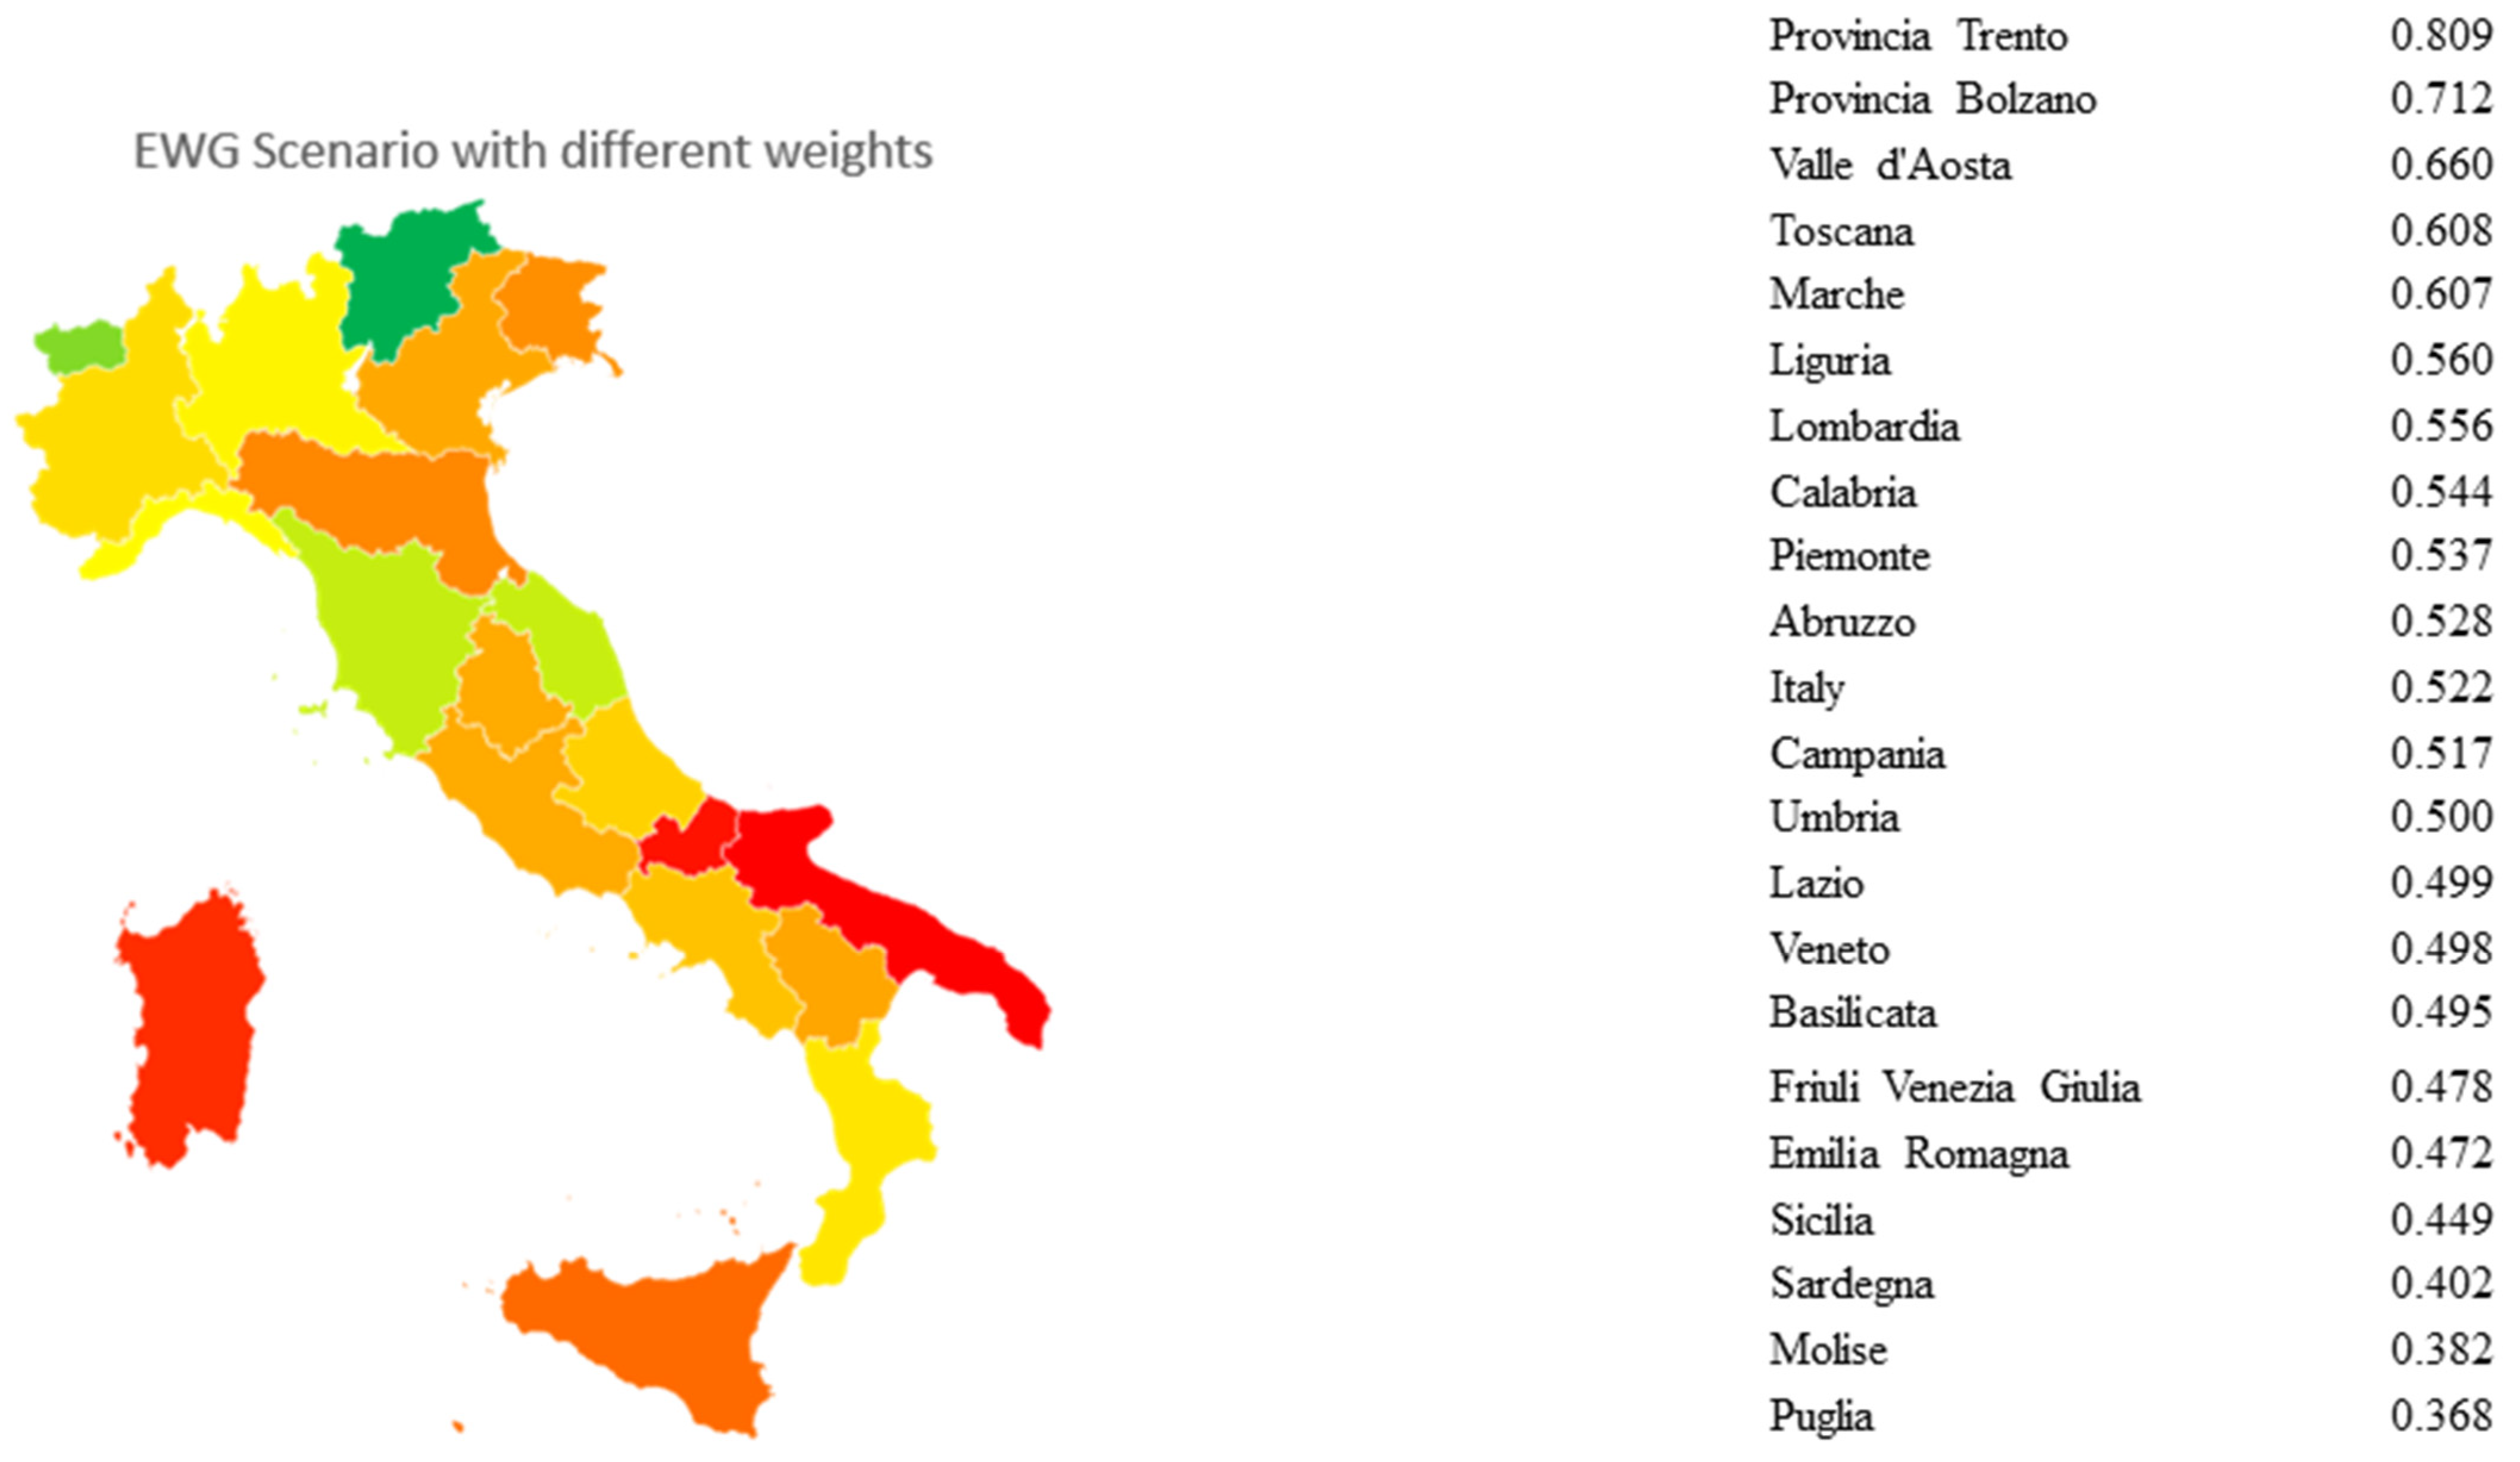
  • Equal weights among SDGs (EWG) scenario;
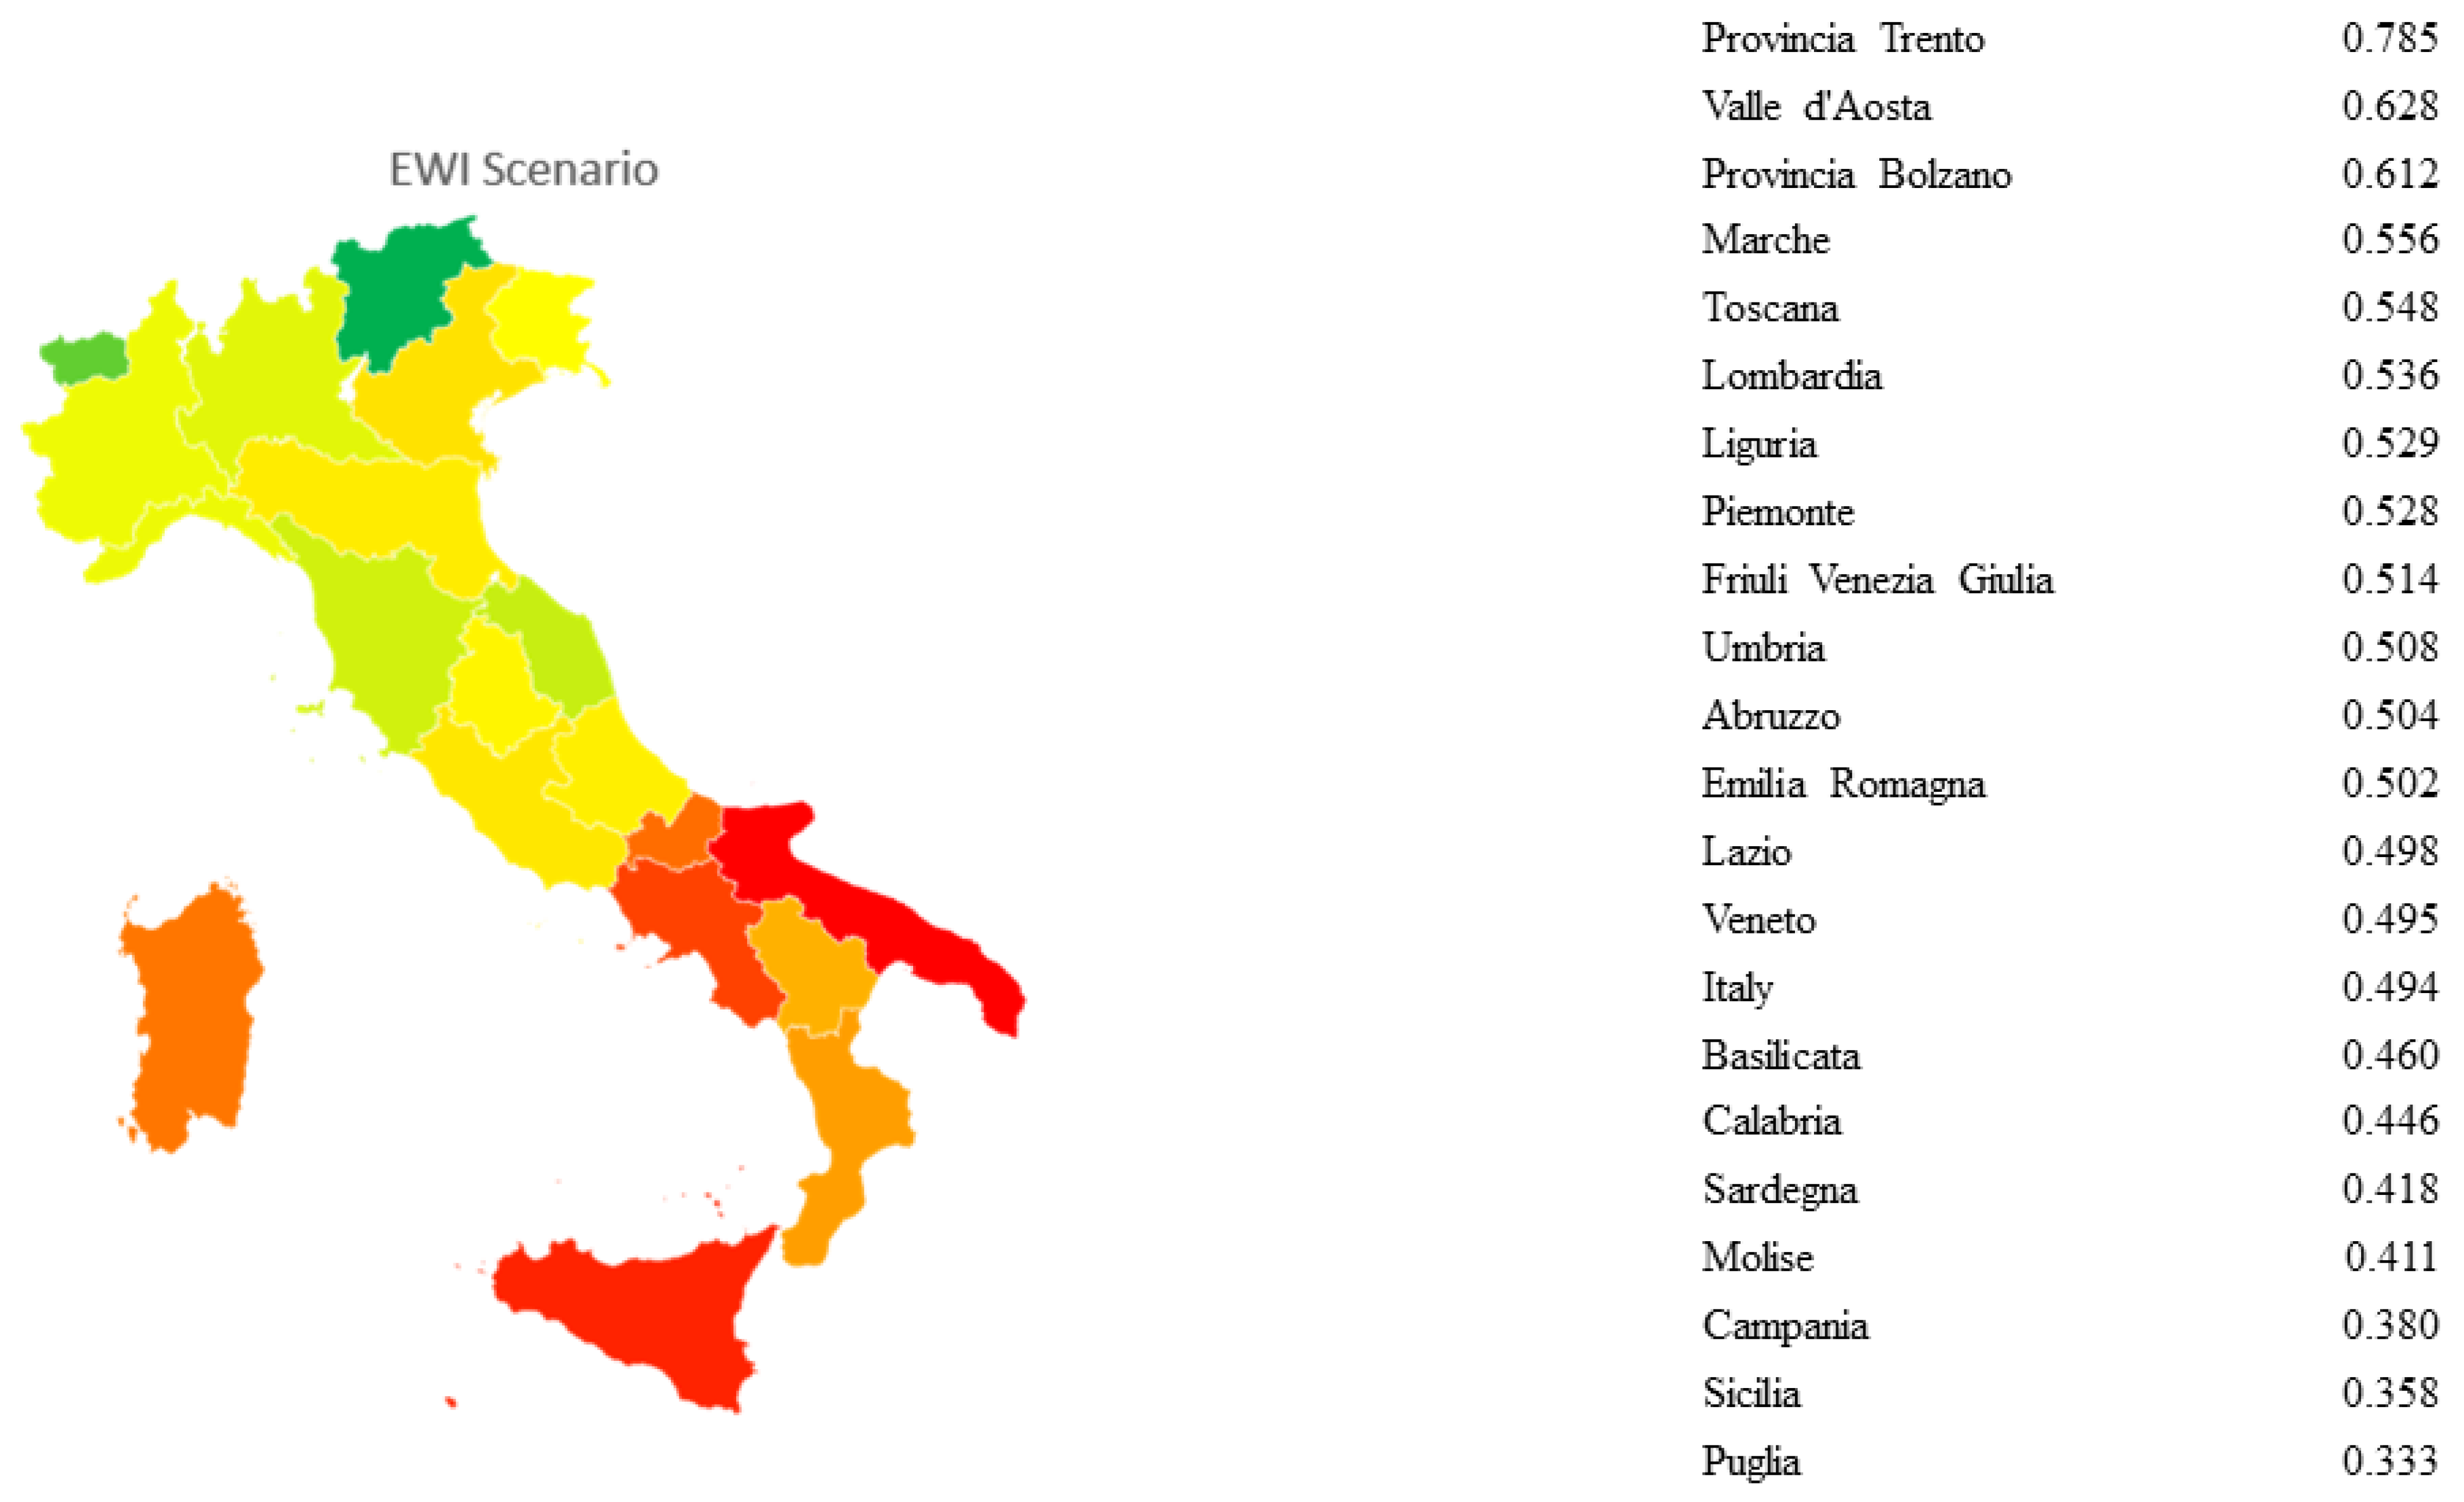
  • Equal weights among indicators (EWI) scenario.
In the EWG scenario, the different targets are aggregated within the reference SDG. As a result, SDGs with only one indicator will be given no change (e.g., SDG 1), while those with two indicators (e.g., SDG 2) will be given an average value in which the targets will be given equal importance. For SDG 4, the same principle applies where an average value is proposed for the four targets. The EWI scenario, on the other hand, assumes that all targets are given equal relevance. Thus, the main difference between the two scenarios is that EWI allows all individual contributions to be assessed without performing any intermediate operation on the final MCDA value. In contrast, in the EWG scenario, equal relevance is preferred to be given to the individual SDG, regardless of the number of targets in it.
The reference scenario will be the EWG scenario and the final value will be broken down according to the three dimensions of sustainability: environmental (SDGs 6, 13–15), economic (SDGs 7–9, 11 and 12) and social (SDGs 1–5, 10 and 16) [35,55]. Furthermore, starting from this composition, it will be assumed that the value of the three dimensions of the SDGs is not the same. It is considered that the involvement of experts could be a subjective element to detect the incidence of individual SDGs, and therefore, in order to identify a more objective method, it was chosen to consider what has been proposed in the literature. The Scopus database was used (access date on 5 July 2022) and within the Article title, Abstract and Keywords the number in which these word combinations were present was detected:
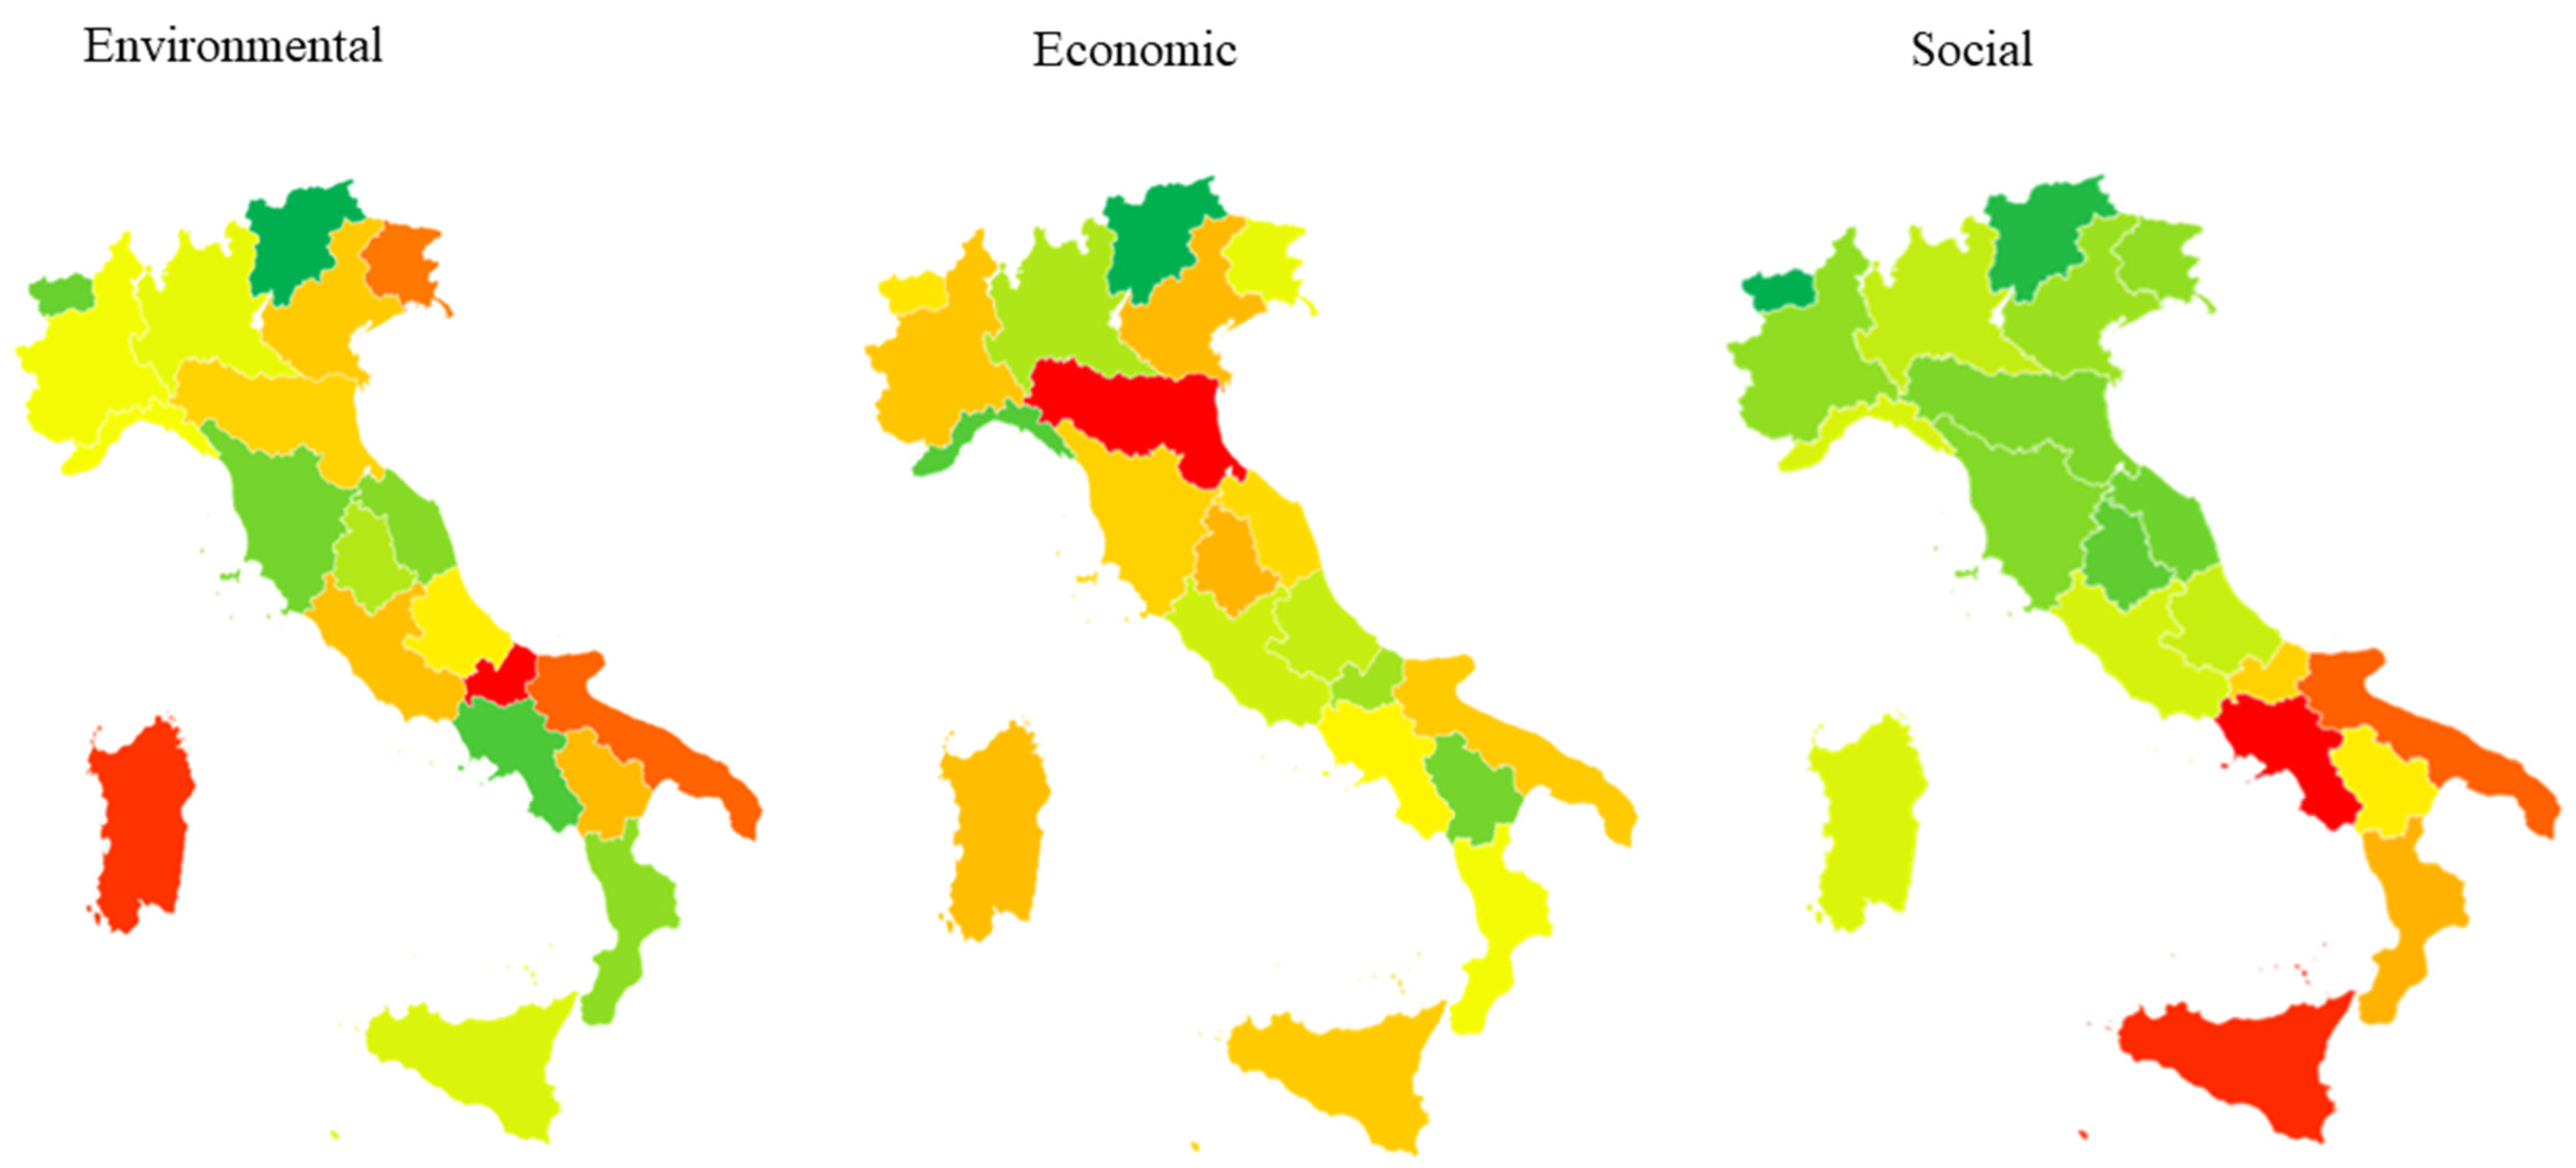
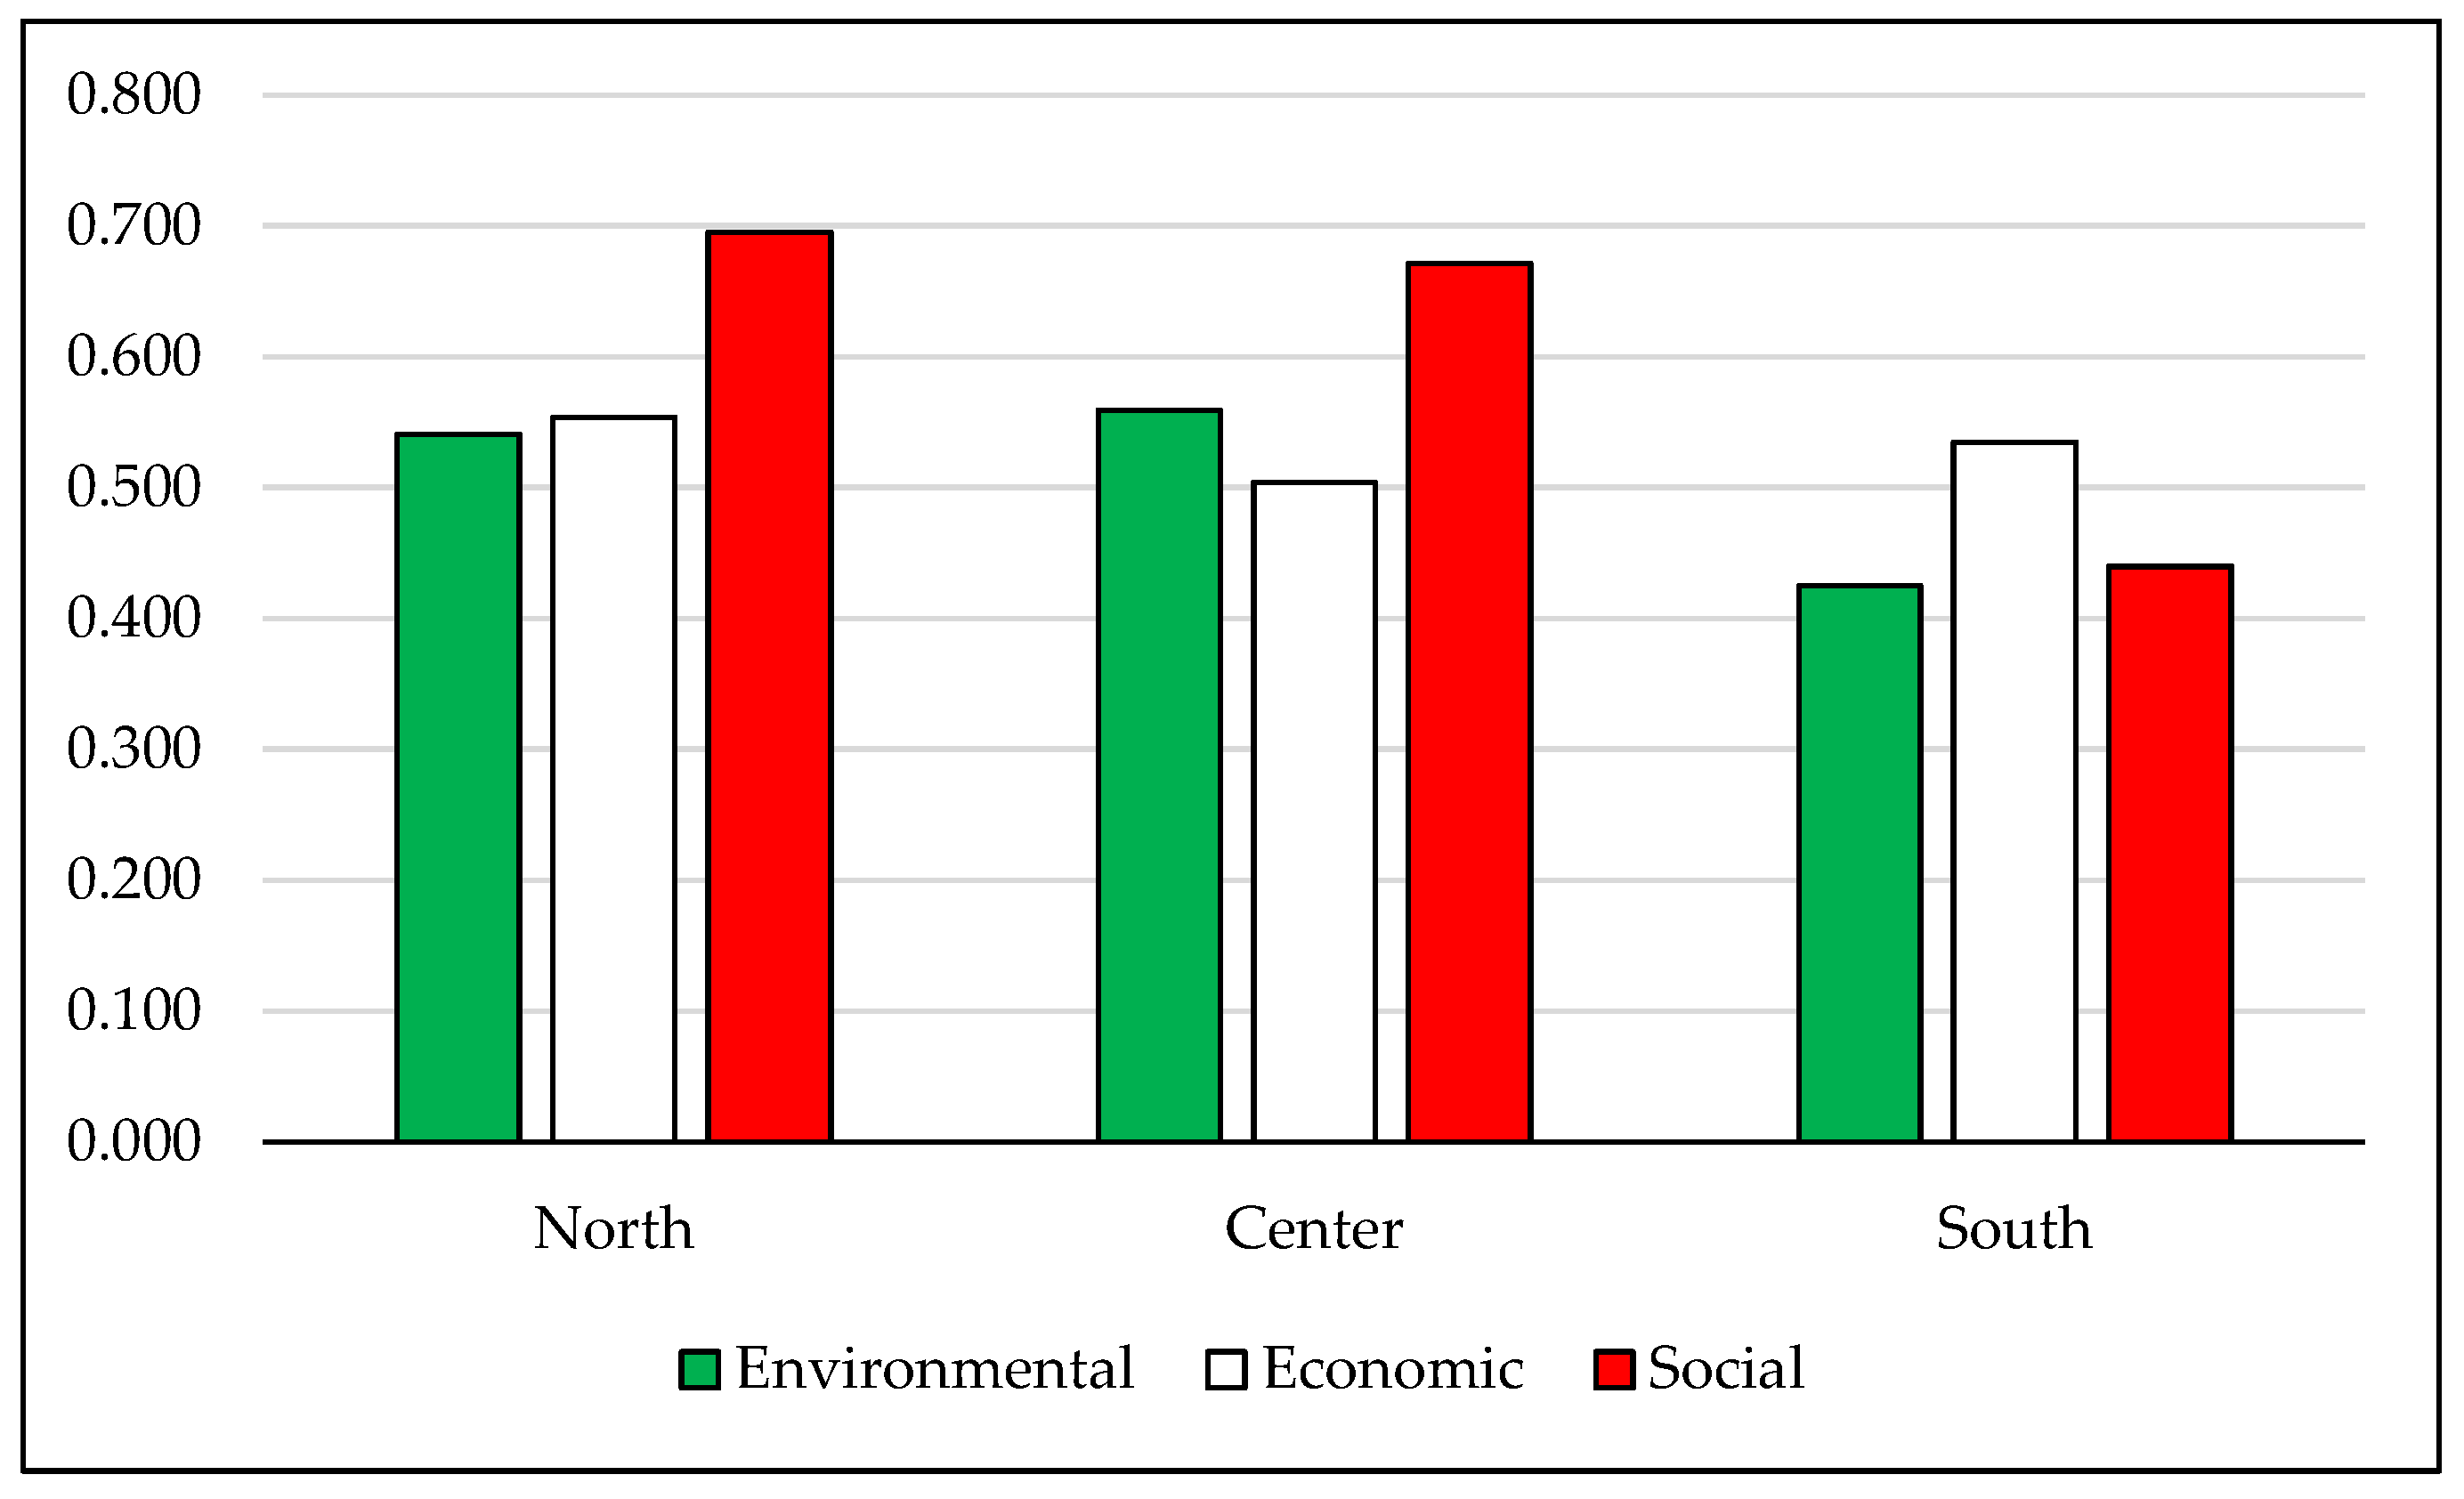
  • Environmental Sustainability with 113,518 items (44%);
  • Economic Sustainability with 75,134 items (29%);
  • Social Sustainability with 71,339 items (26%).
The literature review found that placing equal weights on indicators is a widespread and accepted practice [56]. In particular, the logical idea is to assign equal adequacy to individual indicators [57]. This approach is therefore chosen in several papers, and other analyses show it as the preferred criterion [28,58], but point out that alternative scenarios can also be developed [40]. In particular, some authors prefer to opt for a different weight [59].
In addition, the analysis will also be conducted at the territorial level by identifying three macro-areas:
  • North—Valle d’Aosta, Piemonte, Lombardia, Liguria, Trentino Alto Adige, Veneto, Friuli Venezia Giulia and Emilia Romagna.
  • Center—Toscana, Umbria, Marche and Lazio.
  • South—Abruzzo, Molise, Campania, Puglia, Basilicata, Calabria, Sardegna and Sicilia.

3. Results

The results of this work allow for the mapping of Italian regions based solely on the targets considered; they are not exhaustive of an overall assessment of the SDGs. In fact, the number of criteria considered is not comparable to that of other studies [39], but it is crucial as it allows new information to be provided to decision makers. The sustainability challenge does not admit delay and can move in the wake of pragmatism. For the purposes of the EWG scenario, it should be pointed out that after the first intermediate phase in which targets were normalized in the 0–1 range and aggregated within the relevant SDG, a second normalization phase was applied. The values were restored to the maximum value of 1, which was not reached if within the specific SDG, all targets were rewarded the same alternative. The sustainability score (output of MCDA) is shown in Figure 1 and Figure 2 for the EWG and EWI scenarios, respectively.
The results show that the Trentino Alto Adige region excels, with the Province of Trento having a leading position in both rankings (0.827 and 0.785 in the EWG and EWI scenarios). Its value detects a very significant performance toward the maximum value of 1 and its gap is quite significant compared to the alternatives that follow it in the rankings: 0.134 compared to the Province of Bolzano in the EWG scenario and 0.157 compared to Valle d’Aosta in the EWI scenario. These two alternatives trade relative position in the two scenarios in third place with a small gap from the relative second. Thus, the first picture that emerges from these results is the important figure of the northern regions. In particular, the Province of Trento is first in several Targets (3.4, 4.1, 9.5 and 16.3), the Province of Bolzano in Targets 8.5 and 8.6 and Valle d’Aosta in other Targets (1.2, 2.4a, 5.5, 6.4, 7.2, 10.4 and 16.7). Maximum performance is achieved in these targets. However, even these virtuous regions have some aspects that need to be improved. Target 2.4b has a low value in all three territories; the Province of Bolzano has a low value for the Target 9.5c and Valle d’Aosta for the Targets 7.3, 9.5 and 11.2.
Scrolling down the ranking, the relevant performance of other northern regions, such as Liguria, Lombardia, Piemonte and Veneto, is confirmed, which are always above the national average (0.544 in the EWG scenario and 0.494 in the EWI scenario). We want to underline the particular performance of Friuli Venezia Giulia and Emilia Romagna, which are above average only in the EWI scenario.
However, the fourth place in both scenarios belongs to a central region (Marche). It does not top in any of the targets considered, but shows significant performance in Targets 4.1c, 10.4 and 13.2, while it shows weak performance in Target 9.5. Marche is followed by Toscana in the ranking, and Umbria, among the central regions, appears above the national average. Again, Lazio appears above the national average only in the EWI scenario.
Regarding the southern regions, the certainly interesting figure is that of Abruzzo, the only region among the eight to have a value above the national average in both scenarios. Important performances are achieved in several Targets (2.4a, 4.1c, 4.3, 10.4 and 11.6) and the highest performance in Target 15.5. In contrast, weak performances are achieved in Targets 6.4, 9.5, and 15.3. The interesting fact is this region prevails over other northern regions (Veneto, Emilia Romagna) and the remaining central region (Lazio). In the EWG scenario it also precedes Friuli. However, it should be remembered that this analysis refers only to the analysis involving the 28 targets identified by ASviS.
As mentioned, all other southern regions occupy the last positions in the ranking and, in particular, the weakest results are recorded by the three most populous regions in this macro-area: Campania, Sicilia and Puglia. The results showed that the value of Target 9.5 was low for several alternatives. In order to give an answer to this aspect, it is useful to apply the concentration indicator for each target. The excellent performance of the Province of Trento and the strong gap with all other alternatives leads to a very low concentration indicator. A similar situation occurs for Target 14.5, which we said is valid for only a few alternatives and with a better performance than Toscana. In contrast, the results tend to be very similar for Targets 2.4a and 10.4—Figure 3.
A further analysis that can be conducted is on the basis of the sustainability dimension. Again, it is worth noting that the results obtained refer only to the targets proposed by ASviS, but they provide an interesting overview—Figure 4.
The Province of Trento is a leader in all dimensions considered. Together with the Province of Bolzano (second in the environmental side and third in the economic side) and Lombardia, these are the only territorial realities that are above the national average in all dimensions. Valle d’Aosta (second in the social), Toscana, Marche and Umbria are regions that only in the economic dimension show a lower performance than the national average. Liguria (second in the economic) and Abruzzo present a mirror assessment relative to the environmental dimension in which they perform worse than the national average. Finally, Puglia is the only region that in no dimension performs better than the national average.
The proposed results thus showed that within territorial areas regions’ behaviors vary, but they show a gap that particularly affects the South. Unlike other studies, even in the environmental dimension it does not tend to perform optimally—Figure 5. However, it should be pointed out that these results are strongly affected by the small number of targets: thirteen related to the social dimension, nine to the economic dimension and six to the environmental dimension.
The northern regions excel with a value of 0.615, which is slightly higher than the 0.582 associated with the central regions. In contrast, the difference with the southern regions appears to be much more significant, with a value of 0.469. These results can be explained by the reasons seen for the individual regions, since these are values that are obtained simply by aggregating the regions’ data associated with the relevant macro-areas. The south has a significant gap in both the social dimension (in which northern Italy excels) and the environmental dimension (in which central Italy excels). The particular figure, however, is for the economic dimension in which the variations are much less significant and see the North excel, followed by the South. This result is affected by the weak performance of Emilia Romagna, which presents the worst value in terms of Target 12.4.
Finally, the last analysis that can be conducted is one in which the values proposed in Section 2 are always considered, but in this alternative scenario, a different weight is given to the criteria. Specifically, a different weight is not given to each individual target or SDG, but to its dimension—Figure 6.
The results see the Province of Trento still in first place with 0.809, followed by the Province of Bolzano with 0.712. Compared to the baseline scenario, it occurs that Calabria exceeds the national average figure (0.522), while Umbria and Veneto take the reverse path. This result evidently depends on environmental performance, which, in the weighted average, accounts for 44 percent. There is also a significant increase in Campania, which has a better environmental performance than Calabria, which is next in the economic dimension, but closes the ranking in the social dimension.

4. Conclusions

The theme of sustainability has now become a term that is used in all contexts in order to identify positive action towards civil society and in the protection of eco-systems. However, our society is far from applying sustainable hand concepts, as there is an interest, often economic, that overrides the other dimensions. The SDGs are a remarkably relevant benchmark, but not all targets can always be quantified. In such scenarios, it becomes essential to identify benchmarks and make them as objective as possible.
Moreover, the sustainability challenge can only be met if all countries move toward the same goal. The world is a puzzle in which if the largest emitting components do not implement responsible behaviors, inevitably the other components of the puzzle will be harmed as well. In this context, policy makes the choices and should move toward a shared goal that is useful for the future. However, it is up to all of us citizens to make a contribution, big or small it does not matter, but we should be protagonists of a participatory model. We need to promote best practices, demand reforms and choose responsible consumption patterns. Inevitably, businesses, to compete in the marketplace, will also have to adapt. This is particularly so at this time when both the COVID-19 pandemic and the conflict in Ukraine have brought attention to the relevance of having resources locally. Within this framework, the bioeconomy plays a key role, as it enables the use of resources that potentially move toward sustainability.
This work proposes an easily replicable method of analysis in which, regardless of the number of criteria available, it is possible to provide a sketch of an area. A limitation of the work is certainly the small number of the targets, but the main methodological contribution is to provide a framework that can be adopted. The framework, based on MCDA, consists of the following steps: (i) finding recent sustainable data for each alternative; (ii) homogenization among these data; (iii) identification of weights for these criteria by choosing alternative methods; and (iv) decomposition analysis of the final result according to its components (e.g., sustainability dimension and definition of a geographic macro-area). Another limitation of this paper is that it proposes an alternative scenario based on the weights of the three dimensions of sustainability, but values obtained with unequally weighted weights can also be proposed in order to see how the results change. In addition, if you make the assignment of weights through experts, the results may change depending on the categories of stakeholders.
Such work, however, also provides managerial insights. Although the analyses cannot be extended to the overall level of sustainability, they allow for, at the level of the targets analyzed, the observation of how performance in the Italian territory varies widely. Trentino Alto Adige (with the provinces of Trento and Bolzano) and Valle d’Aosta have very relevant results and, in general, most of the northern regions move in that direction. The central regions also show positive results and, in particular, Marche and Toscana propose high values of sustainability score. Finally, among the southern ones, only Abruzzo stands out. It thus emerges that very populous regions, such as Emilia Romagna, Lazio, Campania, Puglia and Sicilia, require interventions in the targets examined in this paper. This also prompts reflection on whether current city patterns, in which a depopulation of inland areas to densely populated areas takes place, is a positive aspect for sustainability. This work has not explored this issue in depth, but the question needs to be asked if we are trying to understand whether we want a decentralized or centralized society. Perhaps the solution lies in how resources are distributed differently in various territories, without being concentrated. However, research has the task of investigating these issues.
The result that emerges from this work is the need to optimize the resources at one’s disposal, to invest in the availability of these data that are strategic for making decisions, and to identify policies that can move more resources. The target on research and development indicates that many territories can invest in this aspect, and likewise the green and circular resources need to be enhanced. Sometimes, the social aspect is neglected because it is more difficult to identify. However, the key turning point could be precisely in citizen involvement, collaboration between territorial realities, and the ability to match young talent with more experienced figures. Sustainability is not a trend, and the natural disasters of recent times define the urgency of implementing policies that promote sustainable actions and practices. A sustainability that should be demonstrated with numbers by moving from innovative and resilient ideas.
The results of this work show that there are opportunities for sustainability that have not yet been well explored, highlighting a weak performance of southern regions; European and Italian policies place special emphasis on this. However, public money should be spent only when it produces a benefit for the community, otherwise it generates a debt to be borne by future generations. The political choice can, therefore, be to reward a “green, bio and circular Made in Italy” in which the sad European record of NEET (not [engaged] in education, employment or training) in Italy is overcome and young people are allowed to make their contribution to this society. We need to put resources and skills at the center of the sustainable agenda, each with its own profile and taking advantage of the benefits associated with interdisciplinary. Investment is the best medicine for an economy that risks periods of stagnation, and through the development of the various excellences that characterize Italian territories, this Mediterranean country can play a decisive role in European economic recovery.

Author Contributions

Conceptualization, I.D. and M.G.; methodology, I.D. and M.G.; data curation, I.D. and M.G.; writing—original draft preparation, I.D. and M.G.; writing—review and editing, I.D. and M.G.; supervision, I.D. All authors have read and agreed to the published version of the manuscript.

Funding

This research received no external funding.

Institutional Review Board Statement

Not applicable.

Informed Consent Statement

Not applicable.

Data Availability Statement

Not applicable.

Acknowledgments

We are grateful to Yichen Shen for her passion and expertise in handling this special issue.

Conflicts of Interest

The authors declare no conflict of interest.

References

  1. Halkos, G.; Gkampoura, E.-C. Where do we stand on the 17 Sustainable Development Goals? An overview on progress. Econ. Anal. Policy 2021, 70, 94–122. [Google Scholar] [CrossRef]
  2. Di Vaio, A.; Varriale, L.; Di Gregorio, A.; Adomako, S. Corporate social performance and non-financial reporting in the cruise industry: Paving the way towards UN Agenda 2030. Corp. Soc. Responsib. Environ. Manag. 2022, in press. [Google Scholar] [CrossRef]
  3. Vacchi, M.; Siligardi, C.; Demaria, F.; Cedillo-González, E.I.; González-Sánchez, R.; Settembre-Blundo, D. Technological Sustainability or Sustainable Technology? A Multidimensional Vision of Sustainability in Manufacturing. Sustainability 2021, 13, 9942. [Google Scholar] [CrossRef]
  4. Ben Amara, D.; Chen, H. Evidence for the Mediating Effects of Eco-Innovation and the Impact of Driving Factors on Sustainable Business Growth of Agribusiness. Glob. J. Flex. Syst. Manag. 2021, 22, 251–266. [Google Scholar] [CrossRef]
  5. Liu, J.; Ma, Y.; Appolloni, A.; Cheng, W. How external stakeholders drive the green public procurement practice? An organizational learning perspective. J. Public Procure. 2021, 21, 138–166. [Google Scholar] [CrossRef]
  6. Ippolito, N.M.; Amato, A.; Innocenzi, V.; Ferella, F.; Zueva, S.; Beolchini, F.; Vegliò, F. Integrating life cycle assessment and life cycle costing of fluorescent spent lamps recycling by hydrometallurgical processes aimed at the rare earths recovery. J. Environ. Chem. Eng. 2022, 10, 107064. [Google Scholar] [CrossRef]
  7. Taddei, E.; Sassanelli, C.; Rosa, P.; Terzi, S. Circular supply chains in the era of Industry 4.0: A systematic literature review. Comput. Ind. Eng. 2022, 170, 108268. [Google Scholar] [CrossRef]
  8. Moustairas, I.; Vardopoulos, I.; Kavouras, S.; Salvati, L.; Zorpas, A.A. Exploring factors that affect public acceptance of establishing an urban environmental education and recycling center. Sustain. Chem. Pharm. 2022, 25, 100605. [Google Scholar] [CrossRef]
  9. Duxbury, N.; Kangas, A.; De Beukelaer, C. Cultural policies for sustainable development: Four strategic paths. Int. J. Cult. Policy 2017, 23, 214–230. [Google Scholar] [CrossRef]
  10. Grelaud, M.; Ziveri, P. The generation of marine litter in Mediterranean island beaches as an effect of tourism and its mitigation. Sci. Rep. 2020, 10, 20326. [Google Scholar] [CrossRef]
  11. Cucchiella, F.; Gastaldi, M.; Miliacca, M. The management of greenhouse gas emissions and its effects on firm performance. J. Clean. Prod. 2017, 167, 1387–1400. [Google Scholar] [CrossRef]
  12. Dwivedi, A.; Moktadir, M.A.; Chiappetta Jabbour, C.J.; de Carvalho, D.E. Integrating the circular economy and industry 4.0 for sustainable development: Implications for responsible footwear production in a big data-driven world. Technol. Forecast. Soc. Chang. 2022, 175, 121335. [Google Scholar] [CrossRef]
  13. Morone, P.; Imbert, E. Food waste and social acceptance of a circular bioeconomy: The role of stakeholders. Curr. Opin. Green Sustain. Chem. 2020, 23, 55–60. [Google Scholar] [CrossRef]
  14. Backhouse, M.; Lühmann, M.; Tittor, A. Global Inequalities in the Bioeconomy: Thinking Continuity and Change in View of the Global Soy Complex. Sustainability 2022, 14, 5481. [Google Scholar] [CrossRef]
  15. Eliades, F.; Doula, M.K.; Papamichael, I.; Vardopoulos, I.; Voukkali, I.; Zorpas, A.A. Carving out a Niche in the Sustainability Confluence for Environmental Education Centers in Cyprus and Greece. Sustainability 2022, 14, 8368. [Google Scholar] [CrossRef]
  16. D’Adamo, I.; Sassanelli, C. Biomethane Community: A Research Agenda towards Sustainability. Sustainability 2022, 14, 4735. [Google Scholar] [CrossRef]
  17. D’Adamo, I.; Gastaldi, M.; Morone, P.; Rosa, P.; Sassanelli, C.; Settembre-blundo, D.; Shen, Y. Bioeconomy of Sustainability: Drivers, Opportunities and Policy Implications. Sustainability 2022, 14, 200. [Google Scholar] [CrossRef]
  18. Li, S.; Jia, R.; Seufert, J.H.; Hu, W.; Luo, J. The impact of ability-, motivation- and opportunity-enhancing strategic human resource management on performance: The mediating roles of emotional capability and intellectual capital. Asia Pacific J. Hum. Resour. 2022, 60, 453–478. [Google Scholar] [CrossRef]
  19. Voukkali, I.; Zorpas, A.A. Evaluation of urban metabolism assessment methods through SWOT analysis and analytical hierocracy process. Sci. Total Environ. 2021, 807, 150700. [Google Scholar] [CrossRef]
  20. Sarker, M.R.; Moktadir, M.A.; Santibanez-Gonzalez, E.D.R. Social Sustainability Challenges Towards Flexible Supply Chain Management: Post-COVID-19 Perspective. Glob. J. Flex. Syst. Manag. 2021, 22, 199–218. [Google Scholar] [CrossRef]
  21. Gusmão Caiado, R.G.; Leal Filho, W.; Quelhas, O.L.G.; Luiz de Mattos Nascimento, D.; Ávila, L.V. A literature-based review on potentials and constraints in the implementation of the sustainable development goals. J. Clean. Prod. 2018, 198, 1276–1288. [Google Scholar] [CrossRef]
  22. Allen, C.; Metternicht, G.; Wiedmann, T. Prioritising SDG targets: Assessing baselines, gaps and interlinkages. Sustain. Sci. 2019, 14, 421–438. [Google Scholar] [CrossRef]
  23. Yigitcanlar, T.; Kamruzzaman, M. Does smart city policy lead to sustainability of cities? Land Use Policy 2018, 73, 49–58. [Google Scholar] [CrossRef]
  24. Mallick, S.K.; Das, P.; Maity, B.; Rudra, S.; Pramanik, M.; Pradhan, B.; Sahana, M. Understanding future urban growth, urban resilience and sustainable development of small cities using prediction-adaptation-resilience (PAR) approach. Sustain. Cities Soc. 2021, 74, 103196. [Google Scholar] [CrossRef]
  25. Loizia, P.; Voukkali, I.; Zorpas, A.A.; Navarro Pedreño, J.; Chatziparaskeva, G.; Inglezakis, V.J.; Vardopoulos, I.; Doula, M. Measuring the level of environmental performance in insular areas, through key performed indicators, in the framework of waste strategy development. Sci. Total Environ. 2021, 753, 141974. [Google Scholar] [CrossRef]
  26. Krishankumar, R.; Mishra, A.R.; Ravichandran, K.S.; Peng, X.; Zavadskas, E.K.; Cavallaro, F.; Mardani, A. A Group Decision Framework for Renewable Energy Source Selection under Interval-Valued Probabilistic linguistic Term Set. Energies 2020, 13, 986. [Google Scholar] [CrossRef] [Green Version]
  27. Sciarra, C.; Chiarotti, G.; Ridolfi, L.; Laio, F. A network approach to rank countries chasing sustainable development. Sci. Rep. 2021, 11, 15441. [Google Scholar] [CrossRef]
  28. Marti, L.; Puertas, R. Assessment of sustainability using a synthetic index. Environ. Impact Assess. Rev. 2020, 84, 106375. [Google Scholar] [CrossRef]
  29. Xu, Z.; Chau, S.N.; Chen, X.; Zhang, J.; Li, Y.; Dietz, T.; Wang, J.; Winkler, J.A.; Fan, F.; Huang, B.; et al. Assessing progress towards sustainable development over space and time. Nature 2020, 577, 74–78. [Google Scholar] [CrossRef]
  30. Miola, A.; Schiltz, F. Measuring sustainable development goals performance: How to monitor policy action in the 2030 Agenda implementation? Ecol. Econ. 2019, 164, 106373. [Google Scholar] [CrossRef]
  31. Hametner, M.; Kostetckaia, M. Frontrunners and laggards: How fast are the EU member states progressing towards the sustainable development goals? Ecol. Econ. 2020, 177, 106775. [Google Scholar] [CrossRef]
  32. Kostetckaia, M.; Hametner, M. How Sustainable Development Goals interlinkages influence European Union countries’ progress towards the 2030 Agenda. Sustain. Dev. 2022, in press. [Google Scholar] [CrossRef]
  33. Ionescu, G.H.; Firoiu, D.; Tănasie, A.; Sorin, T.; Pîrvu, R.; Manta, A. Assessing the Achievement of the SDG Targets for Health and Well-Being at EU Level by 2030. Sustainability 2020, 12, 5829. [Google Scholar] [CrossRef]
  34. Giannetti, B.F.; Agostinho, F.; Almeida, C.M.V.B.; Liu, G.; Contreras, L.E.V.; Vandecasteele, C.; Coscieme, L.; Sutton, P.; Poveda, C. Insights on the United Nations Sustainable Development Goals scope: Are they aligned with a ‘strong’sustainable development? J. Clean. Prod. 2020, 252, 119574. [Google Scholar] [CrossRef]
  35. Costanza, R.; Daly, L.; Fioramonti, L.; Giovannini, E.; Kubiszewski, I.; Mortensen, L.F.; Pickett, K.E.; Ragnarsdottir, K.V.; De Vogli, R.; Wilkinson, R. Modelling and measuring sustainable wellbeing in connection with the UN Sustainable Development Goals. Ecol. Econ. 2016, 130, 350–355. [Google Scholar] [CrossRef]
  36. García López, J.; Sisto, R.; Benayas, J.; de Juanes, Á.; Lumbreras, J.; Mataix, C. Assessment of the Results and Methodology of the Sustainable Development Index for Spanish Cities. Sustainability 2021, 13, 6487. [Google Scholar] [CrossRef]
  37. Cheng, D.; Xue, Q.; Hubacek, K.; Fan, J.; Shan, Y.; Zhou, Y.; Coffman, D.M.; Managi, S.; Zhang, X. Inclusive wealth index measuring sustainable development potentials for Chinese cities. Glob. Environ. Chang. 2022, 72, 102417. [Google Scholar] [CrossRef]
  38. Ricciolini, E.; Rocchi, L.; Cardinali, M.; Paolotti, L.; Ruiz, F.; Cabello, J.M.; Boggia, A. Assessing Progress Towards SDGs Implementation Using Multiple Reference Point Based Multicriteria Methods: The Case Study of the European Countries. Soc. Indic. Res. 2022, 162, 1233–1260. [Google Scholar] [CrossRef]
  39. D’Adamo, I.; Gastaldi, M.; Imbriani, C.; Morone, P. Assessing regional performance for the Sustainable Development Goals in Italy. Sci. Rep. 2021, 11, 24117. [Google Scholar] [CrossRef]
  40. D’Adamo, I.; Gastaldi, M.; Ioppolo, G.; Morone, P. An analysis of Sustainable Development Goals in Italian cities: Performance measurements and policy implications. Land Use Policy 2022, 120, 106278. [Google Scholar] [CrossRef]
  41. D’Adamo, I.; Gastaldi, M.; Morone, P. Economic sustainable development goals: Assessments and perspectives in Europe. J. Clean. Prod. 2022, 354, 131730. [Google Scholar] [CrossRef]
  42. Richiedei, A.; Pezzagno, M. Territorializing and Monitoring of Sustainable Development Goals in Italy: An Overview. Sustainability 2022, 14, 3056. [Google Scholar] [CrossRef]
  43. Zeng, Y.; Runting, R.K.; Watson, J.E.M.; Carrasco, L.R. Telecoupled environmental impacts are an obstacle to meeting the sustainable development goals. Sustain. Dev. 2022, 30, 76–82. [Google Scholar] [CrossRef]
  44. Jamwal, A.; Agrawal, R.; Sharma, M.; Kumar, V. Review on multi-criteria decision analysis in sustainable manufacturing decision making. Int. J. Sustain. Eng. 2021, 14, 202–225. [Google Scholar] [CrossRef]
  45. Radmehr, A.; Bozorg-Haddad, O.; Loáiciga, H.A. Integrated strategic planning and multi-criteria decision-making framework with its application to agricultural water management. Sci. Rep. 2022, 12, 8406. [Google Scholar] [CrossRef] [PubMed]
  46. Han, Q.; Zhu, Y.; Ke, G.Y.; Hipel, K.W. An ordinal classification of brownfield remediation projects in China for the allocation of government funding. Land Use Policy 2018, 77, 220–230. [Google Scholar] [CrossRef]
  47. Nesticò, A.; Elia, C.; Naddeo, V. Sustainability of urban regeneration projects: Novel selection model based on analytic network process and zero-one goal programming. Land Use Policy 2020, 99, 104831. [Google Scholar] [CrossRef]
  48. Sironen, S.; Primmer, E.; Leskinen, P.; Similä, J.; Punttila, P. Context sensitive policy instruments: A multi-criteria decision analysis for safeguarding forest habitats in Southwestern Finland. Land Use Policy 2020, 92, 104460. [Google Scholar] [CrossRef]
  49. Vlachokostas, C.; Michailidou, A.V.; Achillas, C. Multi-Criteria Decision Analysis towards promoting Waste-to-Energy Management Strategies: A critical review. Renew. Sustain. Energy Rev. 2021, 138, 110563. [Google Scholar] [CrossRef]
  50. Phillis, A.; Grigoroudis, E.; Kouikoglou, V.S. Assessing national energy sustainability using multiple criteria decision analysis. Int. J. Sustain. Dev. World Ecol. 2021, 28, 18–35. [Google Scholar] [CrossRef]
  51. Streimikiene, D.; Siksnelyte, I.; Zavadskas, E.K.; Cavallaro, F. The Impact of Greening Tax Systems on Sustainable Energy Development in the Baltic States. Energies 2018, 11, 1193. [Google Scholar] [CrossRef] [Green Version]
  52. Resce, G.; Schiltz, F. Sustainable Development in Europe: A Multicriteria Decision Analysis. Rev. Income Wealth 2021, 67, 509–529. [Google Scholar] [CrossRef]
  53. Mazziotta, M.; Pareto, A. Measuring Well-Being Over Time: The Adjusted Mazziotta–Pareto Index Versus Other Non-compensatory Indices. Soc. Indic. Res. 2018, 136, 967–976. [Google Scholar] [CrossRef]
  54. AsviS Report Territories 2021. Available online: https://asvis.it/rapporto-territori-2021/ (accessed on 28 June 2022).
  55. Kettunen, M.; Boywer, C.; Vaculova, L.; Charveriat, C. Sustainable Development Goals and the EU: Uncovering the Nexus between External and Internal Policies; Institute of European Environmental Policy: Brussels, Belgium, 2018. [Google Scholar]
  56. Gan, X.; Fernandez, I.C.; Guo, J.; Wilson, M.; Zhao, Y.; Zhou, B.; Wu, J. When to use what: Methods for weighting and aggregating sustainability indicators. Ecol. Indic. 2017, 81, 491–502. [Google Scholar] [CrossRef]
  57. Roszkowska, E.; Filipowicz-Chomko, M. Measuring sustainable development in the education area using multi-criteria methods: A case study. Cent. Eur. J. Oper. Res. 2020, 28, 1219–1241. [Google Scholar] [CrossRef] [Green Version]
  58. Sachs, J.; Schmidt-Traub, G.; Kroll, C.; Lafortune, G.; Fuller, G. SDG Index and Dashboards Report 2018; Bertelsmann Stiftung and Sustainable Development Solutions Network (SDSN): New York, NY, USA, 2018. [Google Scholar]
  59. Guijarro, F.; Poyatos, J.A. Designing a Sustainable Development Goal Index through a Goal Programming Model: The Case of EU-28 Countries. Sustainability 2018, 10, 3167. [Google Scholar] [CrossRef] [Green Version]
Figure 1. Sustainability Score in EWG scenario.
Sustainability 14 09779 g001
Figure 2. Sustainability Score in EWI scenario.
Sustainability 14 09779 g002
Figure 3. Indicator concentration. All normalized values are reported in red colors for each target.
Sustainability 14 09779 g003
Figure 4. Sustainability Score in EWG scenario—Environmental, economic and social group.
Sustainability 14 09779 g004
Figure 5. Sustainability Score in EWG scenario—A comparison among macro-areas.
Sustainability 14 09779 g005
Figure 6. Sustainability Score in EWG scenario with different weights.
Sustainability 14 09779 g006
Table 1. List of criteria.
SDGTargetYearUnit
SDG 1Target 1.2—By 2030, reduce the number of people at risk of poverty or social exclusion by 20% compared with 20192019%
SDG 2Target 2.4 (a)—By 2030, reduce the use of distributed fertilizer in agriculture by 20% compared to 20202020quintals per ha
SDG 2Target 2.4 (b)—By 2030, reach the share of 25% of UAA invested by organic crops2019%
SDG 3Target 3.4—By 2025, reduce the probability of dying from noncommunicable diseases by 25% compared to 20132018%
SDG 3Target 3.6—By 2030, halve road traffic injuries compared to 20192020per 10,000 population
SDG 4Target 4.1 (a)—By 2030, reduce the number of students who do not reach the sufficient level of numerical proficiency (18–19 years old) below the 15% quota2021%
SDG 4Target 4.1 (b)—By 2030, reduce the number of students who do not reach the sufficient level of literacy proficiency (18–19 years old) below the 15% quota2021%
SDG 4Target 4.1 (c)—By 2030, reduce early exit from education and training (18–24 years old) below the 9% rate2020%
SDG 4Target 4.3—By 2030, reach the 50% share of college graduates (30–34 years old)2020%
SDG 5Target 5.5—By 2030, halve the gender employment gap compared with 20202020females/males * 100
SDG 6Target 6.3—By 2027 ensure high or good ecological quality status for all surface water bodies2015%
SDG 6Target 6.4—By 2030, achieve 90% efficiency share of drinking water distribution networks2018%
SDG 7Target 7.2—By 2030, achieve 40% share of energy from renewable sources.2018%
SDG 7Target 7.3—By 2030, reduce gross final energy consumption by 14.4% compared to 20192019ktoe per 10,000 population
SDG 8Target 8.5—By 2030 to reach 78% employment rate (20–64 years old)2020%
SDG 8Target 8.6—By 2030, reduce the share of NEETs to below 9% (15–29 years old)2020%
SDG 9Target 9.5—By 2030, reach the share of 3% of GDP devoted to research and development2019%
SDG 9Target 9.c—By 2026, ensure all households have Gigabit network coverage2019%
SDG 10Target 10.4—By 2030, reduce the disposable income inequality index to the levels observed in the best of European countries2018s80/s20
SDG 11Target 11.2—By 2030, increase the number of seat-km per inhabitant offered by public transport by 26% compared to 20042019places-Km per inhabitant
SDG 11Target 11.6—By 2030, reduce exceedances of the PM10 limit to below 3 days per year2019days
SDG 12Target 12.4—By 2030, reduce the share of municipal waste generated per capita by 27% compared to 20032019kg/inhab.* year
SDG 13Target 13.2—By 2030, reduce CO2 and other climate-changing gas emissions by 55% from 1990 levels2017ton CO2 equivalent per capita
SDG 14Target 14.5—By 2030, reach 30% share of marine protected areas.2019%
SDG 15Target 15.3—By 2050, bring the increase in annual land consumption to zero2020ha per 100,000 population
SDG 15Target 15.5—By 2030, reach 30% share of protected land areas2019%
SDG 16Target 16.3—By 2030, reduce overcrowding in correctional institutions to zero2020%
SDG 16Target 16.7—By 2030, reduce the average duration of civil proceedings to the levels observed in the best of the Italian regions2020days
Table 2. List of values. (A) IT = Italy; A1 = Piemonte; A2 = Valle d’Aosta; A3 = Liguria; A4 = Lombardia; A5 = Province Bolzano; A6 = Province Trento; A7 = Veneto; A8 = Friuli Venezia Giulia; A9 = Emilia Romagna; A10 = Toscana; * = Estimated. (B) A11 = Umbria; A12 = Marche; A13 = Lazio; A14 = Abruzzo; A15 = Molise; A16 = Campania; A17 = Puglia; A18 = Basilicata; A19 = Calabria; A20 = Sicilia; A21 = Sardegna.
(A)
TargetITA1A2A3A4A5A6A7A8A9A10
1.20.5790.7931.0000.7720.8050.9180.8580.9280.8630.8220.745
2.4 (a)0.7020.6191.0000.5710.0000.9880.9760.2980.4520.3210.857
2.4 (b)0.3380.0000.0290.1990.0190.0130.0030.0290.0060.3250.527
3.40.4780.4350.5650.4570.5870.7831.0000.6740.5430.6740.652
3.60.6810.7990.8210.0000.6880.5160.8420.6670.7170.4050.337
4.1 (a)0.4100.7260.7390.4910.8600.5491.0000.6530.6640.6490.528
4.1 (b)0.4200.7080.7830.5420.8160.4661.0000.6560.6050.6130.478
4.1 (c)0.5480.6430.6780.7570.6520.4521.0000.7740.9480.8780.670
4.30.5790.6420.5850.5720.8930.5030.9620.7230.8360.8930.604
5.50.5350.7651.0000.7560.7310.8220.8670.5980.6860.7960.782
6.30.3840.5030.8740.7070.2600.9330.8260.3400.3880.2480.298
6.40.4060.5851.0000.4480.7700.8570.6480.4390.2960.7280.382
7.20.1460.1301.0000.0000.0710.7350.4690.1170.1460.0370.119
7.30.6530.3640.0000.7340.2660.2310.2540.2310.1040.0580.474
8.50.5550.7560.8540.6920.8381.0000.8630.8080.8410.8960.811
8.60.5660.7050.8250.6930.8011.0000.9120.9080.9520.8610.817
9.50.0510.0920.0000.0510.0410.0151.0000.0460.0620.0820.056
9.c0.6740.6970.1270.9840.6360.0000.7370.3760.4340.5920.516
10.40.5200.7201.0000.7600.7200.7600.9400.9400.9000.8200.780
11.20.3880.4280.0000.3491.0000.2890.3290.4630.3420.2100.238
11.60.434 *0.0000.9280.9640.1330.9880.9640.1450.7110.2770.711
12.40.518 *0.5470.1910.4210.5950.5400.4600.5600.5340.0000.165
13.20.6470.4710.4350.6000.4940.6710.6710.5530.2470.3650.671
14.50.3700.0000.0000.1300.0000.0000.0000.0000.1090.0001.000
15.30.6630.5850.5391.0000.7200.6840.8080.3890.8340.6220.813
15.50.3310.2030.4360.1240.1500.5560.8530.1280.1920.0940.165
16.30.4160.3980.5550.1610.1090.3171.0000.1800.0250.4260.451
16.70.6050.9341.0000.8660.8240.9370.9510.7560.9490.8530.708
(B)
TargetA11A12A13A14A15A16A17A18A19A20A21
1.20.8750.7360.5990.5940.2790.0000.2960.3610.2380.0240.519
2.4 (a)0.8330.7740.7860.8100.9050.7860.8450.9760.8810.9400.940
2.4 (b)0.2770.5430.5760.1960.0290.2510.4950.5051.0000.6590.158
3.40.6300.7390.4350.5000.3260.0000.5430.4350.4130.2830.435
3.60.6810.4520.5050.7600.9680.9930.5810.9321.0000.7630.875
4.1 (a)0.3840.4090.3150.2290.5430.0000.0710.2560.0520.0520.190
4.1 (b)0.4470.4600.4100.2900.5030.0000.1010.2650.0140.1450.236
4.1 (c)0.7130.8350.6520.9910.9390.1830.3300.8090.2430.0000.643
4.30.8810.7801.0000.8110.4090.1570.0750.3840.1320.0000.409
5.50.7620.6860.6180.3880.3820.0000.0310.1590.0140.0370.640
6.30.0000.3440.3420.3460.0100.3010.0110.0251.0000.5710.507
6.40.0300.6480.0750.0000.2990.3010.3130.3130.3190.1520.131
7.20.2090.1330.0120.2450.4130.1130.1130.5300.4390.0640.213
7.30.2720.7230.6820.6070.7171.0000.6420.6940.9600.9880.740
8.50.7290.7470.6190.5270.3960.0030.1710.3110.0000.0030.341
8.60.7490.7810.6020.6690.3670.1200.3230.4460.1160.0000.454
9.50.0260.0310.0720.0310.0360.0410.0150.0050.0050.0150.021
9.c0.3920.1151.0000.2680.0330.8400.4550.1780.1500.5770.225
10.40.9200.8600.5800.8000.6200.1600.5000.8600.6000.0000.500
11.20.1120.1520.5590.1800.0100.1210.1260.0510.0960.1030.269
11.60.6140.6020.1810.8551.0000.5660.8430.9400.7710.7470.361
12.40.4760.4500.5020.6570.9550.6930.6341.0000.8540.6890.683
13.20.5530.8350.6710.7760.3761.0000.2940.4710.7530.6590.000
14.50.0000.0000.1090.2610.0000.4350.2170.0000.1960.4780.413
15.30.8290.6170.7250.1240.0000.9220.4660.3320.8810.6890.306
15.50.2180.2970.4101.0000.0000.9060.4550.6650.5710.3420.083
16.30.5590.5070.3200.5070.0130.4110.0000.5170.6730.6950.894
16.70.5560.7520.6020.6880.5830.3320.3690.0000.1220.3470.509
Publisher’s Note: MDPI stays neutral with regard to jurisdictional claims in published maps and institutional affiliations.

