1. Introduction
Living creatures on this earth need water as an essential element. Almost 70% of the human body is made up of water. Access to clean drinking water is not merely required for human existence but is also considered one of the basic human rights [
1]. However, the manifestation of several organic and inorganic toxins, such as pesticides, phenol, chlordane, arsenic fluoride, nitrate, copper, etc., cause the population to consume poor quality water, which is perilous to their health [
2]. According to UNICEF and the WHO, all over the world, approximately 2.2 billion people lack access to clean and innocuous drinking water sources. However, about 2 billion people live in high-water-stress countries [
3]. According to the WHO, by 2025, almost half of the entire world’s population will be forced to live in areas with scarce water sources. Moreover, 6.8 billion individuals worldwide have access to basic drinking water services, while 785 million people around the globe lack access to these services [
4].
Contaminated drinking water poses a serious threat to human life across the world. Diseases transmitted due to drinking contaminated water include cholera, diarrhea, typhoid, and dysentery [
5]. Waterborne diseases, especially diarrhea, kill approximately one million people globally, and, mostly, children under five years of age are at a higher risk of diarrhea [
6]. According to estimates by the World Bank [
6], all over the world, because of diarrhea, a well-known disease allied with poor quality of drinking water, about 2.5–3.5 million people are infected, while 485,000 die yearly. Moreover, almost 80 percent of children annually become water-related syndrome victims. Several non-diarrheal illnesses are also associated with the unavailability of adequate and safe drinking water sources. Numerous chemicals (i.e., organic and inorganic) also have an adversative effect on human health in several diseases such as cancer, vomiting, skin rashes, and nausea [
6]. Contaminated water causes about 4% of all deaths and 7.5% of all illnesses worldwide [
7].
Similarly, in Pakistan, sources of clean drinking water are diminishing swiftly, and drinking water quality is viewed as a grave issue [
8]. Poor and indecorous arrangements of the water supply and sewage ejection systems result in the sewage and mess being directly released into drains which ultimately flows into the sea, rivers, or canals and adversely damages water quality [
9]. According to a World Bank report [
6], 64 percent of Pakistan’s population lacks access to clean and innocuous drinking water sources. Only 36 percent of Pakistan’s population has access to safely managed and clean drinking water. Therefore, the environmental performance index ranked Pakistan at 140 out of 180 countries regarding safe water and sanitation. Moreover, a report by the World Bank highlighted that 25 percent of the total population in Pakistan is at high risk of consuming arsenic-contaminated water [
6]. Pakistan is among the top 10 countries that lack access to clean drinking water, where rich people have more access to safe drinking water sources than poor households [
9].
Likewise, the public faces problems regarding access to safe and suitable drinking water in Pakistan. Pollution of drinking water causes a greater threat to Pakistan’s public health. Out of 122 nations, Pakistan is in 80th place in terms of following the drinking water quality standards [
10]. According to the World Bank report [
6], about 53,000 children die annually in Pakistan due to severe diarrhea or waterborne illness. Moreover, drinking contaminated water infected 4 out of 10 children in the country [
6]. Moreover, from 2010 to 2019, approximately 250,000 deaths occurred in Pakistan due to drinking contaminated water [
11]. Additionally, arsenic, a hazardous pollutant and chemical, has been cited as a key cause of waterborne diseases in several areas of the country. The high level of arsenic in drinking water endangered the health of more than 60 million inhabitants, especially in Punjab, Pakistan [
12].
To cope with this problem, the local government has instigated a platform to install safe drinking water filtration plants in each city in Pakistan. The reason for the installation of these plants is to meet the Millennium Development Goal (M.D.G.) by delivering non-toxic drinking water to the public by the end of 2030 [
13]. To attain this tenacity, the government of Pakistan, in the middle of 2005, instigated an initiative termed the Clean Drinking Water Initiative (CDWI) to fix about 452 WPEPs (Water Purification Filtration Plants) practically in every tehsil of the Punjab province. Conversely, instead of enormous exertions to provide access to safe drinking water from WPFPs, the community is still facing several problems, for instance, a long-time shutdown of plants due to huge load shedding or closure of plants during holidays, and the non-functionality of a few plants because of a lack of supervision [
14].
1.1. Background of Local Government Filtration Plants Project
Lahore is one of the most populous cities and is considered the second-largest city in Pakistan, with 12,642,000 inhabitants [
3]. Likewise, the public of Lahore city is also suffering from problems associated with drinking water quality. According to the Pakistan Council of Research in Water Resources (PCRWR) documentation in 2020 [
11], in several areas of Lahore, drinking water quality is exceedingly tainted. Thus, the local government has started an initiative to ease this concern. Local government is a public administration found in cities, districts, and counties. In a community, the local government is liable for numerous services to meet the community’s needs. Likewise, in Pakistan, the local government is held accountable for services such as waste management and collection, services related to infrastructure, health-associated services (i.e., water and food and water scrutiny, sewerage and toilet-related facilities, other water-based services, welfare, as well as community care services, transportation, and education-related services). At the outset, local government and community administrations were not involved in decisions associated with the provision and supply of water in the country. However, local governments were obligated to provide drinking water-related supplies in 2001 under an ordinance termed the Local Government Ordinance (L.G.O.). Hence, in Pakistan, the local government provides vital services associated with health and secure water supply. Besides, federal and provisional governments were held liable for providing sufficient funds to local governments to ensure the delivery of effective and good services to the public [
15].
The endowment of unpolluted drinking water to the inhabitants of Pakistan is the foremost duty of the local government. Thus, to fulfill this purpose, the local government, coordinating the community development department (CD), fixed drinking water filtration plants at several places in Lahore. This decision of plant fixation by the government is based on the level of the arsenic chemical in water, microbiological and other viral contamination in drinking water, public income, as well as public access level, while the number of these water filtration plants fixed by the local government reached 215 in May 2020 in Lahore [
15]. Each of these plants can filter about 500 gallons of water an hour. The elementary purpose of the fixation of these water plants is to remove contamination, chemicals, microbes, and arsenic from the water to convert it into a safe form for consumption and drinking by the public [
16].
This study was devised to gauge the effect of polluted water on public health and to relate the probability of waterborne illnesses ensued in selected households in two types of study areas (i.e., areas retaining water filtration plants and areas abstaining from plants) in Lahore under the health lifestyle theory, which argues that several regular lifestyle practices implicate deliberations on health-related outcomes [
17]. In this study, health-related behavior under collective patterns such as class circumstances, socialization/experience, dispositions to act (habitus), and practices (actions) based on drinking filtration plant water choices conferring on their life chances of waterborne illness was assessed. Thus, the main aim of this study was to discover the health threats and health-associated costs endured by households in the target study areas and the influence of drinking water on infants’ and children’s health in areas having and lacking plants. The impact of class circumstances (age, education, and family size), experience, or awareness in making life choices based on drinking filtration plant water was also measured.
Moreover, this study compared waterborne disease incidence in households in targeted areas with and without local government filtration plants. Studies which deeply investigated the association between drinking water, morbidity, and related concerns in filtration plants are scarce. Besides, no comparative study of filtration plants’ projects and non-project areas under the health lifestyle theory has been conducted yet. This assessment discoursed a comprehensive layout concerned with the quality of drinking water in Pakistan through an exceptional focus on key water impurities, water degradation sources, and subsequent health-associated concerns. Thus, this review substantially contributes to endorsing consciousness in realizing hazards and threats of the factors causing water pollution and waterborne diseases.
This comprehensive investigation will likewise advance the public’s ability to quantitatively comprehend the effects of drinking water effluence and the efficiency of prevailing inventiveness regarding clean drinking water for the public, undertaken by the local government by the fixation of filtration plants. However, this enumerated evaluation will be a helpful instrument for the government to formulate and implement better strategies for the endowment of impurity-free drinking water to the community. Additionally, this evaluation will significantly contribute to the literature regarding health-associated issues. Another value of this detailed study is that it will be considered a strong reference tool in impending studies. As a whole, it will assist in enhancing the progression of research focused on concerns associated with drinking water quality.
1.2. Drinking Water Degradation and Human Health
Drinking water is becoming highly contaminated. The main reason behind this contamination is municipal solid waste leachate. Thus, highly toxic elements and chemicals are destroying water quality [
18,
19]. Contamination of drinking water is one of the major health concerns in today’s world. In Pakistan, the high level of arsenic in drinking water endangered the health of more than 60 million people, especially in the province of Punjab. Moreover, the pollution of drinking water poses a greater threat to Pakistan’s public health than any other factor. Despite violating drinking water quality standards established by the WHO, there is a lack of research regarding the drinking water risk perception of households in-country [
6,
8,
10,
12].
According to studies, cholera is caused by contaminated drinking water, untreated surface water, the detoxification points of water use, and poor sanitation. Moreover, this water contamination also causes waterborne diseases such as diarrhea. Thus, important interventions are needed to protect the public from the harmful impacts of waterborne illness [
20,
21]. In the same regard, a study by Adimalla [
22] demonstrated that nitrate concentration in drinking water has adverse impacts on the health of residents in India. Nitrate concentration crossed the critical limit regarding non-carcinogenic risk. A high nitrate level had poor effects on children’s and women’s health.
Additionally, studies in different countries, including Mexico, Pakistan, and China, revealed that fluoride and arsenic concentration in drinking water poses a great threat to human life. This arsenic consumption is a cause of cancer among households due to households bearing the burden of illness. Arsenic in drinking water results in Type 2 Diabetes Mellitus (T2DM). Moreover, people were found to have arsenic skin lesion disease. As a result, arsenic-contaminated water seriously threatens human health [
23,
24,
25,
26]. Moreover, contaminated drinking water destroys the health of living beings around the globe. Different bacteria destroy the quality of drinking water. Contaminated drinking water causes cardiovascular diseases, skin disorders, respiratory problems, liver and splenic ailments, gastrointestinal tract complications, kidney and bladder infections, neurotoxicity, reproductive failure, and cancer. The immediate consequences of contaminated water are less well documented. Other waterborne diseases are cholera, hepatitis, diarrhea, dracunculiasis, ulcers, typhoid, endocrine damage, and arsenicosis [
26,
27,
28,
29].
Worldwide, drinking water quality is not meeting the standards the WHO and the environmental protection agency set. Thus, awareness regarding the adverse effects of contaminated water must be enhanced [
30]. Treatment of these diseases at an early stage is essential; otherwise, they may lead to death [
20,
28]. Furthermore, previous research found that a high proportion of households drink contaminated water, while others use water from improved sources. Moreover, arsenic concentration risk is significantly associated with location and type of water source, place of residence, and living district. Thus, household water should be regularly tested to reduce the risk associated with arsenic. Moreover, arsenic-contaminated water adversely impacts human health, which ultimately forces people to lose their jobs and live a sub-standard life [
31,
32].
Moreover, studies in China, Korea, and Pakistan revealed that heavy metals toxify the quality of drinking water, whose consumption is harmful to human health. Different treatment methods can be applied to reduce the harmful effects of heavy metals in drinking water. Thus, water treatment by different methods helps reduce microbial, inorganic, heavy metal, and other types of contamination from drinking water and makes water safe for human consumption and health. Additionally, piped water helps in reducing infant mortality, and both males and females gain equal health benefits from drinking piped water. Moreover, this piped water has a greater impact on post-neonatal mortality as compared with neonatal mortality [
33,
34].
1.3. Knowledge, Waterborne Illness, and Health Expenditures
Socioeconomic characteristics with psychological factors to study drinking water behavior are important as they provide a holistic framework to understand human behavior. Moreover, knowledge and norms play an important role in using water after treatment. Similarly, education and income levels were significant with water treatment before drinking. Thus, findings revealed that demographic and socioeconomic attributes such as age, education, income, past experiences, and social networks played an important role in perceiving vulnerability. Moreover, the health vulnerability of households is affected by their access to information, health facilities, and the availability of safe water [
35,
36,
37]. Studies in Bangladesh revealed that households bear the cost of having access to safe water sources due to poor water quality and insufficient and unreliable water supply. The poor spend more income on having access to improved water resources [
7,
38].
In the same regard, studies have revealed that drinking contaminated water causes diarrhea in children and other family members; 50% of children suffered from acute watery diarrhea (AWD), with a mean age of five. Fewer respondents were found to know about drinking water quality and waterborne illnesses. Additionally, studies in Uganda and India revealed that demographic factors such as mother’s education, income level of households, age of children, gender, and awareness of water quality and waterborne diseases influence the reduction of acute watery diarrhea and other waterborne illnesses. However, the government’s role is essential in providing clean water to the public [
37,
39,
40].
Similarly, according to Thakur and Gupta [
41], in India, high arsenic levels in drinking water cause arsenisois. Awareness regarding arsenic contamination in drinking water and arsenisois played a vital role in the reduction of this waterborne disease. As a result of arsenicosis, people have to bear health care and treatment costs due to visiting doctors. This illness mostly attacks females as compared with males. Moreover, access to improved drinking water sources and income levels can potentially reduce arsenicosis. Children are found to be at greater risk of waterborne illness as compared with other age groups.
Furthermore, because they have access to safe drinking water sources, the general public expends less physical effort and time collecting water. Moreover, access to safe and clean drinking water resources causes fewer water-related illnesses, ultimately reducing public health expenditures [
7,
42]. In the United States and Pakistan, Surface water quality is seriously diminishing. Nationwide degradation of drinking water causes 90 million illnesses. This illness may result in a financial burden, healthcare, and hospitalization costs [
8,
43]. Likewise, in Europe, Australia, and China, lack of public awareness and ineffective political measures are huge hurdles to drinking safe water and taking preventive measures by the public. More knowledge and awareness must be created among the public to reduce water-related risks. Moreover, the governance system must be strengthened to communicate water-related risks to the public [
44,
45,
46].
1.4. Drinking Water and Government Roles
One of the prominent roles played by any country’s government is to resolve water quality issues. Governments spend large subsidies in low- and middle-income countries on improving water sources. According to a recent World Bank report, government spending on water resource improvement accounts for 2% of total G.D.P. However, findings in ten countries revealed that 56% of these subsidies benefited the wealthiest people, while only 6% benefited the poorest [
6]. The government spends a lot on improving drinking water resources. Although the government enhanced its spending on water improvements in the U.S. and Americas, there is still a violation of standards regarding water pollution [
47,
48,
49].
According to studies conducted in Germany, South Africa, India, and Pakistan, water treatment is necessary to protect people from the hazards of waterborne illness. Point-of-use water treatment effectively makes drinking water safe and achieves the sustainable goal of clean drinking water [
33,
50,
51]. The facilities for clean water provided by the government are declining drastically. Thus, people mostly rely on private water sources. Therefore, government policies need to be revised to overcome this waterborne disease problem [
48,
49,
52].
Although the government has installed filtration plants in various cities of Pakistan, these plants are not fully reliable sources of safe and clean drinking water. A few samples were found to be contaminated. Due to the electricity shortage and poor water connections, some plants are not properly operational. Besides, in Punjab, the working conditions of filtration plants are much better than in other provinces [
11,
53,
54]. Additionally, polluted water poses a greater threat to human life. Different private and government bodies such as T.M.A., district councils, PHEDs, and WASA provide services related to the public’s provision and supply of clean drinking water. Still, water management by these bodies is not effective in urban areas. Coordination between the federal and interim governments appeared lacking [
55]. In Nigeria, Uganda, and USA, people are mostly dependent on private water sources as facilities related to the government’s provision of clean drinking water have been declining. Consequently, there is an urgent need for government actions to tackle this issue [
39,
48,
52].
Thus, it is concluded from the literature that drinking water sources are degrading in Pakistan due to arsenic, fluoride, heavy metals, and other organic and inorganic pollutants. Drinking contaminated water has severe impacts on the health of people. Diseases that mostly occur due to drinking contaminated water are kidney infections, cholera, hepatitis, diarrhea, dracunculiasis, ulcers, typhoid, endocrine damage, arsenicosis, and respiratory tract infections. Any country’s government plays a critical role in ensuring that the populace has access to safe drinking water. Water from improved drinking water sources or water filtration plants can prevent households from contracting waterborne illnesses. Moreover, the literature reveals that age, education, income, and family size are important determinants in choosing to drink water from improved sources; thus, waterborne illness is reduced.
2. Underpinning Theory and Hypothesis Development
Healthy lifestyles are collective patterns of health-related behavior that focus entirely on available options or choices for people conferring more life chances [
17]. This description integrates the indigenous relationship among the life choices and life chances anticipated by Weber in one of his most important conceptions regarding lifestyle. According to the Weberian viewpoint, life choices and agency are alternatives, while life changes can be seen in structure form. Whereas lifestyle choices and health exist in a voluntary nature, on the other hand, life chances largely symbolize the class position, which may endow or restrict choices, as choices and chances work off each other to regulate the behavior-related outcomes.
Furthermore, Gochman [
56] pointed out that if lifestyle behaviors are positive, they oppose risk behaviors such as good nutrition, which is the converse of bad nutrition. The twofold nature of health-related lifestyle practices refers to consequences resulting from the interchange of choices and changes that reflect positive or negative health impacts. Gochman detected that health-related lifestyles are anticipated to escape associated risks and stay slanted towards inclusive health or fitness. Nevertheless, a “healthy lifestyle” is intended to embrace healthy living.
Historically, people took their health less for granted, but this is not true in present cases. In this modern era, health is viewed as a great achievement. People imagine making an effort to boost their life quality or reduce the risks of persistent illness and untimely deaths [
57]. However, Giddens [
58] stated that lifestyle preferences are more important for people becoming more responsible for their health. These circumstances instigate the variations in (i) disease patterns, (ii) modernity, and (iii) social identities.
Health lifestyle theory argues that several lifestyle practices reflect health-related outcomes [
17]. Thus, everyone is responsible for themselves by choosing healthy living options to have a healthy lifestyle. It must be a life or death issue for the person to be responsible for achieving a healthy lifestyle.
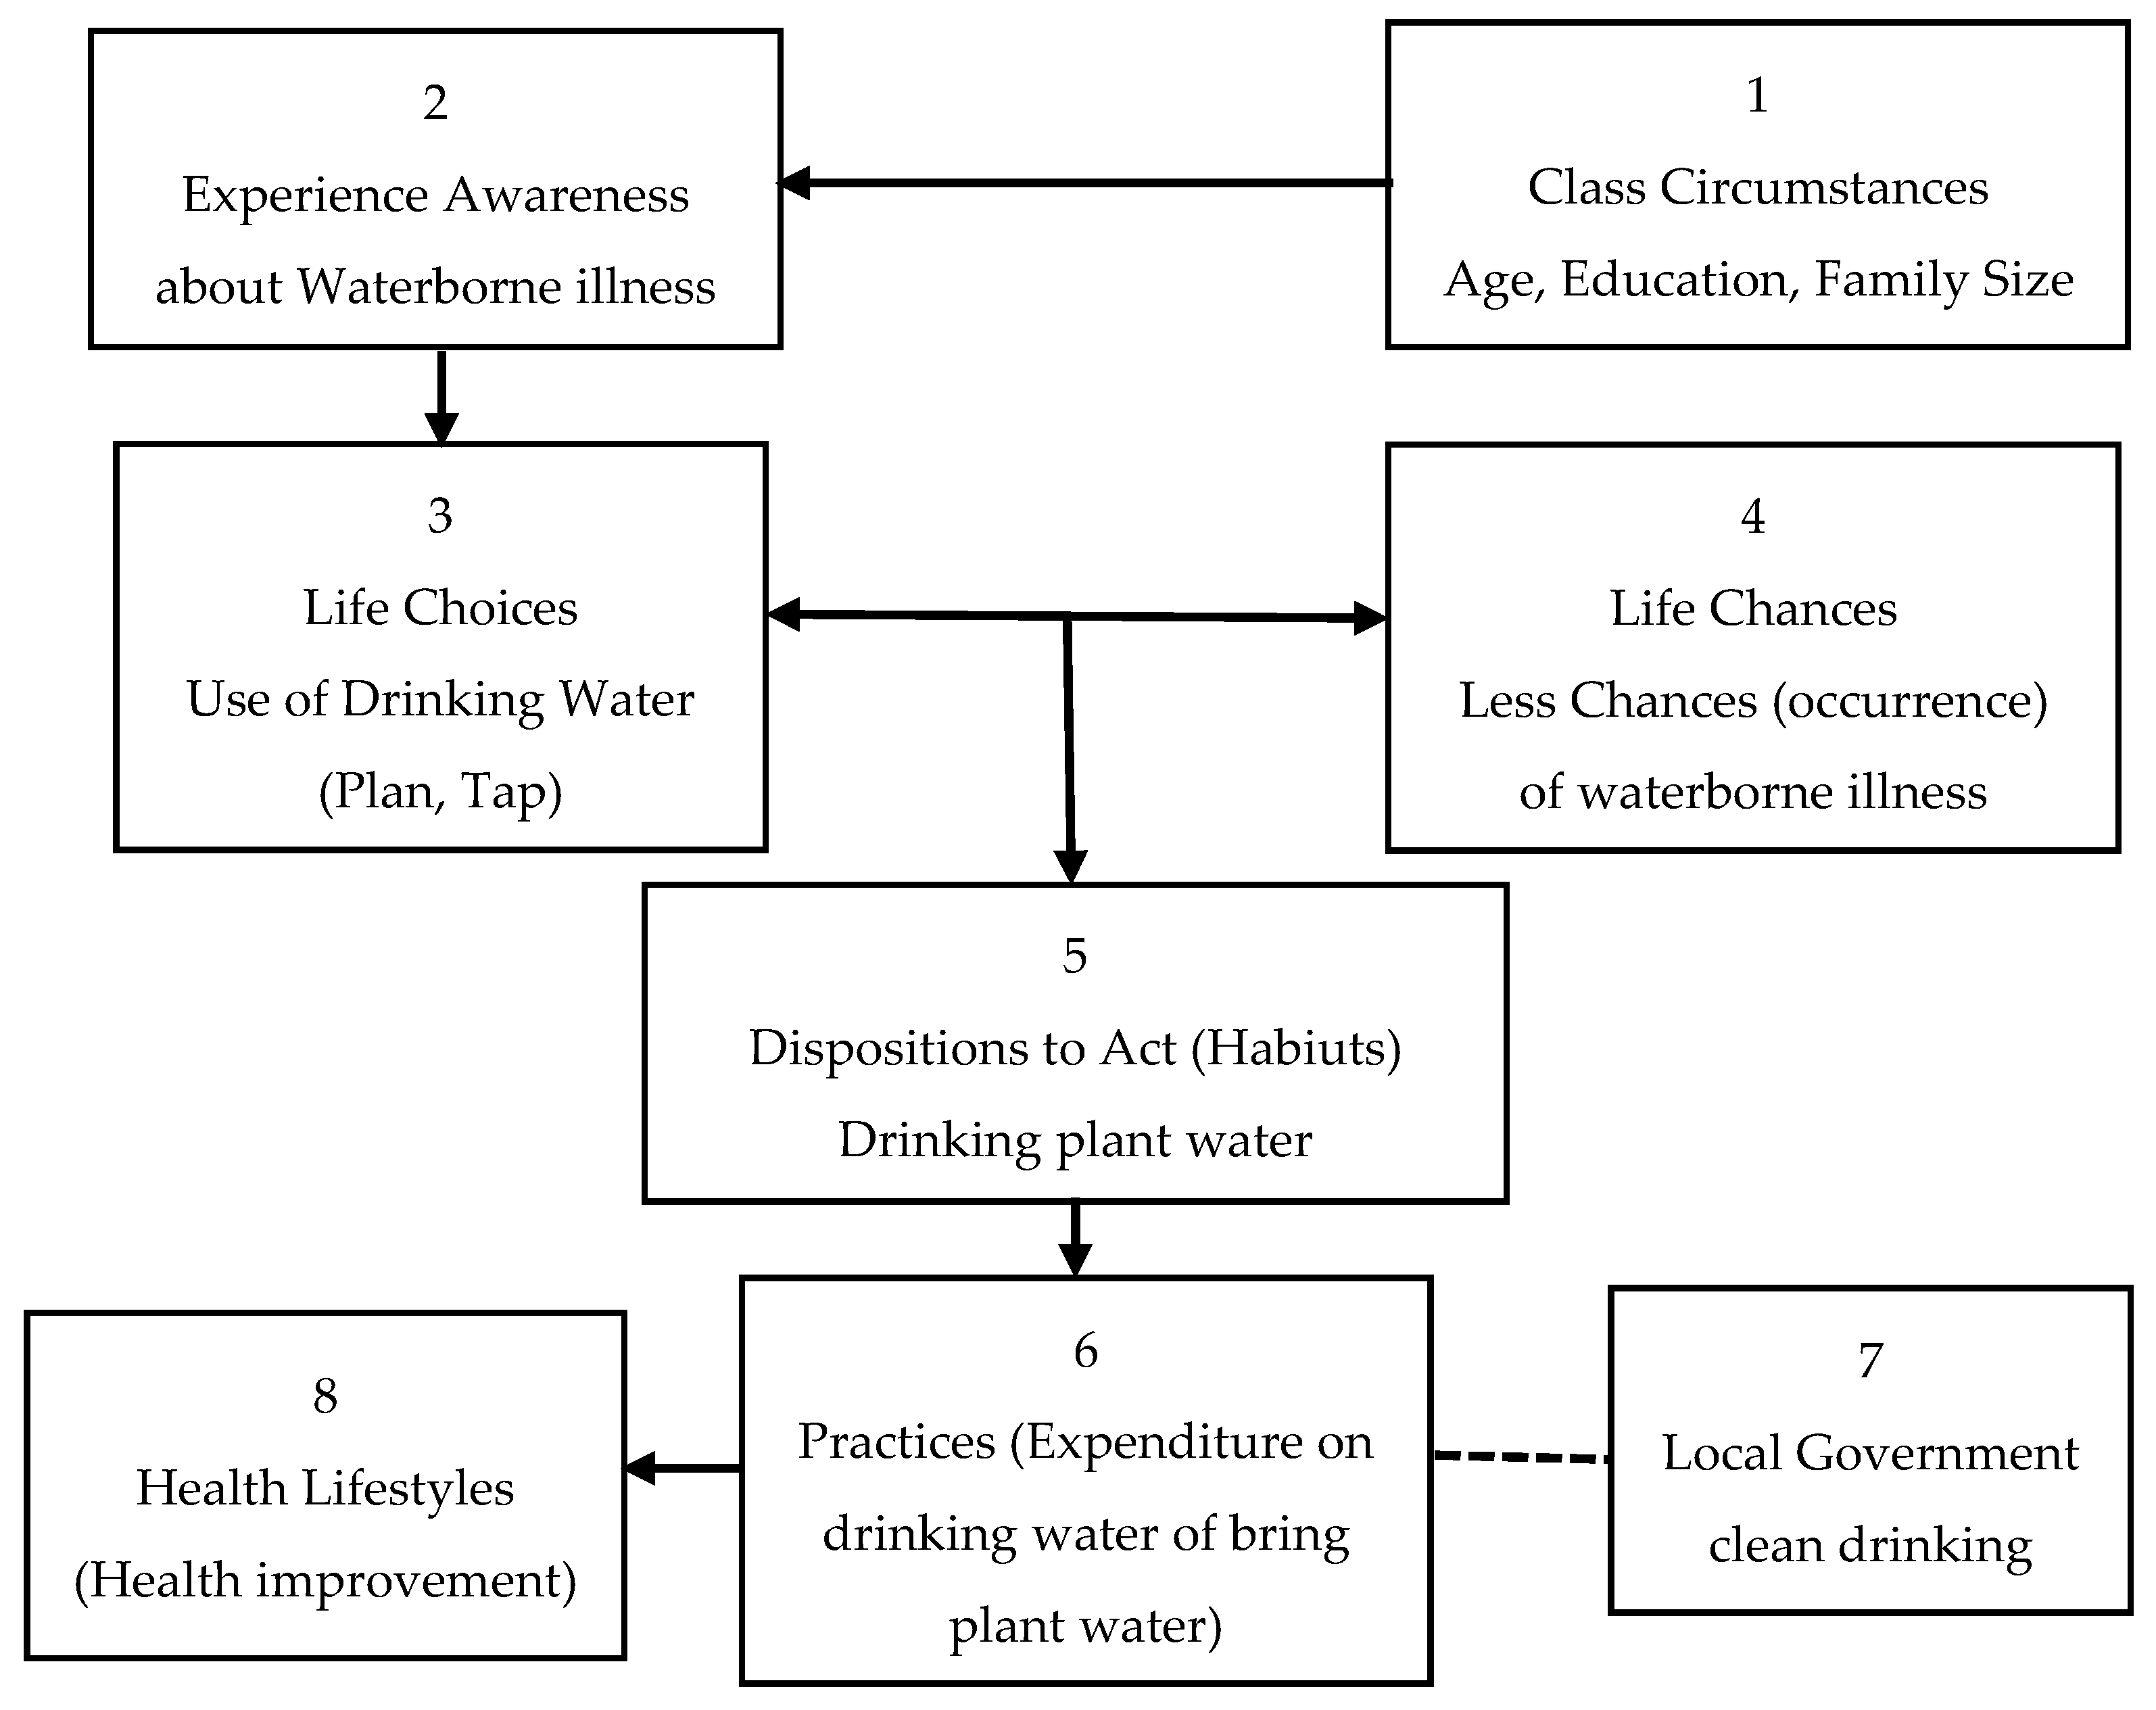
Figure 1 elaborates the flow of integral components of health lifestyle theory where class circumstance highlights age, education, gender, race/ethnicity, living conditions, and commonalities as all of these factors significantly impact the selection of drinking water and raise awareness about the waterborne illness; as stated by Bourdieu [
59], the dispositions to act are built through socialization and experience. Moreover, experience establishes the basis for life choices, which means “the self-direction of one’s behavior”, which may lead to fewer occurrences of waterborne illness if households make life choices of using plant water. The interface of life choices and life chances takes the individual dispositions towards action, as shown in
Figure 1—such dispositions are instituted as habits. Habitus refers to the cognitive/mental map or the perceptions that usually help evaluate and guide the person’s options and choices. The disposition of an act (the preference to use clean drinking water) indulges households in practices. Practices refer to action; therefore, the arrow is pointing from the disposition of an act to practices.
- (1)
Class circumstances
This category comprises age, education, gender, race/ethnicity, living conditions, and commonalities. Age, education of the household head, and family size are considered class circumstances in this study because these factors significantly impact the selection of drinking water and raise awareness about waterborne illnesses. Thus, we hypothesize as follows:
Hypothesis 1 (H1). The greater the age of the household head, the lesser the occurrence of waterborne disease.
Hypothesis 2 (H2). An increase in the education of household heads decreases the occurrence of waterborne diseases.
- (2)
Socialization/Experience
Box 1 in
Figure 1 depicts the social framework for the socialization/experience involving class circumstances and associated variables, as illustrated by the arrow pointing to Box 2. Thus, this concept is supported by Bourdieu’s [
59] suggestion that the dispositions to act are built through socialization and experience. In this study, variables in box 1 provide the basis for experience and influence the decision that either household has to go for plant water or not, as illustrated by the arrow from box 1 to box 2. Thus, we hypothesize as follows:
Hypothesis 3 (H3). Family size has a positive relationship with waterborne diseases.
- (3)
Life Choices
The model in
Figure 1 indicates that experience establishes the basis for life choices, as illustrated in box no. 3. As described earlier, Weber introduced the term “life choices”, which means “the self-direction of one’s behavior”. In this study, “life choice” refers to plant or tap water for drinking.
- (4)
Life Chances
As reflected in box no. 1, class circumstances and additional variables led to life chances (referring to structure) as revealed in box no. 4. Dahrendorf [
60] dictated that Weber’s work-life chances refer to “glazed chances of finding satisfaction for wants, needs, and interests, hence the possibility of manifestation of the events which ultimately carry out such satisfaction”. In the context of this study, life chances mean fewer occurrences of waterborne illness by using plant water.
- (5)
Dispositions to Act (Habitus)
The interface of life choices and life chances takes the individual dispositions towards action, as shown in box 5 of
Figure 1—such dispositions are instituted as habits. Habitus refers to the cognitive/mental map or the perceptions that usually help evaluate and guide the person’s options and choices. Here, in this study, when households realized drinking plant water prevents them from waterborne illness, as the local government installed these plants to provide clean drinking water, they showed the disposition of the act by using plant water more for drinking purposes. Hence, we propose the following hypothesis:
Hypothesis 4 (H4). Households using local government filtration plant water are healthier than households not using local government filtration plant water.
Hypothesis 5 (H5). Infants and children using local government filtration plant water have fewer waterborne diseases than families not using local government filtration plant water.
- (6)
Practices (actions)
The disposition of an act (the preference to use clean drinking water) indulges households in practices. Practices refer to an action, as illustrated in
Figure 1. These actions involve either bringing water from plants or incurring expenditures to bring water from plants. These practices ultimately lead to health improvement by decreasing the occurrence of waterborne illnesses. In this regard, the hypothesis is framed as follows:
Hypothesis 6 (H6). More expenditure on drinking water reduces the incidence of waterborne illness.
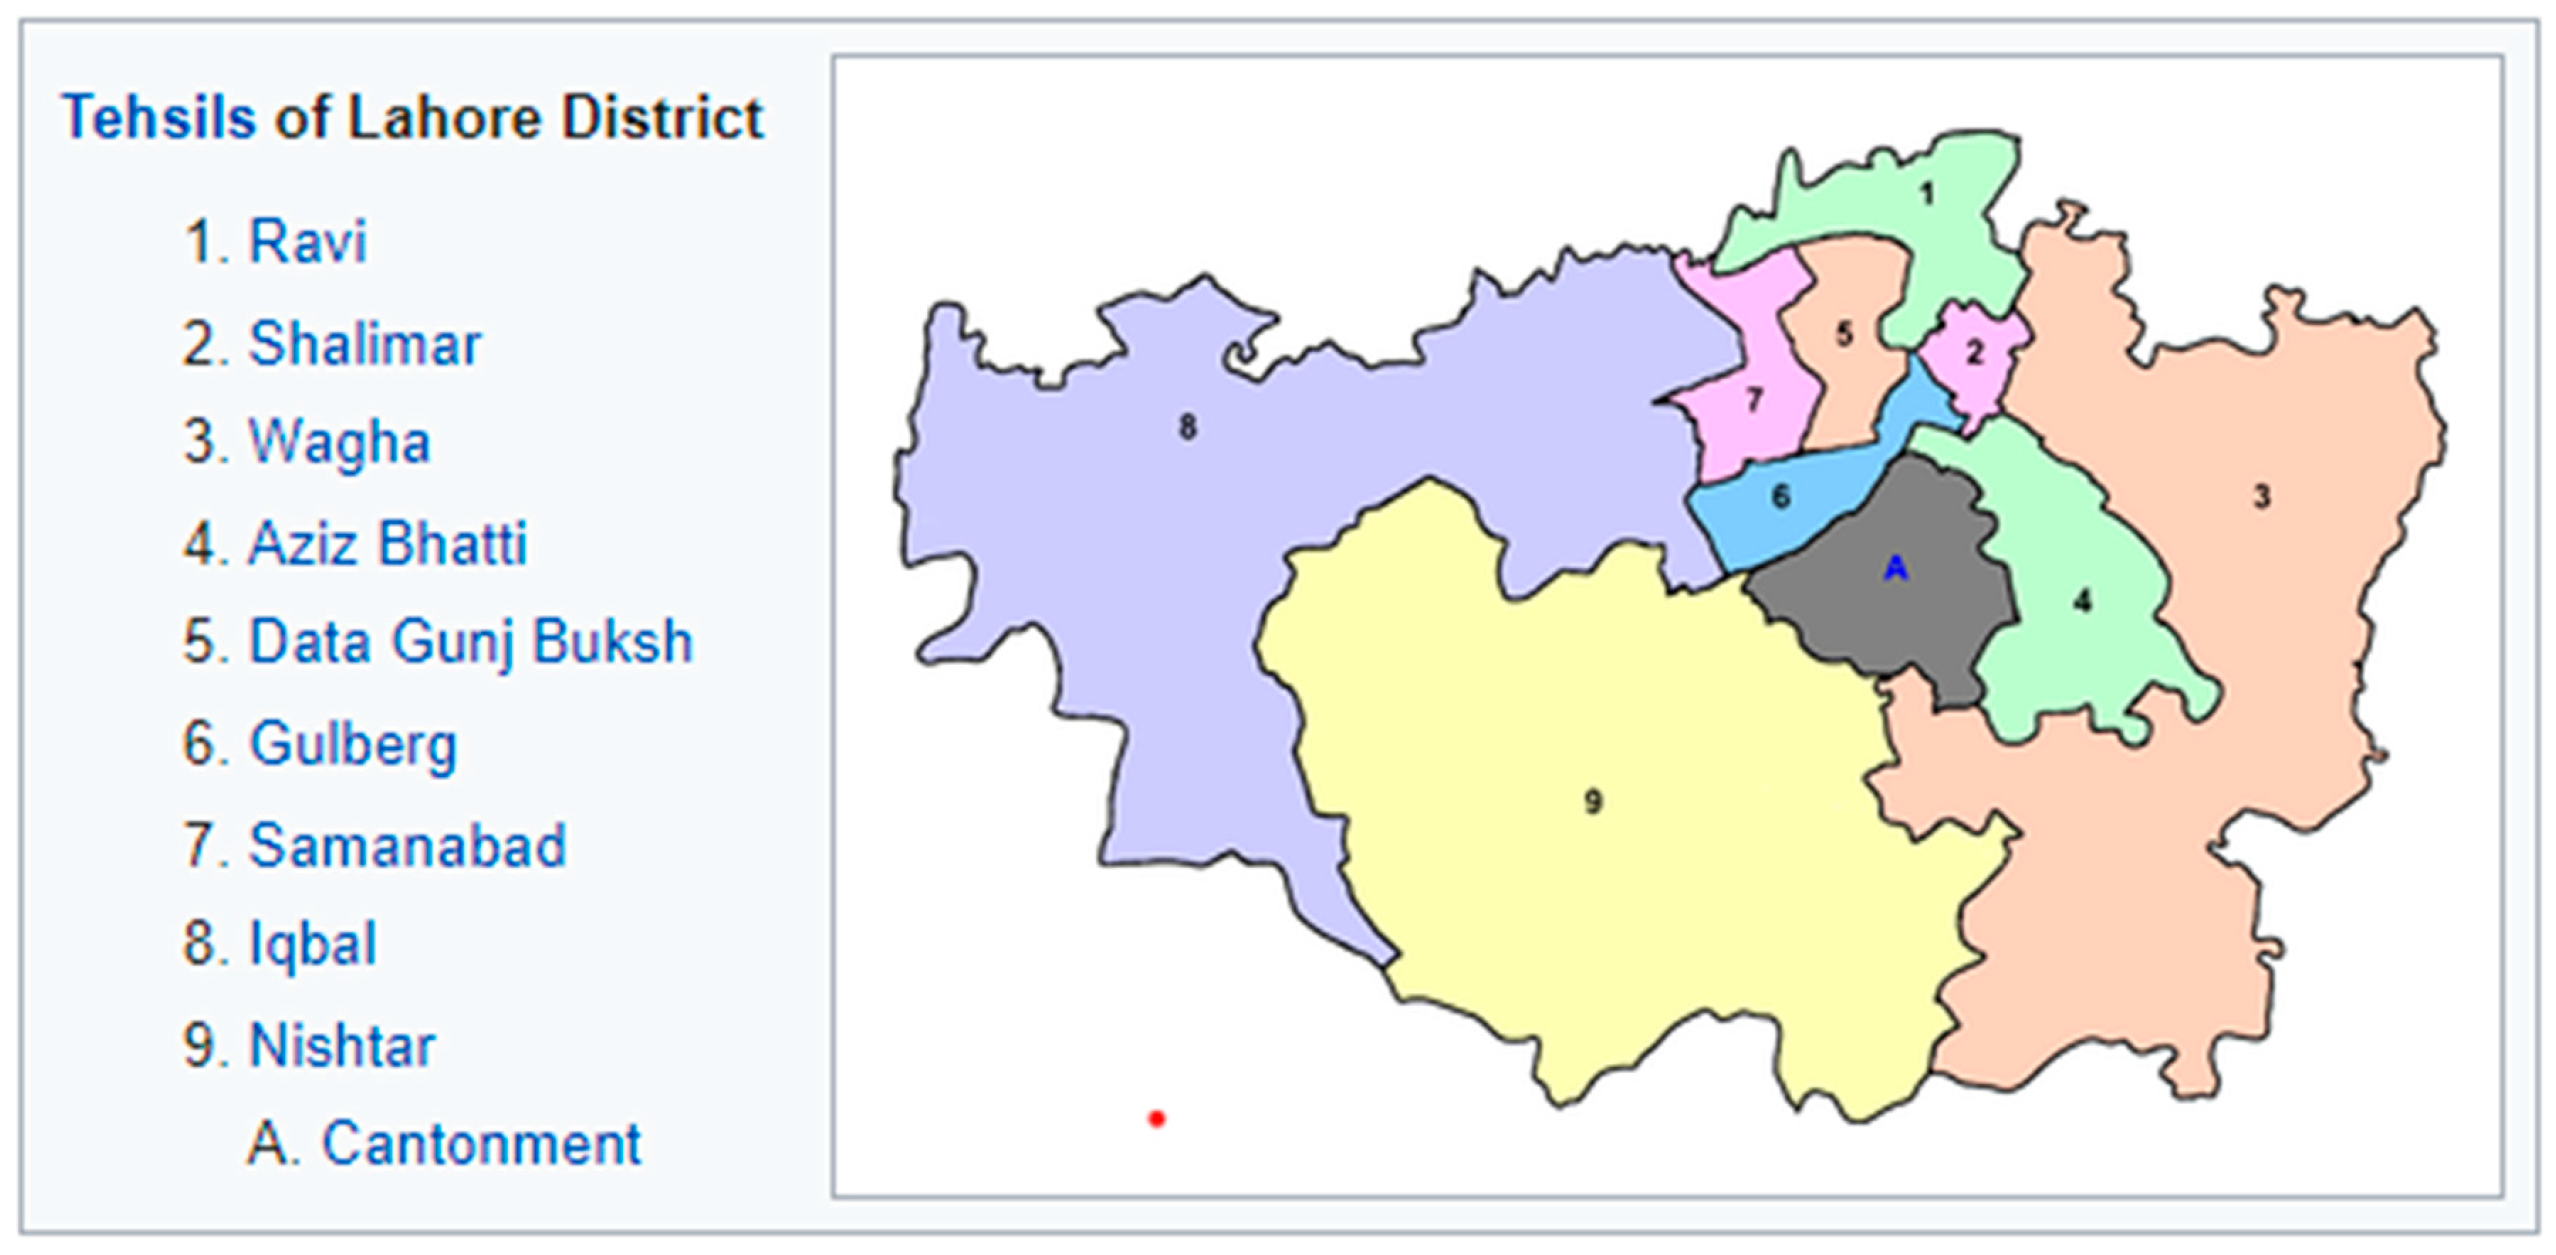
3. Study Area
The city of Lahore was chosen as the target site for this study. Lahore is the capital of Punjab province and one of the most populous cities in Pakistan, considered the second-largest city in Pakistan, comprising 12,642,000 inhabitants (
Figure 2) [
3].
In the city, 40 percent of the population is under the age of 15, with an average expected lifetime of no more than 60 years. Besides, the literacy rate is lower than 41% [
61]. The public of Lahore city is also suffering from problems associated with the quality of drinking water [
11]. To ensure the delivery of hygienic and pristine drinking water to residents of Lahore, the local government fixed several water purification plants at numerous locations around the city, including Shalamar Garden, Mishri Shah, Sabzazar, Lahore Zoo, Walled City, Gulshan-i-Iqbal, Shahdara, Aik Moria Pul, Pani Wala Tabla, Mughalpura, Data Darbar, Harbanspura, City Railway Station, at Blind School, outside Lohari Gate, Lorry Adda, and inside New Anarkali. These sites were selected based on the level of impurities, arsenic, residents’ income, and ease of accessibility for citizens [
62].
4. Methods and Materials
This study is cross-sectional, meaning that the study’s population comprises households residing in four different areas of Lahore. These four areas were chosen using a multistage random sampling technique, where two areas constitute local government water purification plants, while two areas lack these plants [
63]. The sites with local government purification plants were Shahdara and Harbanspura, and the sites missing these plants included the Nishatar colony and Zia Colony Township. These four sites were either semi-slums or slums. The income level of the households residing in these areas is low, with a high illiteracy rate. In addition, another purpose for selecting these areas was the level of arsenic, which is a life-threatening chemical. Contamination of drinking water with arsenic causes several chronic pulmonary and skin infections. According to WHO [
4], the safe arsenic level in drinking water is up to 50 ppb. The level of arsenic in Shahdara is 76.8 ppb; in Harbanspura, it is 74.0 ppb; in the Nishatar colony, it is 82.0 ppb; and in Zia Colony Township, it is 66.9 ppb [
16].
Potential respondents/households were carefully chosen through a simple random sampling technique. Seventy-five households were selected from every selected area. Hence, a total of 300 households were selected as a sample size. Primary data needed to be gathered to evaluate waterborne sickness’s influence and determine the association’s strength among variables. Data were collected from households in the studied localities using a structured questionnaire. The questionnaire covers all the pertinent information such as demographics (age, level of education, number of family members, average family income), drinking water sources, drinking water expenditures, waterborne associated incidences, and extent. A post-questionnaire development pilot study was conducted by administering 50 questionnaires with and without filtration plant areas to ensure that the questionnaire has valid measures for data collection. Furthermore, face-to-face interviews were conducted with the household head or another family member in their absence to learn their perspectives on the adulteration of drinking water, the underperformance of the water purification plant, the waterborne sickness they experienced, and the impact of this sickness on infants and children. Before starting the interview, the purpose of the study was explained to the participants, and informed consent was obtained for inclusion in the final manuscript. The identity information of the participants was removed from the shared data.
4.1. Statistical Model
The current study utilized the measurements developed by the previous studies. Therefore, class circumstances were sorted by three demographic items, comprising age of the family head, education level of the family head, and family size, to assess the impact of these demographics on the choice of drinking water by households. Life choices were measured by asking the respondents about tap or plant water use, and example items were included regarding why they make these choices. This study employed frequency distributions to describe demography and the variables involved in class circumstances. An independent group t-test was performed to measure the mean difference in the occurrence of diseases in both with and without local government filtration plant areas.
Moreover, the impact of various variables refers to class circumstances; namely, respondent’s area (with and without plants), income, expenditure on drinking water, use of plant water, family size, education, and age of household head are regressed on waterborne diseases referring to life chances using logistic regression. The waterborne disease was measured through a dichotomous variable, having only two values assigned: value 1 if the respondent suffered from waterborne disease; otherwise, value 0 was assigned. Similarly, a binary variable also measures respondents’ area and use of plant water. The functional form of the logistic regression curve is
where is Euler’s number and can be any linear combination of predictors such as
β0 +
β1x.
we want to end up with the “typical” formula of the logistic regression, something like:
where
L is the Logit, i.e.,
4.2. Deriving the Formula
In the first step, let us take our
and divide by the probability of the complementary event. If the probability of event A is
, the probability of not-A is 1 −
, Thus,
So, we replaced
by
and thereby computed the odds. Next, we multiply the equation by
(which is the neutral element, 1) yielding
In other words, the denominator of the numerator “wandered” down to the denominator. Now we can simplify the denominator:
Simplifying the denominator further
However, the denominator simplifies to 1, as can be seen here
The above equation tells us that the odds simplify to
. Now, let us take the logarithm of this expression.
By the rules of exponents algebra
in sum,
The left part of the previous equation is called the Logit, which is the “odd plus logarithm” of
, or rather, more precisely, the logarithm of the odd of
. The logistic regression formula can now be obtained by taking the Logit of any linear combination. We can use our standard regression terminology because of the Logit’s linearity: The Logit of dependent variable changes by
if
x is increased by one unit. Simply replace the Logit with the appropriate value; the rest of the statement is standard regression jargon. In the meantime, because the curve’s slope is not linear,
is not equal for all
x values. The logistic regression equation for the current model can be expressed as follows:
Solve this equation for
p,
Pain the formula for the probability
P(WBD = 1) =
pThus, adding criterion and predictor variables equations becomes,
| Variable | Measurement |
| W.B.D.: | Waterborne disease is a controlled dummy variable in the model, which can post two values of 0 or 1. If a person suffered from waterborne disease in the last three months, this value represents 1, but 0 if a person did not suffer from waterborne disease. |
| A.H.H.: | The age of the household head is measured in a complete number of years by asking the respondent what the household head’s age is. |
| E.H.H.: | The education of the household head is also measured in a complete number of years by asking the respondent what the education of the household head is. |
| F.S.: | Family size was another quantitative variable that varies from 1 to 18 family members. |
| U.P.W.: | The use of plant water as a predictor variable is binary (yes or no), which can posture two values, either 0 or 1. Households using plant water are assigned value 1, and otherwise assigned value 0. |
| E.D.W.: | Expenditure on drinking water represents the treatment costs beard by households due to suffering from waterborne diseases in the last three months. |
| R.A.: | The respondent’s area is another binary variable that postures two values, either 0 or 1. Value 1 is assigned if the house is located in the plant area; otherwise, 0 value is assigned. |
| µ: | Random error, in the model, is a residual variable that accounts for the lack of perfect goodness of fit. |
5. Results and Discussion
Human survival depends on the availability of water. Meanwhile, water resources in Pakistan are constantly degrading because of the mixing of various chemicals and trash. The public’s health is jeopardized when this polluted water is consumed. This sickness is more likely to affect infants and children. Furthermore, due to these ailments, people must shoulder the cost of health treatment. The local government set up filtration facilities in various parts of Lahore so that the general population may profit from them. This research investigated the effects of waterborne diseases on newborns, children, and other households and their healthcare expenses. Furthermore, by comparing the probability of diseases in areas with drinking water filtration plants installed by their local government versus areas without this facility using a healthy lifestyle model, it was determined that people benefit from drinking water filtration plants whether their local government installs them or not.
5.1. Demography
There is evidence in the literature that demographic factors such as household income level, family size, and education level are major predictors of waterborne illnesses. Shah et al. [
36] demonstrated that demographic and socioeconomic attributes such as age, education, income, past experiences, and social networks played an important role in perceiving vulnerability. Moreover, households’ health vulnerabilities are affected by their access to information, health facilities, and the availability of safe water. Thus, respondents were first asked about demographics, referring to class circumstances in the health lifestyle research model.
To follow is some information concerning the demographic profile of the data respondents. The median age of household heads in the plant and control regions was 47.20 and 44.68 years old, respectively, whereas the overall mean age in both areas was 45.94 years old. The mean education of household heads in the plant area was 9.38, whereas the mean education in the control area was 10.8, and the overall mean education in both regions was 10.09. In both the plant and control zones, respondents’ family sizes ranged from one person to eighteen per home. The average family size in the plant area is 6.49, whereas it is 6.52 in the control area. Furthermore, in the plant area, the mean household income from all sources was 29,387.33 rupees, while in the control region, it was 26,608.67 rupees. The average income in both locations was 27,998.00 rupees. The mean demographics in both the plant and control areas are shown in
Table 1.
People were polled on their drinking habits, whether from a plant or the tap, to learn more about the link between drinking water and healthy lifestyle choices, disease incidence, and life chances in both areas with and without local government filtration facilities. The local government set up filtration plants to ensure that the public can access safe drinking water. However, the water from these plants might not be completely safe to drink. Some homes in the plant area claimed that they do not drink plant water because it is contaminated and detrimental to their health or could not detect a difference between plant and tap water during this study. Other respondents stated that transporting plant water for large families is challenging; thus, they rely on tap water. Plant water was recorded in 67 (44.7%) of the area’s houses with plants, and tap water was found in 67 (44.7%) households with plants. Meanwhile, 16 (10.7 percent) households in plant areas said they could obtain drinking water from a plant or a tap. A total of 19 (12.6 percent) households in areas without filtration plant facilities said they had to travel a long distance to drink plant water.
The use of drinking water is also determined by family size, which is a social class factor. Because more water is needed if the family grows larger, bringing plant water for a large family becomes a little more difficult. Small families are more likely to use plant water in both plants and control areas, followed by medium-sized families, whereas large families are less likely to use plant water. Small families have 1 to 4 members, medium families have 5 to 8 members, and large families have 9 to 18 members.
There are 9 (6.0 percent) small households in the plant area and 1 (0.7 percent) small family in the control area that uses plant water. As a result, a total of 10 (3.3 percent) tiny families were discovered as employing plant water to make life decisions. As a result, as the size of the family grows, the amount of water used by plants decreases.
Table 2 shows the results in both the plant and control areas in this regard. Another element of class condition in the health lifestyle model, the household head’s education, was discovered to be substantially linked with drinking water consumption. Educated household heads appeared to be more aware of water contamination and the harmful health effects of dirty water. Therefore, literate households opted to use plant water compared with illiterate families.
In the study region, 205 families were literate, whereas 95 were illiterate; 64 (42.7%) literate households used plant water in the plant area, while 20 (13.3%) literate households used plant water in the control area, for a total of 84 literate households (28.0 percent). Even though both locations had a total of 205 literate households, plant water was used by 41.0 percent of literate homes in both plant and control regions. Thus, a total of 19 families (6.3 percent) in both districts were using plant water. The number of houses consuming tap water in the plant and control areas was 31 (20.7%) and 45 (30.0%), respectively, for a total of 95 households. When the total number of illiterate homes was 95, 19 out of 95, or 20% of illiterate households, used plant water. According to the findings, plant water use is higher in literate families than illiterate families. In this regard,
Table 2 presents the contrast between plant and control areas.
5.2. Waterborne Diseases in the Study Area
Water is a necessary component of life on earth, and contaminated water causes a variety of ailments. Throughout the investigation, 24.22 percent of the households, or 462 out of 1907, said they were suffering from waterborne infections, significantly impacting their lives. Although filtration of plant water does not guarantee absolute purity or disease-free safety, it has been demonstrated that people who drink plant water have a lower risk of contracting waterborne infections than those who drink tap water. In the study area, diarrhea was the most common waterborne disease after hepatitis, tuberculosis, skin infection, kidney infection, lung infection, typhoid, abdominal pain, vomiting, and stomach infection.
The mean differences in health in study areas with and without local government filtration plants were assessed using independent group t-tests. According to this survey, waterborne infections were prevalent in locations without filtration facilities. Plant water is a major source of drinking water in plant areas, and most people choose to drink it. Waterborne infections are less common in these locations because they demonstrate the disposition of acts due to class circumstances and bring treated water for drinking. In terms of waterborne infections in newborns, children, females, and males,
Table 3 compares plant and control areas.
According to the findings, there is a mean difference in waterborne infections in newborns, children, females, and males. In the plant area, the mean occurrence of waterborne infections in infants and children is 2.0533, while in the control area, it is 4.4533. As a result, the mean difference in both areas is −2.4. Furthermore, in the case of the occurrence of waterborne infections in infants and children, the t-value and significance value were −5.322 and 0.000, respectively. Because the t-value was −5.322 and the sig value was 0.000, which is less than 0.05, it is clear that the disposition of the act resulted in a significant difference in the mean occurrence of waterborne infections in infants and children in plant and control regions. Because they do not engage in such behaviors, waterborne infections among infants and children are higher in control areas than in plant areas. In the case of waterborne disease in females, the mean value of the plant area, the mean value of the control area, and the value of the mean difference in both areas were 16.533, 3.1267, and −1.473, respectively. Furthermore, the t-value was −2.823, with a significance value of less than 0.005 and less than 0.05. Therefore, the findings indicated a considerable difference in the mean occurrence of waterborne infections in females in plant and control areas. As a result, females are more likely to contract the waterborne disease than in the plant area in the control area.
Similarly, the mean value of the plant area, the mean value of the control area, and the value of the mean difference in both areas were 18.867, 3.4867, and −1.6000, respectively, in the event of the occurrence of waterborne disease in males. The t-value was also −7.927, and the significance value was less than 0.000 or less than 0.05. As a result, it demonstrates a considerable difference in the mean occurrence of waterborne infections in men in the plant and control areas. As a result, females are more likely to contract waterborne diseases than in the plant area in the control area. In short, the mean occurrence of waterborne infections differs significantly across infants, children, females, and males. In the control region, the incidence of waterborne diseases or bad life chances in newborns, children, females, and males was higher than in the plant area due to a lack of life options from drinking plant water.
5.3. Econometric Model for Waterborne Illness
Waterborne diseases are considered dependent variables measured by dummy values 0 or 1. If a person is suffering from waterborne diseases, then the value of dummy variables is 1; otherwise, value 0 was assigned. Furthermore, family size is a quantitative variable that ranges from 1 to 18. It is theorized that the household head’s age and education reduce the occurrence or probability of waterborne sickness in that family. Waterborne infections are less likely to arise when households spend more on drinking water.
In the same way, increasing plant water use reduces the risk of waterborne sickness in that home. The results of the binary logistic model summary are revealed in
Table 4. Logistic estimates of household head education (E.H.), use of plant water (U.P.W.), drinking water expenditures (E.D.W.), and respondent area (R.A.) were negatively correlated with the probability of waterborne diseases, whereas respondent family size (F.S.) was positively correlated with the probability of waterborne diseases. However, the current study’s household head (A.H.) age was insignificant in reducing waterborne illness. Moreover, the robustness regression was also analyzed to verify the results of logistic estimates, as shown in
Table 4 [
64]. Robust regression is a form of regression analysis designed to overcome some limitations of traditional parametric and non-parametric methods. The current findings of robust regression are almost similar to the output of the binary logistic, indicating that the current model outputs are valid.
Moreover, in the current model, the value of Cox and Snell R square was 0.278, representing that a 28 percent change in the explained variable is due to the study’s independent variables, while its value range was always between 0 and 0.75. On the other hand, the value of Nagelkerke R Square was 0.376, which indicates that 38 percent of the variation in the dependent variable is due to the independent variables, while its value always ranged between 0 and 1. The value of −2 Log-likelihood was detected at 306.831 at df = 8, significant at a 5 percent significance level. The Lemeshow test value for this model was 0.221, which is greater than 0.05, indicating that the model is statistically significant. The intercept term was 0.645, indicating the average prevalence of waterborne infections (life chances).
The current findings showed that education of the household head, expenditures on drinking water, use of plant water, and respondent’s area all have a negative effect on the occurrence of water bone diseases, with odd ratios (Exp-) less than 1, and these results are statistically significant at the 5% level of significance. Meanwhile, family size has an odd ratio (Exp-β) greater than 1, indicating that an increase in family size will increase the probability of waterborne illness for that household, and this result is significant at the 1 percent significance level. However, age is ineffective in reducing the probability of waterborne diseases because this variable is statistically insignificant, as its
p-value was 0.699, greater than the significance level. An increase in the education of household heads creates more awareness regarding waterborne illnesses and, as a result, households with a higher level of education will have a lower probability or chance of occurrence of waterborne diseases. Similarly, increased use of plant water refers to making life choices using plant water; the occurrence of waterborne illnesses leads to positive life chances. A rise in the cost of drinking water (as defined in our research model) indicates that more plant water is being used to bring water from plants. People must travel a certain distance and pay a certain amount of money. As a result, increasing plant water use lowers the risk of contracting waterborne infections. As a result, in the respondent’s location, people in the plant area prefer to drink plant water, lowering the risk of waterborne sickness in those families. In the same regard, Shah et al. [
36] demonstrated that demographic and socioeconomic attributes such as age, education, income, past experiences, and social networks played an important role in perceiving vulnerability to such waterborne illnesses. Similarly, Khalid and Khaver [
55] concluded that polluted water poses a greater threat to human life.
Furthermore, access to information, health facilities, and clean water influences households’ health vulnerability. Waterborne sickness is reduced through increased education, household per capita expenditures on safe drinking water, and access to safe drinking water. They also demonstrated that families without access to a water supply spend significant time obtaining water, resulting in additional costs for the poor household. Because of the high cost of disinfection methods for treating drinking water, low-income families were extremely unlikely to use them, preventing poor households from reaping the benefits of clean water. The results revealed that the value of all coefficients except the age of the household head is significant in regression at 1 and 5 percent levels of significance.
6. Theoretical and Practical Implications
This study has several theoretical and practical implications. As findings of this study exposed a negative association between clean drinking water sources and waterborne illness, it may positively influence people’s mindsets regarding drinking water quality and drinking water plants installed by government bodies. Moreover, this study revealed that the water from filtration plants installed by the local government is clean and safe for human consumption. Still, different private and government bodies, such as T.M.A., district councils, PHEDs, and WASA, provide services related to providing and supplying clean drinking water to the public. Still, water management by these bodies is not effective in urban areas. Coordination between the federal and provisional governments seemed lacking. Thus, this study will draw the government’s attention to the installation of more drinking plants for the benefit of society and will show the government of Pakistan that the availability of such plants is a good option for the sustainable management of drinking water in hard-hit and water-scarce areas of Pakistan.
Besides, class circumstances such as the size of the family and the education of the family head are enormously correlated to the quality and use of drinking water and ultimately to health-associated outcomes by improving healthy lifestyle. Thus, this study has the potential for realizing households to be more educated and have small family sizes to have improved lifestyles in terms of drinking water quality.
This assessment has provided a comprehensive layout of concerns with the quality of drinking water in Pakistan through an exceptional focus on key water impurities, water degradation sources, and subsequent health-associated concerns. Thus, this review contributed substantially to endorsing consciousness in realizing the hazards and threats of the factors causing water pollution and waterborne diseases. This comprehensive investigation will likewise advance the public’s ability to quantitatively comprehend the effects of drinking water effluence and the efficiency of prevailing inventiveness regarding clean drinking water for the public, undertaken by the local government by the fixation of filtration plants. However, this enumerated valuation will also be a helpful instrument for the government to intend better strategies for providing impurity-free drinking water to the community. As water hails from easily accessible and improved sources, households must spend less effort and time collecting it. Additionally, as local governments install filtration plants to make clean drinking water conveniently available to the public in various places, it will allow the public to avoid risky journeys for collecting clean drinking water.
Moreover, as the study’s findings exposed, people bear fewer health expenses due to having access to better drinking water sources because they are less likely to become victims of waterborne diseases. Thus, this study is useful for realizing the local government’s public importance of drinking water filtration plants. Additionally, this evaluation will significantly contribute to the literature regarding health-associated issues. Another value of this detailed study is that it will be considered a strong reference tool in impending studies. As a whole, it will assist in enhancing the progression of research focused on concerns associated with the quality of drinking water and clean drinking water sources.
7. Conclusions and Recommendations
The findings of this study revealed the conclusion that people who make life choices of drinking filtered plant water are less likely to contract waterborne diseases. Besides, class circumstances such as the family size, the family head’s education, and plant water usage are enormously correlated to the quality and use of drinking water and ultimately to the health-associated outcomes by improving healthy lifestyle. While the age of the household head was found to be insignificant in making choices regarding drinking water choices and reduction in waterborne illness, the education of the family head, the number of family members, and households were found to be more habitual in engaging in practices for using plant water. Thus, in areas with these filtration plants, infants, children, and other people are less likely to contract waterborne incidents. In short, it is concluded from the study’s results that the impacts of clean drinking water are significantly different from unclean drinking water. Clean drinking water from any source helps prevent waterborne illness and reduce waterborne associated costs, while unclean water is found unsafe for the health of residents.
Thus, it is recommended that awareness campaigns be launched by the public and private sector/civil society about the advantages of drinking water to enhance the ratio of plant water users in treatment areas. The local government must boost the number of these filtration plants to cover the large proportion of the population and maximize the benefits of impurity-free water for the public. To ensure water availability throughout the day, even during electricity load shedding in the country, generators should be fixed with these plants. Areas adjacent to the plants must be focused on cleanliness regularly to build a positive image of these plants near the public. Awareness campaigns must be launched to increase public awareness concerning drinking water contamination, hazardous and quality hits to take preventive measures to protect themselves from the perilous effects of bad quality water.
8. Limitations and Future Recommendations
This study has some limitations as well. This study lacks data about the mother’s age and education, which greatly influence life choices and life chances. Future studies can collect data regarding the mother’s age and education, which greatly influence life choices and life chances. Waterborne diseases are influenced by various factors, including poor hygiene practices and a family history of the disease, which are the focus of this study. These factors can also be manipulated in future studies.
Moreover, this study only measured the impacts on the income of households in terms of waterborne expenditures, while the impacts on income due to losing work productivity and working days were ignored. Thus, future studies could examine the loss of workers’ productivity and the consequent impacts on income due to waterborne illness. The generalizability of this study can be enhanced by focusing on other areas of Lahore having filtration plant facilities. This study was just meant to check the impact of filtration plants installed by the local government on disease elevation while not focusing on determining whether these filtration plants’ water quality meets the standards set by WHO or not. Further study can be conducted to determine the water quality of these filtration plants installed by the local government and other government authorities.
Additionally, this study is limited to filtration plants installed by local government and community development, whereas other authorities such as T.M.A., district councils, PHEDs, WASA, and private bodies have also installed filtration plants for the provision of clean drinking water to the public of Pakistan; therefore, further studies can be executed to check the impacts of filtration plants on water other than local government at the household level. Moreover, further studies can be conducted in other countries, especially those with or without water crises or safety issues, to enhance the generalizability of the findings. The local government installed filtration plants for the benefit of the public. As a result, the government had to bear some cost, which was not measured in this study; therefore, further studies can be conducted to perform a cost–benefit analysis of these filtration plants.
Author Contributions
Conceptualization, A.A.; Data curation, A.A.; Formal analysis, A.A., K.A. and M.A.u.H.; Funding acquisition, A.A. and I.T.H.; Methodology, M.A.u.H. and K.A; Project administration, K.A.; Resources, I.T.H. and M.R.R.; Software, K.A.; Supervision, K.A.; Validation, K.A.; Writing—original draft, A.A.; Writing—review & editing, M.A.u.H., I.T.H. and M.R.R. All authors have read and agreed to the published version of the manuscript.
Funding
This research was not funded by any source (individual, group, or organization).
Institutional Review Board Statement
The current study did not conduct any experiments on humans or animals in the lab; thus, no ethical committee approval is required for this research.
Informed Consent Statement
For this type of study, formal consent was not required. However, this study ensured that before starting the interview, the purpose of the study was explained, and informal consent was also obtained for voluntary participation in the final survey. The secrecy and anonymity of the given information and data were ensured.
Data Availability Statement
The data that support the findings of this study are available from the corresponding author upon reasonable request.
Conflicts of Interest
The authors declare no conflict of interest.
References
- N.G. (National Geography). Fresh Water Crisis. 2020. Available online: https://www.nationalgeographic.com/environment/freshwater/freshwater-crisis/ (accessed on 11 November 2020).
- Thompson, L.A.; Darwish, W.S. Environmental chemical contaminants in food: Review of a global problem. J. Toxicol. 2019, 2019, 2345283. [Google Scholar] [CrossRef] [PubMed] [Green Version]
- U.N. World Water Development Report 2020 Water and Climate Change. 2020. Available online: https://www.unwater.org/world-water-development-report-2020-water-and-climate-change/ (accessed on 18 March 2021).
- WHO. Drinking-Water. 2019. Available online: https://www.who.int/news-room/fact-sheets/detail/drinking-water (accessed on 18 March 2021).
- Farzin, M.; Asadi, A.; Pukanska, K.; Zelenakova, M. An Assessment on the Safety of Drinking Water Resources in Yasouj, Iran. Sustainability 2022, 14, 3619. [Google Scholar] [CrossRef]
- World Bank. A New World Bank Report Proposes Key Reforms to Improve Water Security and Productivity. 2019. Available online: https://www.worldbank.org/en/news/press-release/2019/02/04/pakistans-scarce-water-can-bring-more-value-to-people-and-economy (accessed on 6 December 2020).
- WHO. Unsafe Drinking-Water, Sanitation, and Waste Management. 2019. Available online: https://www.who.int/sustainable-development/cities/health-risks/water-sanitation/en/ (accessed on 14 December 2020).
- Daud, M.K.; Nafees, M.; Ali, S.; Rizwan, M.; Bajwa, R.A.; Shakoor, M.B.; Arshad, M.U.; Chatha, S.A.S.; Deeba, F.; Murad, W.; et al. Drinking water quality status and contamination in Pakistan. BioMed Res. Int. 2017, 2017, 7908183. [Google Scholar] [CrossRef] [PubMed]
- Badar, Z.U.; Xisheng, H.; Jabee, A. Blemishes of governmental Institutional Management to Trample Water Pollution in Pakistan. Int. J. Res. Soc. Sci. 2019, 9, 329–352. [Google Scholar]
- Ahmed, A.; Shafique, I. Perception of household in regards to water pollution: An empirical evidence from Pakistan. Environ. Sci. Pollut. Res. 2019, 26, 8543–8551. [Google Scholar] [CrossRef]
- PCRWR. Pakistan Council of Research in Water Resources. 2020. Available online: http://www.pcrwr.gov.pk/ (accessed on 15 October 2021).
- Kamran, H.W.; Omran, A. Water Contamination and Health Hazards in Pakistan: An Overview of the Current Scenario and Contemporary Challenges. In Sustaining Our Environment for Better Future; Springer: Singapore, 2019; pp. 75–84. [Google Scholar]
- World Bank. Opportunities for Clean and Green Pakistan. A Country Environmental Analysis. 2017. Available online: http://documents1.worldbank.org/curated/en/746031566833355389/pdf/Opportunities-for-a-Clean-and-Green-Pakistan-A-Country-Environmental-Analysis.pdf (accessed on 8 August 2021).
- Rehman, M.Z. Access to Safe Drinking Water Is Still a Dream. 2019. Available online: http.//www.awazcds.org.pk/Downloads/rstudies/Water%20Study%20Awaz.pdf (accessed on 3 January 2021).
- L.G& CD. Clean Drinking Water for All (CDWA) Project. 2020. Available online: https://lgcd.punjab.gov.pk/cdwa (accessed on 23 September 2021).
- PCRWR. Progress Report on Water Filtration Plants; PCRWR: Lahore, Pakistan, 2019. [Google Scholar]
- Cockerham, W.C. Health Lifestyle Theory and the Convergence of Agency and Structure. J. Health Soc. Behav. 2005, 46, 51–67. [Google Scholar] [CrossRef] [PubMed] [Green Version]
- Abdel-Shafy, H.I.; Mansour, M.S. Solid waste issue: Sources, composition, disposal, recycling, and valorization. Egypt. J. Pet. 2018, 27, 1275–1290. [Google Scholar] [CrossRef]
- Panhwar, A.; Kandhro, A.; Jalbani, N.; Faryal, K.; Mirjat, M.S.; Jhatial, G.H.; Qaiser, S. Assessment of Groundwater Quality Affected by Open Dumping Site in Hyderabad, Pakistan. Int. J. Environ. Chem. 2019, 5, 23–30. [Google Scholar]
- WHO. WHO—World Water Day Report-World Health Organization. 2019. Available online: https://www.who.int/water_sanitation_health/takingcharge.html (accessed on 18 August 2021).
- Islam, M.S.; Hassan-uz-Zaman, M.; Islam, M.S.; Clemens, J.D.; Ahmed, N. Waterborne pathogens: Review of outbreaks in developing nations. In Waterborne Pathogens; Butterworth-Heinemann: Oxford, UK, 2020; pp. 43–56. [Google Scholar]
- Adimalla, N. Spatial distribution, exposure, and potential health risk assessment from nitrate in drinking water from semi-arid region of South India. Hum. Ecol. Risk Assess. Int. J. 2020, 26, 310–334. [Google Scholar] [CrossRef]
- Alarcon-Herrera, M.T.; Martin, D.A.; Gutiérrez, M.; Reynoso-Cuevas, L.; Martín-Domínguez, A.; Olmos-Márquez, M.A.; Bundschuh, J. Co-occurrence, possible origin, and health-risk assessment of arsenic and fluoride in drinking water sources in Mexico: Geographical data visualization. Sci. Total Environ. 2020, 698, 134168. [Google Scholar] [CrossRef]
- Idrees, M.; Batool, S. Environmental risk assessment of chronic arsenic in drinking water and prevalence of type-2 diabetes mellitus in Pakistan. Environ. Technol. 2020, 41, 232–237. [Google Scholar] [CrossRef] [PubMed]
- Shahid, M.; Niazi, N.K.; Dumat, C.; Naidu, R.; Khalid, S.; Rahman, M.M.; Bibi, I. A meta-analysis of the distribution, sources, and health risks of arsenic-contaminated groundwater in Pakistan. Environ. Pollut. 2018, 242, 307–319. [Google Scholar] [CrossRef] [PubMed]
- Marembo, L.; Xu, W. A Graduated Approach in the Abolition of Waterborne Diseases in Drinking Water Using an Indicator Based Approach and Nano Based Biosensors: A Review. J. Environ. Earth Sci. 2020, 10, 64–71. [Google Scholar]
- Fazal-ur-Rehman, M. Polluted Water Borne Diseases: Symptoms, Causes, Treatment and Prevention. J. Med. Chem. Sci. 2019, 2, 85–91. [Google Scholar]
- Sinha, D.; Prasad, P. Health effects inflicted by chronic low-level arsenic contamination in groundwater: A global public health challenge. J. Appl. Toxicol. 2020, 40, 87–131. [Google Scholar] [CrossRef]
- Ahmed, J.; Wong, L.P.; Chua, Y.P.; Channa, N.; Mahar, R.B.; Yasmin, A.I.; VanDerslice, J.A.; Garn, J.V. Quantitative Microbial Risk Assessment of Drinking Water Quality to Predict the Risk of Waterborne Diseases in Primary-School Children. Int. J. Environ. Res. Public Health 2020, 17, 2774. [Google Scholar] [CrossRef] [Green Version]
- Fazel, H.K.; Abdo, S.M.; Althaqafi, A.; Eldosari, S.H.; Zhu, B.K.; Safaa, H.M. View of Saudi Arabia Strategy for Water Resources Management at Bishah, Aseer Southern Region Water Assessment. Sustainability 2022, 14, 4198. [Google Scholar] [CrossRef]
- Khan, J.R.; Bakar, K.S. Targeting at risk households in Bangladesh exposed to arsenic contamination: A spatial analysis. Int. J. Environ. Health Res. 2020, 30, 1–12. [Google Scholar] [CrossRef]
- Rahman, M.A.; Rahman, A.; Khan, M.Z.K.; Renzaho, A.M. Human health risks and socioeconomic perspectives of arsenic exposure in Bangladesh: A scoping review. Ecotoxicol. Environ. Saf. 2018, 150, 335–343. [Google Scholar] [CrossRef]
- Shah, M.T.; Suleman, M.; Abdul Baqi, S.; Sattar, A.; Khan, N. Determination of heavy metals in drinking water and their adverse effects on human health. A review. Pure Appl. Biol. (PAB) 2020, 9, 96–104. [Google Scholar] [CrossRef]
- Fan, M.; He, G. The Impact of Clean Water on Infant Mortality: Evidence from China; Agricultural and Applied Economics Association: Milwaukee, WI, USA, 2019. [Google Scholar]
- Daniel, D.; Diener, A.; Pande, S.; Jansen, S.; Marks, S.; Meierhofer, R.; Rietveld, L. Understanding the effect of socioeconomic characteristics and psychosocial factors on household water treatment practices in rural Nepal using Bayesian Belief Networks. Int. J. Hyg. Environ. Health 2019, 222, 847–855. [Google Scholar] [CrossRef] [PubMed]
- Shah, A.A.; Ye, J.; Shaw, R.; Ullah, R.; Ali, M. Factors affecting flood-induced household vulnerability and health risks in Pakistan: The case of Khyber Pakhtunkhwa (K.P.) Province. Int. J. Disaster Risk Reduct. 2020, 42, 101341. [Google Scholar] [CrossRef]
- Derdour, A.; Bouanani, A.; Kaid, N.; Mukdasai, K.; Algelany, A.M.; Ahmad, H.; Menni, Y.; Ameur, H. Groundwater Potentiality Assessment of Ain Sefra Region in Upper Wadi Namous Basin, Algeria Using Integrated Geospatial Approaches. Sustainability 2022, 14, 4450. [Google Scholar] [CrossRef]
- Amit, R.K.; Sasidharan, S. Measuring affordability of access to clean water: A coping cost approach. Resour. Conserv. Recycl. 2019, 141, 410–417. [Google Scholar] [CrossRef]
- Wasswa, H. Assessing the Factors Associated with Access to Safe Drinking Water among Rural Households in Uganda: A Case Study of Kalungi Sub-County, Nakasongola District. Ph.D. Thesis, Makerere University, Kampala, Uganda, 2019. [Google Scholar]
- Adhikary, M.; Pal, C. Incidence of waterborne disease: A case study of child Diarrhea in Kolkata. Indian J. Econ. Dev. 2019, 7, 1–12. [Google Scholar]
- Thakur, B.K.; Gupta, V. Valuing health damages due to groundwater arsenic contamination in Bihar, India. Econ. Hum. Biol. 2019, 35, 123–132. [Google Scholar] [CrossRef] [PubMed]
- Martínez-Santos, P. Does 91% of the world′s population ‘‘n really have’’ sustainable access to safe’’ drinking water’’? Int. J. Water Resour. Dev. 2017, 33, 514–533. [Google Scholar] [CrossRef]
- Deflorio-Barker, S.; Wing, C.; Jones, R.M.; Dorevitch, S. Estimate of incidence and cost of recreational waterborne illness on United States surface waters. Environ. Health 2018, 17, 3. [Google Scholar] [CrossRef] [Green Version]
- Anthonj, C.; Setty, K.E.; Ezbakhe, F.; Manga, M.; Hoeser, C. A systematic review of water, sanitation and hygiene among Roma communities in Europe: Situation analysis, cultural context, and obstacles to improvement. Int. J. Hyg. Environ. Health 2020, 226, 113506. [Google Scholar] [CrossRef]
- Wee, S.Y.; Aris, A.Z. Occurrence and public-perceived risk of endocrine disrupting compounds in drinking water. Clean Water 2019, 2, 4. [Google Scholar] [CrossRef] [Green Version]
- Rogers, B.C.; Dunn, G.; Hammer, K.; Novalia, W.; de Haan, F.I.J.; Brown, L.; Brown, R.R.; Lloyd, S.; Uricha, C.; Wong, T.H.F.; et al. Water Sensitive Cities Index: A diagnostic tool to assess water sensitivity and guide management actions. Water Res. 2020, 186, 116411. [Google Scholar] [CrossRef] [PubMed]
- Balazs, C.L.; Ray, I. The drinking water disparities framework: On the origins and persistence of inequities in exposure. Am. J. Public Health 2014, 104, 603–611. [Google Scholar] [CrossRef] [PubMed]
- Keiser, D.A.; Shapiro, J.S. Consequences of the Clean Water Act and the demand for water quality. Q. J. Econ. 2019, 134, 349–396. [Google Scholar] [CrossRef]
- Bartram, J.; BIallance, R. (Eds.) Water Quality Monitoring: A Practical Guide to the Design and Implementation of Freshwater Quality Studies and Monitoring Programmes; C.R.C. Press: Boca Raton, FL, USA, 2020. [Google Scholar]
- Gwenzi, W.; Chaukura, N.; Noubactep, C.; Mukome, F.N. Biochar-based water treatment systems as a potential low-cost and sustainable technology for clean water provision. J. Environ. Manag. 2017, 197, 732–749. [Google Scholar] [CrossRef] [PubMed]
- Dupas, P.; Nhlema, B.; Wagner, Z.; Wolf, A.; Wroe, E. Expanding Access to Clean Water for the Rural Poor: Experimental Evidence from Malawi; National Bureau of Economic Research: Cambridge, MA, USA, 2020. [Google Scholar]
- Emenike, C.P.; Tenebe, I.T.; Omole, D.O.; Ngene, B.U.; Oniemayin, B.I.; Maxwell, O.; Onoka, B.I. Accessing safe drinking water in sub-Saharan Africa: Issues and challenges in South-West Nigeria. Sustain. Cities Soc. 2017, 30, 263–272. [Google Scholar] [CrossRef]
- Hisam, A.; Rahman, M.U.; Kadir, E.; Tariq, N.A.; and Masood, S. Microbiological Contamination in Water Filtration Plants in Islamabad. J. Coll. Physicians Surg. Pak. 2012, 24, 345–350. [Google Scholar]
- USAID. Literature Review Drinking Water, Sanitation and Hygiene Knowledge, Attitudes, and Practices Khyber Pakhtunkhwa Province, Peshawar City, Pakistan. 2010. Available online: http.//pdf.usaid.gov/pdf_docs/pnadz936.pdf (accessed on 12 December 2020).
- Khalid, I.S.; Khaver, A.A. Political Economy of Water Pollution in Pakistan: An Overview. 2019. Available online: https://think-asia.org/handle/11540/10395 (accessed on 21 January 2022).
- Gochman, D.S. Provider determinants of health behavior. In Handbook of Health Behavior Research II; Springer: Boston, MA, USA, 1997; pp. 397–417. [Google Scholar]
- Clarke, E.B.; Curtis, J.R.; Luce, J.M.; Levy, M.; Danis, M.; Nelson, J.; Solomon, M.Z.; Robert Wood Johnson Foundation Critical Care End-Of-Life Peer Workgroup Members. Quality indicators for end-of-life care in the intensive care unit. Crit. Care Med. 2003, 31, 2255–2262. [Google Scholar] [CrossRef]
- Giddens, A.; Duneier, M.; Appelbaum, R.P.; Carr, D.S. Introduction to Sociology; Norton: New York, NY, USA, 1991. [Google Scholar]
- Bourdieu, P. The economics of linguistic exchanges. Soc. Sci. Inf. 1977, 16, 645–668. [Google Scholar] [CrossRef]
- Ralf, D. A Third Europe? European University Institute: Fiesole, Italy, 1979. [Google Scholar]
- W.P.R. World Population Review Report. 2020. Available online: https://worldpopulationreview.com/world-cities/lahore-population/ (accessed on 24 February 2022).
- Government of Pakistan. Progress Report of Water Filtration Plants; Government of Pakistan: Lahore, Pakistan, 2019. [Google Scholar]
- Abrar ul haq, M.; Jali, M.R.M.; Islam, G.M.N. Household empowerment as the key to eradicate poverty incidence. Asian Soc. Work Policy Rev. 2019, 13, 4–24. [Google Scholar] [CrossRef] [Green Version]
- Abrar ul Haq, M.; Sankar, J.P.; Akram, F.; Siddique, M. The role of farmers’ attitude towards their resources to alleviate rural household poverty. Qual. Quant. 2022, 56, 2133–2155. [Google Scholar] [CrossRef]
| Publisher’s Note: MDPI stays neutral with regard to jurisdictional claims in published maps and institutional affiliations. |
© 2022 by the authors. Licensee MDPI, Basel, Switzerland. This article is an open access article distributed under the terms and conditions of the Creative Commons Attribution (CC BY) license (https://creativecommons.org/licenses/by/4.0/).


 ,
, 


