Article

Overseas Warehouse Deployment for Cross-Border E-Commerce in the Context of the Belt and Road Initiative

by
Chanjuan Liu
1,*,
Jinran Wu
2 and
Harshanie Lakshika Jayetileke
3
1
School of Business Administration and Customs Affairs, Shanghai Customs College, Shanghai 201204, China
2
School of Mathematical Sciences, Faculty of Science, Queensland University of Technology, Brisbane, QLD 4001, Australia
3
Department of Mathematics, Faculty of Science, University of Ruhuna, Matara 81000, Sri Lanka
*
Author to whom correspondence should be addressed.
Sustainability 2022, 14(15), 9642; https://doi.org/10.3390/su14159642
Submission received: 8 June 2022 / Revised: 28 July 2022 / Accepted: 2 August 2022 / Published: 5 August 2022
(This article belongs to the Collection Sustainable E-commerce)

Abstract

:
The development of cross-border e-commerce is generally faced with problems such as high freight, long transportation time, and low service level. However, overseas warehouses can effectively solve the above problems to a certain extent, and they can improve consumer satisfaction. Therefore, this paper proposed a method combined with the entropy technique for order of preference by similarity to ideal solution (E-TOPSIS) model and complex network analysis theory to make a comprehensive determination of overseas warehouse locations for China’s e-commerce exports in the context of the Belt and Road Initiative (B&R). We selected 62 countries along the B&R as pre-candidates for overseas warehouse locations and then evaluated the significance of each node in cross-border e-commerce for Chinese export products. Finally, 15 countries were identified as the optimal overseas warehouse locations for Chinese export products along the B&R. The results can provide reference for overseas warehouse deployment of Chinese cross-border e-commerce enterprises as well as the development and the construction of the B&R.

1. Introduction

The aim of this study is to investigate the determination factors of overseas warehouses for cross-border e-commerce and to find optimal overseas warehouse locations for Chinese export products along the Belt and Road (B&R). More specifically, we attempt to combine the entropy technique for order of preference by similarity to ideal solution (E-TOPSIS) model and complex network analysis theory to make a comprehensive determination of overseas warehouse locations not just considering the logistics transportation costs. In doing so, we attempt to solve problems of cross-border e-commerce, such as high transportation time and cost, therefore, promoting the development of China’s cross-border e-commerce exports and the construction of the B&R.
According to the statistics, Chinese enterprises made direct investments in 49 countries along the BRI in 2015, with the investment increasing by 18.2% over the same period in 2014 [1]. China’s increasing investment and cooperation with countries along the line have sufficiently promoted international trade, specifically the development of cross-border e-commerce and therefore cross-border logistics demand. Nevertheless, few studies have focused on cross-border logistics, especially relating to overseas warehouses.
The success of a cross-border e-commerce enterprise strongly correlates with its logistical performance and distribution systems [2]. The traditional cross-border e-commerce logistics models mainly refer to international postal parcels, international express delivery, and cross-border third-party logistics, which spend much time on transportation and have a high cost [3]. However, the rapid development of cross-border e-commerce in recent years has placed higher demands on cross-border logistics, and cross-border e-commerce enterprises in China lack professional logistics operations. Recently, some cross-border e-commerce platforms and export enterprises explored and configured overseas logistics distribution systems through an “overseas warehouse” to reduce the obstacles of geographical space and timeliness.
The basic principle of overseas warehouse operations is to establish warehouses in other countries or regions other than the seller’s own country [4]. Figure 1 presents the logistics operation process of overseas warehouses in cross-border e-commerce. In the domestic segment, the merchant transports the goods to the domestic ports through domestic transit warehouses and then transports them to foreign ports by land, sea, or air. In the foreign segment, the merchant stores goods in overseas warehouses in advance. After receiving the customer’s order, the overseas warehouse finishes the local distribution as quickly as possible. Due to the significant role of overseas warehouses in promoting the development of cross-border e-commerce and foreign trade, the Chinese government pointed out that a number of overseas warehouses for export products should be built to expand cross-border e-commerce and to support the development of Chinese export enterprises [5].
Against this background, in the present study we attempt to investigate the optimal overseas warehouse locations for Chinese export products. Although the existing literature on logistics warehouse locations is vast, to our knowledge, this is one of the first systematic attempts to investigate overseas warehouses deployment for cross-border e-commerce for Chinese export products, notwithstanding its significance in the global economy and global supply chain. In doing so, this paper offers two main contributions to the existing literature. First, in this study, a method combined with the E-TOPSIS model and complex network centrality is proposed, which is an extension of the existing E-TOPSIS model. Second, the study of overseas warehouse location deployment for Chinese export products can provide a reference for export e-commerce sellers who have overseas warehouse demand.
The remainder of the paper is organized as follows: Section 2 reviews the related literatures about cross-border logistics, overseas warehouses, and logistics warehouse location deployment. Section 3 focuses on the theoretical framework and the methodology employed in this research. Section 4 explored the influence factors of overseas warehouse deployment. Section 5 makes an empirical study of overseas warehouse deployment for China’s export products. Section 6 presents the final remarks and conclusions. Section 7 indicates the limitations and future research.

2. Related Studies

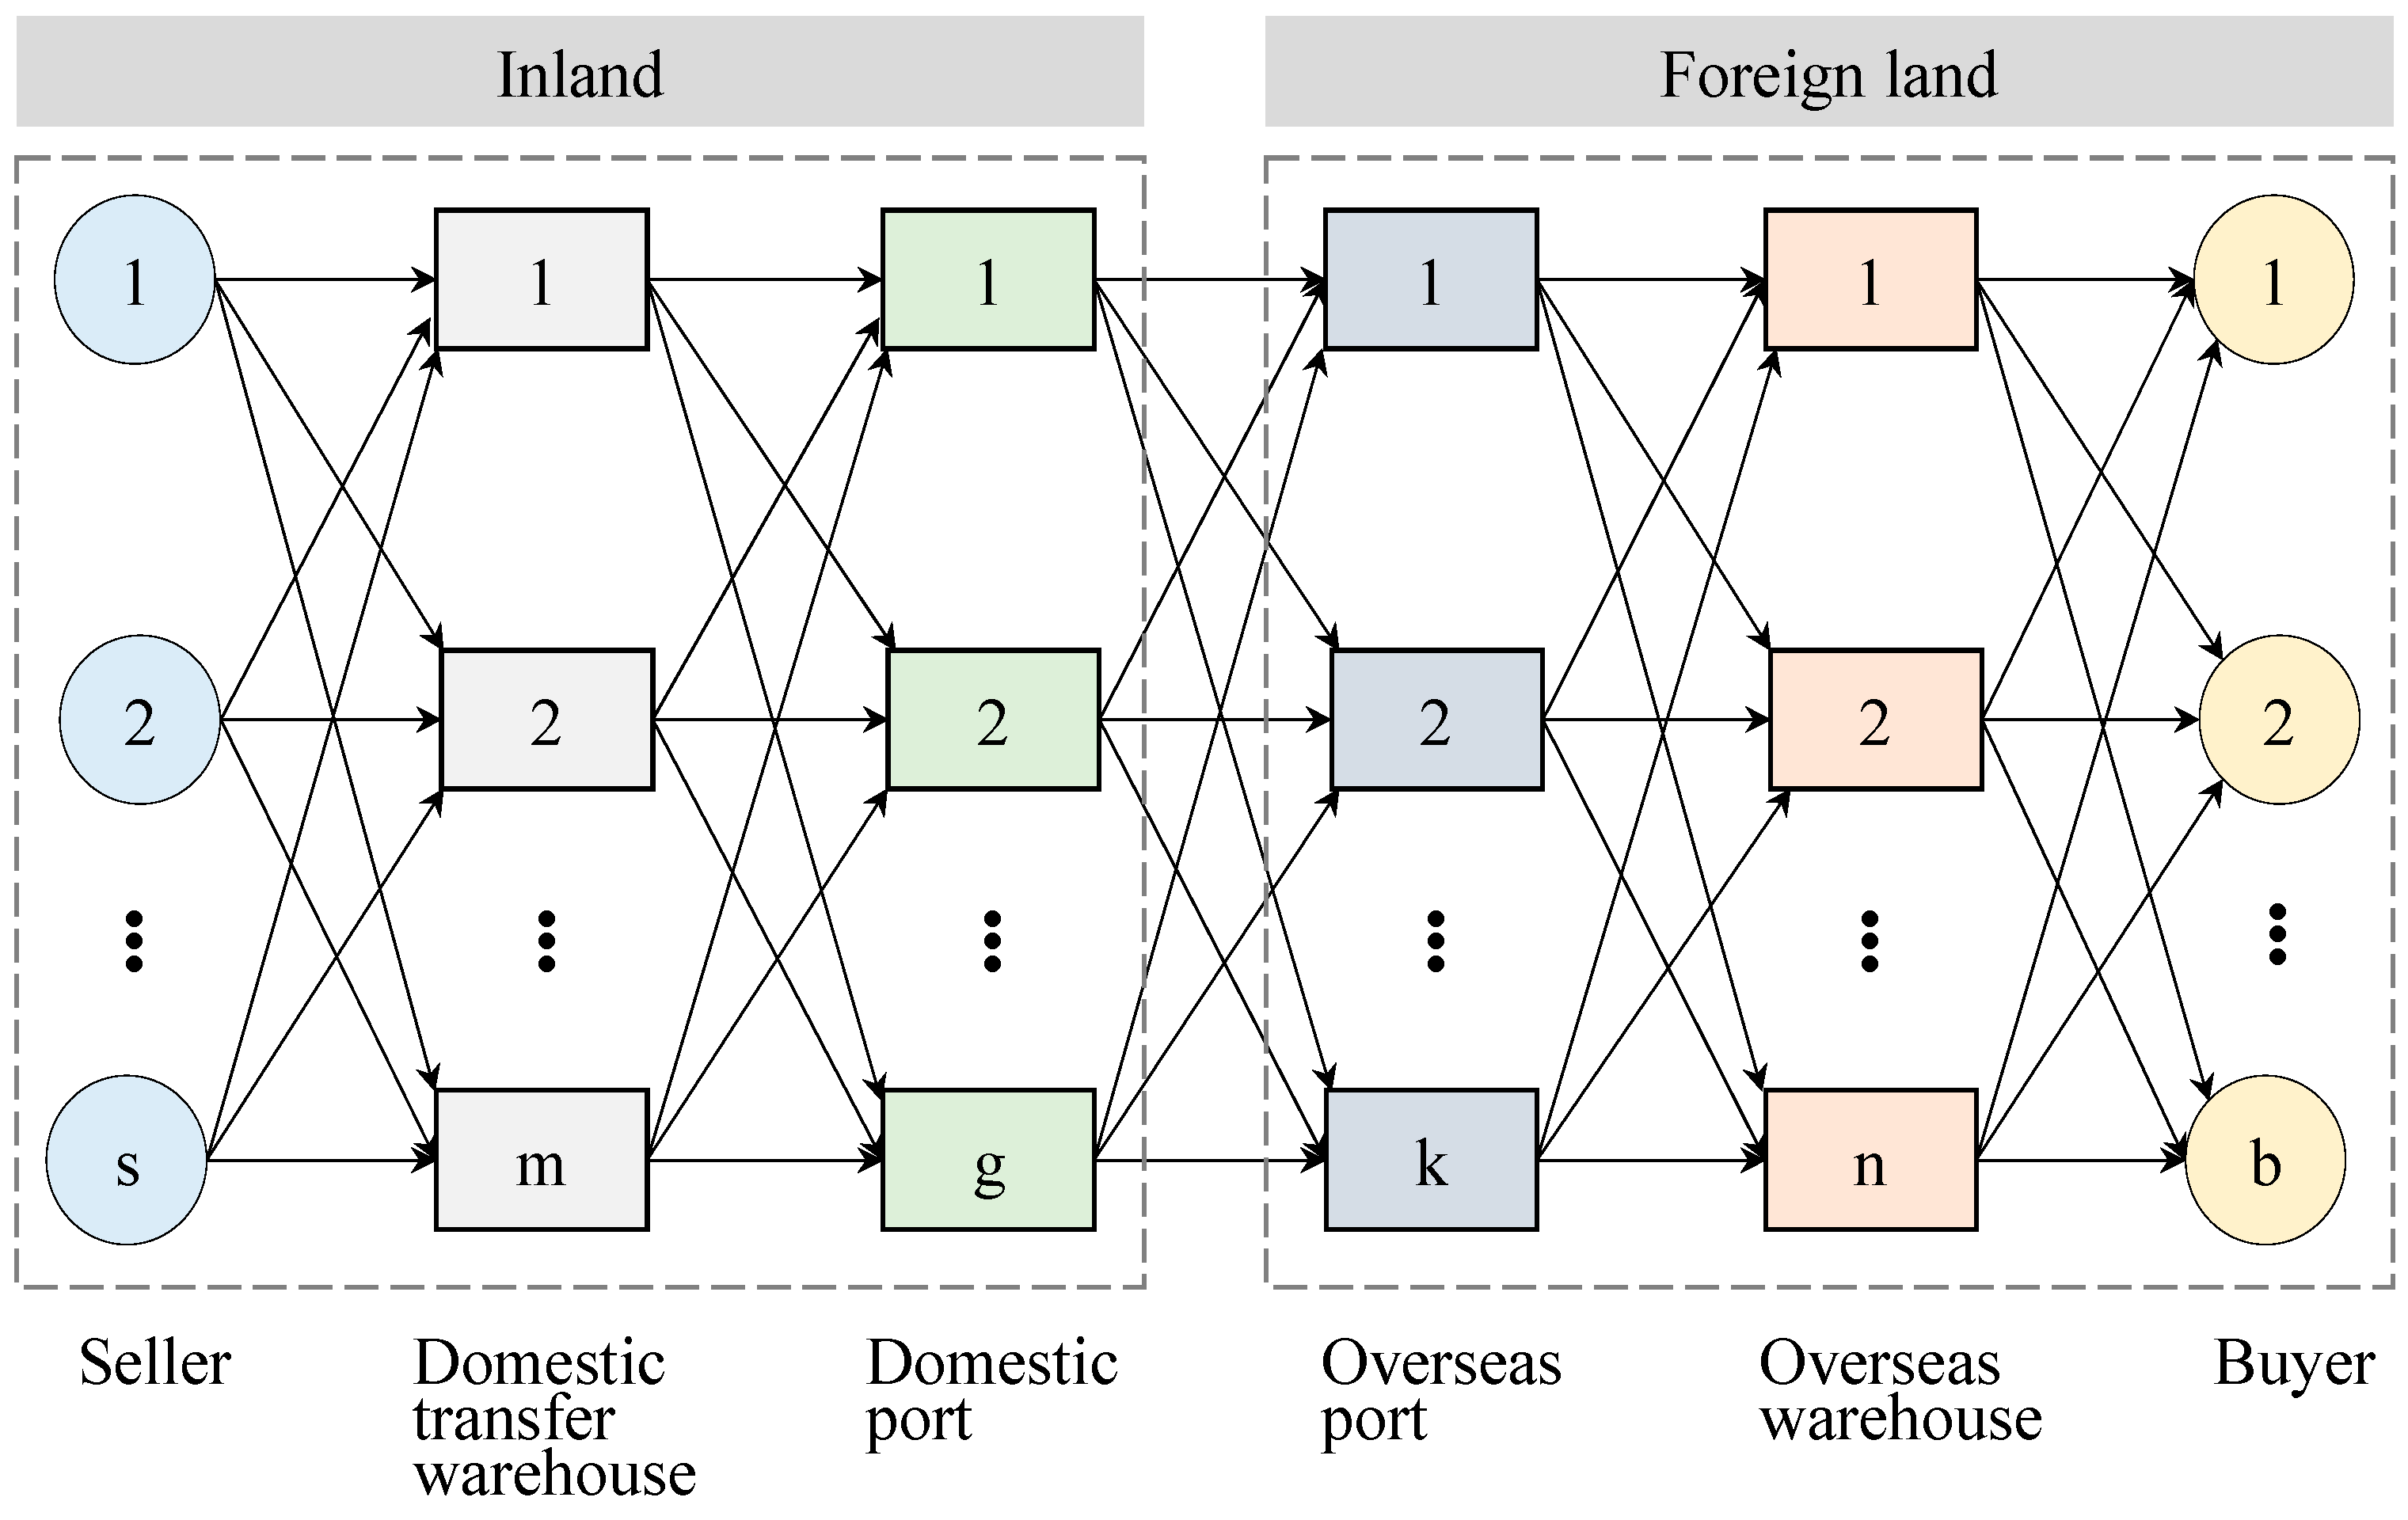
2.1. Cross-Border E-Commerce and Cross-Border Logistics

With the development of cross-border e-commerce, cross-border e-commerce logistics as a new area is drawing scholars’ attention as well. However, there is still relatively little academic research on cross-border e-commerce. The existing literature mainly focus on the operation modes of cross-border e-commerce [4,6,7,8]. As an important part in the realization of cross-border e-commerce trade, cross-border logistics seems to be slightly neglected, though there are a few studies on cross-border logistics services and networks [9,10,11]. Specifically, Giuffrida et al. [12] reviewed scientific publications in the field of logistics underlying cross-border e-commerce to China, and they found that within these contributions, studies investigating the relation between logistics and e-commerce, commonly acknowledged as critical, seem to be lacking. Sinkovics et al. [13] studied cultural adaptation in cross border e-commerce, taking German companies as an example. It is suggested that to engage better with their customer and reach better cultural congruency companies need to work harder on developing culturally adapted websites. Kawa [14] pointed out that the delivery of products remains a barrier to free cross-border flow, despite the dynamic development of e-commerce, and this problem can be solved by introducing an intermediary that consolidates shipments from many retailers and delivers them to clients scattered in different corners of the world, which is very similar to the concept of constructing overseas warehouses.

2.2. Logistics Warehouse Deployment Methods

In the traditional logistics field, research on logistics network planning and logistics warehouse layout has been very mature. Scholars proposed and applied a variety of methods and models on the layout of the logistics and site selection that can mainly be divided into two classes: quantitative methods and qualitative methods. Quantitative methods are mainly mathematical programming models [15,16,17,18] and set cover models [19,20], which are based on the minimum logistics transportation cost and shipping time. Qualitative methods are mainly analytic hierarchy process (AHP) [21,22,23], Technique for Order of Preference by Similarity to Ideal Solution (TOPSIS) [24], and fuzzy clustering method (FCM) [25]. Besides, Jacyna-Gołda and Izdebski [26] turned multi-criteria decision-making problems into optimization problems using genetic algorithms to solve warehouse location problems.

2.3. Technique for Order of Preference by Similarity to Ideal Solution (TOPSIS)

The TOPSIS is a classical multiple attribute decision making method that has been used in several fields [27,28]. For example, supply chain management [29], health, safety [30], environment management [31], energy management [32], land resource management, and other fields [33]. TOPSIS is a simple ranking method in conception and application. The standard TOPSIS method attempts to choose alternatives that simultaneously have the shortest distance from the positive ideal solution and the farthest distance from the negative ideal solution. In addition, TOPSIS makes full use of attribute information, provides a cardinal ranking of alternatives, and does not require attribute preferences to be independent. Several scholars have made attempts to propose improvements by extending or presenting new modifications of TOPSIS. The TOPSIS method is the second most popular method among multiple-criteria decision making (MCDM) approaches [34]. However, most of the existing studies are focused on the distance from the positive and negative solutions and the relative closeness to the ideal solution. To the best of our knowledge, at present, few studies have introduced the concept of centrality from complex network theory into TOPSIS research.

2.4. Incremental Contributions
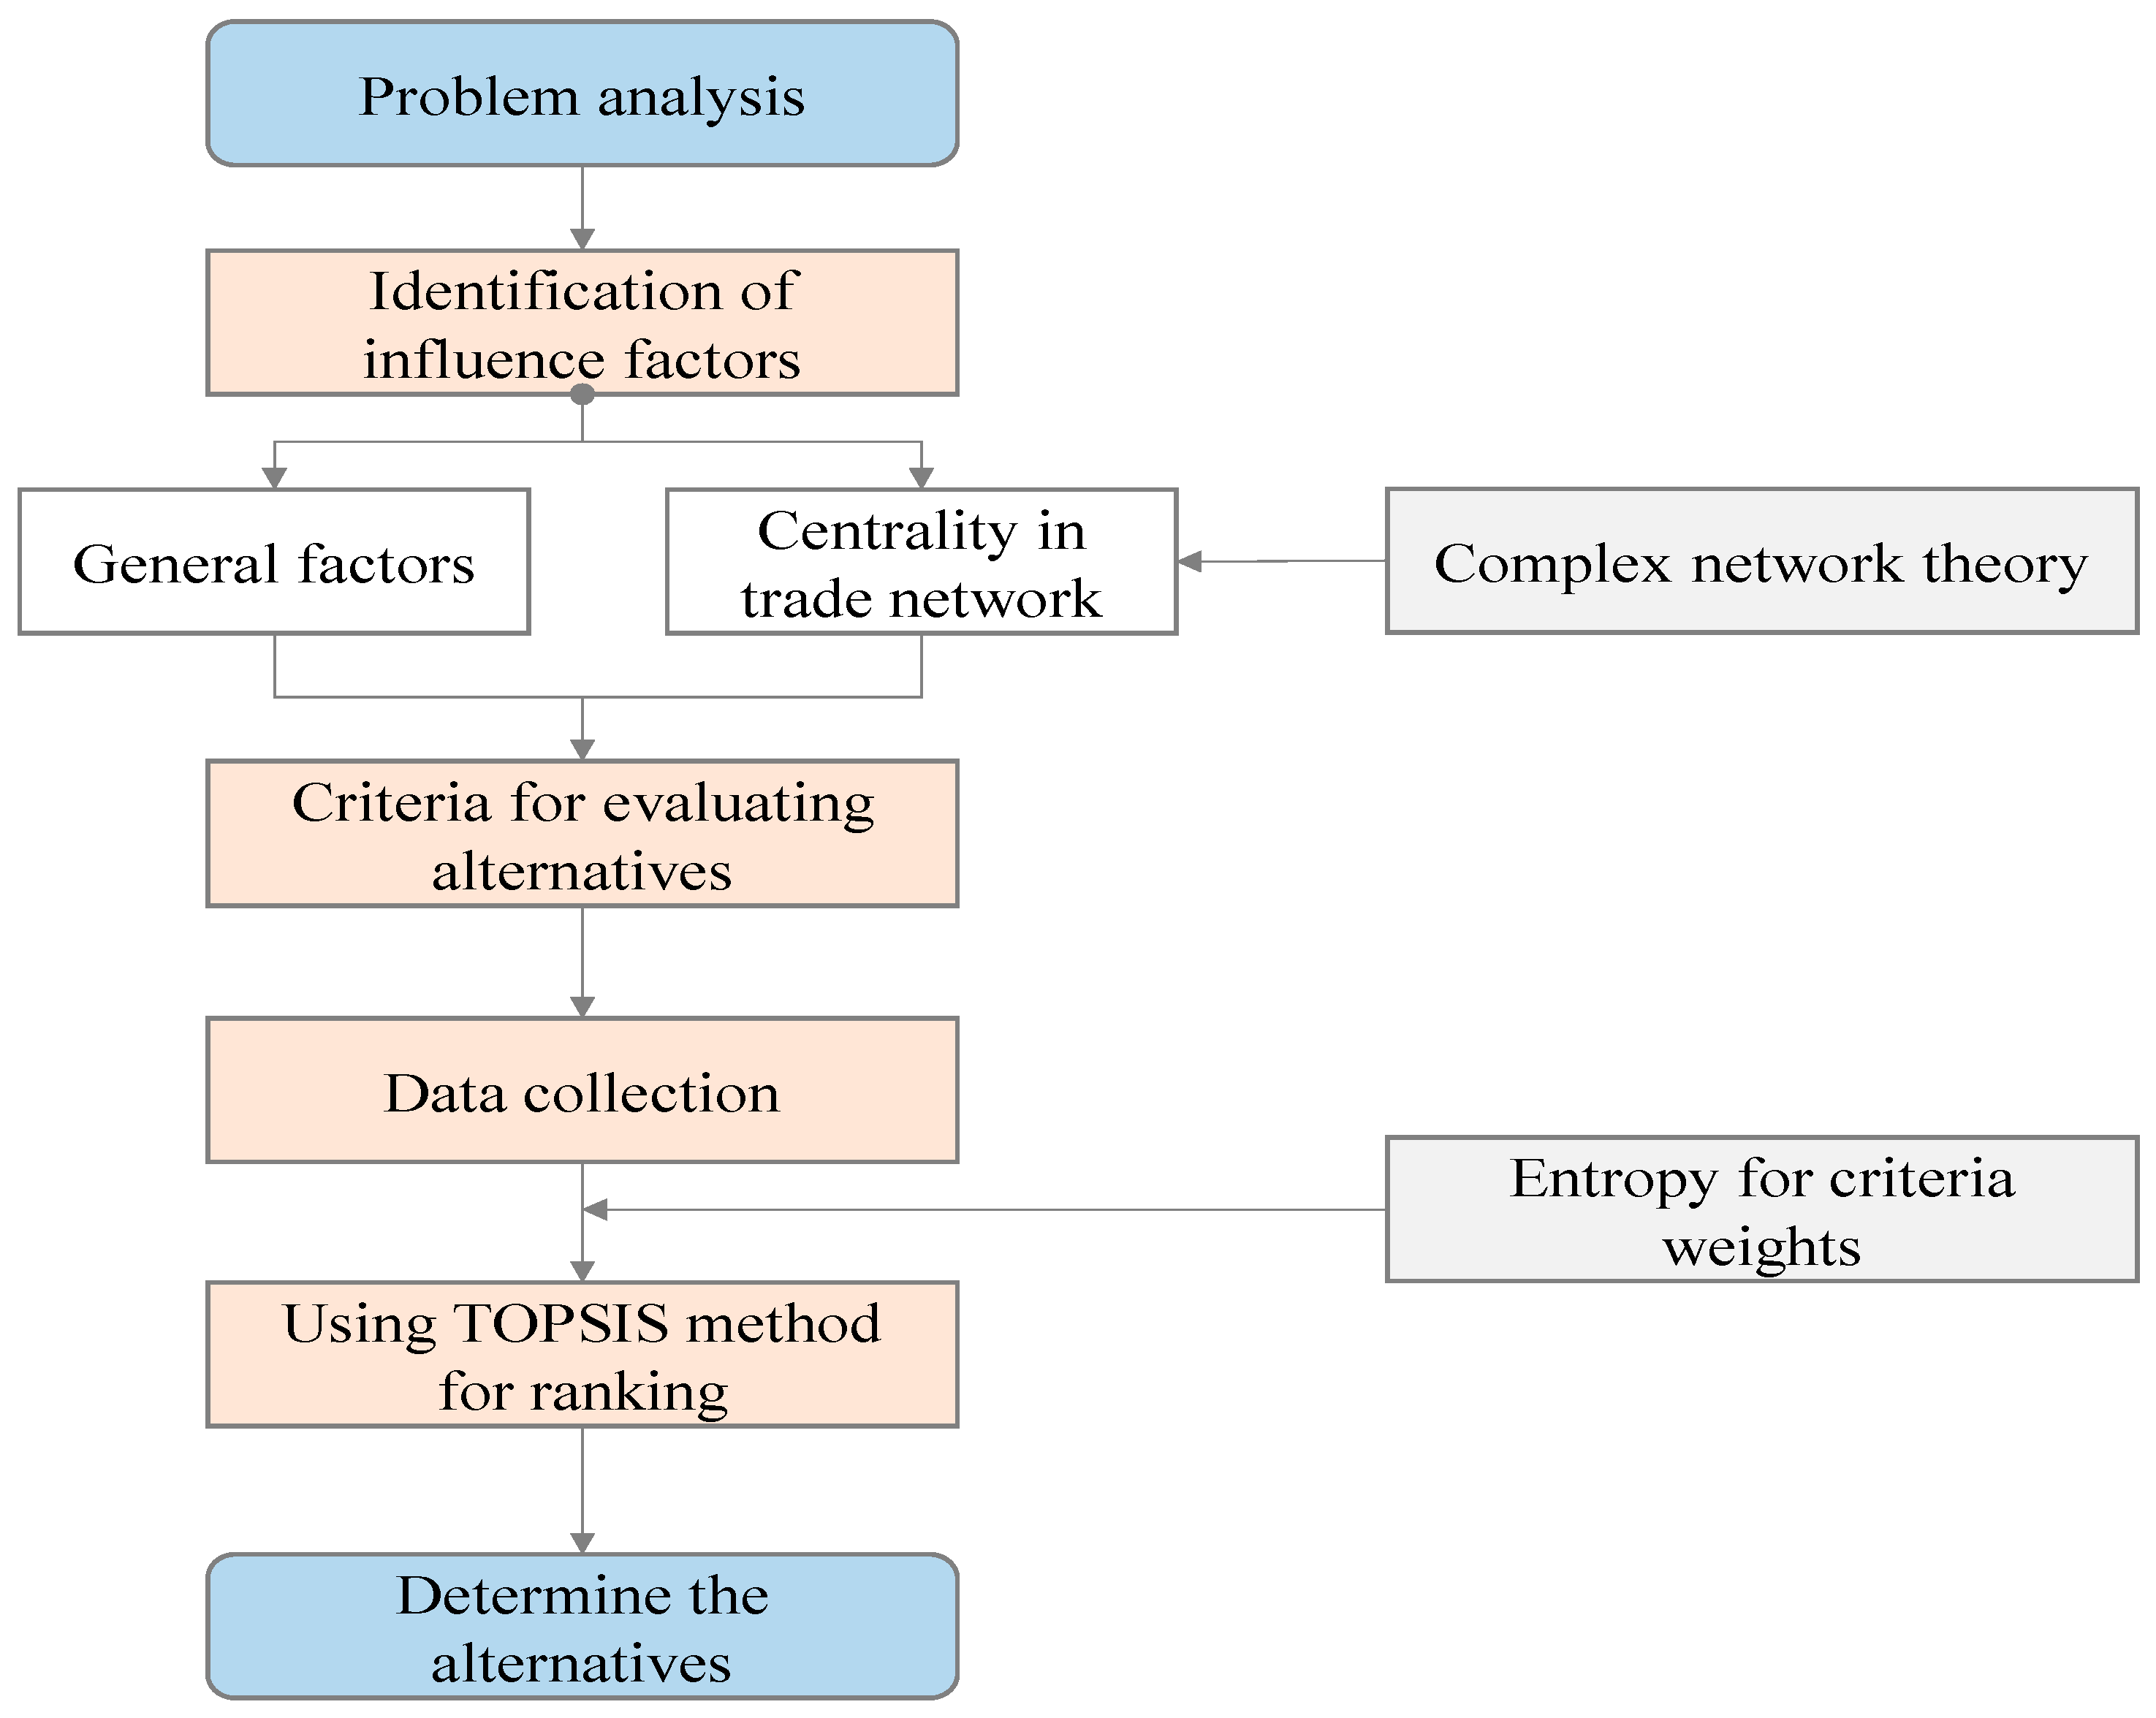
The deployment of warehouse location is actually a complex multi-attribute decision and multi-objective decision problem, especially for overseas warehouse deployment [4]. There are seldom studies on overseas warehouse deployment for China’s export products although China’s cross-border e-commerce scale was ranked first in the world in 2017 [35]. Besides, this paper is different from the studies focusing only on transport cost and delivery time, it comprehensively considers demand value, logistics performance, trade potential, and the centrality of the countries in the B&R trade network, which is an important contribution to the existing literature, although the concept of centrality in complex networks theory has been used in various studies, for example [36,37]. The method in this paper which combined E-TOPSIS and centrality in complex networks is also an extension of the existing method. Furthermore, by doing a sensitivity experiment under different criteria weights, this paper provides various alternative proposals for decision makers.

3. Methodology

In Section 2, we can see that most of the research on the deployment of logistics warehouses and the layout of overseas warehouses uses mathematical programming models and intelligent algorithms to solve them. These models mainly aim at minimizing transportation cost and time cost. However, in the context of the BRI, the issues of overseas warehouse deployment of China’s export products should not only consider the logistics cost and service efficiency of the business but also macro-economic factors, such as China’s export trade volume and outward foreign direct investment to countries along the B&R, the status of these countries in the B&R trade network, and so on. Therefore, this paper applies a comprehensive decision-making method and an E-TOPSIS Model combined with centrality in complex networks theory to analyze the overseas warehouse deployment of China’s export products in the context of the BRI. Namely, we use the entropy method in the first stage to determine the weight of each attribute and then the TOPSIS method in the second stage to make a multi-attribute comprehensive decision. A systematic scheme of the study is shown in Figure 2.

3.1. Weight Calculation

The most used method to determine the weights of indicators are AHP and the entropy weight method. Compared with AHP, the entropy weight method can avoid subjective effects [38]. Therefore, this article selects the entropy weight method to determine the weight of each indicator.
According to the basic principle of information theory, information is a measure of the orderly degree of a system and entropy is a measure of the disorderly degree of the system. The smaller the information entropy of an indicator, the greater the amount of information provided by the indicator, which means the indicators with small information entropy always play an important role in the comprehensive evaluation, and they should be given a high weight [39].
Let us consider the decision matrix R , which consists of alternatives and criteria, described by:
R = A 1 A m [ x 11 x 1 n x m 1 x m n ] C 1 C n
where A 1 , A 2 , , A m are viable alternatives (candidate sites), C 1 , C 2 , , C n are criteria, and the rating of the i-th alternative candidate is denoted by x i j , namely, x i j is the value of the j-th criteria ( C j ) for the i -th alternative ( A i ), m is the number of alternatives, and n is the number of criteria.
Step 1: Construct the normalized matrix.
P = ( p i j ) m × n = [ p 11 p 1 n p m 1 p m n ]
where p i j = x i j / i = 1 m ( x i j ) 2 . Various dimensional attributes can be transformed into non-dimensional attributes through this process.
Step 2: Calculate the entropy of each attribute j .
e j = k i = 1 m p i j ln p i j
k = 1 / ln m
Step 3: determine the weight of each attribute j .
w j = ( 1 e j ) / j = 1 n ( 1 e j )

3.2. TOPSIS Method

TOPSIS is a multi-criteria decision analysis method, which was originally developed by Hwang and Yoon [40]. Hwang et al. [41] made further developments for it, proposing TOPSIS for a multiple-objective decision making (MODM) problem. TOPSIS is used to identify solutions from a limited set of scenarios, and the rationale is that the chosen alternative should have the shortest geometric distance from the positive ideal solution (PIS) and the farthest distance from the negative ideal solution (NIS) [42]. This method has been widely applied to maritime transport and logistics [43].
This method can sort a variety of existing programs and select the optimal program. The specific steps are as follows:
Step 1: Construct the weighted normalized decision matrix A = ( a i j ) .
A = ( a i j ) = p i j × w j , i = 1 , 2 , m ; j = 1 , 2 , n
Step 2: Determine the positive ideal solution a + and negative ideal solution a .
a + = ( a 1 + , a 2 + , a n + )
a = ( a 1 , a 2 , a n )
a j + = { m a x i a i j ,   j   is   benefit   attribute m i n i a i j ,   j   is   cost   attribute   j = 1 , 2 , , n
a j = { m a x i a i j ,   j   is   cost   attribute m i n i a i j ,   j   is   benefit   attribute   j = 1 , 2 , , n
Step 3: Calculate the Euclidean distances from the positive ideal solution and the negative ideal solution.
The distance of each alternative candidate from the positive ideal solution is given as:
d i + = j = 1 n ( a i j a j + ) 2   i = 1 , 2 , , m
The distance of each alternative candidate from the negative ideal solution is given as:
d i = j = 1 n ( a i j a j ) 2   i = 1 , 2 , , m
Step 4: Calculate the relative closeness of a particular alternative to the ideal solution.
C i = d i ( d i + d i + )   i = 1 , 2 , , m
Step 5: Rank the preference order based on the descending order of C i .

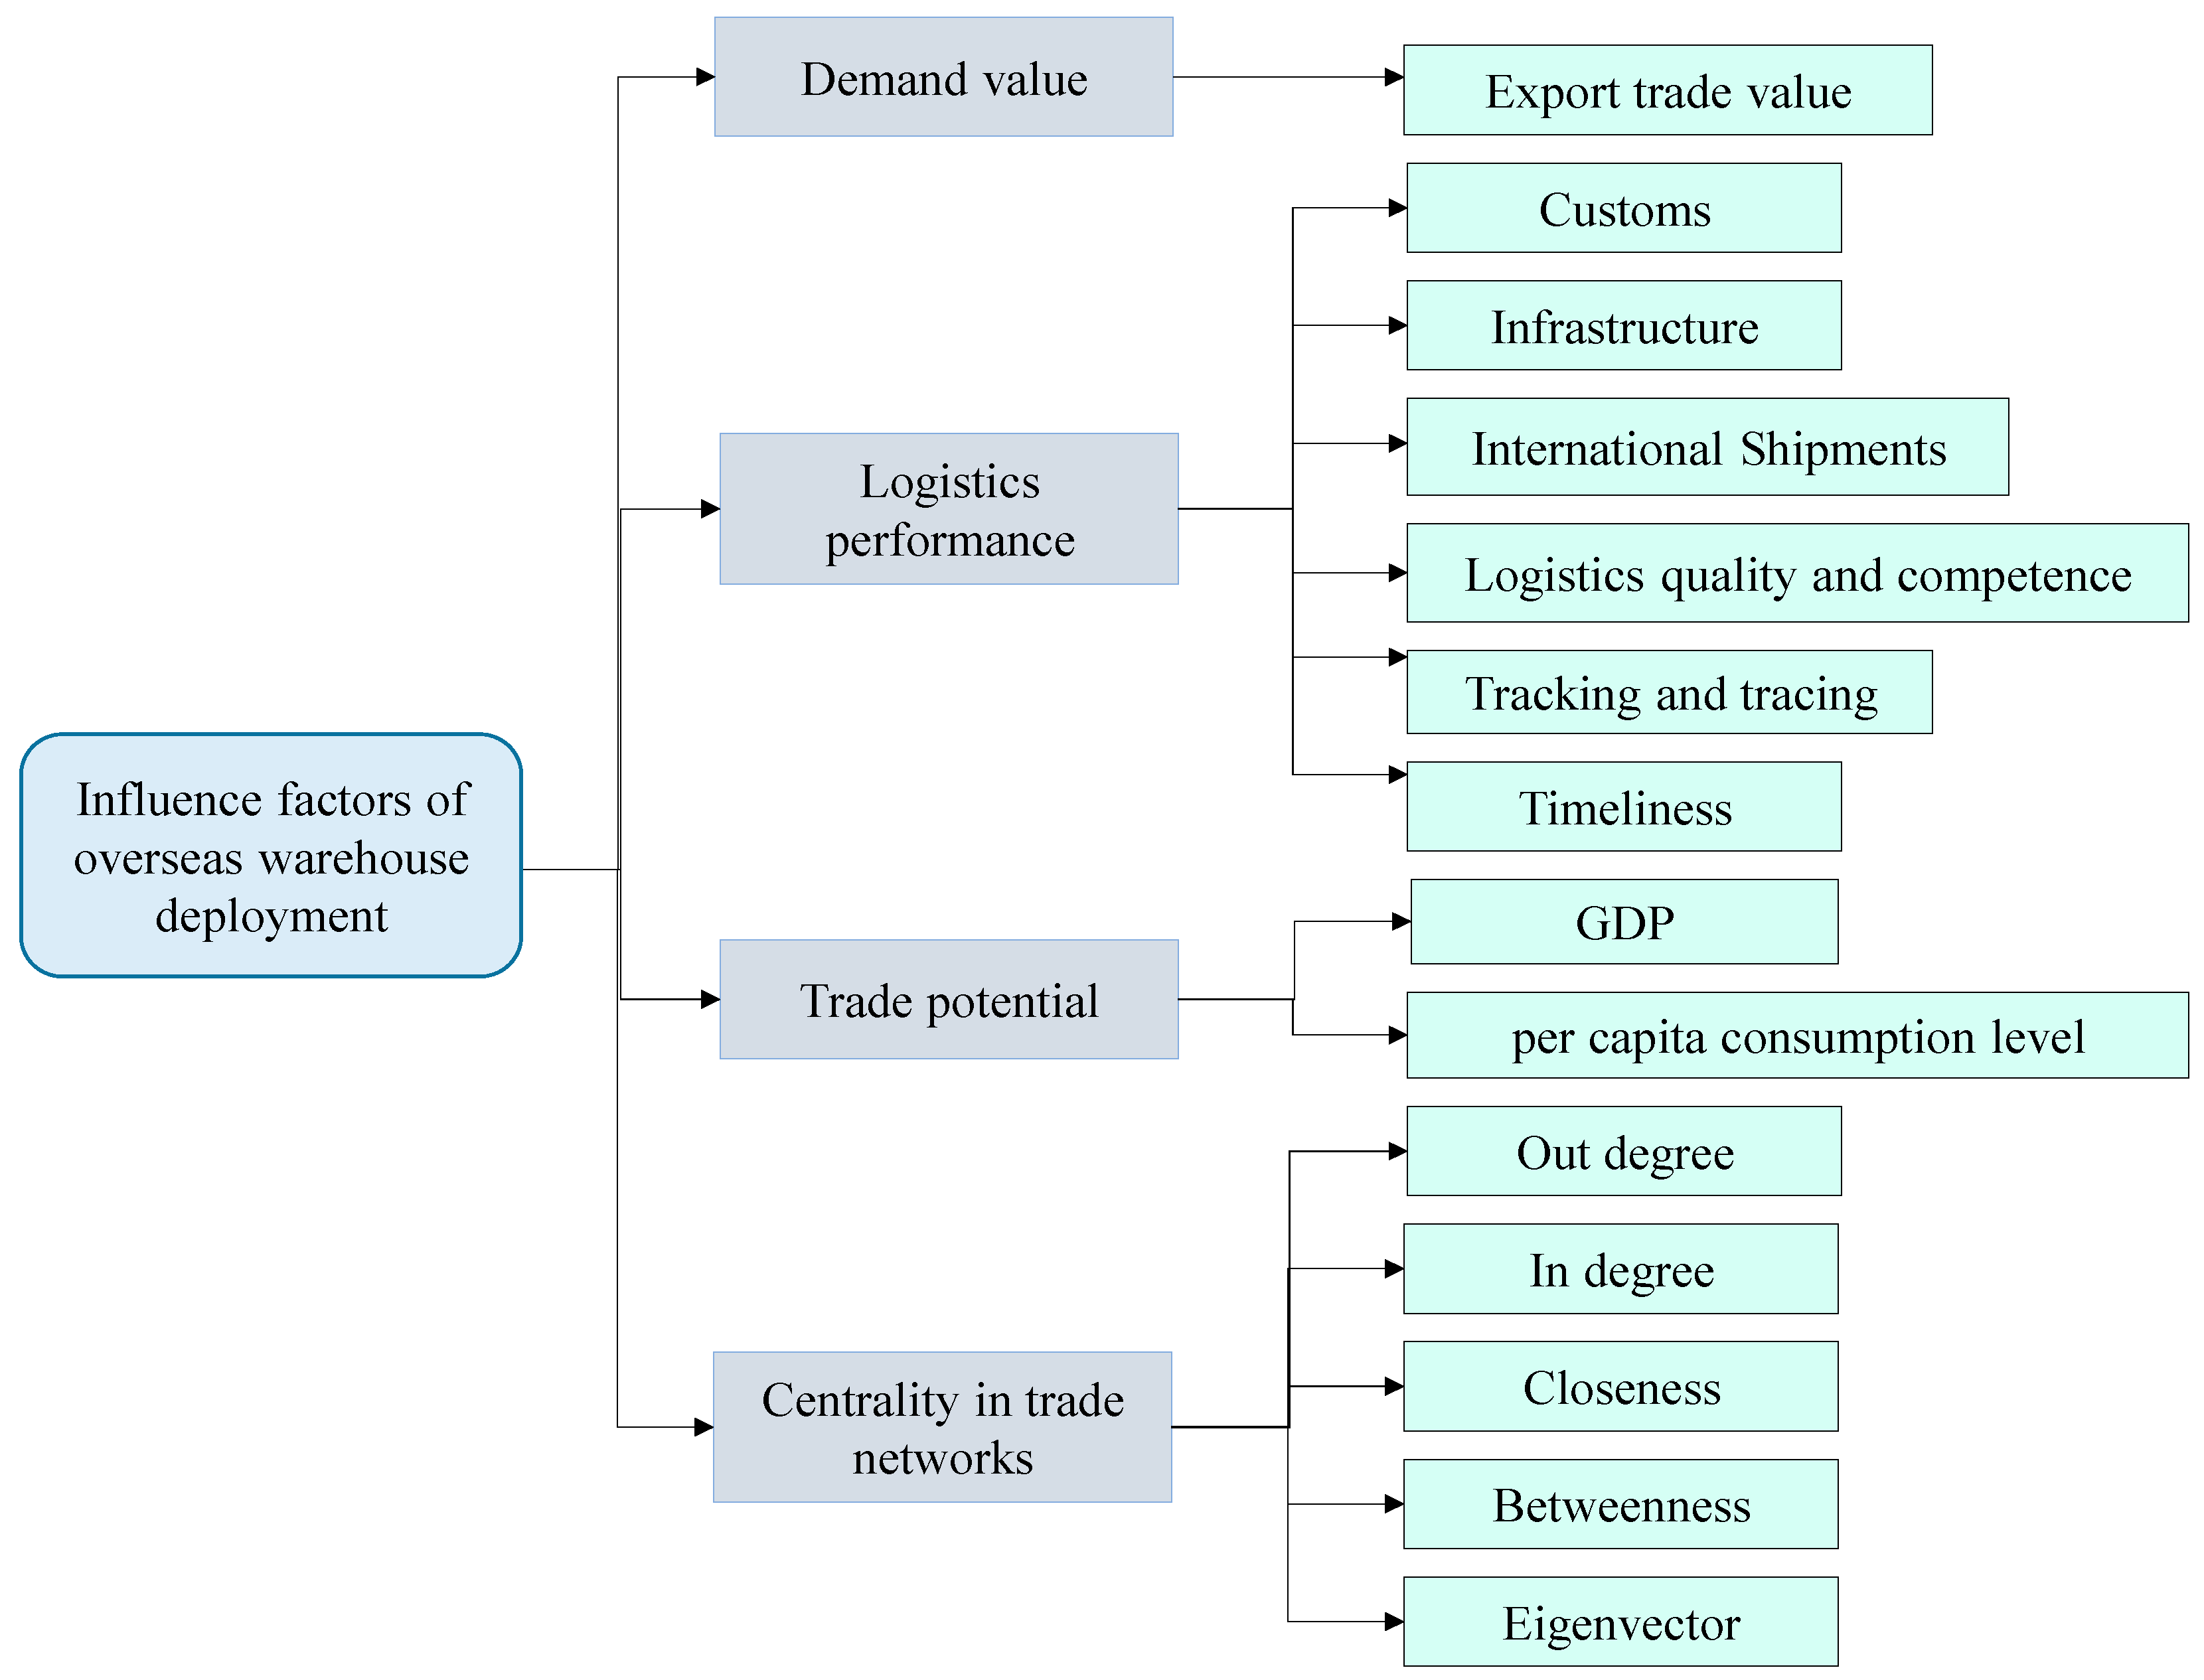
4. Influence Factors of Overseas Warehouse Deployment

The lowest logistics costs, the best social and economic utility, and the highest level of service quality have always been the goals of logistics services. In the process of building a cross-border e-commerce logistics system, the layout of overseas warehouses is affected by both macro and micro factors.
Macro factors include political factors, economic factors, social factors, science and technology factors, legal factors, and so on. The main consideration of micro-factors is logistics cost minimization. The overseas warehouse logistics distribution services for export commodities include three links: the first-leg of transportation, storage control, and local distribution. In this study, we mainly focus on the first-leg of transportation link to research the cross-border e-commerce overseas warehouse deployment problem.
Considering the availability of data, 17 indicators that affect the layout of overseas warehouses were selected in this study to make comprehensive decisions on the deployment of overseas warehouses for China’s export products in the context of the BRI. These 17 indicators can be divided into 4 categories, namely, (i) demand value; (ii) logistics performance; (iii) trade potential; and (iv) centrality in the B&R trade network; they are depicted in Figure 3.

5. Empirical Study of Overseas Warehouse Deployment

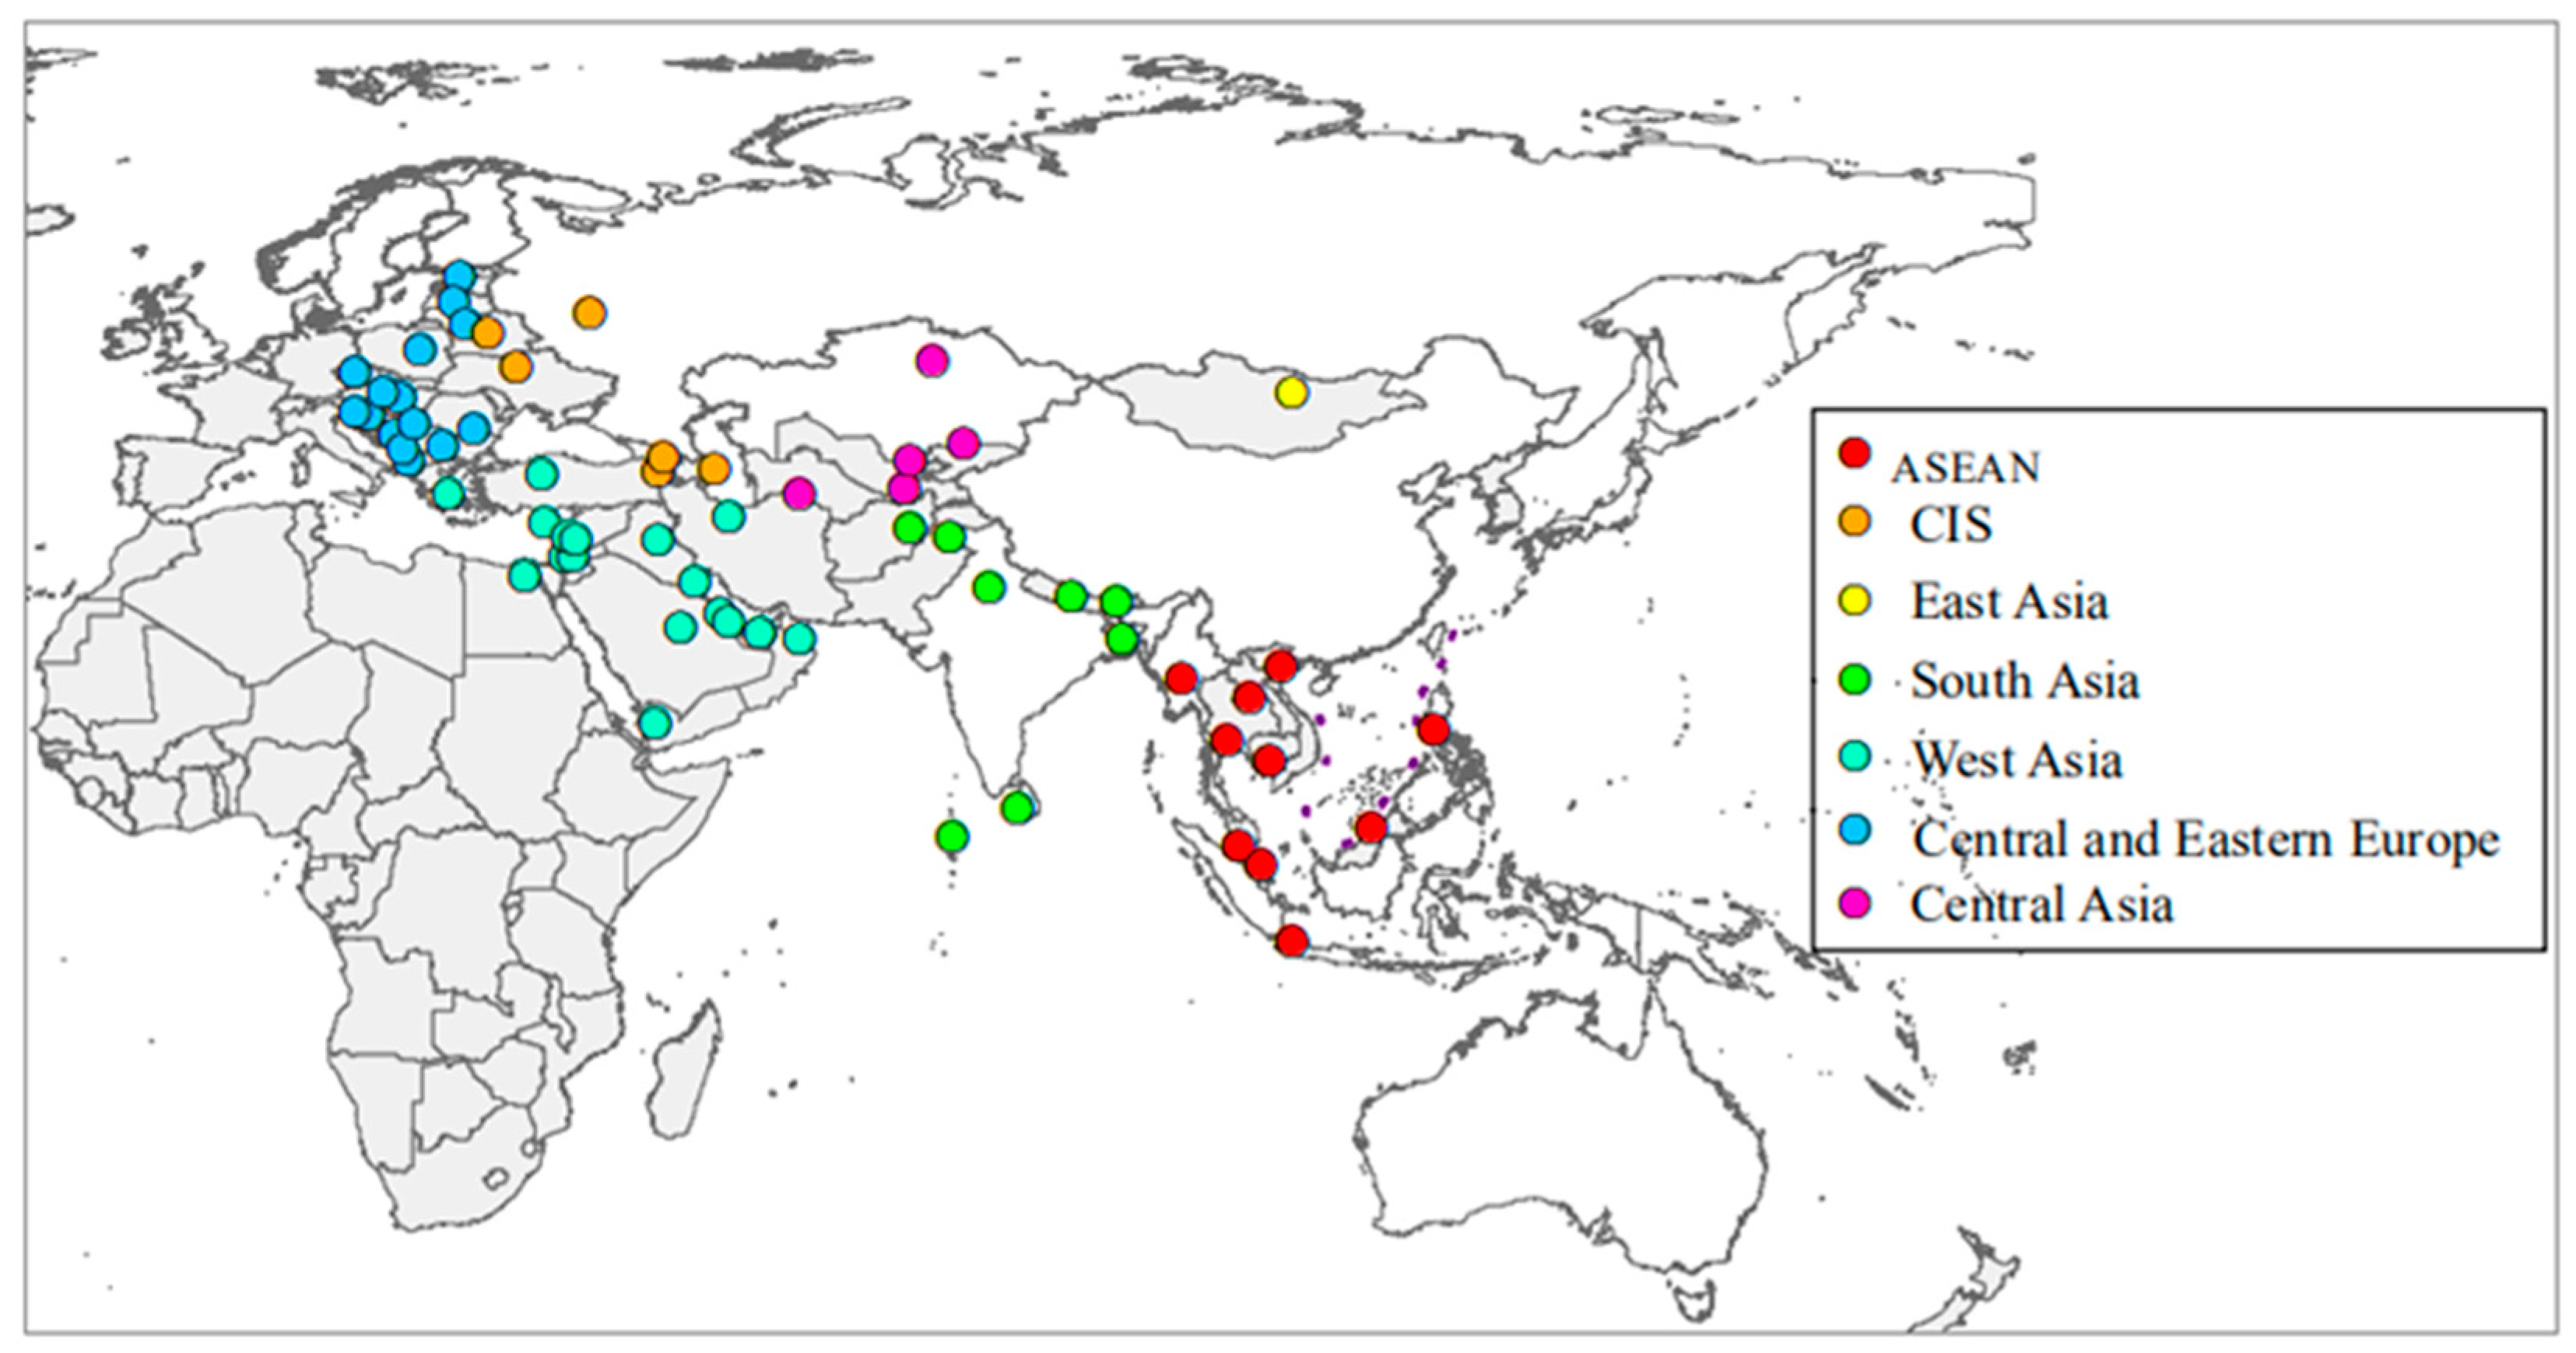
5.1. Data Description

Thanks to the implementation of appropriate policy support and the progressive establishment of e-commerce platforms, China’s cross-border e-commerce industry has demonstrated stable and rapid development in recent years [44].
This paper mainly studies the overseas warehouse deployment of China’s export products under the BRI. Here, the countries along the B&R are taken as the demand points as well as the alternative nodes of overseas warehouses. We assume that transportation costs are directly proportional to transportation distance. China’s export trade volume to these countries is taken as the overseas demand. Based on data availability, 62 countries along the B&R were selected in this study as demand nodes (which are also alternative nodes of overseas warehouses). The geographical distribution of each alternative node is shown in Figure 4.
As can be seen from Figure 4, there are 10 ASEAN countries; 1 East Asian country (Mongolia); 7 CIS countries; 8 South Asian countries; 18 Western Asian countries; 16 Central and Eastern European countries and 5 Central Asian countries among the 62 countries along the B&R selected in this paper.
In this paper, the data of Logistics Performance Index (LPI), Export Trade volume (ETV), Gross Domestic Product (GDP), and per capita consumption (PPC) level are from the World Bank website (https://data.worldbank.org/, accessed on 7 March 2022) and UNCTAD (https://comtrade.un.org/data/, accessed on 7 March 2022). The centrality values ( D o u t , D i n , CC, BC, EC) of each alternative candidate in the trading network are calculated according to the concept of centrality in complex networks. The specific definition and meaning of four kinds of centrality are shown below:
Outdegree and indegree are based on the number of edges connecting to each node. Outdegree is the number of outgoing edges from each node, and indegree is the number of incoming edges to each node, which are defined as:
D o u t i = j x i j
D i n i = j x j i
where   i is the focal node, j represents all other nodes, N is the total number of nodes, and x i j is defined as 1 if node i is connected to node j , and 0 otherwise.
Closeness centrality relies on the length of the paths from a node to all other nodes in the network, and it is defined as the inverse total length. Betweenness relies on the identification of the shortest paths and measures the number of them that passes through a node. As a consequence, the closeness and betweenness centrality were asserted by [45], respectively:
C C ( i ) = [ j N d ( i , j ) ] 1
C B ( i ) = g j k ( i ) g j k
where d ( i , j ) represents the length of the paths from node   i to node j , g j k represents the number of binary shortest paths between two nodes, and g j k ( i )   is the number of those paths which go through node   i .
The eigenvector centrality uses the eigenvector corresponding to the largest eigenvalue of the graph adjacency matrix. The scores are normalized such that the sum of all centrality scores is 1. Eigenvector centrality emphasizes the mutual influence between nodes, and the eigenvector of a node depends on the centralities of its neighbor nodes to a great extent. Suppose a network with N nodes, define A as the adjacent matrix of the network and let the values of λ 1 , λ 2 , , λ n be the principal eigenvalue of A. Hence, the corresponding eigenvector e = ( e 1 , e 2 , , e n ) T . We have
λ e i = i = 1 n a i j e j
and the eigenvector centrality of node i can be denoted by
C e ( i ) = λ 1 i = 1 n a i j e j
Table 1 presents summary statistics of the selected criteria. The maximum and minimum values for various criterions vary greatly. From the single factor, every alternative node has a big difference, especially from the perspectives of demand volume (export trade volume) and trade potential (GDP, PPC). This fully shows that the choice of overseas warehouse position cannot be based on a single factor. It needs to consider multiple attributes to make a comprehensive decision.

5.2. Empirical Results

Based on the above data, MATLAB7.0 software is used to solve the problem. Firstly, the entropy weight method is used to determine the weight of each attribute j. The specific results are shown in Table 2.
It is clear from Table 2 that export trade volume owns the highest weight of 0.3043. Because overseas warehouse construction must take customer service as a general goal, the overseas warehouse should be as close to the terminal market as possible. Therefore, the most important factor is overseas demand, namely, the export trade volume. The GDP and PPC are ranked at the second and third place with the weight of 0.3167 and 0.1865, respectively, followed by the betweenness centrality of each node. Betweenness centrality relies on the identification of the shortest paths, which reflects the transportation costs to some extent.
Then, the TOPSIS algorithm is used to find the relative closeness of a particular alternative to the ideal solution, and the alternative nodes are ranked based on the descending order of C i . The specific results are shown in Table 3 and the geographical distribution is depicted in Figure 5.
Based on the value of the relative closeness of a particular alternative to the ideal solution ( C i ), the ranking of the alternative nodes in descending order is presented in Table 3. According to the comprehensive results, the top fifteen alternatives are India, Singapore, Russia, Qatar, UAE, Indonesia, Vietnam, Turkey, Israel, Thailand, Malaysia, Poland, Saudi Arabia, Czech, and Kuwait.
India has become the seventh largest exporter of Chinese goods in the world. Specifically, the Good and Service Tax (GST) system carried out by India on 1 January 2017 reduced taxes on Chinese exports to India, which will promote the development of cross-border e-commerce between China and India. Besides, Indian e-commerce businesses also began to pay attention to China’s cross-border export market recently. For example, approximately 40% of the goods sold by India’s most active e-commerce company-Paytm mall are from China. Registering a company in India and using the overseas warehouse model to stock goods in India has gradually become a cross-border e-commerce channel for Chinese sellers to connect with Indian consumers. Furthermore, as predicted by eMarketer, Indian e-commerce retail sales will reach $37.5 billion in 2017, and by 2020 that number will reach $79.4 billion. India’s consumers shopping through e-commerce platforms will also grow from 199 million in 2017 to 352 million in 2020 [46]. Therefore, for Chinese export products, India is the preferred place to establish overseas warehouses.
Singapore, as one of the busiest ports in the world and one of Asia’s major transit hubs, is the world’s largest logistics center and the world’s trading hub, having a superior geographical advantage in international trade and international logistics. Simultaneously, Singapore has a well-developed digital infrastructure and is one of the regions with the highest Internet penetration rates in Southeast Asia. In terms of e-commerce, Singapore’s e-commerce market is expected to reach $5.4 billion by 2025 [47].

5.3. Sensitivity Analysis

A sensitivity analysis was conducted to further study the manner of the overseas warehouses’ location under different criteria weights. The idea of sensitivity analysis is to exchange each criterion’s weight with another criterion’s weight. There are 14 criteria, so 91 combinations of the 14 criteria should be analyzed. To simplify the problem, these 14 criteria are divided into 4 parts as is shown in Figure 4. Namely, (i) demand value; (ii) logistics performance; (iii) trade potential; (iv) centrality in B&R trade network. So, the weights of these four criteria are: 0.3043, 0.0393, 0.5032, and 0.1532, and this result is used as the main condition in sensitivity analysis. Therefore, six combinations of four criteria are analyzed eventually, as shown in Table 4. The results of the sensitivity analysis are presented in Table 5.
According to Table 4 and Table 5, India has the highest value of C i , when the weights of four criteria are in the main condition, condition 1 and 4. Specifically, India gets the highest value of C i , and it is the most important place to build overseas warehouses, when the trade potential and the logistics performance have the highest weights.
Bangladesh will have the highest C i value, when the weights of the demand value and the trade potential are exchanged in condition 2. Bangladesh is one of the least developed countries in the world: it lacks resources and it has a large population, backward production technology, and weak industrial base. However, for this reason, its materials from production to life, such as grain, cotton, sugar, cooking oil, industrial raw materials, machinery and equipment, and transportation vehicles, mainly rely on imports. Therefore, huge trade potential exists in Bangladesh.
Slovakia will have the highest C i value when the weights of demand value and centrality in trade networks are exchanged in condition 3. Namely, the weight of centrality in the B&R trade network is higher than the demand value. As a landlocked country of Central Europe, Slovakia is bordered by the Czech Republic in the northwest, Poland in the north, Ukraine in the east, Hungary in the south and Austria in the southwest. It is an important node of Sino-European trade in the Silk Road Economic Belt.
Egypt will have the highest C i value when the weights of logistics performance and centrality in trade network are exchanged in condition 5. Namely, the weight of logistics performance is higher than centrality in the B&R trade network. Egypt is one of the countries with the best logistics performance in low- and middle-income countries around the world. Besides, located at the crossroads of Europe, Asia, and Africa, Egypt is a shortcut between the Atlantic Ocean and the Indian Ocean. Therefore, it has a strategic position in global economic trade, and it is an important node for China’s export products to establish overseas warehouses.
Romania will have the highest C i value when the weights of trade potential and centrality in trade network are exchanged in condition 6. Namely, the weight of centrality in the B&R trade network is higher than the trade potential because 60 countries along the B&R directly trade with Romania, and Romania has the highest closeness centrality and betweenness centrality in the B&R trade network, which suggests that Romania can be chosen as a transit hub of the overseas warehouse for China’s export products.
Additionally, Indonesia and Greece will be selected if conditions 1 and 3 are met compared with the main condition. On the other hand, the Czech Republic will be selected in conditions 1 and 4–6. The Czech Republic and Lithuania will be selected if conditions 4 and 5 are met. Nepal, Uzbekistan, and Slovakia will be selected if conditions 2 and 3 are met. Therefore, the decision-maker can use these different weight combinations in the decision-making process according to priority.

6. Conclusions and Implications

In recent years, with the rapid development of cross-border e-commerce, the problem of cross-border logistics has become increasingly prominent. Overseas warehouses provide a new solution for ensuring the safety and the smoothness of cross-border logistics, improving the level of cross-border trade services, and promoting the high-quality development of the Belt and Road [48].
In this paper, we investigated the determination factors of overseas warehouses for cross-border e-commerce and proposed a comprehensive method combined with E-TOPSIS and centrality in complex networks to find the optimal overseas warehouse locations for Chinese export products along the B&R. Our main findings are as follows: (1) Consistent with the findings of many previous studies on logistics warehouse locations, results show that freight demand is the most important factor influencing cross-border e-commerce overseas warehouse locations [49,50], followed by economic development level (GDP and PPC). This is mainly because trade demand is the key cause of logistics, and the level of economic development or GDP and per capita consumption of a region determines the trade demand of the area; (2) The betweenness centrality and outdegree centrality in a global trade network and the logistics infrastructure are also important factors in cross-border e-commerce overseas warehouse locations, which just ranked fourth, fifth, and sixth, respectively. These three factors represent the potential logistics convenience radiation to its surrounding markets. Therefore, overseas warehouse location models should account for the node centrality in the trade network and its logistics performance as well; (3) India, Singapore, Russia, Qatar, UAE, Indonesia, Vietnam, Turkey, Israel, Thailand, Malaysia, Poland, Saudi Arabia, Czech, and Kuwait are the top 15 best alternatives of overseas warehouses for Chinese export products in the context of the B&R. Among them, only three countries (Russia, Poland, and Czech) are on the Silk Road Economic Belt, and the remaining 12 countries are all countries along the 21st Century Maritime Silk Road. Russia has a superior geographical position across the Eurasian Continental Bridge, and in recent years cross-border e-commerce has developed rapidly in Russia, which shows a huge market potential [51]. As the largest country and economy in Eastern Europe, Poland has close trade relations with China: China is Poland’s largest trading partner and its third largest source of imports in Asia. The Czech Republic is China’s second largest trading country in Central and Eastern Europe, closely following Poland. Moreover, the Czech Republic is the heartland of Eastern Europe, and it has an extremely important position in economy, trade, and transportation. Moreover, the Czech Republic has also seen opportunities in the development of the Belt and Road, such as the construction of logistics centers. Currently, the Czech Ministry of Transport is working on planning in this area. In summary, this also justifies the correctness and the rationality of the results obtained by the proposed method in this paper.
Based on our analytical results, we proposed the following implications. With the steady development of the B&R, Chinese e-commerce platforms and export companies should give priority to the construction of overseas warehouses in the following 15 countries: India, Singapore, Russia, Qatar, UAE, Indonesia, Vietnam, Turkey, Israel, Thailand, Malaysia, Poland, Saudi Arabia, Czech, and Kuwait. In addition, the COVID-19 pandemic is still spreading around the world, bringing a huge impact on the world economy and trade. At the same time, it has also prompted changes in the consumption habits of consumers in various countries, and some offline needs have been transferred online, which directly corresponds to the growth of cross-border e-commerce for end consumers against the trend. Therefore, cross-border e-commerce platforms and enterprises should accelerate the layout and the construction of overseas warehouses. However, the outbreak of the COVID-19 pandemic has caused many uncertainties, and overseas warehouse operators should appropriately increase awareness of risk prevention.
What’s more, a sensitivity experiment was conducted to analyze the manner of the overseas warehouses’ locations under different criteria weights. Therefore, the decision-maker can use these different weight combinations in the decision-making process, according to priority. The approach taken by this paper can be undertaken for other countries or for company’s overseas warehouse location deployment.

7. Limitations and Future Research

While the results of the method proposed in this paper are reasonable and the ranking is significant from the mathematical value, although some cities may have a similar potential for warehouses, a cluster analysis may be better. Besides, due to the availability of data, we do not use online trade flows in this work; we simply find the optimal countries for overseas warehouse locations without specific cities. These may also be considered as future research directions.

Author Contributions

Data curation, C.L.; Formal analysis, C.L.; Investigation, J.W.; Methodology, C.L.; Project administration, C.L.; Supervision, J.W. and H.L.J.; Writing—original draft, C.L.; Writing—review & editing, J.W. and H.L.J. All authors have read and agreed to the published version of the manuscript.

Funding

This research was funded by the National Natural Science Foundation of China (71871136) and the Science and Technology Commission of Shanghai Municipality (17DZ2280200).

Institutional Review Board Statement

Not applicable.

Informed Consent Statement

Not applicable.

Data Availability Statement

This study did not report any data.

Acknowledgments

The authors would like to thank the editor and three reviewers for their constructive comments and suggestions, which have led to a much-improved paper.

Conflicts of Interest

The authors declare no conflict of interest.

References

  1. MOFCOM. Report on Development of China’s Outward Investment and Economic Cooperation 2016. Available online: http://hzs.mofcom.gov.cn/article/date/201612/20161202103624.shtml (accessed on 6 November 2017).
  2. Wu, P.; Lin, K. Unstructured big data analytics for retrieving e-commerce logistics knowledge. Telemat. Inform. 2017, 35, 237–244. [Google Scholar] [CrossRef]
  3. Liu, X.; Chen, D.; Cai, J. The Operation of the cross-border e-commerce logistics in China. Int. J. Intell. Inf. Syst. 2015, 4, 15–18. [Google Scholar]
  4. Li, H.; Miao, X. Research on the status quo and operation model of logistics of cross-border e-commerce in China. Agro Food Ind. Hi Tech 2017, 28, 2845–2849. [Google Scholar]
  5. People’s-Daily-Online. Report on the Government’s Work in 2016. Available online: http://www.npc.gov.cn/npc/xinwen/2016-03/05/content_1969457.htm (accessed on 7 November 2017).
  6. Gomez-Herrera, E.; Martens, B.; Turlea, G. The drivers and impediments for cross-border e-commerce in the EU. Inf. Econ. Policy 2014, 28, 83–96. [Google Scholar] [CrossRef] [Green Version]
  7. Sun, X.-Y. Research of post-purchase evaluation on small amount cross border e-commercial based on ACSI model. Agro Food Ind. Hi Tech 2017, 28, 3149–3152. [Google Scholar]
  8. Aulkemeier, F.; Iacob, M.-E.; Van Hillegersberg, J. An architectural perspective on service adoption: A platform design and the case of pluggable cross-border trade compliance in e-commerce. J. Organ. Comput. Electron. Commer. 2017, 27, 325–341. [Google Scholar] [CrossRef] [Green Version]
  9. Hsiao, Y.-H.; Chen, M.-C.; Liao, W.-C. Logistics service design for cross-border e-commerce using kansei engineering with text-mining-based online content analysis. Telemat. Inform. 2017, 34, 284–302. [Google Scholar] [CrossRef]
  10. Gessner, G.H.; Snodgrass, C.R. Designing e-commerce cross-border distribution networks for small and medium-size enterprises incorporating Canadian and US trade incentive programs. Res. Transp. Bus. Manag. 2015, 16, 84–94. [Google Scholar] [CrossRef]
  11. Lam, C.; Choy, K.; Ho, G.; Chung, S. A hybrid case-GA-based decision support model for warehouse operation in fulfilling cross-border orders. Expert Syst. Appl. 2012, 39, 7015–7028. [Google Scholar] [CrossRef]
  12. Giuffrida, M.; Mangiaracina, R.; Perego, A.; Tumino, A. Cross border B2C e-commerce to greater China and the role of logistics: A literature review. Int. J. Phys. Distrib. Logist. Manag. 2017, 47, 772–795. [Google Scholar] [CrossRef]
  13. Sinkovics, R.R.; Yamin, M.; Hossinger, M. Cultural adaptation in cross border e-commerce: A study of German companies. J. Electron. Commer. Res. 2007, 8, 221–235. [Google Scholar]
  14. Kawa, A. Supply chains of cross-border e-commerce. In Advanced Topics in Intelligent Information and Database Systems; Springer: Cham, Switzerland, 2017. [Google Scholar]
  15. Cordeau, J.-F.; Pasin, F.; Solomon, M.M. An integrated model for logistics network design. Ann. Oper. Res. 2006, 144, 59–82. [Google Scholar] [CrossRef]
  16. Ozsen, L.; Coullard, C.R.; Daskin, M.S. Capacitated warehouse location model with risk pooling. Nav. Res. Logist. 2008, 55, 295–312. [Google Scholar] [CrossRef]
  17. Takeyasu, K.; Kainosho, M. Optimization technique by genetic algorithms for international logistics. J. Intell. Manuf. 2014, 25, 1043–1049. [Google Scholar] [CrossRef]
  18. Zhao, L.; Zhao, Y.; Hu, Q.; Li, H.; Stoeter, J. Evaluation of consolidation center cargo capacity and loctions for China railway express. Transp. Res. Part E Logist. Transp. Rev. 2018, 117, 58–81. [Google Scholar] [CrossRef]
  19. Ye, F.; Zhao, Q.; Xi, M.; Dessouky, M. Chinese national emergency warehouse location research based on VNS algorithm. Electron. Notes Discret. Math. 2015, 47, 61–68. [Google Scholar] [CrossRef]
  20. Huang, S.; Wang, Q.; Batta, R.; Nagi, R. An integrated model for site selection and space determination of warehouses. Comput. Oper. Res. 2015, 62, 169–176. [Google Scholar] [CrossRef]
  21. Korpela, J.; Lehmusvaara, A. A customer oriented approach to warehouse network evaluation and design. Int. J. Prod. Econ. 1999, 59, 135–146. [Google Scholar] [CrossRef]
  22. Ren, S. Assessment on logistics warehouse fire risk based on analytic hierarchy process. Procedia Eng. 2012, 45, 59–63. [Google Scholar] [CrossRef]
  23. Dey, B.; Bairagi, B.; Sarkar, B.; Sanyal, S.K. Group heterogeneity in multi member decision making model with an application to warehouse location selection in a supply chain. Comput. Ind. Eng. 2017, 105, 101–122. [Google Scholar] [CrossRef]
  24. Ozcan, T.; Celebi, N.; Esnaf, S. Comparative analysis of multi-criteria decision making methodologies and implementation of a warehouse location selection problem. Expert Syst. Appl. 2011, 38, 9773–9779. [Google Scholar] [CrossRef]
  25. Demirel, T.; Demirel, N.Ç.; Kahraman, C. Multi-criteria warehouse location selection using Choquet integral. Expert Syst. Appl. 2010, 37, 3943–3952. [Google Scholar] [CrossRef]
  26. Jacyna-Gołda, I.; Izdebski, M. The multi-criteria decision support in choosing the efficient location of warehouses in the logistic network. Procedia Eng. 2017, 187, 635–640. [Google Scholar] [CrossRef]
  27. Yoon, K.P.; Kim, W.K. The behavioral TOPSIS. Expert Syst. Appl. 2017, 89, 266–272. [Google Scholar] [CrossRef]
  28. Behzadian, M.; Otaghsara, S.K.; Yazdani, M.; Ignatius, J. A state-of the-art survey of TOPSIS applications. Expert Syst. Appl. 2012, 39, 13051–13069. [Google Scholar] [CrossRef]
  29. Zhu, Y.; Zhang, C.; Fang, J.; Miao, Y. Paths and strategies for a resilient megacity based on the water-energy-food nexus. Sustain. Cities Soc. 2022, 82, 103892. [Google Scholar] [CrossRef]
  30. Arif, M.; Kumar, V.D.; Jayakumar, L.; Ungurean, I.; Izdrui, D.; Geman, O. DAHP-TOPSIS-based channel decision model for co-operative cr-enabled internet on vehicle (CR-IoV). Sustainability 2021, 13, 13966. [Google Scholar] [CrossRef]
  31. Erdogan, M.; Ayyildiz, E. Comparison of hospital service performances under COVID-19 pandemics for pilot regions with low vaccination rates. Expert Syst. Appl. 2022, 206, 117773. [Google Scholar] [CrossRef]
  32. Wang, C.-N.; Dang, T.-T.; Nguyen, N.-A.; Wang, J.-W. A combined Data Envelopment Analysis (DEA) and Grey Based Multiple Criteria Decision Making (G-MCDM) for solar PV power plants site selection: A case study in Vietnam. Energy Rep. 2022, 8, 1124–1142. [Google Scholar] [CrossRef]
  33. Cao, X.T.; Wei, C.F.; Xie, D.T. Evaluation of scale management suitability based on the entropy-TOPSIS method. Land 2021, 10, 416. [Google Scholar] [CrossRef]
  34. Zavadskas, E.K.; Mardani, A.; Turskis, Z.; Jusoh, A.; Nor, K.M. Development of TOPSIS method to solve complicated decision-making problems: An overview on developments from 2000 to 2015. Int. J. Inf. Technol. Decis. Mak. 2016, 15, 645–682. [Google Scholar] [CrossRef]
  35. MOFCOM. Struggling to Achieve the Goal of a Strong Trade Country. Available online: http://lgj.mofcom.gov.cn/article/swsj/201804/20180402733862.shtml (accessed on 6 November 2017).
  36. Laxe, F.G.; Seoane, M.J.F.; Montes, C.P. Maritime degree, centrality and vulnerability: Port hierarchies and emerging areas in containerized transport (2008–2010). J. Transp. Geogr. 2012, 24, 33–44. [Google Scholar] [CrossRef]
  37. Lowry, M. Spatial interpolation of traffic counts based on origin—Destination centrality. J. Transp. Geogr. 2014, 36, 98–105. [Google Scholar] [CrossRef]
  38. Kim, A.-R. A Study on competitiveness analysis of ports in Korea and China by entropy weight TOPSIS. Asian J. Shipp. Logist. 2016, 32, 187–194. [Google Scholar] [CrossRef]
  39. Shannon, C.E.; Weaver, W. The mathematical theory of communication. M.D.Comput. Comput. Med. Pract. 1950, 3, 31–32. [Google Scholar] [CrossRef] [Green Version]
  40. Hwang, C.-L.; Yoon, K. Multiple Attribute Decision Making: Methods and Applications; Springer: Berlin/Heidelberg, Germany, 1981; pp. 58–191. [Google Scholar]
  41. Hwang, C.-L.; Lai, Y.-J.; Liu, T.-Y. A new approach for multiple objective decision making. Comput. Oper. Res. 1993, 20, 889–899. [Google Scholar] [CrossRef]
  42. Kwangsun, Y.; Lai, H.C. Multiple attribute decision making: An introduction. Eur. J. Oper. Res. 1995, 4, 287–288. [Google Scholar]
  43. Lee, P.T.-W.; Yang, Z. Multi-Criteria Decision Making in Maritime Studies and Logistics: Applications and Cases; Springer: Bergen, Norway, 2018. [Google Scholar]
  44. Ma, S.; Chai, Y.; Zhang, H. Rise of cross-border e-commerce exports in China. China World Econ. 2018, 26, 63–87. [Google Scholar] [CrossRef]
  45. Freeman, L.C. Centrality in social networks conceptual clarification. Soc. Netw. 1978, 1, 215–239. [Google Scholar] [CrossRef] [Green Version]
  46. iebrun. GST New Deal Officially Implemented. Available online: http://www.ebrun.com/20170706/237322.shtml (accessed on 8 December 2017).
  47. Nielsen. Global Consumer Consumption Habits Survey Report. Available online: http://www.nielsenccdata.com/insights/index.jhtml (accessed on 16 December 2017).
  48. Wang, Y.; Jia, F.; Schoenherr, T.; Gong, Y. Supply chain-based business model innovation: The case of a cross-border e-commerce company. Sustainability 2018, 10, 4362. [Google Scholar] [CrossRef] [Green Version]
  49. Millstein, M.A.; Bilir, C.; Campbell, J.F. The effect of optimizing warehouse locations on omnichannel designs. Eur. J. Oper. Res. 2022, 301, 576–590. [Google Scholar] [CrossRef]
  50. Lim, H.; Park, M. Modeling the spatial dimensions of warehouse rent determinants: A case study of Seoul metropolitan area, South Korea. Sustainability 2020, 12, 259. [Google Scholar] [CrossRef] [Green Version]
  51. Jia, F.Q.; Bennett, M.M. Chinese infrastructure diplomacy in Russia: The geopolitics of project type, location, and scale. Eurasian Geogr. Econ. 2018, 59, 340–377. [Google Scholar] [CrossRef]
Figure 1. Logistics operation process of overseas warehouse for cross-border e-commerce.
Sustainability 14 09642 g001
Figure 2. A systematic scheme of the study.
Sustainability 14 09642 g002
Figure 3. Influence factors of overseas warehouse deployment.
Sustainability 14 09642 g003
Figure 4. Geographical distribution of 62 alternative nodes.
Sustainability 14 09642 g004
Figure 5. Geographical distribution of 15 alternative nodes for overseas warehouses.
Sustainability 14 09642 g005
Table 1. Summary statistics of the selected criteria.
ETVCustomsInfrastructureISLQC
Min5.0Min1.110Min1.240Min1.360Min1.390
1st Qu927.21st Qu2.3051st Qu2.2851st Qu2.4501st Qu2.330
Median2565.0Median2.640Median2.660Median2.915Median2.775
Mean9452.6Mean2.657Mean2.726Mean2.870Mean2.777
3rd Qu9900.03rd Qu3.1003rd Qu3.1883rd Qu3.3173rd Qu3.200
max61,094.0max4.180max4.200max3.960max4.090
TTTimelinessGDPPCCOutdegree
Min1.770Min2.040Min22.37Min390Min0.00
1st Qu2.4471st Qu2.8821st Qu216.421st Qu24081st Qu46.25
Median2.860Median3.345Median593.44Median6439Median58.50
Mean2.847Mean3.295Mean1992.03Mean11127Mean46.23
3rd Qu3.2503rd Qu3.6273rd Qu2167.153rd Qu129243rd Qu60.00
max4.050max4.400max22,640.00max73725max61.00
IndegreeClosenessBetweennessEigenvector
Min28.00Min64.89Min28.00Min64.89
1st Qu45.001st Qu88.121st Qu45.001st Qu88.12
Median47.00Median97.61Median47.00Median97.61
Mean46.23Mean93.45Mean46.23Mean93.45
3rd Qu49.003rd Qu100.003rd Qu49.003rd Qu100.00
max50.00max100.00max50.00max100.00
Note: ETV: export trade volume; IS: International shipments; LQC: Logistics quality and competence; TT: Tracking and tracing; PCC: per capita consumption level.
Table 2. Weight of each criterion.
AttributesETVCustomsInfrastructureISLQC
w j 0.30430.00800.00830.00580.0066
AttributesTTTimelinessGDPPCCOutdegree
w j 0.00660.00400.31670.18650.0733
AttributesIndegreeClosenessBetweennessEigenvector
w j 0.00120.00140.07520.0021
Note: ETV: export trade volume; IS: International shipments; LQC: Logistics quality and competence; TT: Tracking and tracing; PCC: per capita consumption level.
Table 3. The results of Entropy TOPSIS analyses.
Country C i RankCountry C i RankCountry C i Rank
India0.62781Lithuania0.266222Serbia0.197343
Singapore0.50422Greece0.263223Montenegro0.197044
Russia0.4695 3Hungary0.259624Ukraine0.195245
Qatar0.44604Brunei0.250425Mongolia0.182846
UAE0.41495Romania0.244126Maldives0.179147
Indonesia0.40486Estonia0.239927Nepal0.178748
Vietnam0.37967Cyprus0.239028Albania0.178249
Turkey0.37898Iran0.237829Kyrgyzstan0.175550
Israel0.36679Oman0.235130Georgia0.174451
Thailand0.355610Kazakhstan0.223331Afghanistan0.167952
Malaysia0.354211Latvia0.222832Uzbekistan0.164853
Poland0.328012Bosnia Herzegovina0.221233Yemen0.160054
Saudi Arabia0.327413Bulgaria0.214634Laos0.152455
Czech0.306214Croatia0.211535Armenia0.142856
Kuwait0.304015Belarus0.210936Bhutan0.130557
Philippines0.289316Cambodia0.210937Tajikistan0.129058
Bahrain0.287817Azerbaijan0.210838Myanmar0.124559
Slovenia0.277018Jordan0.204839Iraq0.118860
Pakistan0.272119Bangladesh0.203940Turkmenistan0.107261
Slovakia0.270120Lebanon0.198141Syria0.089562
Egypt0.268421Sri Lanka0.197742
Table 4. Six combinations of four criteria for sensitivity analysis.
ConditionsWeights of Criteria
Demand ValueLogistics PerformanceTrade PotentialCentrality in Trade Network
main0.30430.03930.50320.1532
10.03930.30430.50320.1532
20.50320.03930.30430.1532
30.15320.03930.50320.3043
40.30430.50320.03930.1532
50.30430.15320.50320.0393
60.30430.03930.15320.5032
Table 5. Results of sensitivity analysis.
AlternativesMainCondition 1Condition 2Condition 3Condition 4Condition 5Condition 6
1IndiaIndiaBangladeshSlovakiaIndiaEgyptRomania
2RussiaQatarNepalNepalSingaporeBosnia HerzegovinaEstonia
3SingaporeRussiaUkraineAlbaniaRussiaMontenegroUkraine
4QatarSingaporeTajikistanGeorgiaUAETurkmenistanSlovakia
5IndonesiaIsraelBahrainCyprusTurkeySloveniaSyria
6UAETurkeySyriaArmeniaIndonesiaBhutanIraq
7IsraelUAEYemenPakistanMalaysiaPakistanUzbekistan
8TurkeySaudi ArabiaBelarusLaosThailandKyrgyzstanNepal
9Saudi ArabiaIndonesiaMyanmarMongoliaVietnamMyanmarLaos
10PolandPolandUzbekistanJordanIsraelAzerbaijanGeorgia
11VietnamKuwaitSerbiaRomaniaQatarArmeniaJordan
12ThailandCzechKyrgyzstanUzbekistanSaudi ArabiaNepalOman
13MalaysiaMalaysiaSlovakiaGreecePolandLebanonCzech
14KuwaitThailandMontenegroAzerbaijanCzechLithuaniaBrunei
15CzechGreeceBruneiIndonesiaLithuaniaCzechLithuania
Publisher’s Note: MDPI stays neutral with regard to jurisdictional claims in published maps and institutional affiliations.

