Article

GIS-Based Assessment of the Potential for Treated Wastewater Reuse in Agricultural Irrigation: A Case Study in Northern Italy

by
Giuseppe Mancuso
1,2,*,
Monica C. M. Parlato
3,
Stevo Lavrnić
1,
Attilio Toscano
1,2 and
Francesca Valenti
3
1
Department of Agricultural and Food Sciences, Alma Mater Studiorum—University of Bologna, Viale Giuseppe Fanin 50, 40127 Bologna, Italy
2
CIRI FRAME—Interterdepartmental Centre for Industrial Research in Renewable Resources, Environment, Sea and Energy, Alma Mater Studiorum—University of Bologna, Via Selmi 2, 40126 Bologna, Italy
3
Department of Agriculture, Food and Environment, University of Catania, Via Santa Sofia 100, 95123 Catania, Italy
*
Author to whom correspondence should be addressed.
Sustainability 2022, 14(15), 9364; https://doi.org/10.3390/su14159364
Submission received: 30 June 2022 / Revised: 26 July 2022 / Accepted: 27 July 2022 / Published: 30 July 2022

Abstract

:
Agriculture is the major water user worldwide and it is expected to be negatively affected by climate change and water scarcity. The use of non-conventional water resources could be the solution to overcome this issue. In fact, treated wastewater has a constant availability during the year and it contains nutrients needed for crop growth. The aim of this research was a GIS-based assessment of the potential for treated wastewater agricultural reuse in the Forlì-Cesena province within the Emilia-Romagna region (Italy). The results showed that, for the selected study area, treated wastewater could satisfy up to 316% of yearly and 210% of irrigation season crop water needs at the actually irrigated areas. Furthermore, the availability of this alternative water resource could lead to an increase in irrigated areas. For the proposed scenario, which considered both the actually irrigated areas as well as the irrigable areas, crop water needs could be satisfied by up to 107% on the yearly level and 71% in the case of the irrigation season. Treated wastewater reuse feasibility was also investigated considering the minimum water quality requirements that were recently provided by the new Regulation (EU) 2020/741.

1. Introduction

Climate change and human activities are the main causes of water shortages and water pollution, which represent two of the biggest challenges that humankind faces today [1,2]. The current ‘‘linear’’ attitude that is often applied to urban water management, known in the sustainability literature as “the take, make, waste approach”, is becoming increasingly unsustainable. The most obvious effect is growing water stress (insufficient water supplies) occurring in many areas of the world, but concerns about resource consumption [3] and contaminants dispersion (e.g., nutrients) into the aquatic environment also are growing [4,5]. Population growth and the increase in living standards are pushing the use of available renewable resources, including water, beyond sustainable limits [1,6].
Water consumption continues to grow, negatively affecting each component of the hydrological cycle. It is estimated that by the year 2030, more than 160% of the water that is currently available in the world will be needed to satisfy global water needs [2,7,8,9].
The “Global Risks Report 2020” of the World Economic Forum indicates that water and food crises are among the top 10 long-term risks in the impact category over the next 10 years [10].
Agriculture is the sector most affected by water scarcity. According to the Food and Agriculture Organization (FAO) of the United Nations (UN), the annual worldwide freshwater withdrawal is estimated to be around 4250 km3 [11]. The agricultural sector, particularly irrigation, is the main consumer, with around 71.7% of the total withdrawal [12]. The use of “non-conventional” water resources can provide a valid alternative to cope with water scarcity issues in agriculture, improving crop productivity and ensuring food security as well as environmental quality [13,14]. “Non-conventional” water resources are receiving increasing attention due to their potential to satisfy needs of different human activities [15,16], alleviating water scarcity in agriculture while contributing to a circular water economy [17].
Several options could be implemented in order to close the gap between water demand and water supply for agricultural use, such as the control and reuse of (i) urban and rural runoff water [18], (ii) desalinated saline/seawater [19,20], (iii) rain water [21], and (iv) effluent from wastewater treatment plants (WWTPs) [2,22]. Treated wastewater reuse for agricultural irrigation is considered the most promising strategy among the mentioned solutions [23]. However, the majority of the treated wastewater is discharged without being reused, implying that most of this precious resource is wasted without being exploited [24]. In addition, treated wastewater is characterized by the presence of micro- and macro-nutrients (mainly nitrogen and phosphorus), which could be reused by farmers in agriculture, reducing their fertilizer needs [25,26], while also avoiding the negative impact they can have on water streams (eutrophication process) [2,27,28]. According to UN-FAO, less than 10% of agricultural irrigated land worldwide uses “non-conventional” water [29]. The use of these resources should thus be increased to meet the growing agricultural water demand in the future [17].
At the European level, approximately one billion cubic meters of treated wastewater is reused annually, which accounts for about 2.4% of the WWTP discharges and less than 0.5% of annual freshwater withdrawals. The European countries that are most affected by water scarcity belong to the Mediterranean region, namely Italy, Spain and Greece. In these countries, the rate of the treated wastewater reuse is very low, between 5% and 12% [30,31]. Freshwater availability in the Mediterranean region is likely to experience substantial decrease of 2–15% in the case that global temperature increase reaches 2 °C [32]. Currently, between 50% and 90% of the total water demand in the Mediterranean basin is dedicated to irrigation, and this demand is projected to rise by 18% until the end of the century [30,33]. For this reason, treated wastewater reuse is especially practiced in those areas facing severe water shortages, such as Egypt [34], Jordan [35], Tunisia [36], Turkey [37] and Saudi Arabia [38].
To address this issue and meet future agricultural water demands, it is necessary to investigate the potential of treated wastewater reuse. Different attempts have been made by researchers or competent authorities in order to define the exact amount of treated wastewater that is actually exploitable for this purpose [39]. Although it is well established that high treated wastewater volumes are available, in most cases there is a lack of data on the real quantities that are discharged from wastewater facilities. Moreover, it is also important to consider the geographical distance between WWTPs and agricultural fields, because it could be the deciding factor for implementing this practice. A useful tool for these analyses could be geographical information systems (GISs), because this tool has been intensively used and integrated into almost every discipline to solve complex problems [40,41,42,43,44,45,46,47] and it represents a powerful solution to real-world problems [48,49].
This research aimed to evaluate the exact amount of available treated wastewater that could be reused for irrigation purposes. The assessment was carried out for the Forlì-Cesena province within the Emilia-Romagna region (Italy), with the aim of providing a starting point for further studies that could be performed on a national or international scale. With this purpose, the analysis was performed with the use of GIS.

2. Materials and Methods
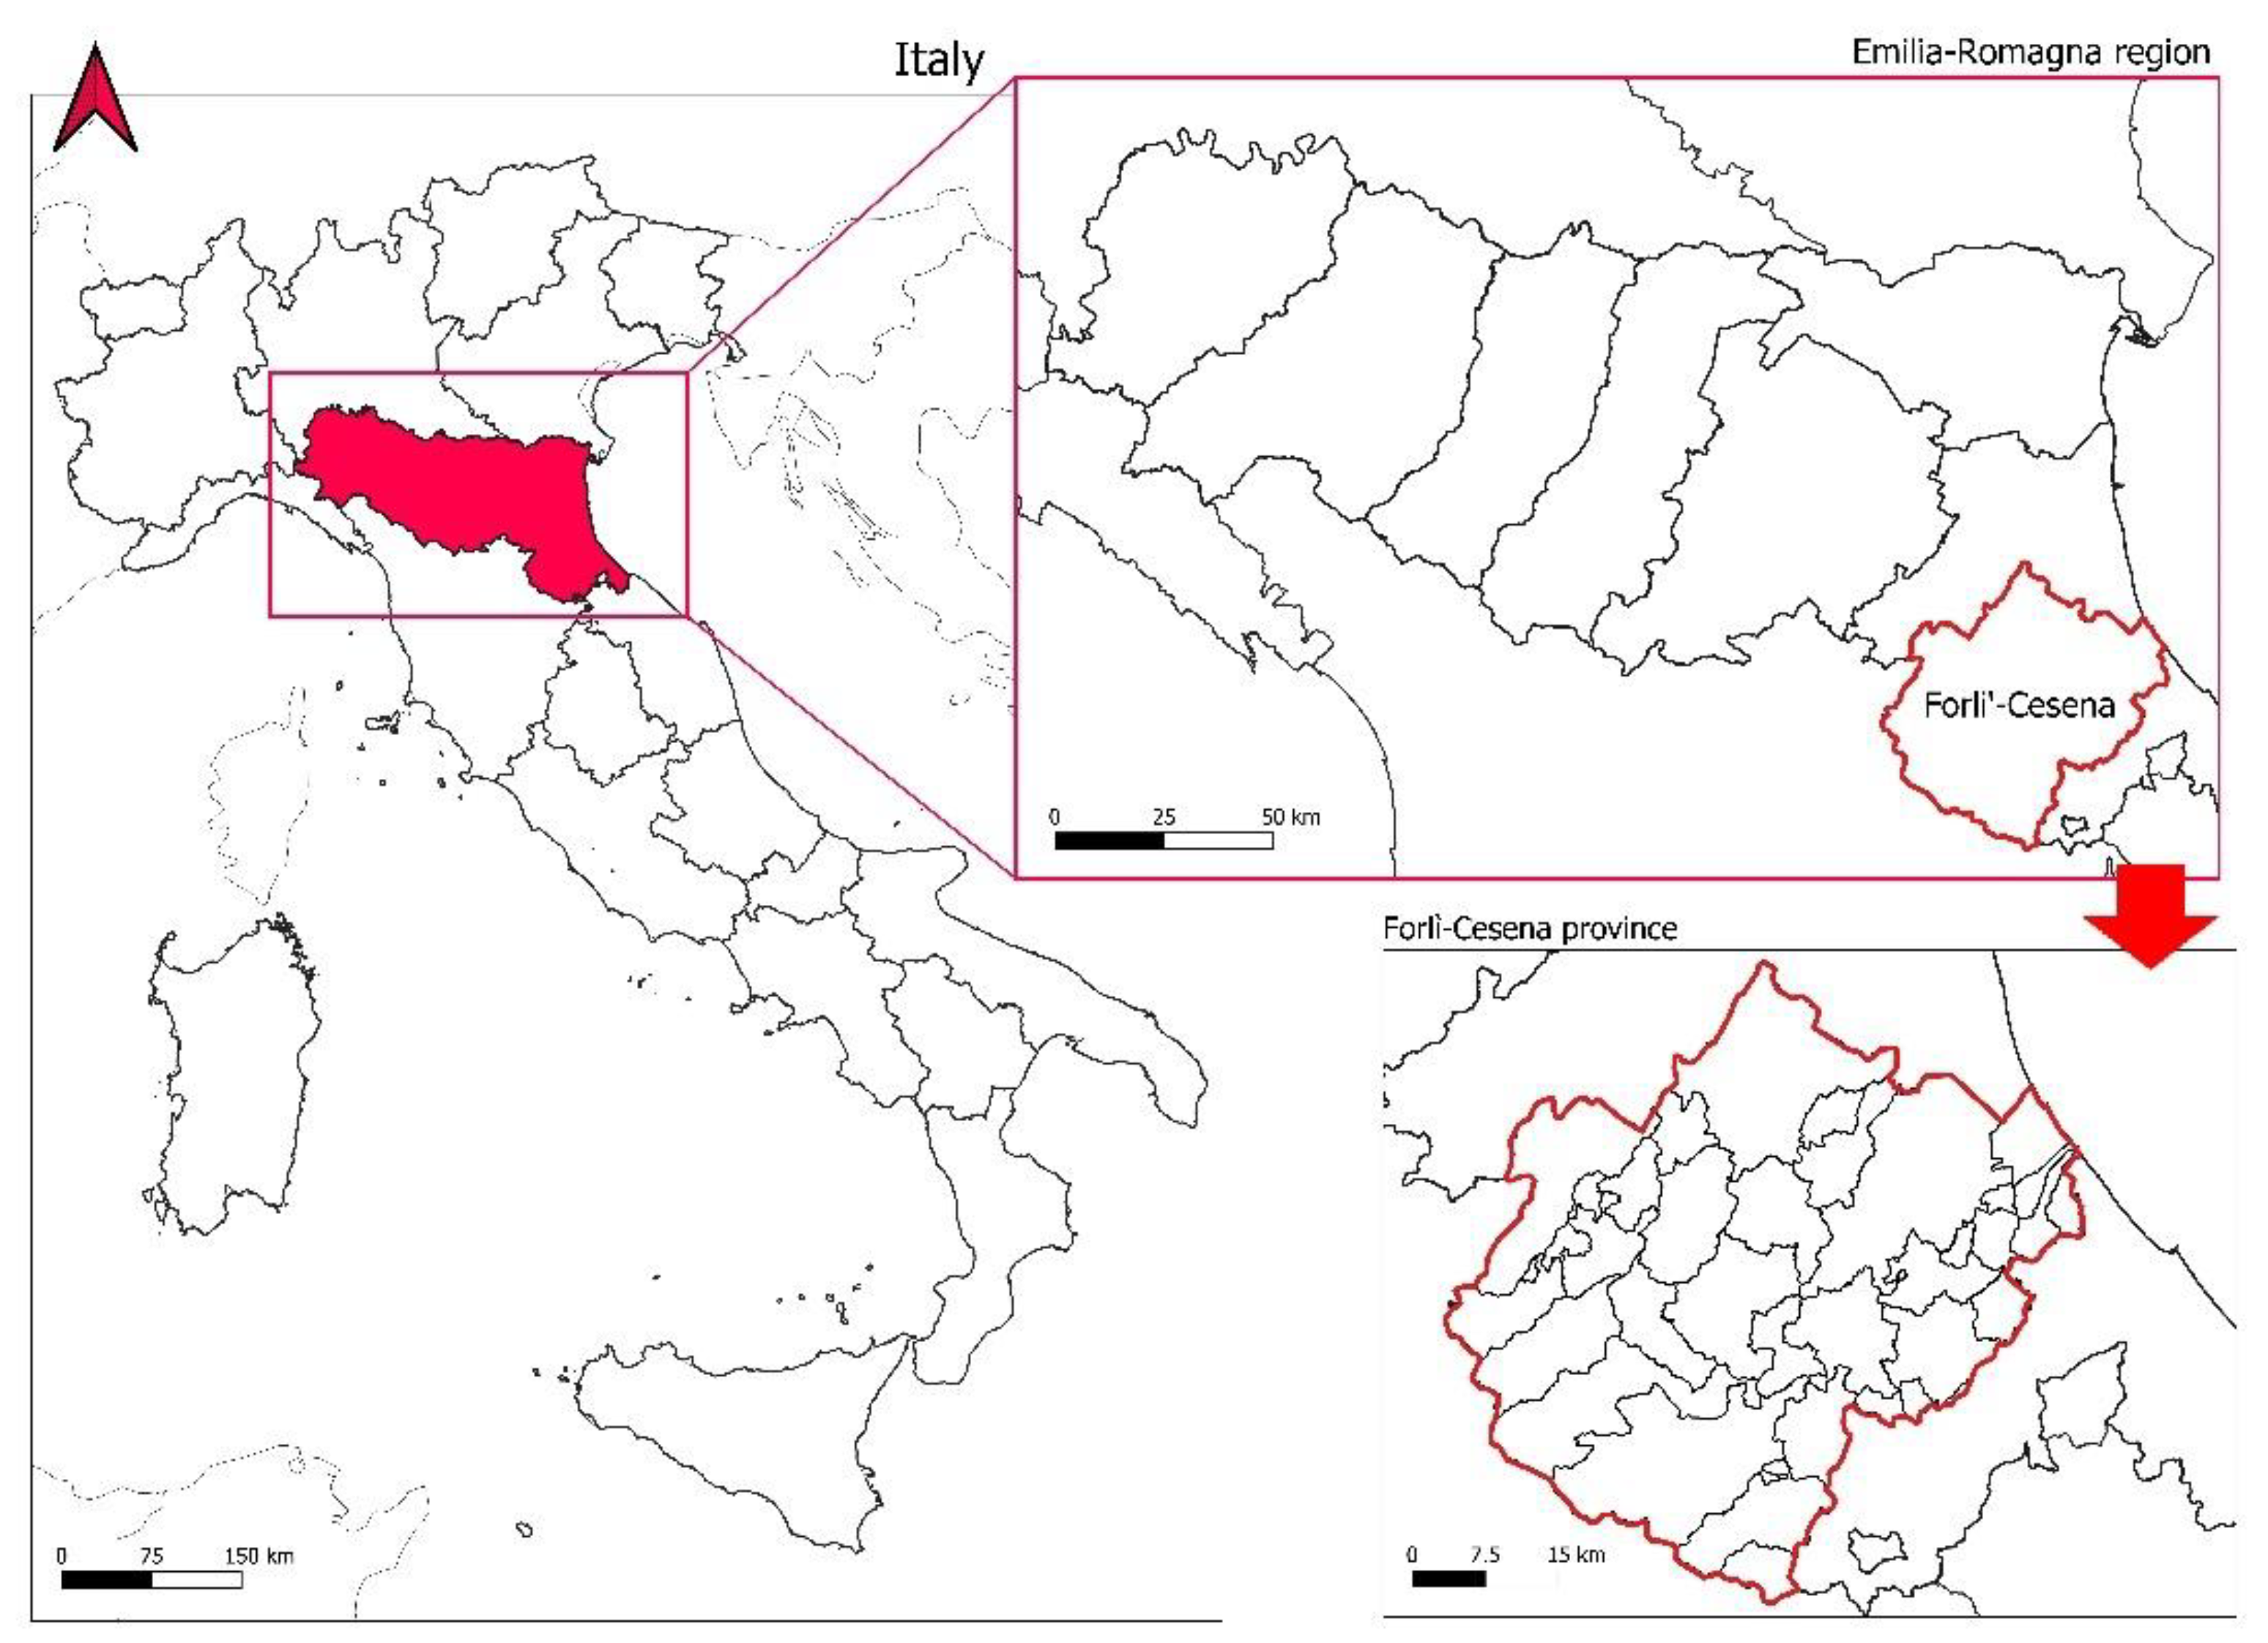
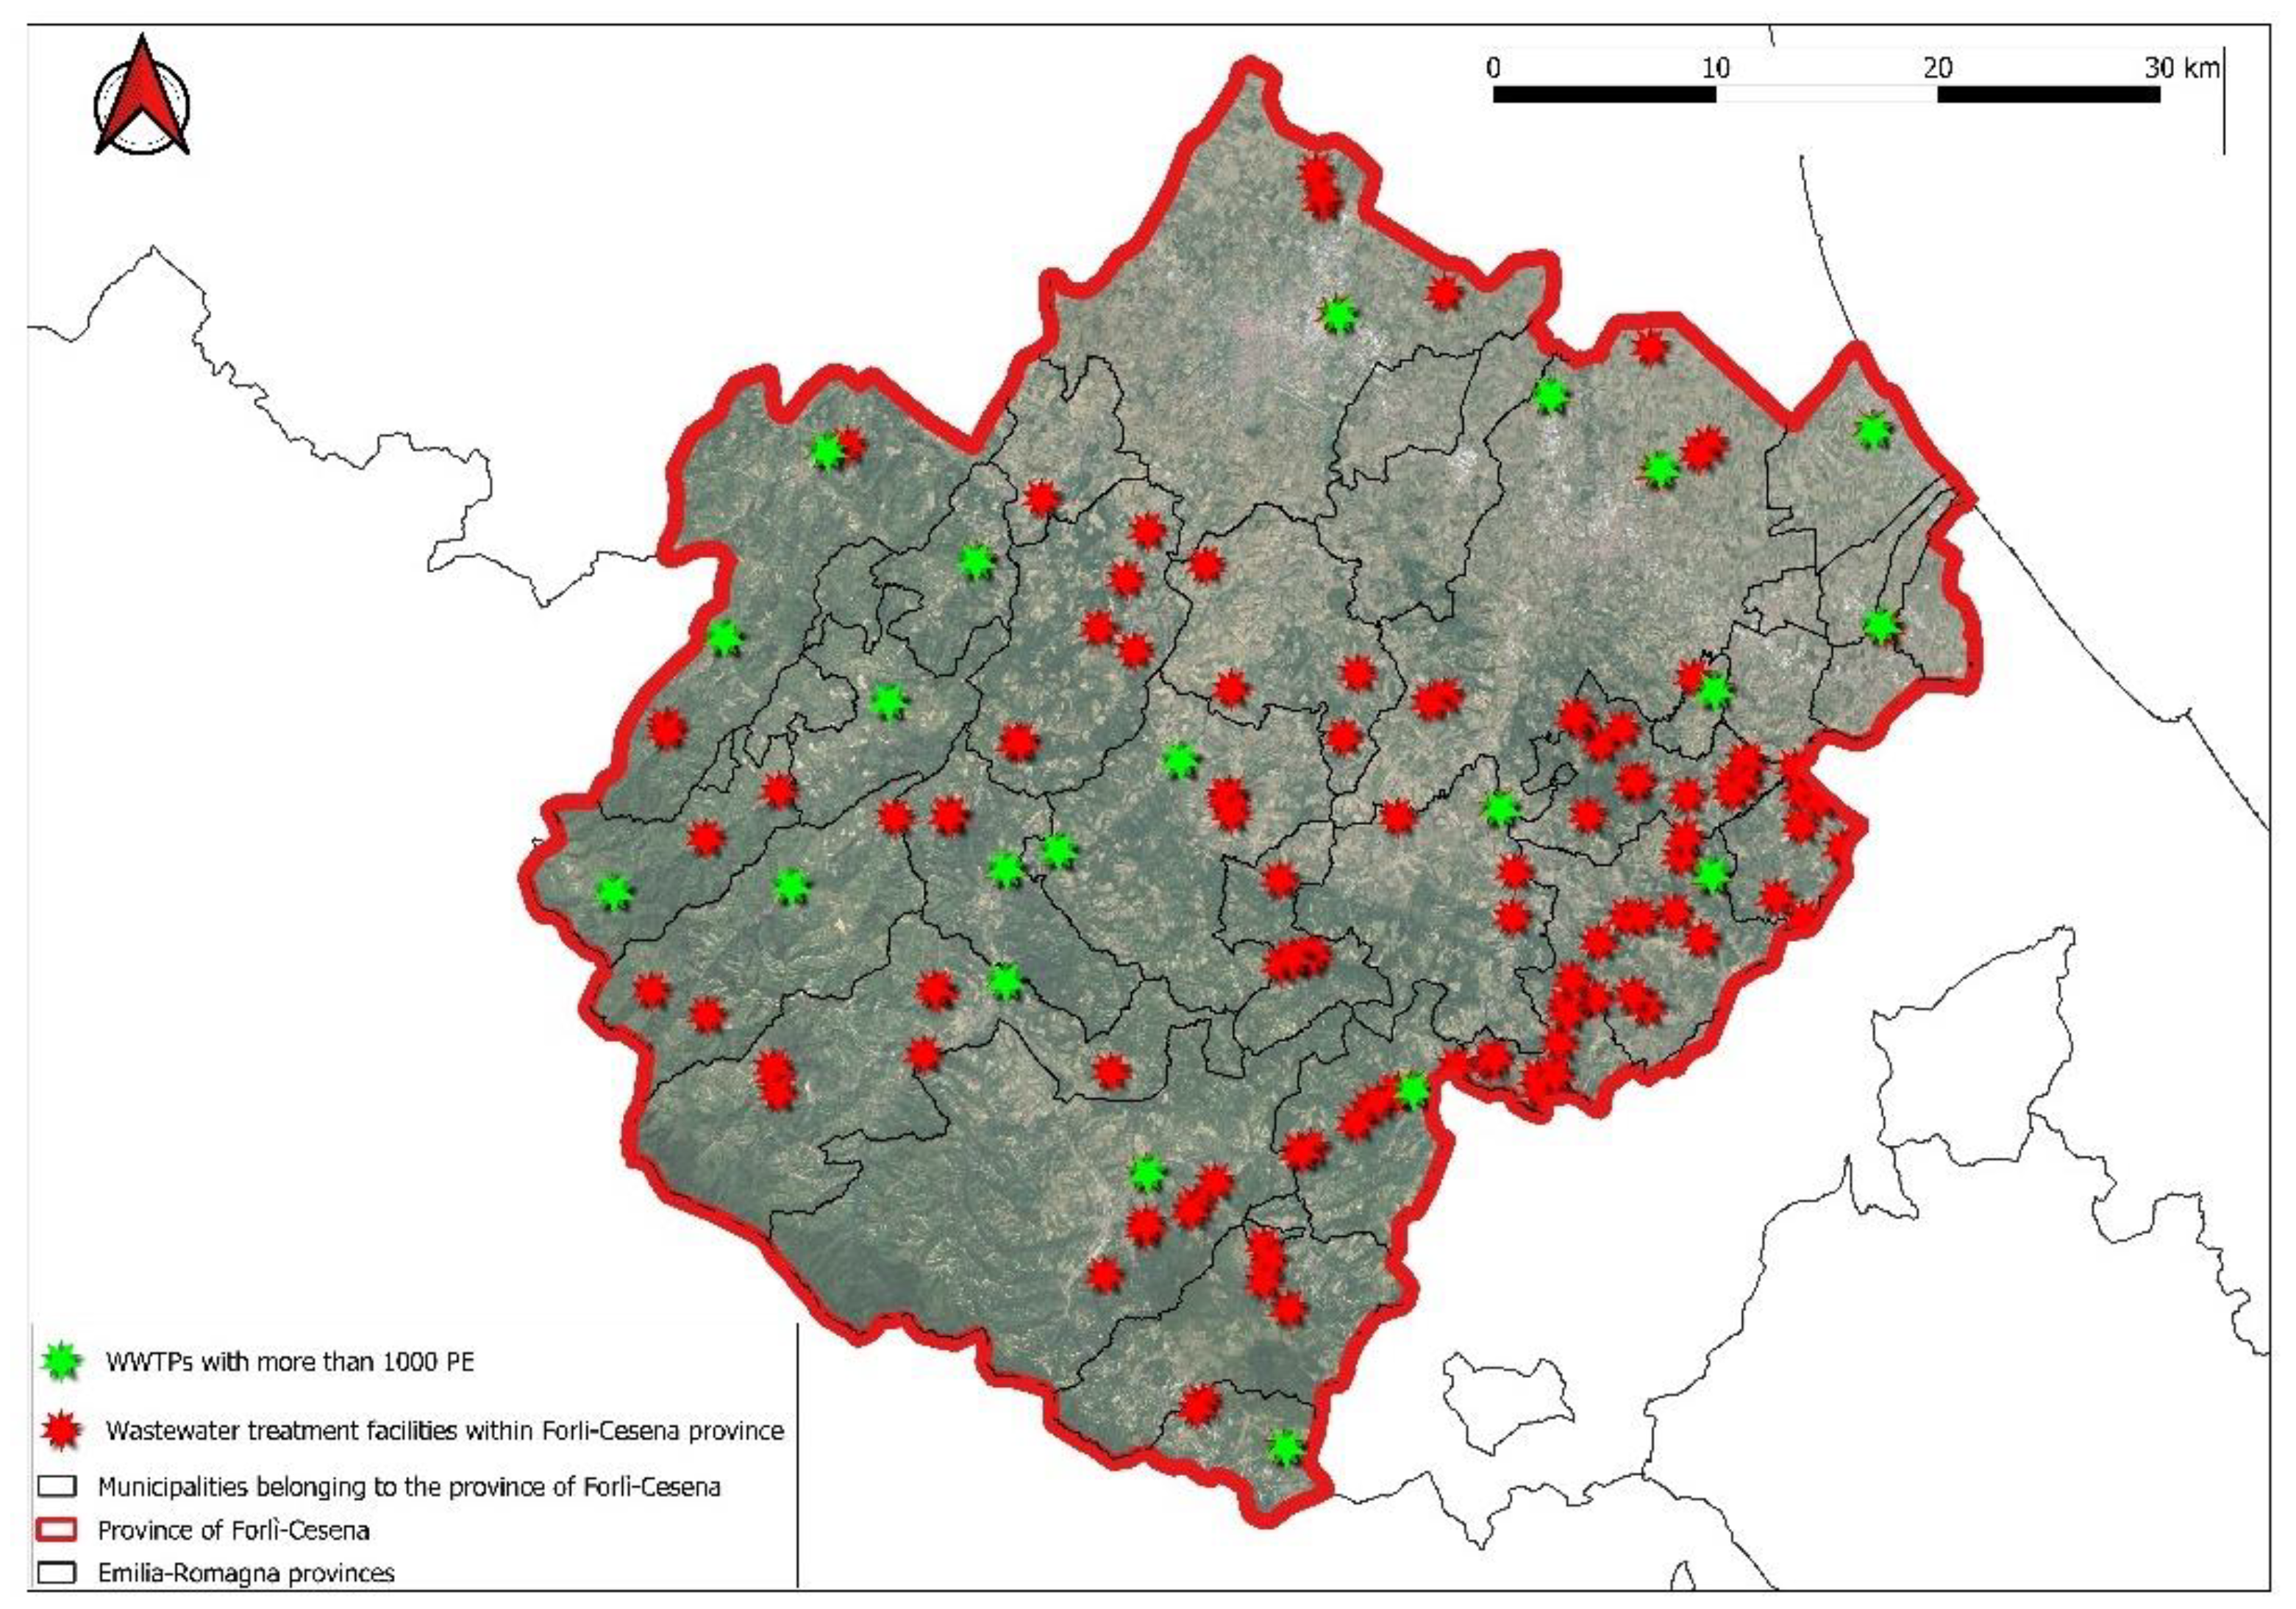
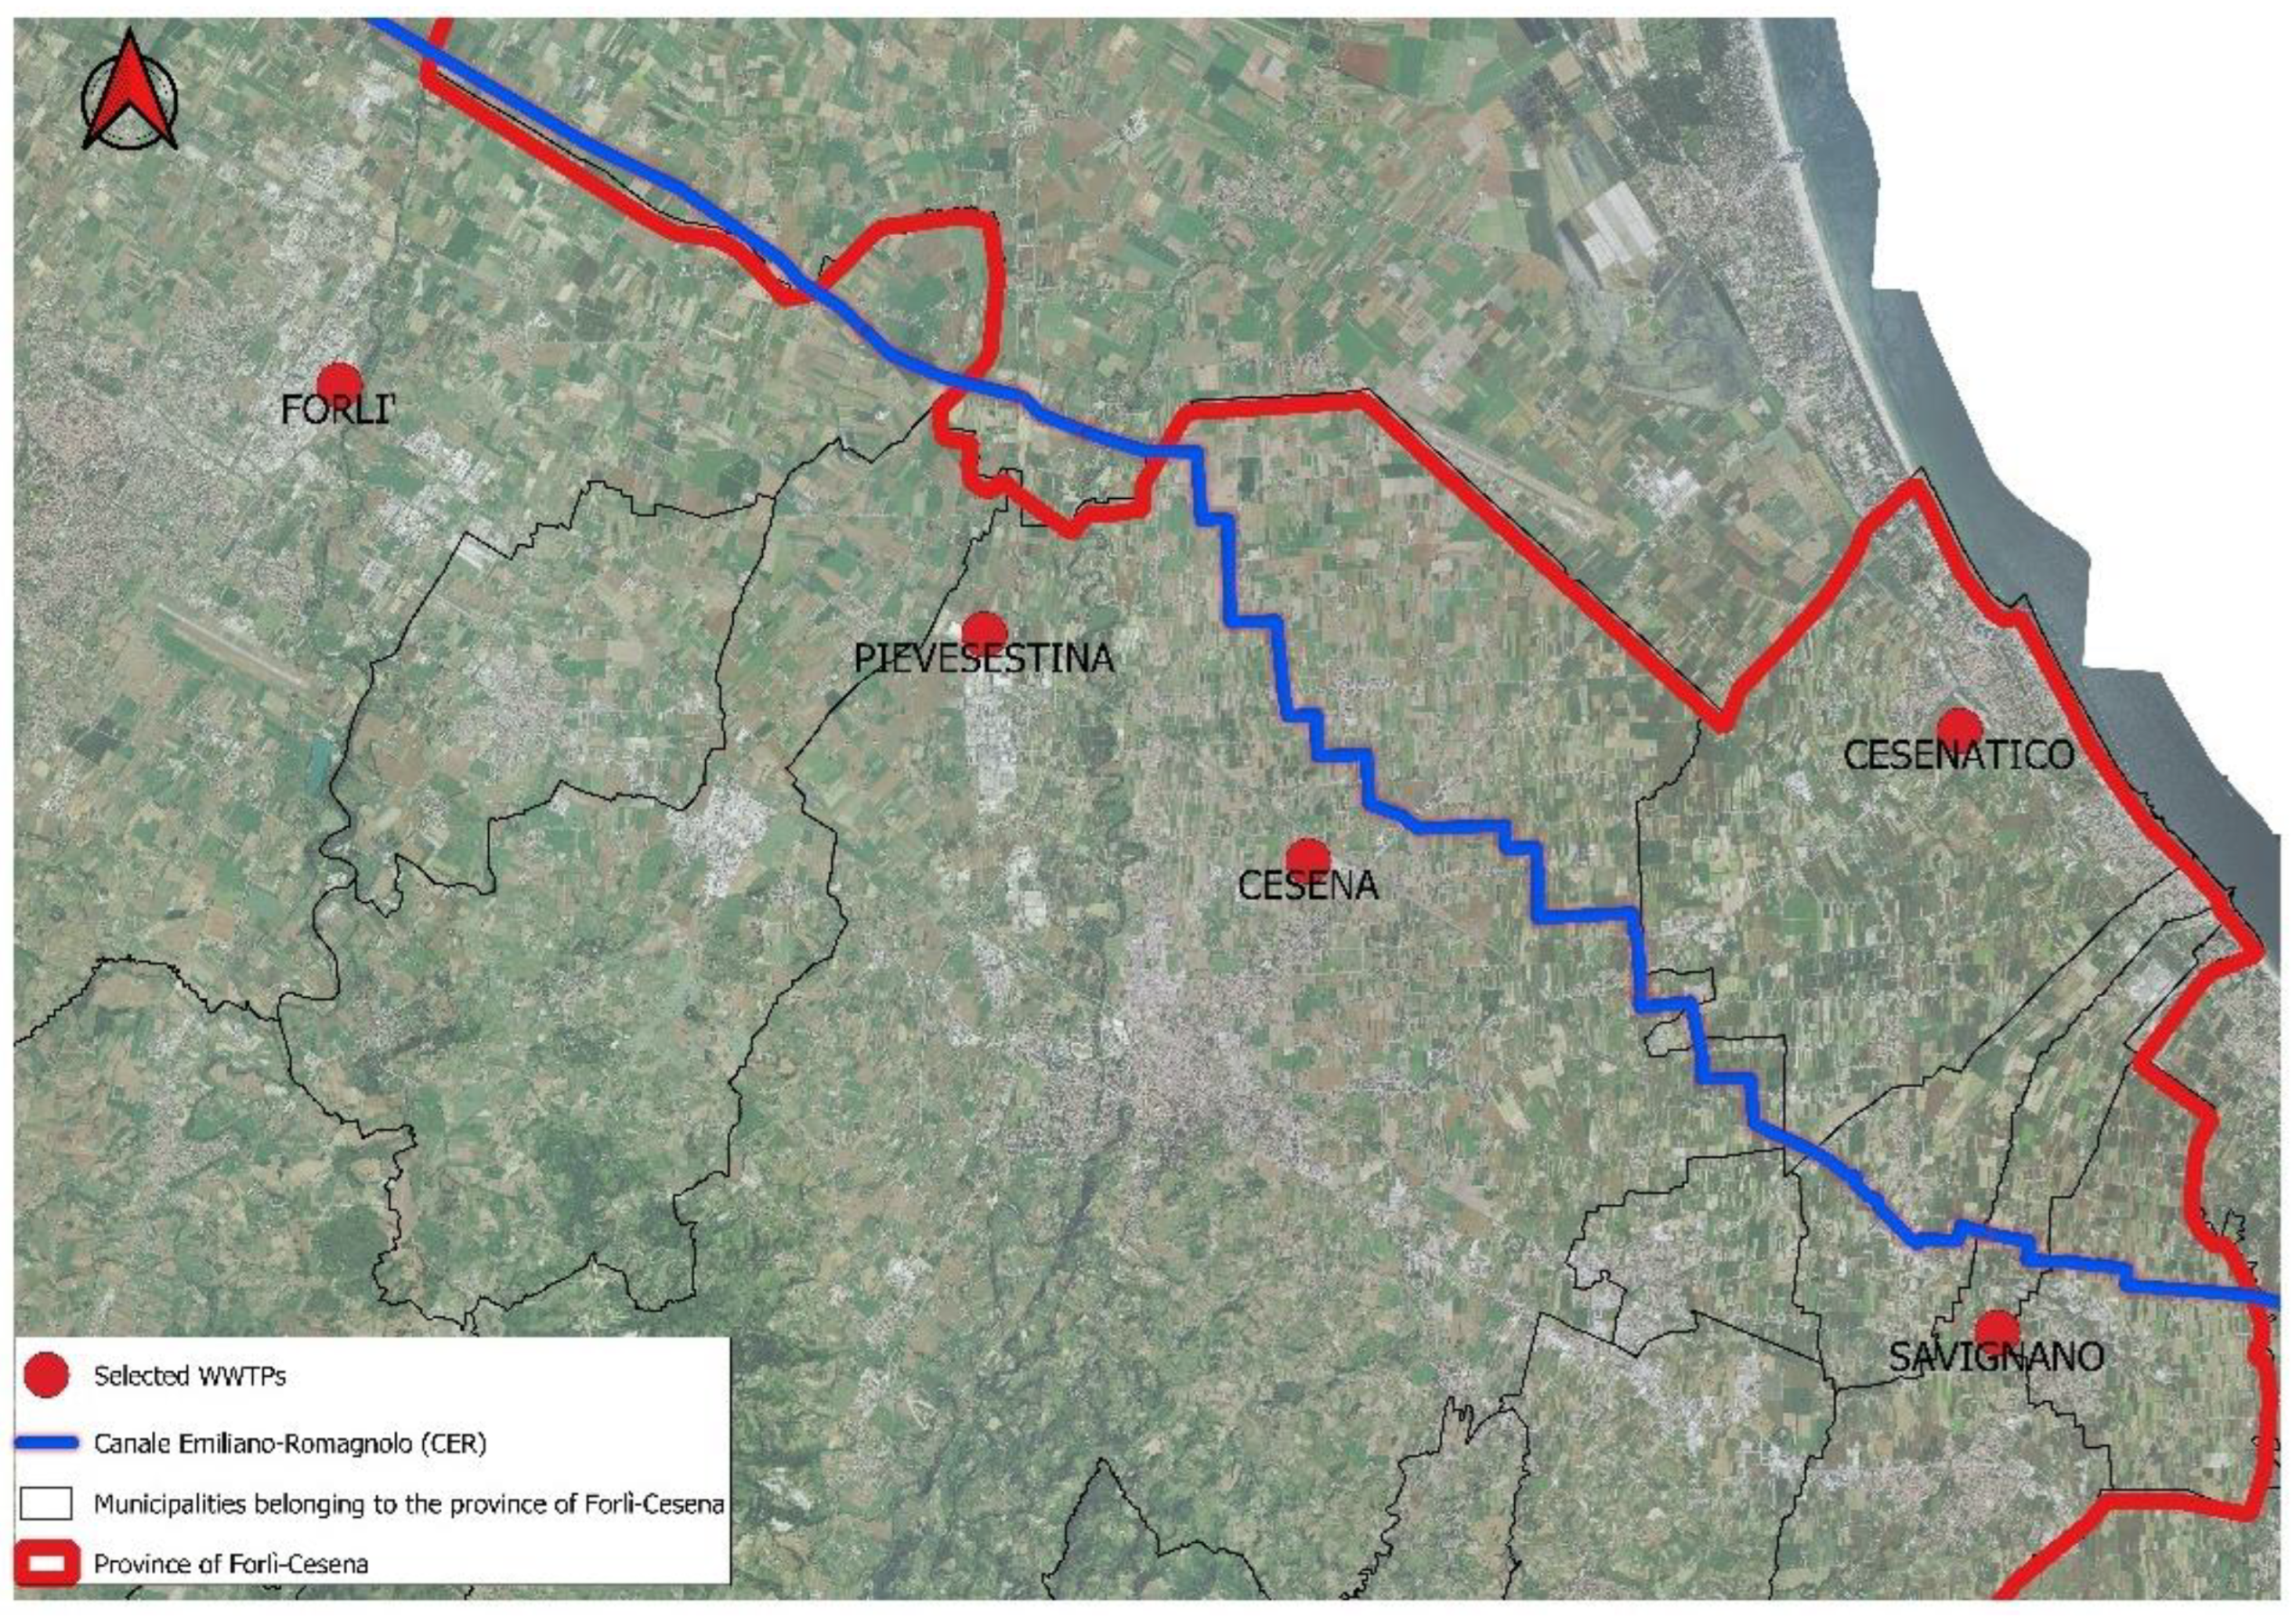
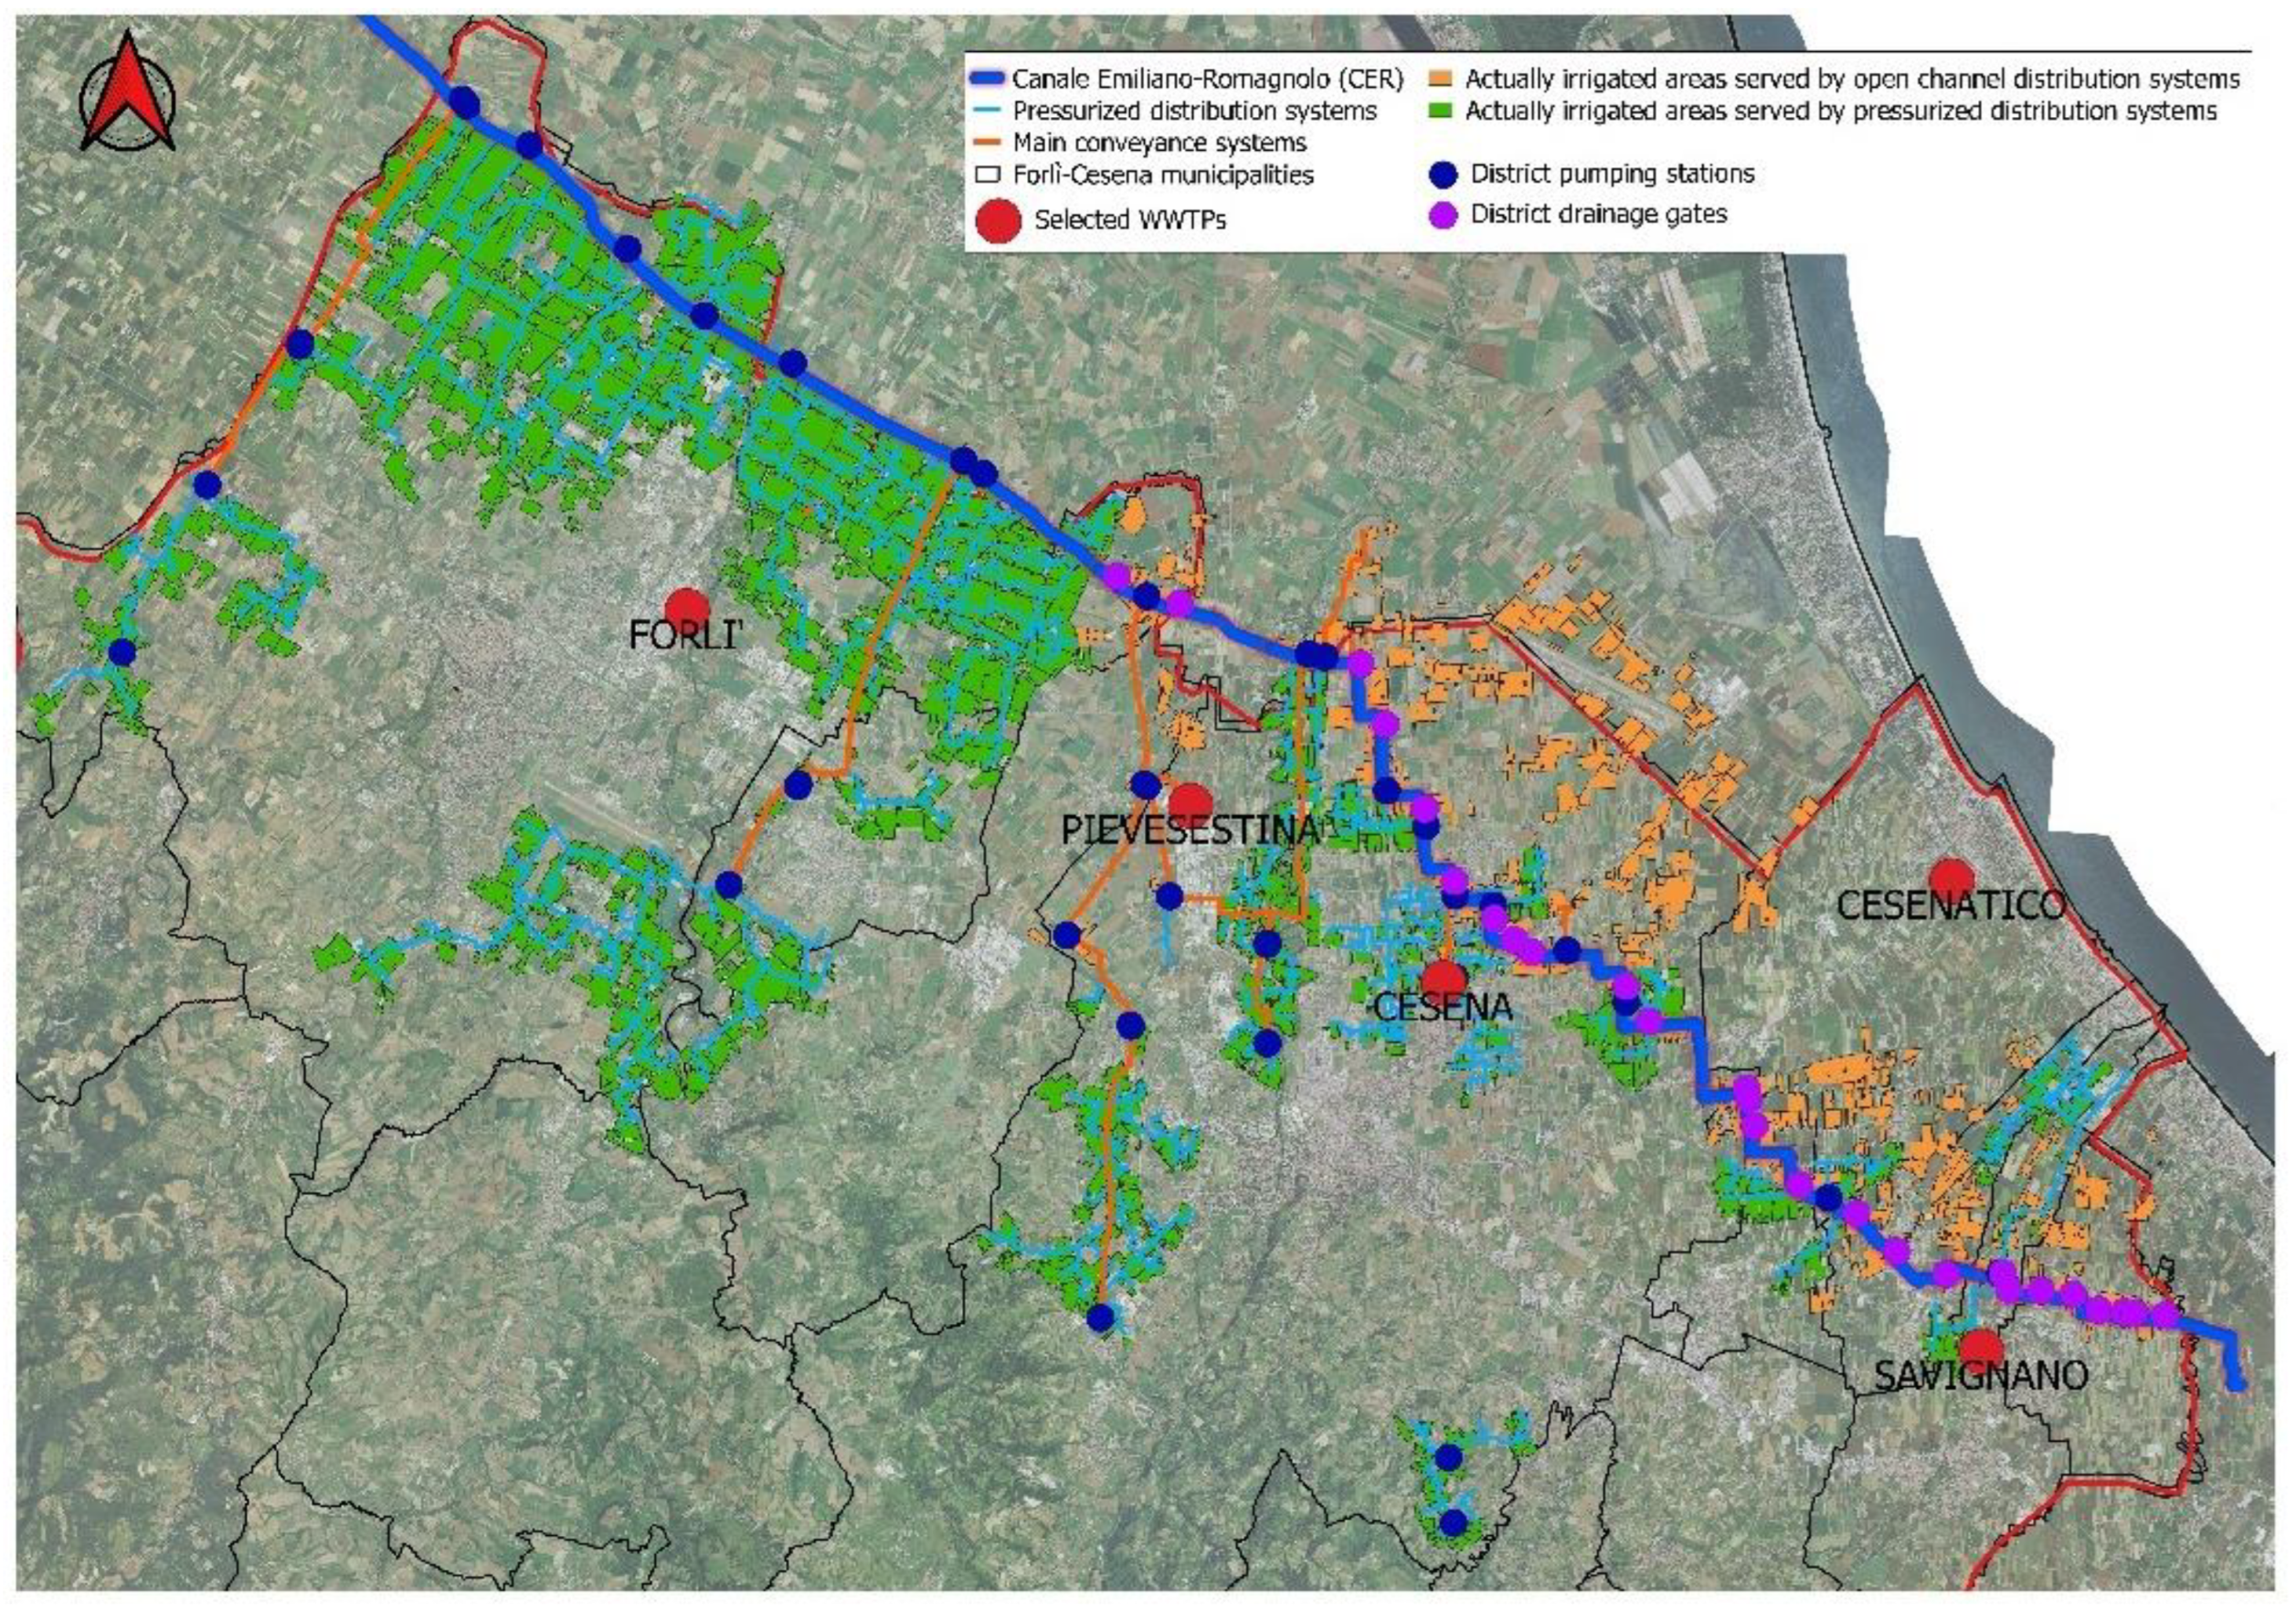
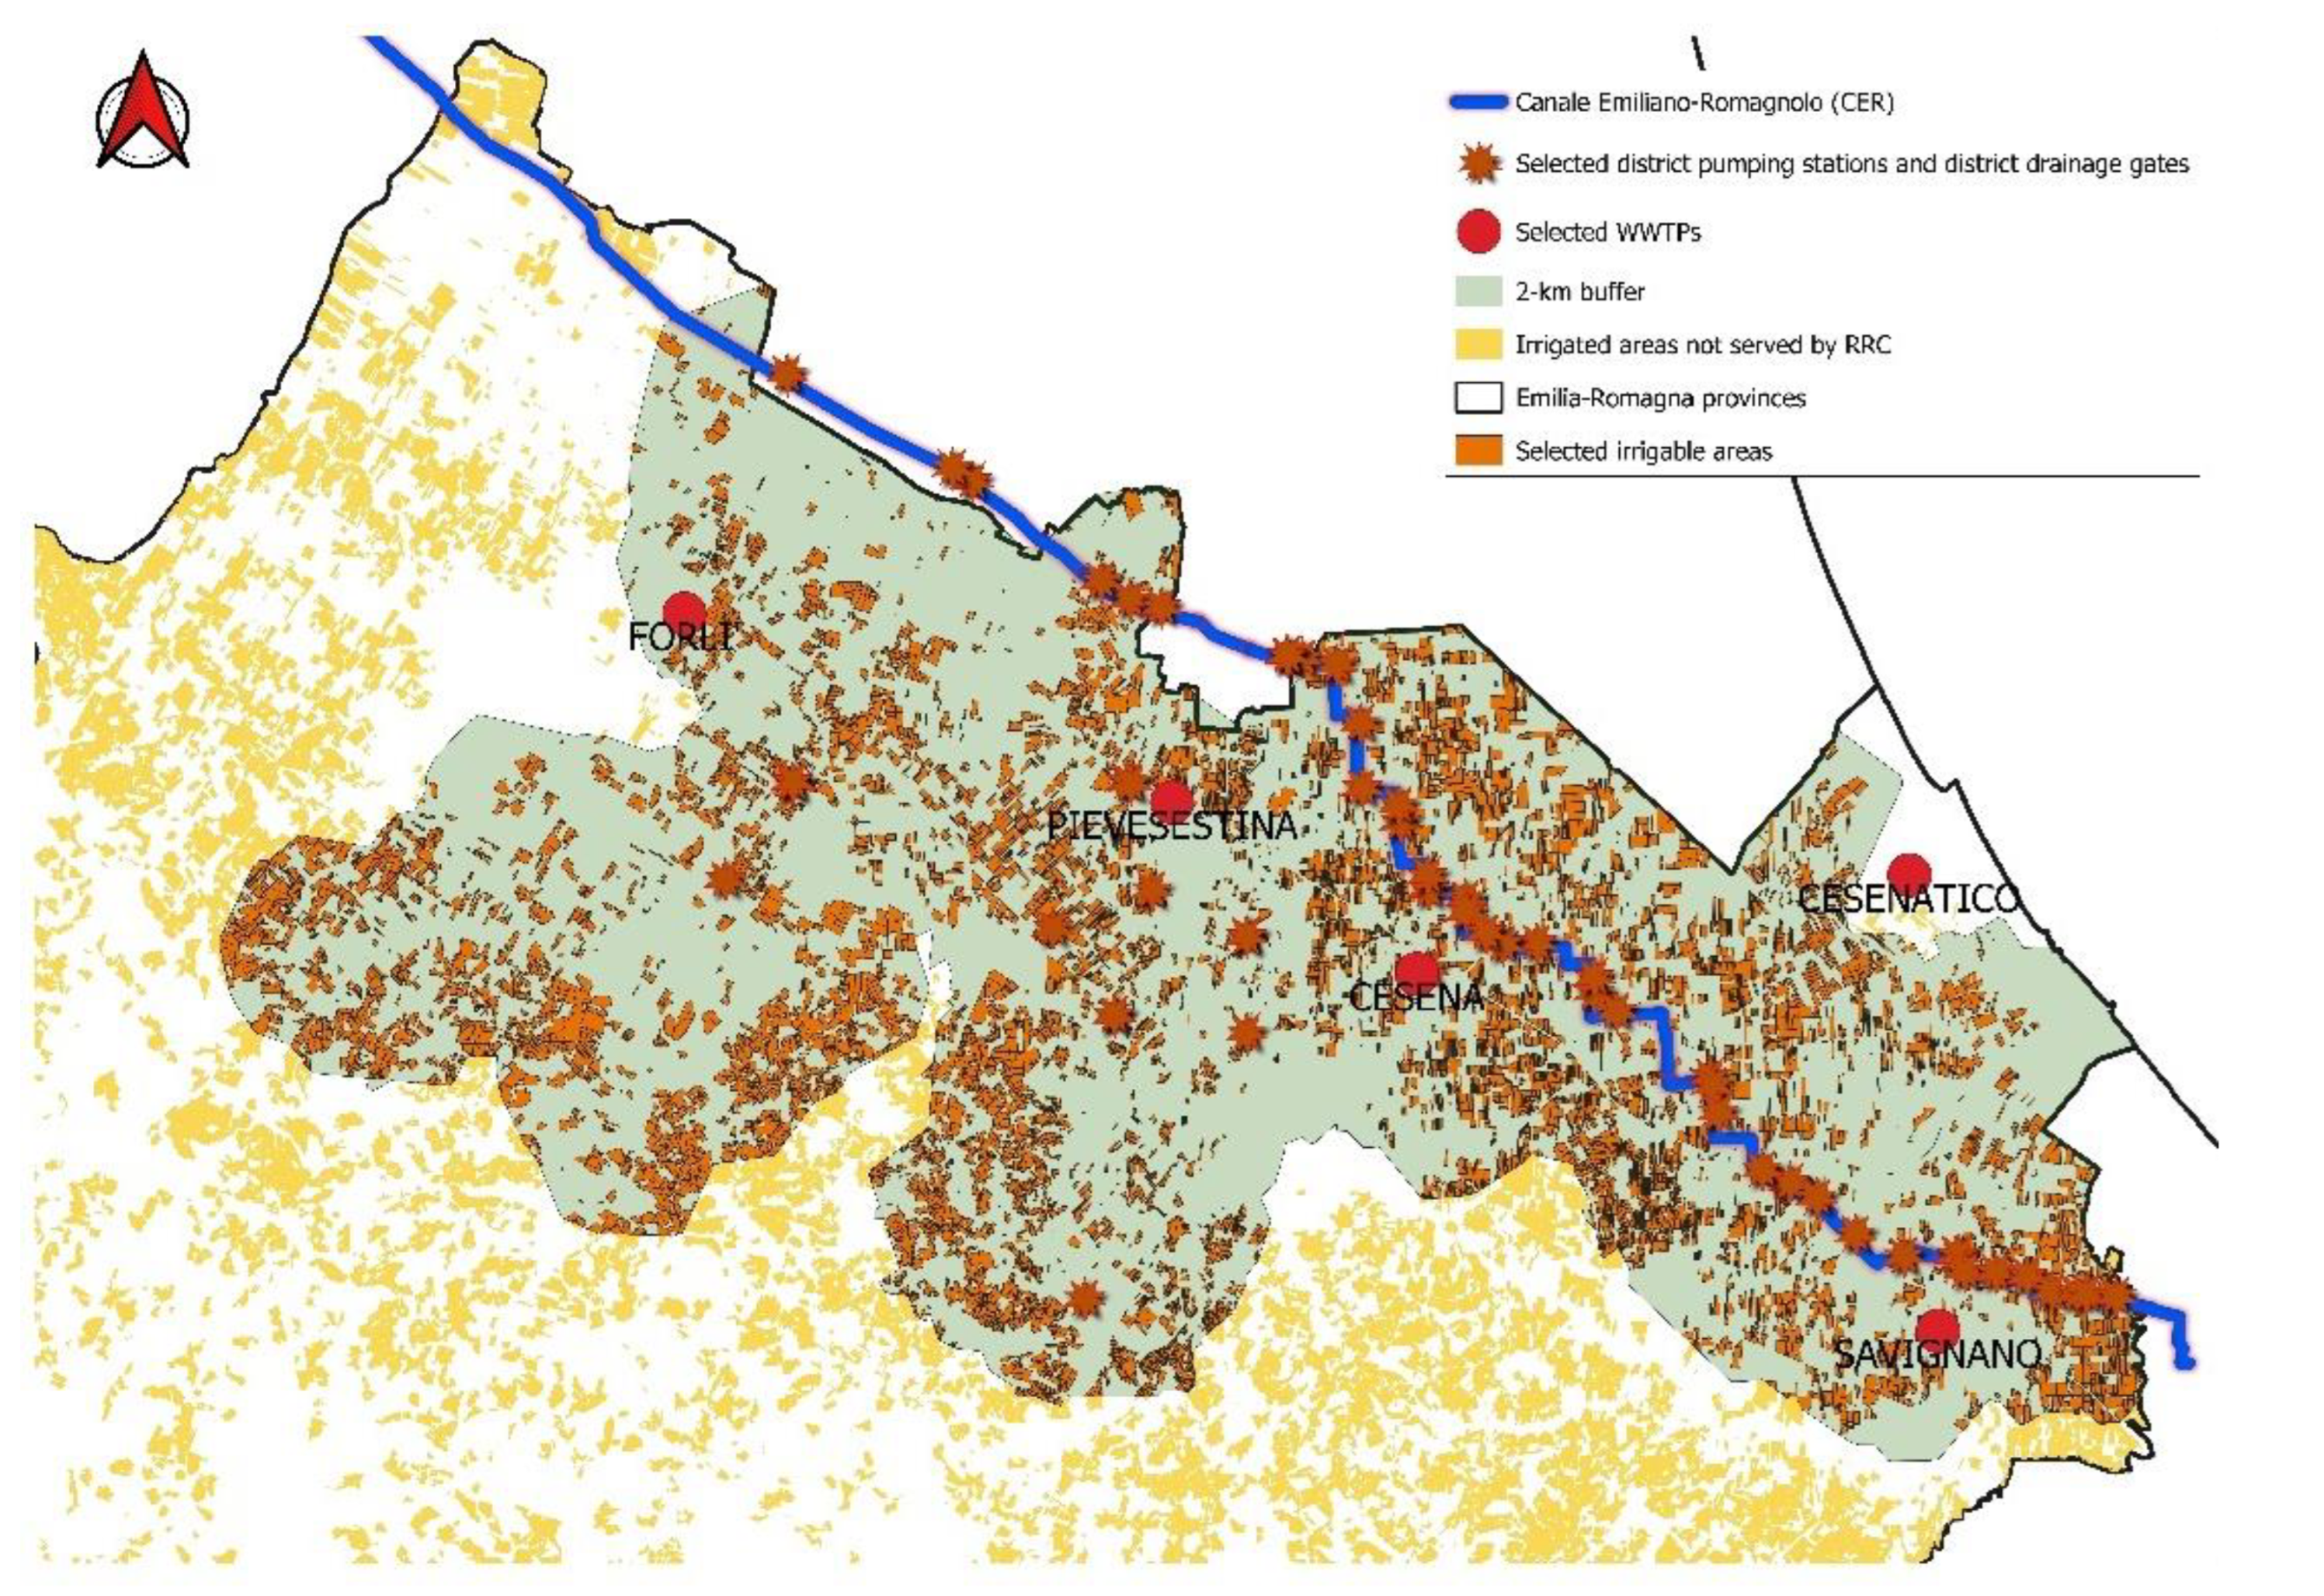
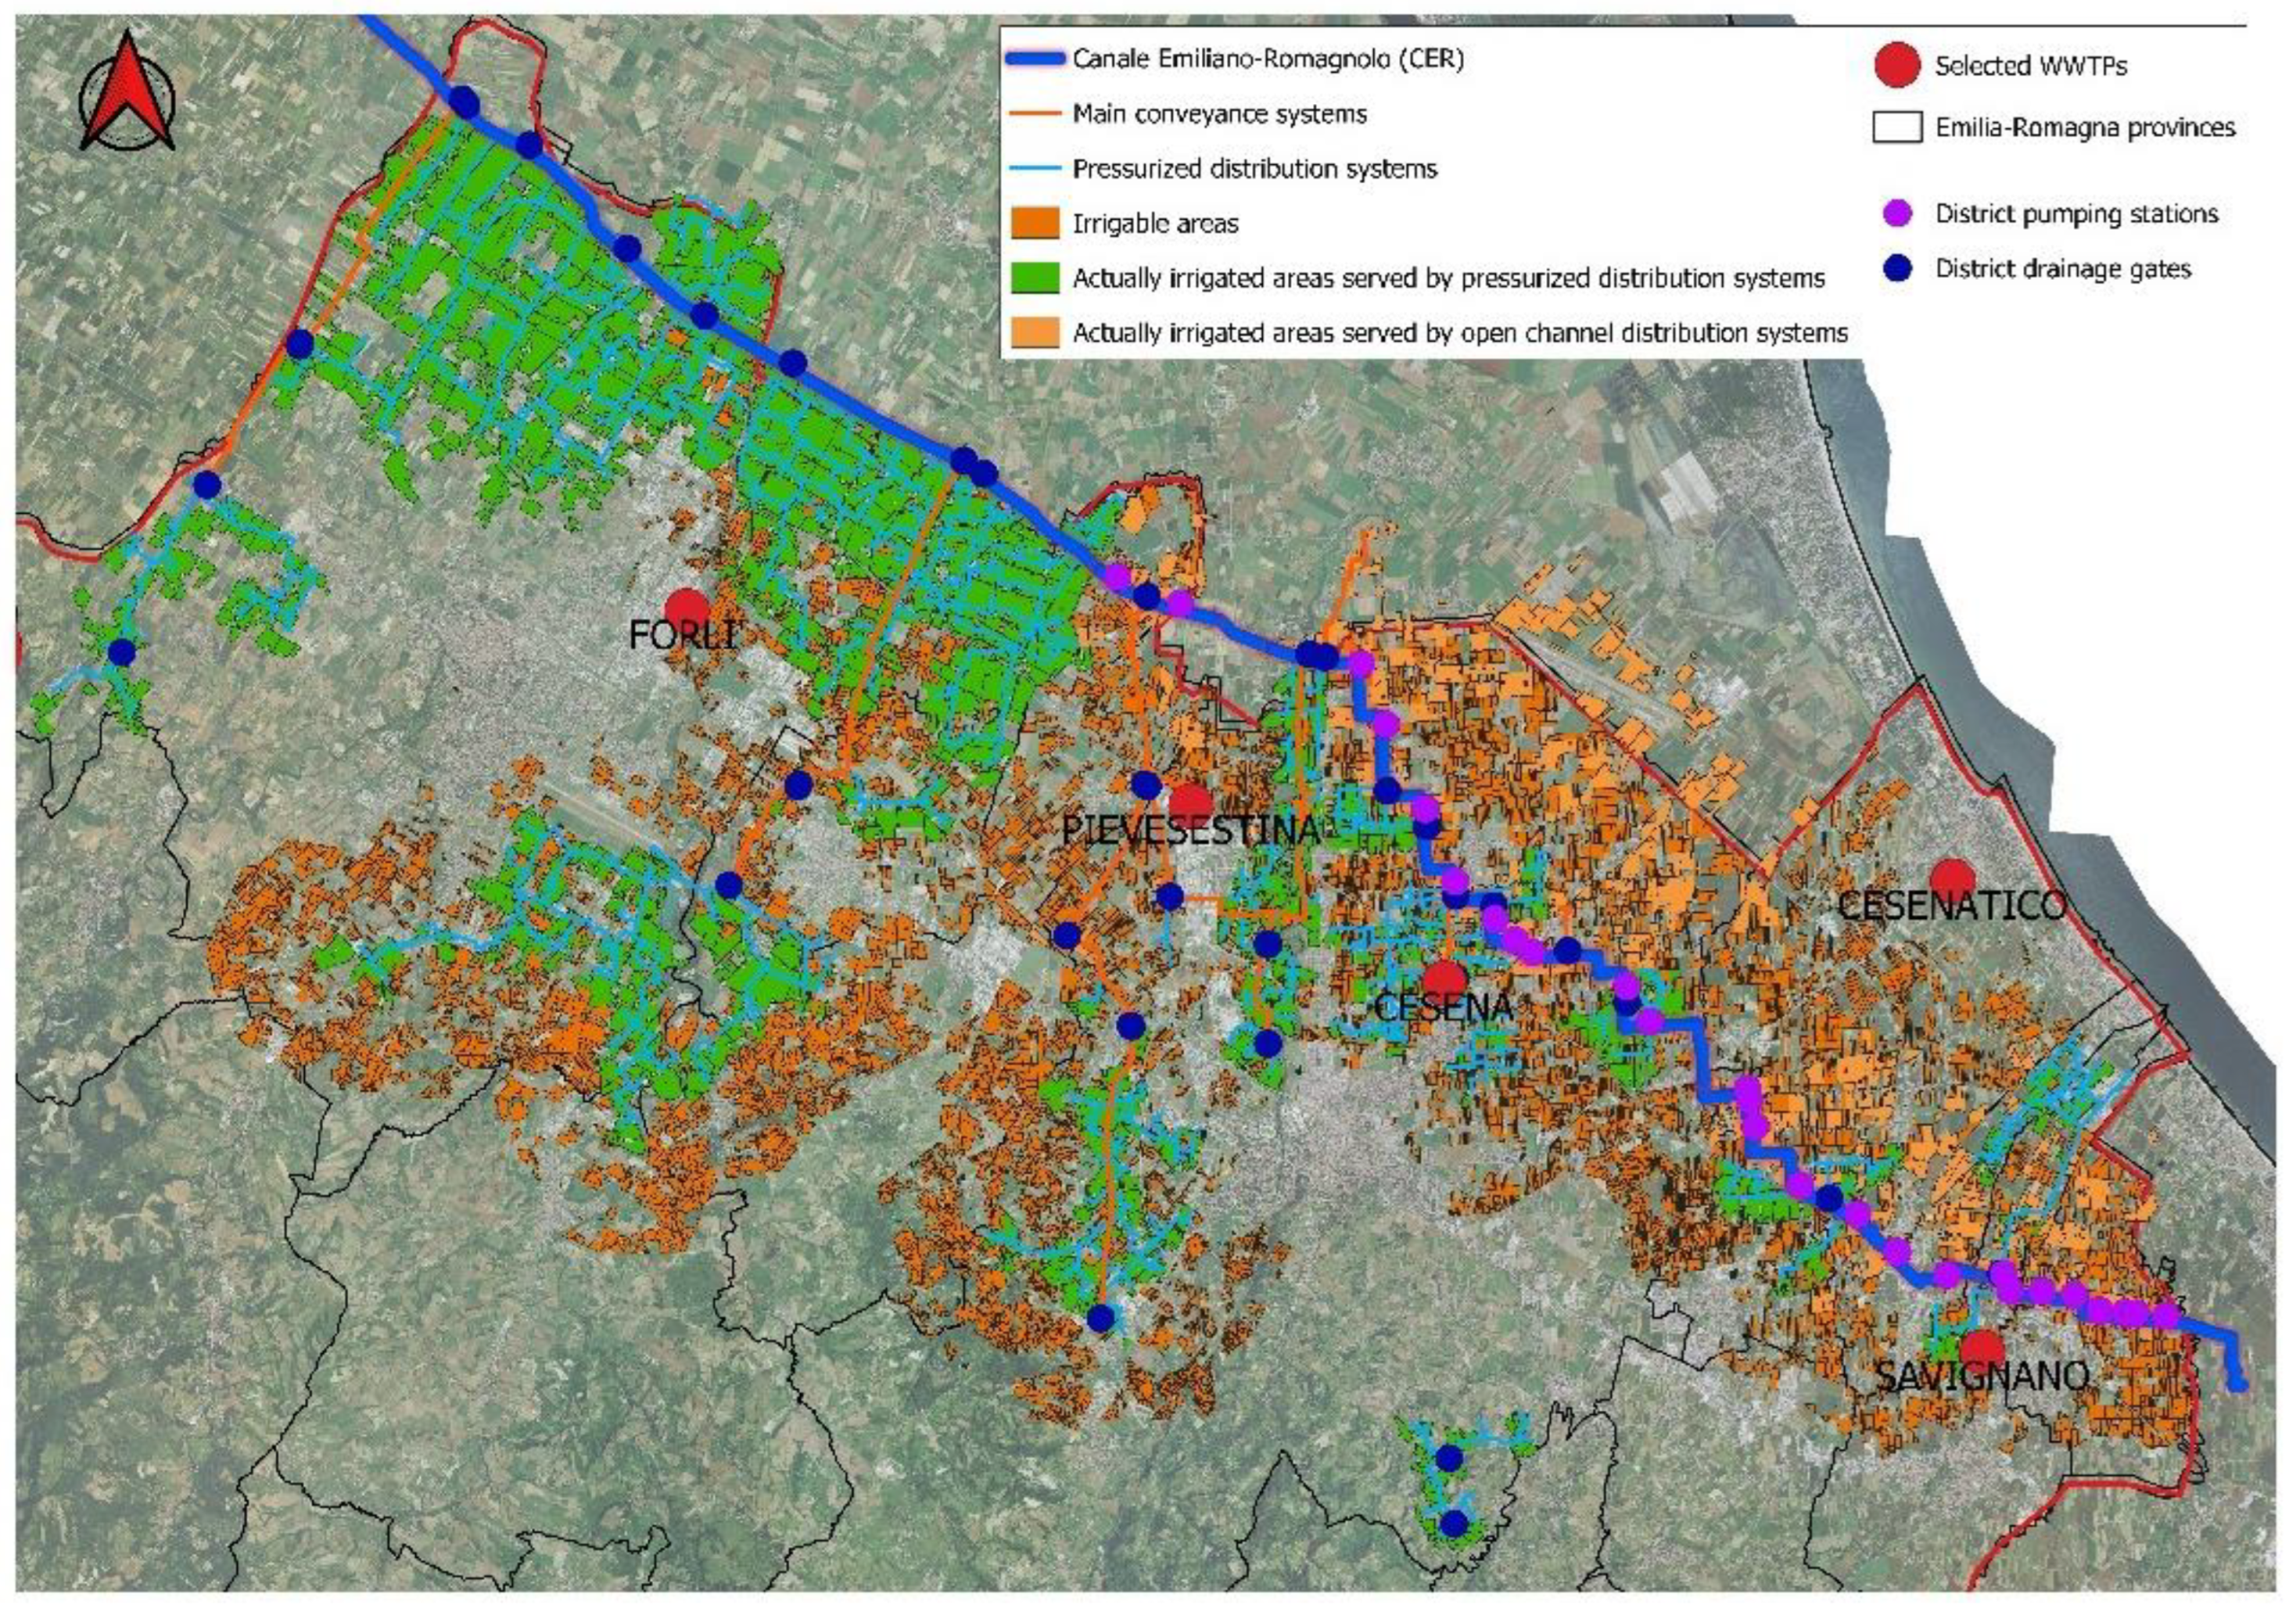
2.1. Case Study

The analyses on the potential for treated wastewater reuse in agricultural irrigation were focused on the Forlì-Cesena province (Figure 1), which is located in the eastern part of the Emilia-Romagna region (Italy).
Within the selected area, the main urban centers are Forlì and Cesena; however, the province also includes some important tourist centers of the Romagna Riviera, e.g., Cesenatico municipality. The geomorphological diversity of this area is an element of great impact for carrying out this work.
In this province, agricultural irrigation generally reflects the typical characteristics of the Emilia-Romagna region, which is famous not only for orchards and vineyards, but also for vegetables and corn production. For example, peach and nectarine fruits from the area are protected by the Romagna IGP quality mark.
The coordination of public and private interventions for soil defense, water management, irrigation and environmental protection within the Forlì-Cesena province is entrusted to the Romagna Reclamation Consortium (RRC).
At the time of this study (2021), the RRC managed a total area of 352,456 ha, more than 500 km of open canals (which were used as drainage systems for rainwater or agricultural runoff, as well as to convey water for agricultural irrigation purposes) and about 800 km of pressurized distribution systems. The main source of water in the area is the river Po, which reaches the final users through the irrigation canal, the “Canale Emiliano Romagnolo” (CER). The CER is 135 km long, is one of the most important hydraulic infrastructures in the Emilia-Romagna region and is the longest artificial canal in Italy.

2.2. Data Analysis

In order to investigate the potential for treated wastewater reuse in agricultural irrigation, data were collected and elaborated at the provincial level. This was done considering the geographical distribution of all the municipal WWTPs (Figure 2) as well as all the areas equipped for irrigation, the actually irrigated and the irrigable areas located within the Forlì-Cesena province. WWTP data were provided by the WWTP operator (Gruppo Hera S.p.A., Bologna, Italy), while RRC provided information on the agricultural areas as well as on the water distribution network intended for agricultural irrigation.
As mentioned above, the RRC is responsible for the water management of the water distribution network for the entire Forlì-Cesena province. The majority of the water within the water distribution network managed by the RRC comes from CER through water intake and pumping systems. However, not all the farms located in the province belong to the RCC water distribution network. There are several reasons behind this: farmers own wells and do not need service from the RRC in terms of water supply, no crops are cultivated in their land plots, farms are not served by the RRC water network; etc.
The RRC uses an innovative irrigation control system (IrriNet) that allows quantification of crop water needs depending on crop typology. Furthermore, knowing the crop water needs and the surface occupied by different crops, the RRC is able to obtain the total amount of water required by crops during the irrigation season (generally from the beginning of March and up to the end of October). For the Forlì-Cesena province, crop irrigation is done by pressurized and open channel distribution systems, both managed by the RRC.
The GIS analyses were based on data collected from 2017 to 2019. The selected time interval was characterized by a high variability of weather conditions, which in turn influenced crop water needs. Being a particularly dry year, the average rainfall during the 2017 irrigation season was lower than during the 2018 and 2019 irrigation seasons. This difference influenced crop water needs, which were significantly higher in 2017 than in 2018 and 2019.
For this study, the mentioned data on irrigated areas and crop water needs were provided by the RRC.
Based on these data for the selected case study, it was possible to estimate an area equipped for irrigation equal to 12,366.27 ha, even if only a portion of it was actually irrigated—as better discussed below. This information was integrated with the exact locations of the equipped areas for irrigation and the crop water needs.
Table 1 gives an example of the year 2019 for different available data (the cultivated areas, the crop water needs and the delivered volume for crop typology).
As reported in Table 1 for the 2019 irrigation season, the most common crops were grapevines, peaches, summer horticulture, apricots, maize, green beans and actinidia. Walnut water needs were the highest (4418.6 m3 ha−1), followed by cut flowers (3775.2 m3 ha−1), actinidia (3440.0 m3 ha−1) and apple trees (3067.3 m3 ha−1).
On the other hand, actinidia was the crop with the highest percentage (16.34%) of delivered volume with respect to total introduced volume in the water distribution system by the RRC, although the cultivated actinidia area was 2.6 times lower that of grapevines, which occupied the biggest area. Actinidia was followed by green beans and summer vegetables, and high percentages were also detected for grapevines and peaches. The contributions related to all the other crops was definitely lower.
Table 2 shows the total amount of users served by the RRC, the actually irrigated areas, the volumes introduced into the distribution system (pressurized and open channel), the volumes delivered to each user and the theoretical crop water need calculated by the Irrinet system.
The data in Table 2 were grouped according to the water supply system type (e.g., pressurized and open channel distribution systems). During the 3 years (2017–2019), the number of users served by the RRC was constant (2349 and 521, as averaged values for pressurized and open channel distribution systems, respectively).
The actually irrigated areas served by the pressurized distribution systems were higher (4742.80 ha) than those served by open canal distribution systems (1438.08 ha). On average, the total actually irrigated area (6180.88 ha) was lower than the area equipped for irrigation (12,366.27 ha), indicating that about 50% of the areas served by the RRC distribution network were not irrigated by it.
The water volumes that were delivered to the irrigated areas changed significantly within the three-year period. In particular, in 2017, these volumes were around 25% higher than the three-year average value, despite the fact that the irrigated area did not vary considerably in the same period. The reason lies in the fact that 2017, if compared to 2018 and 2019, was characterized by a lower rainfall intensity and, therefore, crop water needs were higher.
The last column of Table 2 reports the theoretical crop water needs estimated by the Irrinet system. The RRC water distribution network is equipped for quantification of the exact water volumes delivered to the actually irrigated areas. For the pressurized water distribution network, the RRC considers water losses to be negligible and, therefore, considers the delivered water volume to be the same as the one introduced into the network. On the contrary, for the open canal network, water losses are considerable, mainly due to water evaporation and water infiltration. In this case, the water volume delivered to users was estimated by the Irrinet system considering the crop water needs (the average value equals 2,226,730 m3). As expected, the volume introduced into the open canal network was 6.5 times higher than the theoretical crop water needs, mainly due to the overall water losses, with the open canal network efficiency being about 16%. However, part of the infiltrated water probably increased the soil moisture of nearby irrigated areas, thus reducing crop water needs.
The RRC also collects information (e.g., crop extension and typology, etc.) on the other cultivated areas that are not served by the consortium and where irrigation water is not requested by the farmers due to different reasons: (i) the cultivation of specific crops (e.g., autumn–winter cereals) that do not require irrigation; (ii) the aquifer level during growing period is high enough to allow the capillary rise and, therefore, additional irrigation is not needed; (iii) the RRC distribution network does not reach these areas; (iv) groundwater is used as an irrigation source.
These cultivated and potentially irrigable areas could be irrigated by the RRC, which would bring economic and environmental advantages. In fact, an extension of the existing RRC water distribution network would minimize groundwater withdrawals, resulting in the reduction of costs connected to groundwater extraction, the preservation of groundwater water resources and the decrease of saline intrusion events in the coastal areas. Furthermore, the use of treated wastewater could further reduce the amount of freshwater intended for agricultural irrigation, including the water withdrawn from CER by the RRC.
In accordance with the aim of this study, in the next section, outcomes from the GIS analyses have been reported and discussed in order to evaluate the potential for treated wastewater reuse in agricultural irrigation within the Forlì-Cesena province. Firstly, the most suitable WWTPs within the study area were selected. As reported below, for the selected WWTPs, the capability of the treated water to meet crop water needs, as well as the feasibility of treated wastewater reuse, were assessed, also considering the minimum water quality requirements introduced by the new European Regulation (EU 2020/741) on treated wastewater reuse for agricultural irrigation [50]. Then, two different scenarios were identified in which water reuse was assumed to be main source for (i) the irrigation of actually irrigated areas and (ii) the irrigation of land areas which are potentially irrigable; thus allowing, in this case, the extension of the existing RRC water distribution network as well as of the number of users it serves.

3. Results and Discussion

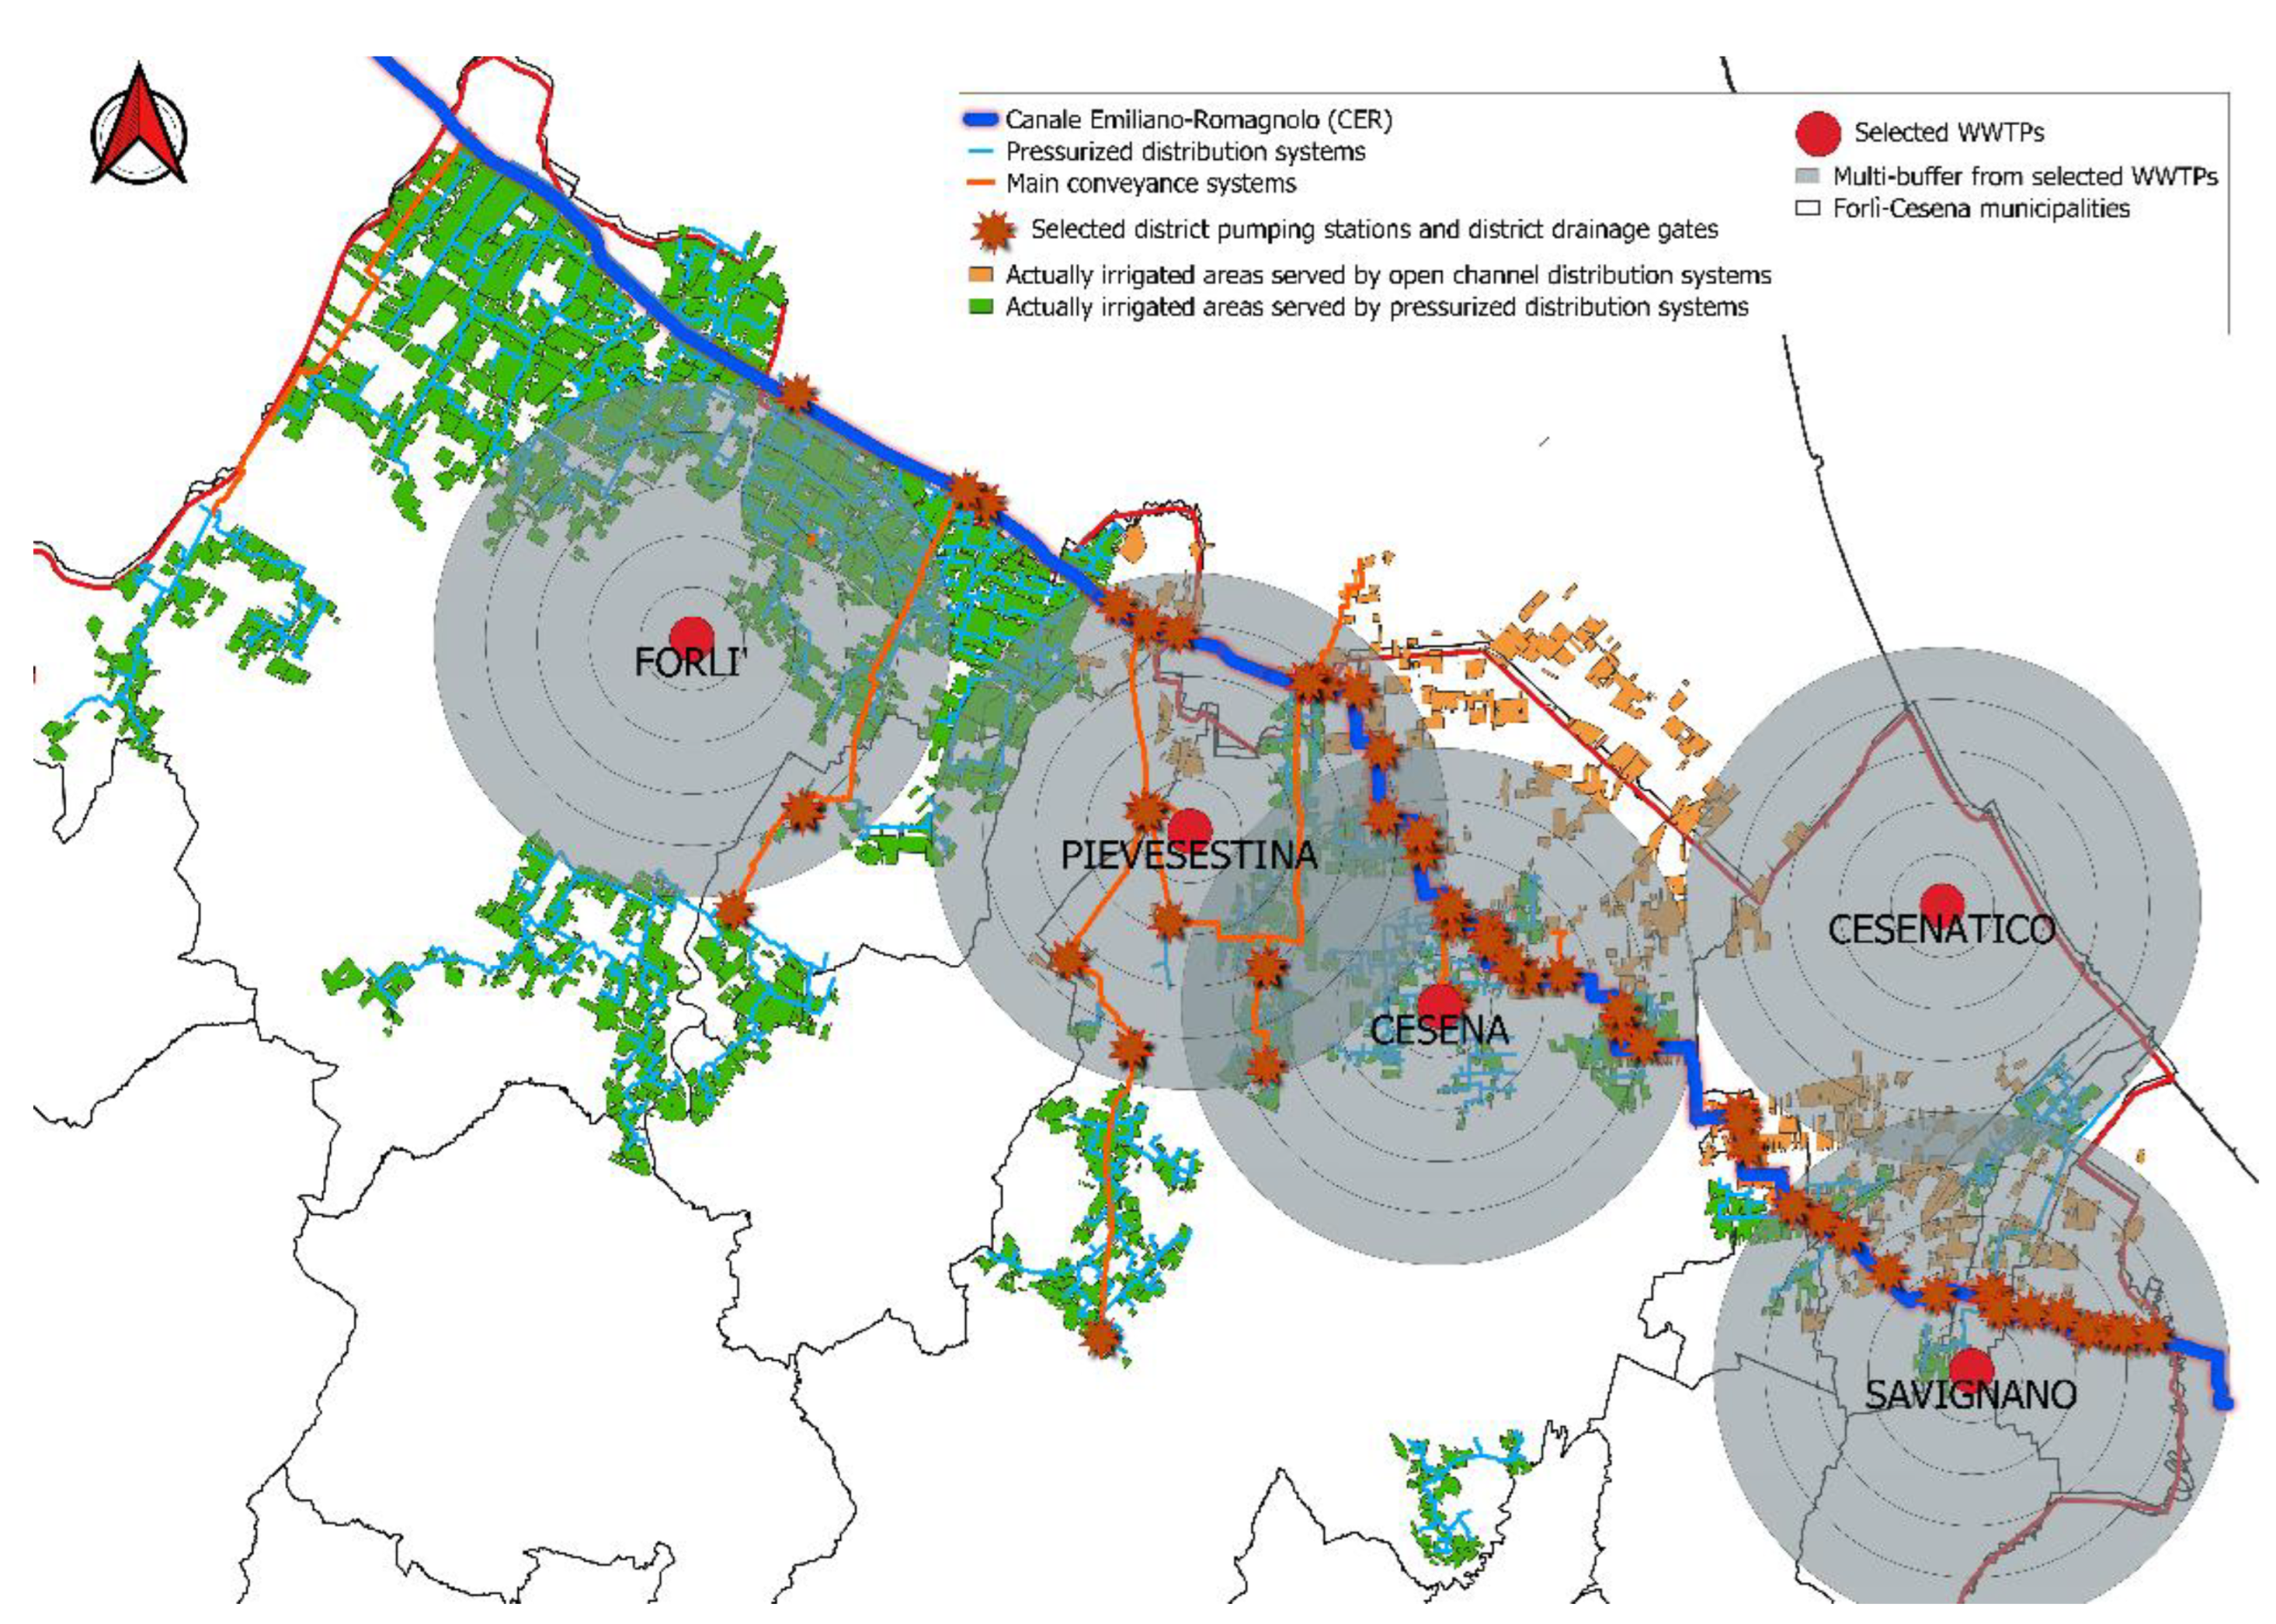
3.1. WWTPs Selection

The exact localizations of the currently operating wastewater treatment facilities were marked through the opensource QGIS software (v. 111) by using their GPS coordinates (Figure 2). As shown in Figure 2, about 200 such facilities were identified within the Forlì-Cesena province. However, a large number of these cannot be defined as WWTPs (i.e., Imhoff systems), because their function is to treat wastewater only from single users or from very small populated areas. The contribution of these wastewater treatment facilities was therefore considered to be negligible for the purposes of the present study; thus, only the WWTPs with a population equivalent (PE) higher than 1000 were selected. By applying this criterion, the number of selected WWTPs was significantly reduced (21 compared to 200) (Figure 2).
Following this, a further selection of WWTPs was carried out based on the criterion of their proximity to the areas actually irrigated with RRC water, in order to reduce costs and negative environmental impacts connected to the treated wastewater transport and supply. Therefore, by applying this criterion, a total number of five WWTPs were selected (Figure 3). These WWTPs were Forlì, Pievestina, Cesena, Cesenatico and Savignano, all of which are located within the coastal plain (Figure 3). In fact, the WWTPs located on the Apennine chain have been excluded due to the excessive distance between the WWTPs and irrigated/irrigable areas.
All the five selected WWTPs are characterized by the presence of the activated sludge biological oxidation process and their operating conditions, and the design parameters were investigated (Table 3).
In all of the selected WWTPs, treated wastewater is discharged into open canal systems managed by the RRC, whose main function is to convey treated wastewater to the receiving water bodies (e.g., the Adriatic Sea). Because the study area was mostly flat, treated wastewater discharge point altitudes were between 19 and 23 m above the sea level for four of the selected WWTPs (except for the Cesenatico WWTP, for which the altitude was only 3 m above the sea level, due to its proximity to the Adriatic coastline).

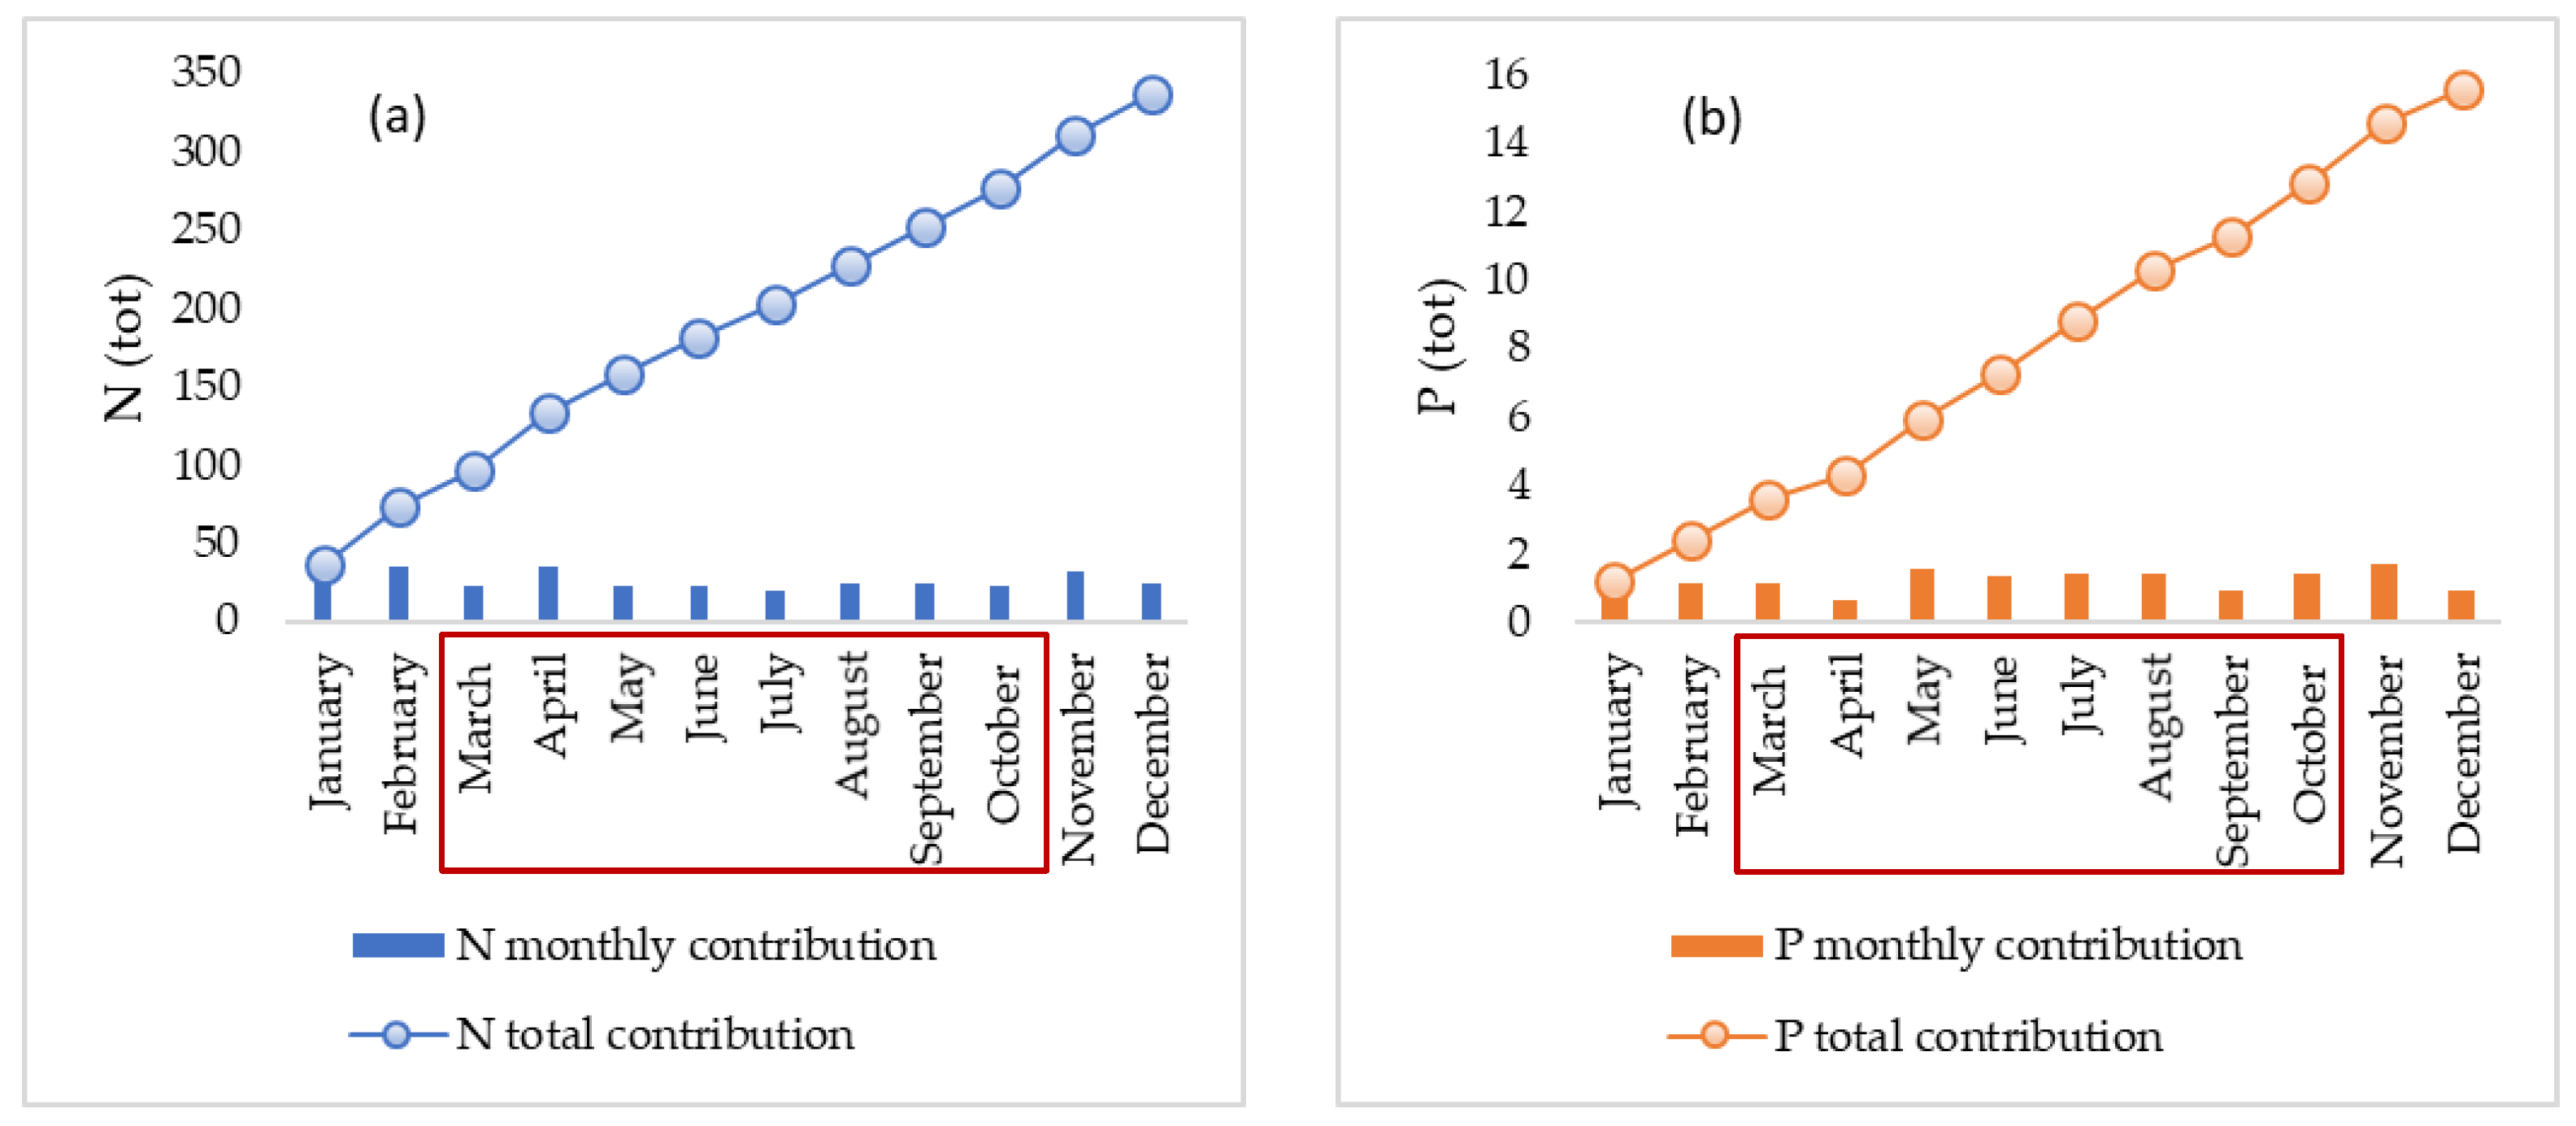
Treated Wastewater Analysis for the Selected WWTPs

The treated wastewater can be reused in agriculture for irrigation purposes only if it meets the pre-established minimum quality requirements. To this end, the European Community has recently adopted the new Regulation (EU) 2020/741 [50], which defines four different water quality classes (A, B, C and D) as well as the permitted uses and irrigation methods for each of the above-mentioned water quality classes (EU 2020/741—Annex I—Section 2Table 1 and Table 2 [50]).
Based on the limits reported in the mentioned regulation, the water quality for each WWTP effluent was evaluated by analyzing the data provided by the WWTP’s operator. In particular, the analysis was carried out for the three-year period (from 2017 to 2019), considering all the available physical, chemical and biological data.
Table 4 summarizes the results of the data analysis. For each WWTP, the percentage of water samples falling within each class defined by the EU regulation (A, B, C and D) was calculated, distinguishing all the parameters reported in the legislation (E. Coli, BOD5 and TSS). The percentages were expressed as the ratio with respect to the total number of water samples that were analyzed.
The results in Table 4 show that, from a microbiological point of view, treated wastewater from the Cesenatico and Forlì WWTPs was the most suitable for reuse in class A (≤10 number 100 mL−1), with E. Coli percentages of 75.0% and 75.6%, respectively. On the contrary, lower percentages for the Cesena and Savignano WWTPs (17.6% and 23.5%, respectively) were detected and no microbiological data were available for the Pievestina WWTP. It is important to note that these values refer only to the three-year period from 2017 to 2019, keeping in mind that the treated water quality can be different over time, mainly due to climatic conditions, raw wastewater features and WWTP treatment efficiency.
All the selected WWTPs provided high percentages of samples that met the classes B, C and D—except for the Pievestina WWTP, for which, during the three-year period, microbiological data were not available. High microbiological standards in WWTPs are essential to ensure that the microbial risks associated with the treated wastewater reuse are minimized.
As for BOD5, which defines the amount of organic matter contained in treated wastewater samples, it was possible to observe that the obtained percentages (ranging between 91.2% and 100%) were very high for all of the WWTPs, showing that treated wastewater was mostly suitable for all of the water quality classes. With regard to TSS, the presence of suspended solids was higher in the treated wastewater discharged by the Cesenatico WWTP, which provided the lowest percentage (i.e., 51.4%) of treated wastewater that could be reused as class A (≤10 mg L−1). The percentages of the other WWTPs were lower and they ranged from 73.5% to 87.1%. However, for TSS, the percentages referring to the possible application of treated wastewater for categories B, C and D were found to be quite high (i.e., from 88.2% to 97.1%), indicating a low risk for the detection of excessive amounts of TSS, which could be the cause of soil plugging in water distribution systems.
Although the above parameters have been discussed separately, it should be noted that they must meet all the limits imposed by the Regulation (EU) 2020/741 at the same time in order to permit the treated wastewater reuse.
A further analysis was performed on the nutrients content of the treated wastewater. In regard to this, both the WWTP operator and the Regional Agency for Environment Protection (ARPA) periodically carried out analyses on treated wastewater that aimed to definite the total nitrogen (N) and total phosphorus (P) content. These elements are essential nutrients for plant growth, and their presence enhances water value in irrigation. However, when discharged in excessive amounts on land, nitrogen can also lead to the pollution of groundwater. The total nutrients amount was calculated by multiplying their concentrations (data from the sample analyses) and the treated wastewater volumes that were discharged by the WWTPs (Table 3). The calculation referred to the year 2018, which was selected based on having the highest amount of available data. As shown in Figure 4, considering all the selected WWTPs, the total volume of treated wastewater (34,219,179 m3 year−1, Table 3), for the year 2018, implied that 318.70 tons of nitrogen and 14.98 tons of phosphorus were released from the WWTPs throughout the year.
However, considering only the eight-month irrigation season from March to October (red rectangles in Figure 4), the estimated nutrients amount was 196.95 tons for nitrogen and 9.96 tons for phosphorus. Furthermore, in Figure 4, it is shown that the monthly contributions were similar throughout the year for nitrogen, while some fluctuations for phosphorus were observed.
These results confirm that the nutrient recovery from wastewater can be a sustainable approach to reduce the use of fertilizers in agriculture, with both economic and environmental benefits. Indeed, the reuse of treated wastewater could help in overcoming the limits of implementing expensive treatment techniques for nutrient recovery [51], as well as curtailing pollution and damage to the environment. All of these aspects are reported within different sustainable development goals promoted by the United Nations [52]—boosting further investigations involving the use of sustainable development goals Assessment as a novel approach [52,53].

3.2. Treated Wastewater Reuse

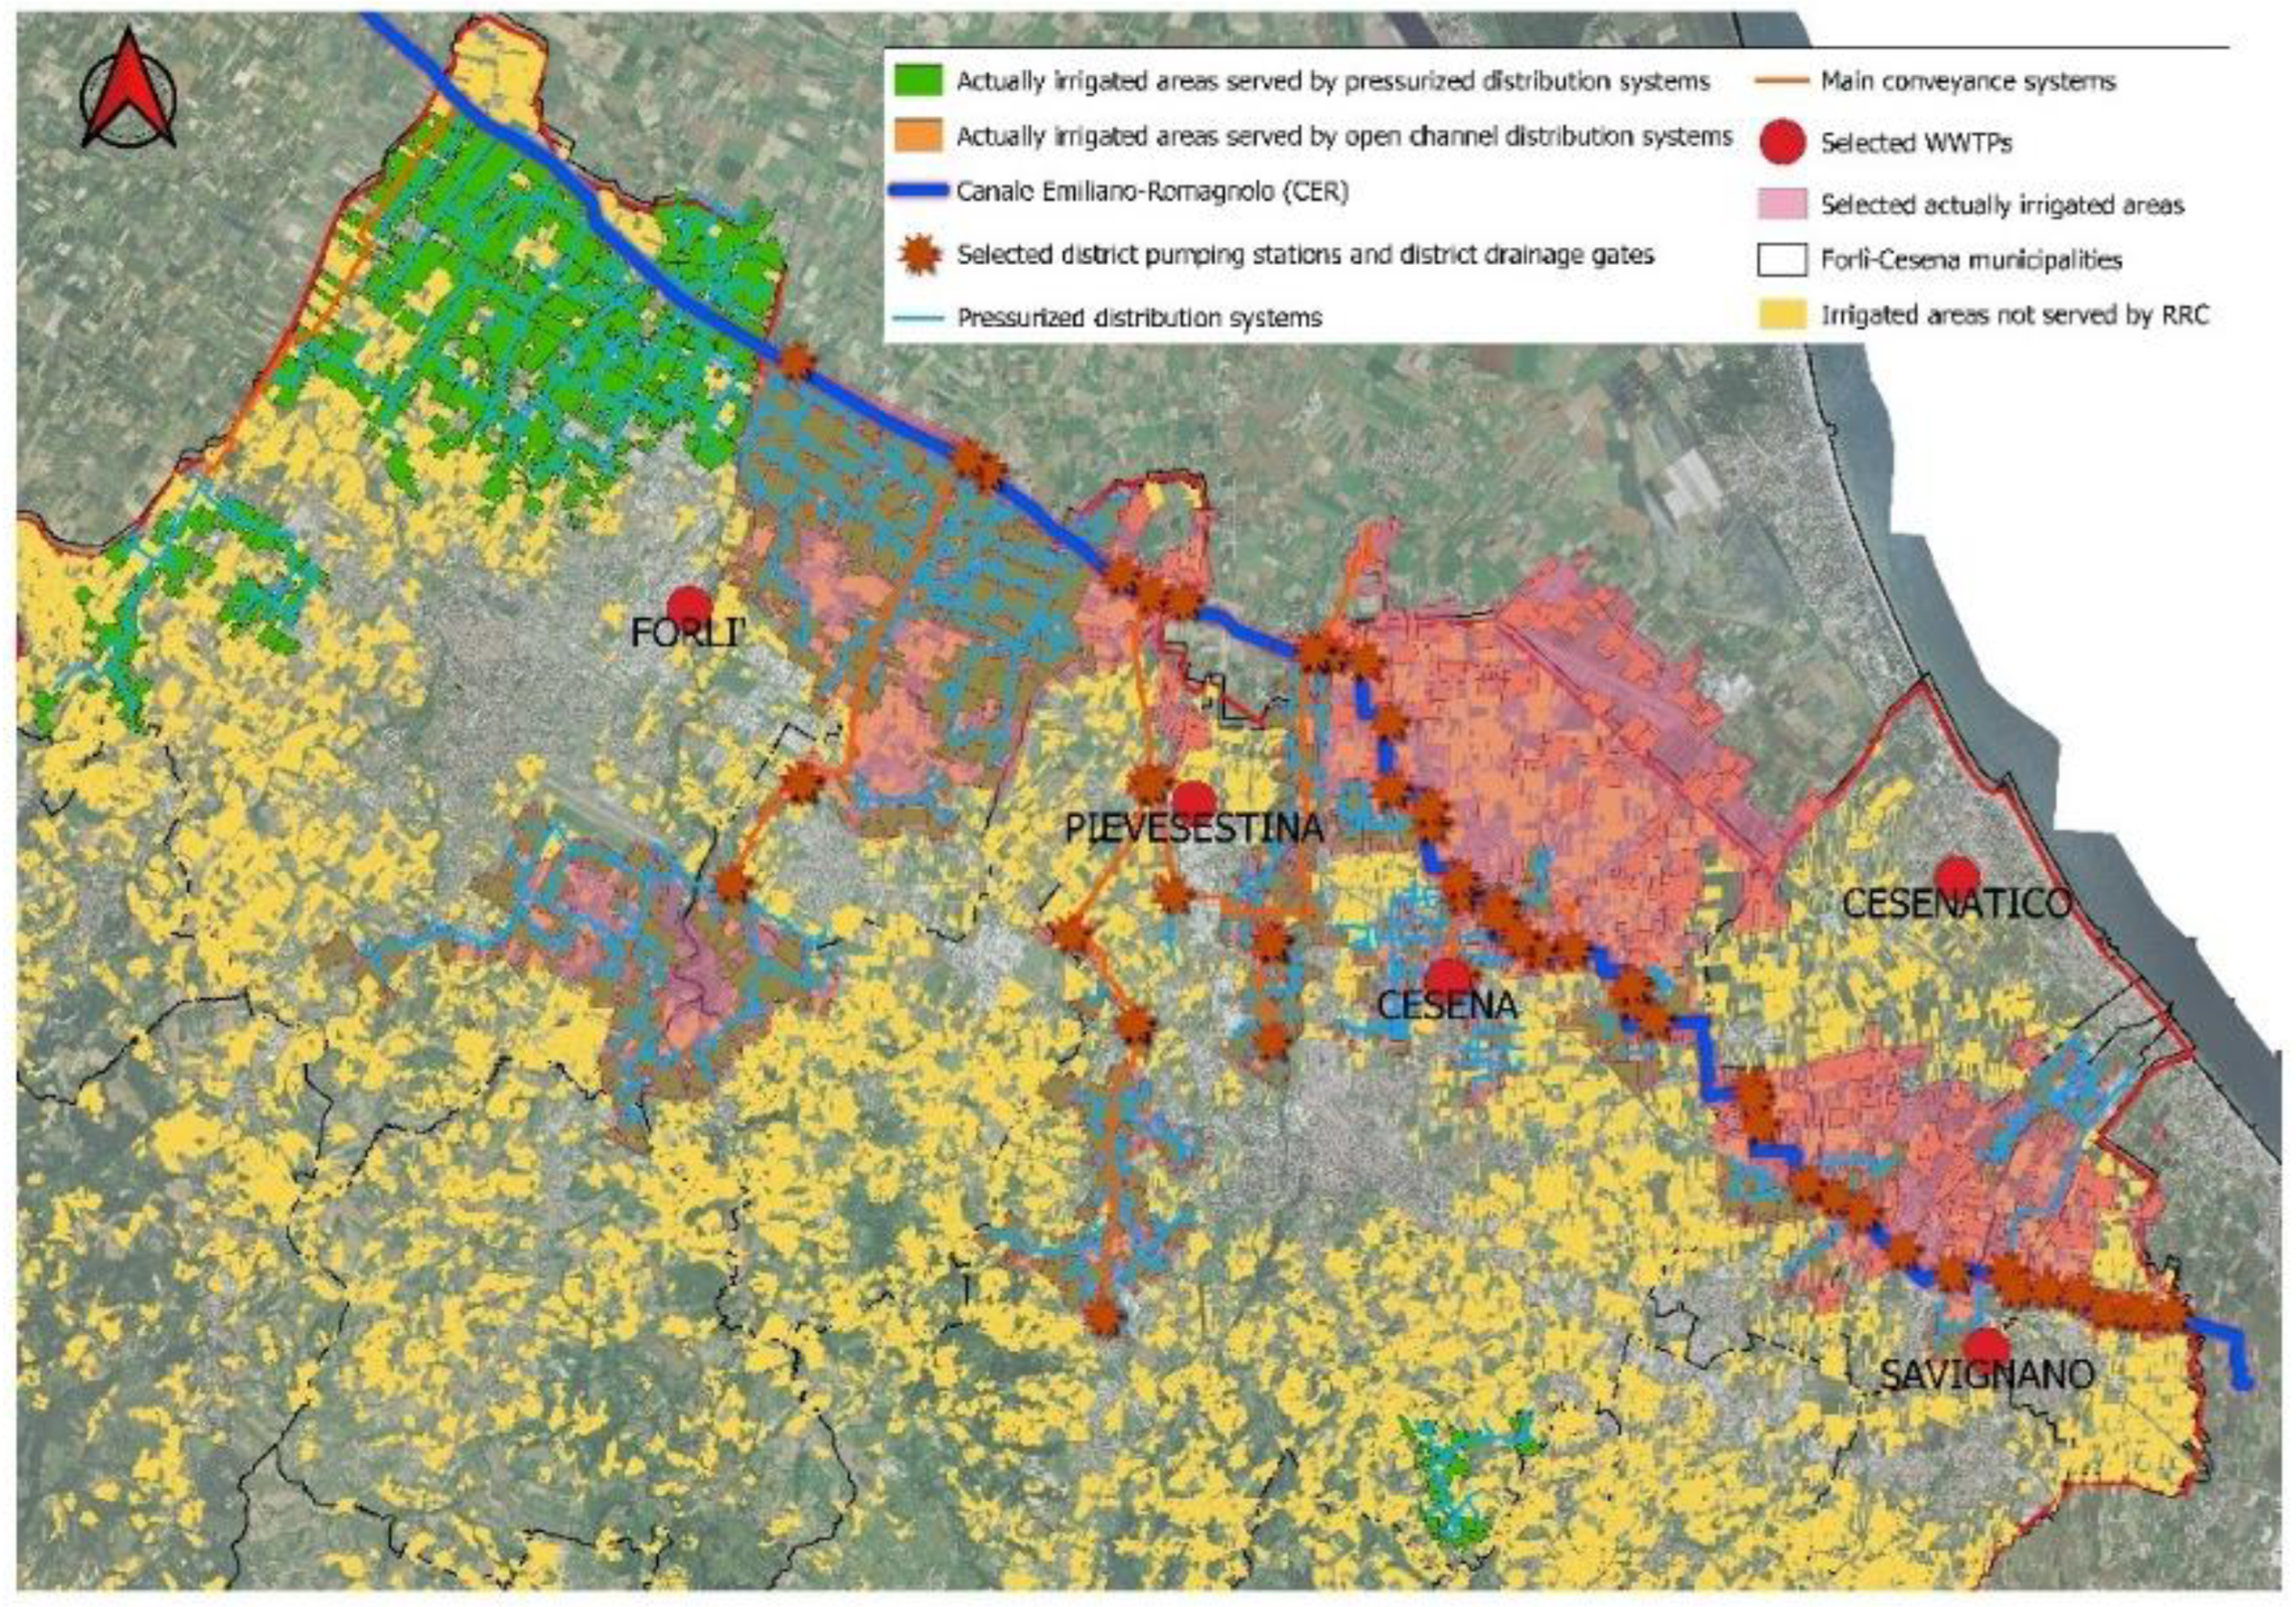
3.2.1. First Criterion: Actually Irrigated Areas

As the first criterion, the volume of treated wastewater produced by the selected WWTPs was evaluated in order to investigate its potential reuse for irrigation of actually irrigated areas served by the RRC water distribution network.
Figure 5 shows the actually irrigated areas that were served by the RRC pressurized (green polygons) and open channel (yellow polygons) water distribution systems. The total extension of the actually irrigated areas was 6180.88 ha (Table 2) and their crop water needs were estimated by the IrriNet system as being 10,841.73 m3 year−1 (Table 5). The majority of this annual estimated volume was requested by crops during the irrigation season (from March to October). Therefore, treated wastewater reuse, with a total production of 34,219,179 m3 (sum of all selected WWTPs discharged flows) (Table 3), could have satisfied 316% of the yearly crop water needs estimated by IrriNet system for the irrigated areas (Table 5). The irrigation demand, on the other hand, is higher during the irrigation season, during which the selected WWTP discharges could satisfy the 210% of the crop water needs (Table 5). However, this does not mean that the treated wastewater produced beyond the irrigation season needs to be lost. That volume could be stored in reservoirs and then reused during the irrigation season, which is the period with the highest irrigation water demand.
However, water losses within the distribution systems need to be considered as well. In that case, the discharge from the selected WWTPs (34,219,179 m3) could satisfy 105% of the crop water needs within the actually irrigated areas during the irrigation season, or even up to 157% if treated wastewater is stored during winter and used beyond the irrigation season.

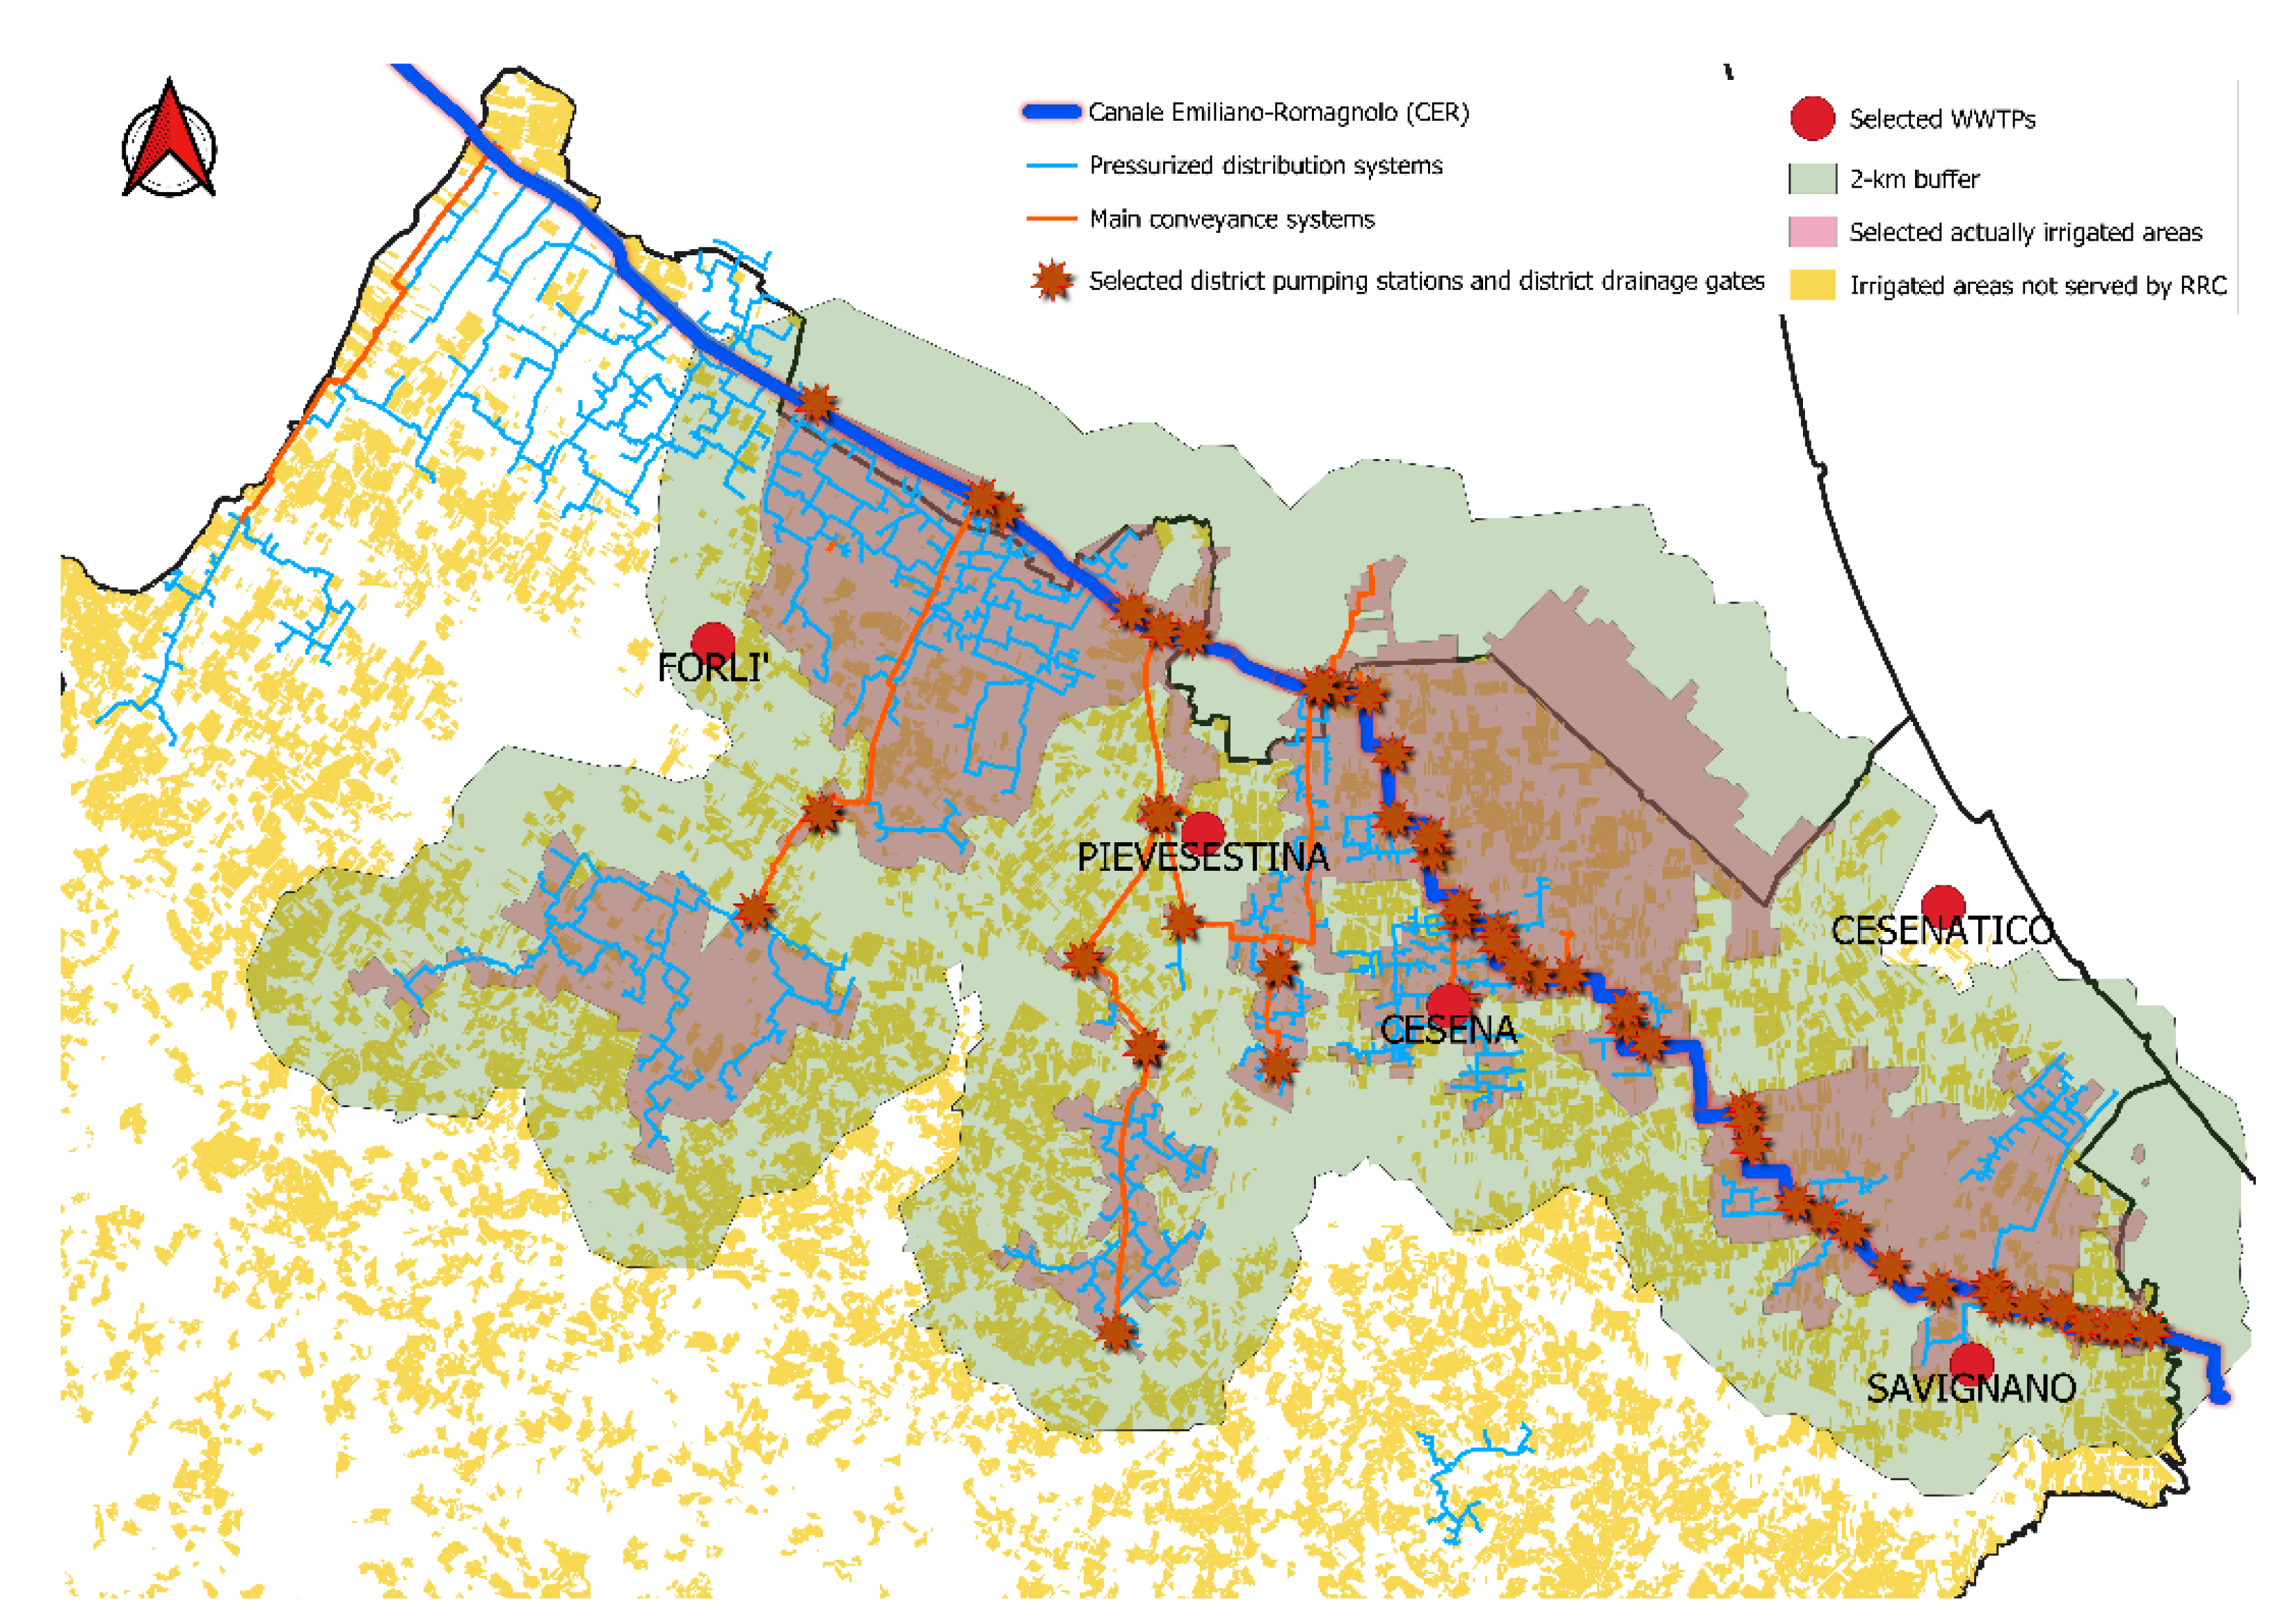
3.2.2. Second Criterion: Irrigable Areas

As the second criterion, new areas suitable for irrigation (“irrigable areas”) were considered. Data related to their extension, spatial localization and crop typology were collected from the RRC. They were then elaborated in GIS for their spatial analyses, with the aim of evaluating the possibility of extending the current water distribution network, starting from the already existing part.
By adopting a multi-buffer analysis performed by the plug-in available in QGIS software, the areas at a 5 km distance from the five selected WWTPs were marked with a circle (Figure 6), including the irrigated areas, the water distribution system and the main hydraulic infrastructures (pumping stations and drainage gates) that were near the selected WWTPs.
Adopting the proximity criterion, a new layer was created as a new polygon shape file by grouping the actually irrigated areas at a 5 km distance from the selected WWTP plants, regardless of whether they were served by pressurized or open channel distribution systems (Figure 7).
In order to facilitate reaching the water distribution systems and to select new irrigable areas, a new buffer analysis was performed using the buffer plug-in available in QGIS software (Figure 8). The new layer combined two criteria: (i) areas within a 5 km range from the selected WWTPs, and (ii) areas located at a 2 km distance from the water distribution system nodes and other irrigation infrastructures. The second criterion was chosen because the distance of 2 km was considered small enough for the simple hydraulic interventions needed for distribution system expansion and, therefore, it would allow an increase in irrigable surface area. In that way, all of the areas that could be served by treated wastewater, regardless of their actual irrigation status, were considered.
The new irrigable areas are shown in Figure 9, after overlaying the buffer analysis results with the new layer containing them.
The irrigable areas shown in Figure 9 could be served with the treated wastewater discharged from the five selected WWTPs due to their connection to the RRC distribution network. The total extension of these areas was calculated to be 14,049.50 ha (Table 5). Most of them were identified within the flat land, and the remaining along the foothills. The crop water needs of the irrigable areas were estimated by the IrriNet system to be equal to 21,169,708 m3 year−1. The GIS outcomes confirmed that 108% of this water demand could be satisfied by exploiting the treated wastewater from the selected WWTPs during the irrigation season (Table 5).
The last GIS elaboration was carried out to investigate the potential for treated wastewater reuse in both the actually irrigated and irrigable areas, together (Figure 10), which have total crop water needs of 32,011,381 m3 year−1. It was calculated that the total treated wastewater from all of the selected WWTPs could cover 71% of this water demand during the irrigation season (Table 5). However, storage of the treated wastewater produced by the selected WWTPs beyond the irrigation season could completely satisfy crop water needs.

4. Conclusions

The aim of this research was to assess the potential of treated wastewater reuse in agricultural irrigation for the Forlì-Cesena province within the Emilia-Romagna region (Italy). The analysis was carried out by means of GIS software, using data provided by the RRC within the time interval 2017–2019 for the elaborations.
In particular, two different criterions were applied in order to evaluate the capability of treated wastewater to satisfy crop water needs in actually irrigated areas and in new irrigable areas, respectively.
The GIS results showed that, for the actually irrigated areas, crop water needs could be largely satisfied by treated wastewater, also considering water losses due to water infiltration and evaporation. Furthermore, GIS results confirmed the possibility of extending the water distribution network beyond the actually irrigated areas, creating new irrigated areas (irrigable areas). In addition, in this case, crop water needs could be largely satisfied by treated wastewater, confirming that it is a valuable and alternative water resource that can help to increase food production and thereby meet the growing food demand.
The results highlight that, for the selected study area, treated wastewater reuse for irrigation purposes in agriculture could help to mitigate water scarcity events. In particular, treated wastewater represents an alternative and constant water resource quantity over time, which could replace freshwater withdrawals. Furthermore, wastewater is a resource that is rich in nutrients (mainly nitrogen and phosphorus), which are essential for crop growth. Hence, treated wastewater reuse in agriculture could also reduce the use of chemical fertilizers.
However, because treated wastewater reuse is still not a widespread practice in Italy, the future research should concentrate on the exact quantification of the fertilizers saved depending on the water characteristics. In addition, any effect that this practice has on crops should be also investigated, because these are very important points when addressing the sustainability issues of wastewater reuse.

Author Contributions

Conceptualization, A.T.; methodology, M.C.M.P., F.V. and S.L.; software, M.C.M.P. and F.V.; validation, G.M., F.V., S.L. and A.T.; investigation, G.M.; resources, A.T.; data curation, G.M.; writing—original draft preparation, G.M.; writing—review and editing, G.M., F.V. and S.L.; visualization, F.V.; supervision, A.T.; project administration, A.T.; funding acquisition, A.T. All authors have read and agreed to the published version of the manuscript.

Funding

This research was funded by the region of Emilia-Romagna (the program POR-FESR 2014–2020) through the project VALorizzazione di acque reflUE e fanghi in ottica di economia CircolarE e simbiosi INdustriale (VALUE CE-IN, CUP I31F18000080009, https://valuecein.eu/project/).

Institutional Review Board Statement

Not applicable.

Informed Consent Statement

Not applicable.

Data Availability Statement

Not applicable.

Conflicts of Interest

The authors declare no conflict of interest.

References

  1. Sheidaei, F.; Karami, E.; Keshavarz, M. Farmers’ attitude towards wastewater use in Fars Province, Iran. Water Policy 2005, 18, 355–367. [Google Scholar] [CrossRef]
  2. Ricart, S.; Rico, A.M. Assessing technical and social driving factors of water reuse in agriculture: A review on risks, regulation and the yuck factor. Agric. Water Manag. 2019, 217, 426–439. [Google Scholar] [CrossRef]
  3. Wang, D.; Hubacek, K.; Shan, Y.; Gerbens-Leenes, W.; Liu, J. A Review of Water Stress and Water Footprint Accounting. Water 2021, 13, 201. [Google Scholar] [CrossRef]
  4. Mancuso, G.; Bencresciuto, G.F.; Lavrnić, S.; Toscano, A. Diffuse Water Pollution from Agriculture: A Review of Nature-Based Solutions for Nitrogen Removal and Recovery. Water 2021, 13, 1893. [Google Scholar] [CrossRef]
  5. Mancuso, G.; Perulli, G.D.; Lavrnic, S.; Morandi, B.; Toscano, A. SARS-CoV-2 from Urban to Rural Water Environment: Occurrence, Persistence, Fate, and Influence on Agriculture Irrigation. A Rev. Water 2021, 13, 764. [Google Scholar] [CrossRef]
  6. Daigger, G.T. Evolving Urban Water and Residuals Management Paradigms: Water Reclamation and Reuse, Decentralization, and Resource Recovery. Water Environ. Res. 2009, 81, 809–823. [Google Scholar] [CrossRef]
  7. Gosling, S.N.; Arnell, N.W. A global assessment of the impact of climate change on water scarcity. Clim. Chang. 2016, 134, 371–385. [Google Scholar] [CrossRef] [Green Version]
  8. Lavrnić, S.; Zapater-Pereyra, M.; Mancini, M.L. Water Scarcity and Wastewater Reuse Standards in Southern Europe: Focus on Agriculture. Water Air Soil Pollut. 2017, 228, 251. [Google Scholar] [CrossRef]
  9. Azhoni, A.; Jude, S.; Holman, I. Adapting to climate change by water management organisations: Enablers and barriers. J. Hydrol. 2018, 559, 736–748. [Google Scholar] [CrossRef]
  10. WEF-World Economic Forum, The Global Risks Report 2020, Cologny/Geneva Switzerland. Available online: https://www3.weforum.org/docs/WEF_Global_Risk_Report_2020.pdf (accessed on 24 March 2022).
  11. FAO. The State of Food and Agriculture 2020. Available online: https://www.fao.org/publications/sofa/sofa-2021/en/ (accessed on 17 April 2022).
  12. FAO. AQUASTAT Website. Food and Agriculture Organization of the United Nations. Available online: http://www.fao.org/nr/water/aquastat/data/query/index.html?lang=en (accessed on 16 January 2022).
  13. WWAP. United Nation World Water Assessment Programme. In The United Nations World Water Development Report 2017. Wastewater: The Untapped Resource; Unesco: Paris, France, 2017. [Google Scholar]
  14. Hussain, M.I.; Muscolo, A.; Farooq, M.; Ahmad, W. Sustainable use and management of non-conventional water resources for rehabilitation of marginal lands in arid and semiarid environments. Agric. Water Manag. 2019, 221, 462–476. [Google Scholar] [CrossRef]
  15. Morote, Á.-F.; Olcina, J.; Hernández, M. The Use of Non-Conventional Water Resources as a Means of Adaptation to Drought and Climate Change in Semi-Arid Regions: South-Eastern Spain. Water 2019, 11, 93. [Google Scholar] [CrossRef] [Green Version]
  16. Omran, E.S.E. Unconventional Water Resources and Agriculture in Egypt; Negm, A.M., Ed.; Springer: Cham, Switzerland, 2019. [Google Scholar]
  17. Chen, C.Y.; Wang, S.W.; Kim, H.; Pan, S.Y.; Fan, C.; Lin, Y.J. Non-conventional water reuse in agriculture: A circular water economy. Water Res. 2021, 199, 117193. [Google Scholar] [CrossRef]
  18. Al-Seekh, S.H.; Mohammad, A.G. The Effect of Water Harvesting Techniques on Runoff, Sedimentation, and Soil Properties. Environ. Manag. 2009, 44, 37–45. [Google Scholar] [CrossRef] [PubMed]
  19. Avni, N.; Eben-Chaime, M.; Oron, G. Optimizing desalinated sea water blending with other sources to meet magnesium requirements for potable and irrigation waters. Water Res. 2013, 47, 2164–2176. [Google Scholar] [CrossRef] [PubMed]
  20. Ghermandi, A.; Minich, T. Analysis of farmers’ attitude toward irrigation with desalinated brackish water in Israel’s Arava Valley. DESALINATION Water Treat. 2017, 76, 328–331. [Google Scholar] [CrossRef] [Green Version]
  21. Chien, S.S.; Hong, D.L.; Lin, P.H. Ideological and volume politics behind cloud water resource governance–Weather modification in China. Geoforum 2017, 85, 225–233. [Google Scholar] [CrossRef]
  22. van Lier, J.B.; Huibers, F.P. From unplanned to planned agricultural use: Making an asset out of wastewater. Irrig. Drain. Syst. 2010, 24, 143–152. [Google Scholar] [CrossRef] [Green Version]
  23. Rizzo, L.; Gernjak, W.; Krzeminski, P.; Malato, S.; McArdell, C.S.; Perez, J.A.S.; Schaar, H.; Fatta-Kassinos, D. Best available technologies and treatment trains to address current challenges in urban wastewater reuse for irrigation of crops in EU countries. Sci. Total Environ. 2020, 710, 136312. [Google Scholar] [CrossRef]
  24. Garcia, X.; Pargament, D. Reusing wastewater to cope with water scarcity: Economic, social and environmental considerations for decision-making. Resour. Conserv. Recycl. 2015, 101, 154–166. [Google Scholar] [CrossRef]
  25. Sala, L.; Serra, M. Towards sustainability in transport. Water Sci. Technol. 2004, 50, 1–7. [Google Scholar] [CrossRef] [PubMed]
  26. Mancuso, G.; Langone, M.; Di Maggio, R.; Toscano, A.; Andreottola, G. Effect of hydrodynamic cavitation on flocs structure in sewage sludge to increase stabilization for efficient and safe reuse in agriculture. Bioremediation J. 2022, 26, 41–52. [Google Scholar] [CrossRef]
  27. Meneses, M.; Pasqualino, J.C.; Castells, F. Environmental assessment of urban wastewater reuse: Treatment alternatives and applications. Chemosphere 2010, 81, 266–272. [Google Scholar] [CrossRef] [PubMed]
  28. Plumlee, M.H.; Gurr, C.J.; Reinhard, M. Recycled water for stream flow augmentation: Benefits, challenges, and the presence of wastewater-derived organic compounds. Sci. Total Environ. 2012, 438, 541–548. [Google Scholar] [CrossRef] [PubMed]
  29. FAO. The State of the World’s Land and Water Resources for Food and Agriculture–Systems at breaking point. Synthesis report 2021. Rome. 2021. Available online: https://doi.org/10.4060/cb7654en (accessed on 26 April 2022).
  30. Foglia, A.; Andreola, C.; Cipolletta, G.; Radini, S.; Akyol, Ç.; Eusebi, A.L.; Stanchev, P.; Katsou, E.; Fatone, F. Comparative life cycle environmental and economic assessment of anaerobic membrane bioreactor and disinfection for reclaimed water reuse in agricultural irrigation: A case study in Italy. J. Clean. Prod. 2021, 293, 126201. [Google Scholar] [CrossRef]
  31. EC. Water Reuse Report. 2020. Available online: http://ec.europa.eu/environment/water/reuse.htm (accessed on 14 December 2021).
  32. MedECC Network. Risks Associated to Climate and Environmental Changes in the Mediterranean Region: A Preliminary Assessment by the Mediterranean Experts on Climate and Environmental Change (MedECC) Network Science-Policy Interface. 2019. Available online: https://ufmsecretariat.org/wp-content/uploads/2019/10/MedECC-Booklet_EN_WEB.pdf (accessed on 4 May 2022).
  33. UNEP/MAP Plan Bleu. State of the Environment and Development in the 677 Mediterranean; Technical Report; UNEP/MAP: Athens, Greece, 2019. [Google Scholar]
  34. El-Kady, M.; El-Shibini, F. Desalination in Egypt and the future application in supplementary irrigation. Desalination 2001, 136, 63–72. [Google Scholar] [CrossRef]
  35. Abu-Sharar, T.M.; Hussein, I.A.; Al-Jayyousi, O.R. The use of treated sewage for irrigation in Jordan: Opportunities and constraints. Water Environ. J. 2003, 17, 232–238. [Google Scholar] [CrossRef]
  36. Alegbeleye, O.O.; Opeolu, B.O.; Jackson, V.A. Polycyclic Aromatic Hydrocarbons: A Critical Review of Environmental Occurrence and Bioremediation. Environ. Manag. 2017, 60, 758–783. [Google Scholar] [CrossRef]
  37. Kanber, R.; Unlu, M.; Koc, D.; Önder, D.; Cakmak, E.; Tüzün, M. Unconventional Irrigation Water Use in Turkey; Options Méditerranéennes: Series B—Studies and Research; CIHEAM: Paris, France, 2005; Volume 53, pp. 129–140. [Google Scholar]
  38. Qadir, M.; Sharma, B.R.; Bruggeman, A.; Choukr-Allah, R.; Karajeh, F. Non-conventional water resources and opportunities for water augmentation to achieve food security in water scarce countries. Agric. Water Manag. 2007, 87, 2–22. [Google Scholar] [CrossRef]
  39. Mancuso, G.; Lavrnić, S.; Toscano, A. Reclaimed water to face agricultural water scarcity in the Mediterranean area: An overview using Sustainable Development Goals preliminary data. In Advances in Chemical Pollution, Environmental Management and Protection; Elsevier: Amsterdam, The Netherlands, 2020; Volume 5, pp. 113–143. [Google Scholar]
  40. Ribeiro, P.; Albuquerque, A.; Quinta-Nova, L.; Cavaleiro, V. Recycling pulp mill sludge to improve soil fertility using GIS tools. Resour. Conserv. Recycl. 2010, 54, 1303–1311. [Google Scholar] [CrossRef] [Green Version]
  41. Blanco, I.; Loisi, R.V.; Sica, C.; Schettini, E.; Vox, G. Agricultural plastic waste mapping using GIS. A case study in Italy. Resour. Conserv. Recycl. 2018, 137, 229–242. [Google Scholar] [CrossRef]
  42. Lin, Y.C.; Lin, C.C.; Lee, M.; Chiueh, P.T.; Lo, S.L.; Liou, M.L. Comprehensive assessment of regional food-energy-water nexus with GIS-based tool. Resour. Conserv. Recycl. 2019, 151, 104457. [Google Scholar] [CrossRef]
  43. Parlato, M.C.M.; Valenti, F.; Porto, S.M.C. Covering plastic films in greenhouses system: A GIS-based model to improve post use suistainable management. J. Environ. Manag. 2020, 263, 110389. [Google Scholar] [CrossRef]
  44. Valenti, F.; Toscano, A. A GIS-Based Model to Assess the Potential of Wastewater Treatment Plants for Enhancing Bioenergy Production within the Context of the Water–Energy Nexus. Energies 2021, 14, 2838. [Google Scholar] [CrossRef]
  45. Selvaggi, R.; Valenti, F. Assessment of Fruit and Vegetable Residues Suitable for Renewable Energy Production: GIS-Based Model for Developing New Frontiers within the Context of Circular Economy. Appl. Syst. Innov. 2021, 4, 10. [Google Scholar] [CrossRef]
  46. Gheibi, M.; Emrani, N.; Eftekhari, M.; Behzadian, K.; Mohtasham, M.; Abdollahi, J. Assessing the failures in water distribution networks using a combination of geographic information system, EPANET 2, and descriptive statistical analysis: A case study. Sustain. Water Resour. Manag. 2022, 8, 47. [Google Scholar] [CrossRef]
  47. Erfani, S.M.H.; Danesh, S.; Karrabi, S.M.; Gheibi, M.; Nemati, S. Statistical analysis of effective variables on the performance of waste storage service using geographical information system and response surface methodology. J. Environ. Manag. 2019, 235, 453–462. [Google Scholar] [CrossRef] [PubMed]
  48. Valenti, F.; Porto, S.M.C.; Dale, B.E.; Liao, W. Spatial analysis of feedstock supply and logistics to establish regional biogas power generation: A case study in the region of Sicily. Renew. Sustain. Energy Rev. 2018, 97, 50–63. [Google Scholar] [CrossRef]
  49. Sun, L.; Jiang, Y.; Guo, Q.; Ji, L.; Xie, Y.; Qiao, Q.; Huang, G.; Xiao, K. A GIS-based multi-criteria decision making method for the potential assessment and suitable sites selection of PV and CSP plants. Resour. Conserv. Recycl. 2021, 168, 105306. [Google Scholar] [CrossRef]
  50. Regulation (EU) 2020/741 of the European Parliament and of the Council of 25 May 2020 on Minimum Requirements for Water Reuse; European Union: Brussels, Belgium, 2020.
  51. Ye, Y.; Ngo, H.H.; Guo, W.; Chang, S.W.; Nguyen, D.D.; Zhang, X.; Zhang, J.; Liang, S. Nutrient recovery from wastewater: From technology to economy. Bioresour. Technol. Rep. 2020, 11, 100425. [Google Scholar] [CrossRef]
  52. Obaideen, K.; Shehata, N.; Taha, E.; Ali, M. The role of wastewater treatment in achieving sustainable development goals (SDGs) and sustainability guideline. Energy Nexus 2022, 7, 100112. [Google Scholar] [CrossRef]
  53. Akbarian, H.; Jalali, F.M.; Gheibi, M.; Hajiaghaei-Keshteli, M.; Akrami, M.; Sarmah, A.K. A sustainable Decision Support System for soil bioremediation of toluene incorporating UN sustainable development goals. Environ. Pollut. 2022, 307, 119587. [Google Scholar] [CrossRef] [PubMed]
Figure 1. The case study of the Forlì-Cesena province: Emilia-Romagna region is in the pink frame and is zoomed in the pink hard frame; the Forlì-Cesena province is in the red frame and is zoomed in the red hard frame.
Sustainability 14 09364 g001
Figure 2. Spatial distribution of all the operating wastewater treatment facilities within the study area and the selection of WWTPs with PE > 1000.
Sustainability 14 09364 g002
Figure 3. Spatial distribution of the selected WWTPs within the study area based on the proximity criterion.
Sustainability 14 09364 g003
Figure 4. Amount of (a) total nitrogen (N) and (b) total phosphorus (P) within the treated wastewater in 2018, expressed both monthly and yearly.
Sustainability 14 09364 g004
Figure 5. Areas of the Forlì-Cesena province actually irrigated by RRC pressurized and open channel distribution systems.
Sustainability 14 09364 g005
Figure 6. Multi-buffer analysis results from the selected WWTPs and suitable irrigation infrastructures.
Sustainability 14 09364 g006
Figure 7. Selection of the actually irrigated areas close to the selected WWTPs.
Sustainability 14 09364 g007
Figure 8. Buffer analysis results for the selection of new irrigable areas.
Sustainability 14 09364 g008
Figure 9. Selection of new irrigable areas.
Sustainability 14 09364 g009
Figure 10. Actually irrigated and irrigable areas within the Forlì-Cesena province.
Sustainability 14 09364 g010
Table 1. Cultivated areas, crop water needs and delivered volumes to crops for the Forlì-Cesena province during the 2019 irrigation season.
CropCultivated AreaP1 1Crop Water NeedsDelivered VolumeP2 2
[Typology][ha][%][m3 ha−1][m3][%]
Grapevine964.2815.18618.1600,668.57.73
Peach883.8313.91647.9588,604.37.57
Summer horticultural crops508.938.011487.2740,942.89.53
Apricot471.337.421564.1395,328.85.08
Maize443.846.99744.1323,263.14.16
Green bean433.796.83886.5759,958.99.77
Actinidia368.185.793440.81,270,785.216.34
Summer seed crops221.523.49326.972,165.50.93
Onion218.703.441658.1374,710.94.82
Pear195.563.081682.6331,710.94.82
Plum185.232.921609.6307,506.83.95
Apple173.082.723067.3537,608.46.91
Sugar beet150.662.37387.0058,306.20.75
Spinach135.832.14187.125,572.30.33
Winter seed crops109.851.73148.0107,299.01.38
Legumes105.581.66355.016,262.00.21
Sugar beet for seed98.591.551074.8429,184.25.52
Walnut97.641.544418.637,479.10.48
Khaki85.351.341829.6142,775.51.84
Potato81.591.281750.0156,601.72.01
Other fruit crops78.601.241902.4150,654.91.94
Spring horticultural crops60.460.95570.034,750.50.45
Tomato50.970.80873.745,333.20.58
Strawberry46.990.74600.028,195.30.36
Cherry45.500.72774.435,060.00.45
Nursery crops39.950.631579.560,793.40.78
Bamboo and Paulownia31.380.49600.018,829.70.24
Greenhouse crops19.370.301669.334,018.90.44
Cut flowers13.450.213775.24184.90.05
Other crops33.410.53-87,272.71.12
Total6353100-7,775,425100
1 P1 = Cultivated area/total irrigated area. 2 P2 = Delivered volume/total introduced volume into the water distribution system.
Table 2. Data for the different distribution systems from 2017 to 2019.
Distribution SystemYearUsersActually Irrigated AreaWater Withdrawal from CERDelivered VolumeTheoretical Crop Water Needs
[Typology] [Number][ha][m3][m3][m3]
Pressurized201723454684.519,216,3839,216,38312,432,229
201823534624.516,429,7516,429,7517,279,715
201923484919.396,437,0256,437,0256,132,885
average23494742.807,361,0537,361,0538,614,943
Open channel20175171502.1713,936,1103,209,5583,163,117
20185251378.0015,533,9851,916,3031,874,534
20195211434.0513,661,9261,691,5101,642,540
average5211438.0814,377,3402,272,4572,226,730
Total (average) 28706180.8821,738,3939,633,51010,841,673
Table 3. Selected wastewater treatment plants (WWTPs) located within the Forlì-Cesena province and their main characteristics.
WWTPsPopulation Equivalent (PE)Treated Wastewater 1Treated Wastewater Discharge Point Altitude
[Name][Number][m3 year−1][m s.l.m.]
Cesena197,5007,021,72121
Cesenatico120,0004,715,8633
Forlì250,00015,753,86123
Piavestina5200462,33123
Savignano139,0006,255,40319
Total711,70034,219,179-
1 data refer to 2018.
Table 4. Percentages of water samples that met the minimum water quality requirements for the selected WWTPs (data from 2017 to 2019).
WWTP’s Territorial AreaE. ColiBOD5TSS
ABCDAB, C, DAB, C, D
Cesena17.6%76.5%94.1%100.0%98.6%100.0%87.1%90.0%
Cesenatico75.0%100.0%100.0%100.0%98.6%100.0%51.4%85.7%
Forlì76.5%100.0%100.0%100.0%97.1%100.0%87.1%90.0%
Pievestina----94.1%91.2%73.5%88.2%
Savignano23.5%64.7%100.0%100.0%92.9%100.0%75.7%97.1%
Table 5. Crop water needs and the potential of treated wastewater to satisfy crop water needs for actually irrigated and irrigable areas.
Irrigated AreasCrop Water NeedsPotential of Treated Wastewater to Satisfy Crop Water Needs
[Typology][ha][m3]YearlyIrrigation Season
Actually irrigated areas6180.88 110,841,673 3316%210%
Irrigable areas14,049.5021,169,708 3162%108%
Actually irrigated + irrigable areas20,230.38 232,011,381 3107%71%
1 average value for the three-year monitoring period (from 2017 to 2019); the irrigated areas are served by both pressurized and open channel distribution systems; 2 estimated value; 3 average value for the three-year monitoring period (from 2017 to 2019); estimated value by IrriNet system.
Publisher’s Note: MDPI stays neutral with regard to jurisdictional claims in published maps and institutional affiliations.

