Article

Using Clean Energy Satellites to Interpret Imagery: A Satellite IoT Oriented Lightweight Object Detection Framework for SAR Ship Detection

1
Aerospace Information Research Institute, Chinese Academy of Sciences, Beijing 100094, China
2
University of Chinese Academy of Sciences, Beijing 100094, China
3
Innovation Academy for Microsatellites, Chinese Academy of Sciences, Shanghai 201210, China
4
Shanghai Engineering Center for Microsatellites, Shanghai 201304, China
5
School of Aeronautics and Astronautics, Zhejiang University, Zhejiang 310058, China
6
School of Information Science and Technology, ShanghaiTech University, Shanghai 201210, China
*
Authors to whom correspondence should be addressed.
Sustainability 2022, 14(15), 9277; https://doi.org/10.3390/su14159277
Submission received: 30 May 2022 / Revised: 25 July 2022 / Accepted: 26 July 2022 / Published: 28 July 2022

Abstract

:
This paper studies the lightweight deep learning object detection algorithm to detect ship targets in SAR images that can be deployed on-orbit and accessed in the space-based IoT. Traditionally, remote sensing data must be transferred to the ground for processing. With the vigorous development of the commercial aerospace industry, computing, and high-speed laser inter-satellite link technologies, the interconnection of everything in the intelligent world has become an irreversible trend. Satellite remote sensing has entered the era of a big data link with IoT. On-orbit interpretation gives remote sensing images expanse application space. However, implementing on-orbit high-performance computing (HPC) is difficult; it is limited by the power and computer resource consumption of the satellite platform. Facing this challenge, building a processing algorithm with less computational complexity, less parameter quantity, high precision, and low computational power consumption is a key issue. In this paper, we propose a lightweight end-to-end SAR ship detector fused with the vision transformer encoder: YOLO−ViTSS. The experiment shows that YOLO−ViTSS has lightweight features, the model size is only 1.31 MB; it has anti-noise capability is suitable for processing SAR remote sensing images with native noise, and it also has high performance and low training energy consumption with 96.6 mAP on the SSDD dataset. These characteristics make YOLO−ViTSS suitable for porting to satellites for on-orbit processing and online learning. Furthermore, the ideas proposed in this paper help to build a cleaner and a more efficient new paradigm for remote sensing image interpretation. Migrating HPC tasks performed on the ground to on-orbit satellites and using solar energy to complete computing tasks is a more environmentally friendly option. This environmental advantage will gradually increase with the current construction of large-scale satellite constellations. The scheme proposed in this paper helps to build a novel real-time, eco-friendly, and sustainable SAR image interpretation mode.

1. Introduction

With the vigorous development of computing and connectivity technologies, promoting the interconnection of everything in the intelligent world has become an irreversible trend. Sensors in satellites will also develop in the direction of perception, interconnection, and intelligence. Fusion applications of remote sensing data and Internet of Things (IoT) technology are widely used in intelligent agriculture [1], rock settlement monitoring [2], supersonic vehicle navigation [3], etc. The Synthetic Aperture Radar (SAR) sensors have been widely applied to marine monitoring due to their self-illumination capability [4]. Ship object detection is commonly used in port surveillance, illegal smuggling surveillance, and military use. Traditionally, remote sensing data must be transferred to the ground station and processed through a time/computing-consuming intelligent interpretation algorithm to detect the ship object. However, with the vigorous development of the commercial aerospace industry, the cost of entering space has been dramatically reduced. Low Earth Orbit (LEO) satellite launch increased significantly [5]. Satellite remote sensing has entered the era of a big data link with IoT.
In this trend, the traditional remote sensing object detection route is outdated. It limits the interconnection between satellites and other ground sensors such as GIS, search and rescue, autopilot, etc. Furthermore, processing large amounts of remote sensing data at ground stations also brings a lot of energy consumption. Transplanting the algorithm to satellites for on-orbit interpretation has three advantages: The first is for satellites. Due to their global positioning and ultra-long distance communication, they are particularly essential when sensors and actuators are located in remote areas without service from terrestrial access networks [6]. The on-board interpretation of the object information can be directly transmitted to other sensors through the space-based IoT through the inter-satellite and satellite-to-ground links, which has more advantages in terms of timeliness and coverage. The second point is to transmit the data after on-orbit interpretation through the space-based IoT, which can realize data enhancement of remote sensing information in many aspects. Take MIMO-SAR [7,8,9] as an example: The SAR performance is limited by target scintillation; by exploiting the diversity of target scattering, MIMO technology applied to SARs can significantly improve resolution and sensitivity, and detection and estimation performance for IoT space applications [10]. The third is that due to the satellite being powered by solar energy, the energy consumed by the interpretation of a large number of remote sensing images does not impose an additional burden on the ground stations, which is more environmentally friendly.
A breakthrough in Convolutional Neural Network (CNN) Technology [11] shows excellent performance in the computer vision field. Many state-of-the-art CNN-based object detectors [12,13,14,15,16,17,18,19,20,21,22] show superior performance, but at the same time, the high-performance computing (HPC) methods, also correspond to high energy consumption. On-orbit HPC is difficult; satellites are powered by solar arrays (SA), and the area of the SA decided the power supply for the satellite platform. However, due to the high manufacturing cost of solar panels and the space constraints of the launch vehicle fairing, the area of the SA is limited, so the power consumption of the satellite is also limited. Furthermore, the particle radiation of the space environment spared the design of the electronic components, and the computing power of onboard satellite computers was also limited. Some existing intelligent target recognition algorithms are directly transplanted to the satellite platform and cannot run smoothly and stably.
The most cost-effective way to solve the above problems is to optimize the detection algorithm. The one-stage method is suitable for deployment on the terminal due to it only needing to be fed into the network once to predict all the bounding boxes, which is faster than the two-stage method. Many scholars focus on optimizing the speed of the one-stage SOTA algorithm to take advantage of its fast speed [23,24,25,26,27,28,29,30]. For example, in 2020, the article [23] proposed a mixed YOLOv3-LITE detector, this method complements Residual Blocks (ResBlocks) and parallel high-to-low resolution sub-networks, makes full use of shallow network features while increasing network depth, and uses “shallow and narrow” convolutional layers to achieve lightweight characteristic; in 2022, the article [24] proposed a YOLOv4-tiny based lightweight object detection framework to improves inference speed without sacrificing accuracy than baseline method. In this article, channel attention, and spatial attention are used to extract more effective information and using ResBlock-D module replace the CSPDBlock module to reduces the computational complexity. Many scholars also focus on researching lightweight SAR image detection algorithms for high speed and low power consumption. In 2021, the article [25] proposed an efficient GPU parallel algorithm to accelerate image registration for InSAR image processing and achieved 10w power consumption on Nvidia Jetson. In 2021, article [26] proposed a lightweight detection framework that integrates CFAR and YOLOv4 to achieve on-orbit target detection of SAR ship images. The model size is 22 MB and achieves 85.9 % precision on the HISEA-1 image set, but the detection framework is divided into two stages; the dependent soft environment is more complex, and it is still challenging to transplant for microsatellites. In 2022, the article [27] proposed a lightweight SAR ship detector named Lite-YOLOv5, with a model size of only 2.38 MB, and achieved 73.15 % mAP in the LS-SSDD-v1.0 dataset. Still, this work does not assess the energy consumption of algorithm operation, which is a crucial metric for porting to satellite platforms.
These earlier works explored the feasibility of the one-stage algorithm in the field of object detection in satellite remote sensing images and laid a technical foundation for the realization of the new paradigm of on-orbit interpretation. Inspired by the above work, this paper aims to study a more lightweight and high-precision target recognition algorithm, and qualitatively analyze and evaluate the training power consumption, so as to provide theoretical support for the goal of transplantation in the algorithm onboard.
Based on the previous analysis, we mainly focus on studying the lightweight detection algorithm design to meet the task of detecting ships in orbit. We choose a one-stage lightweight detector, YOLOv5 [22], as the baseline method. Since YOLOv5 is a multiclass classifier, it has a scale optimization margin in a binary classification problem. Furthermore, some studies have shown that the vision transformer [31,32] can improve performance in remote sensing tasks effectively [30]. Inspired by the vision transformer technology, we study the performance of the vision transformer encoder [31] connected at different locations in the lightweight detection framework. We propose a YOLO-based dedicated SAR ship detector: You Only Look Once with Vision Transformer Encoder for SAR Ship detection (YOLO-ViTSS); we test it on the SAR Ship Detection Dataset (SSDD) [33]. The results show that YOLO-ViTSS is lightweight, robust, and has low training energy consumption. The main contributions of this paper are as follows:
1.
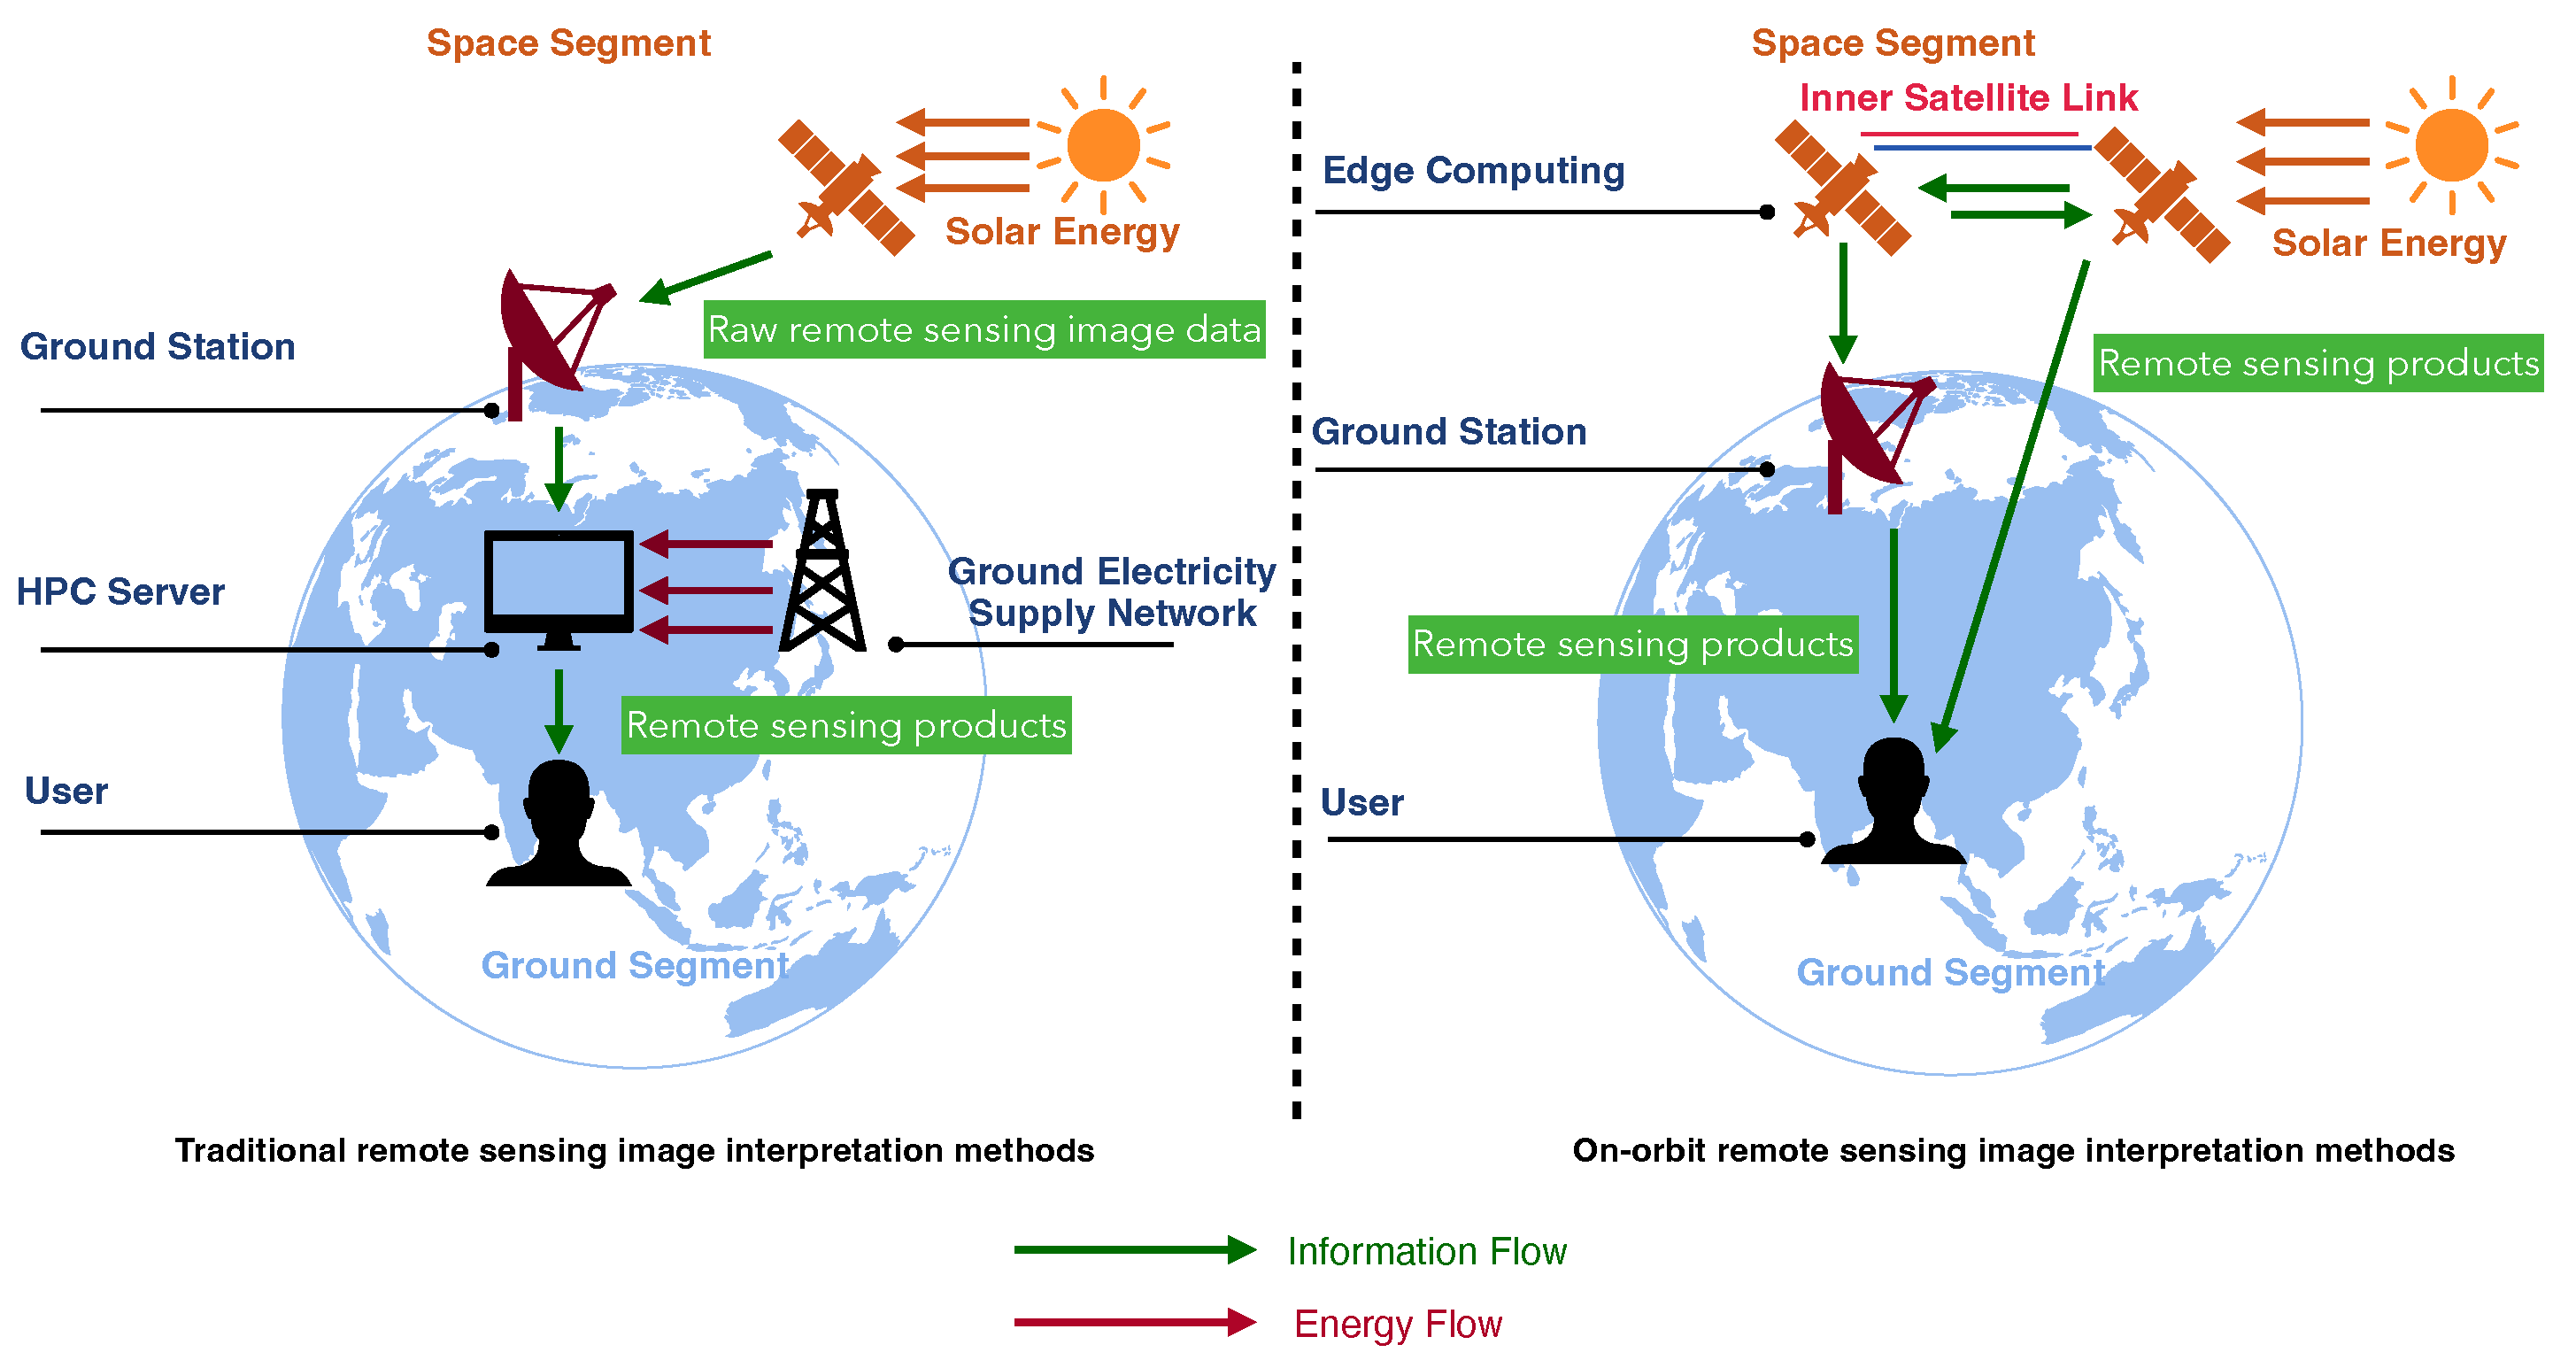
This paper analyzes the state of the art of the novel on-orbit remote sensing interpretation paradigm architecture. Compared with traditional interpretation methods, The scheme proposed in this paper helps to build a novel real-time, eco-friendly and sustainable remote sensing image interpretation mode.
2.
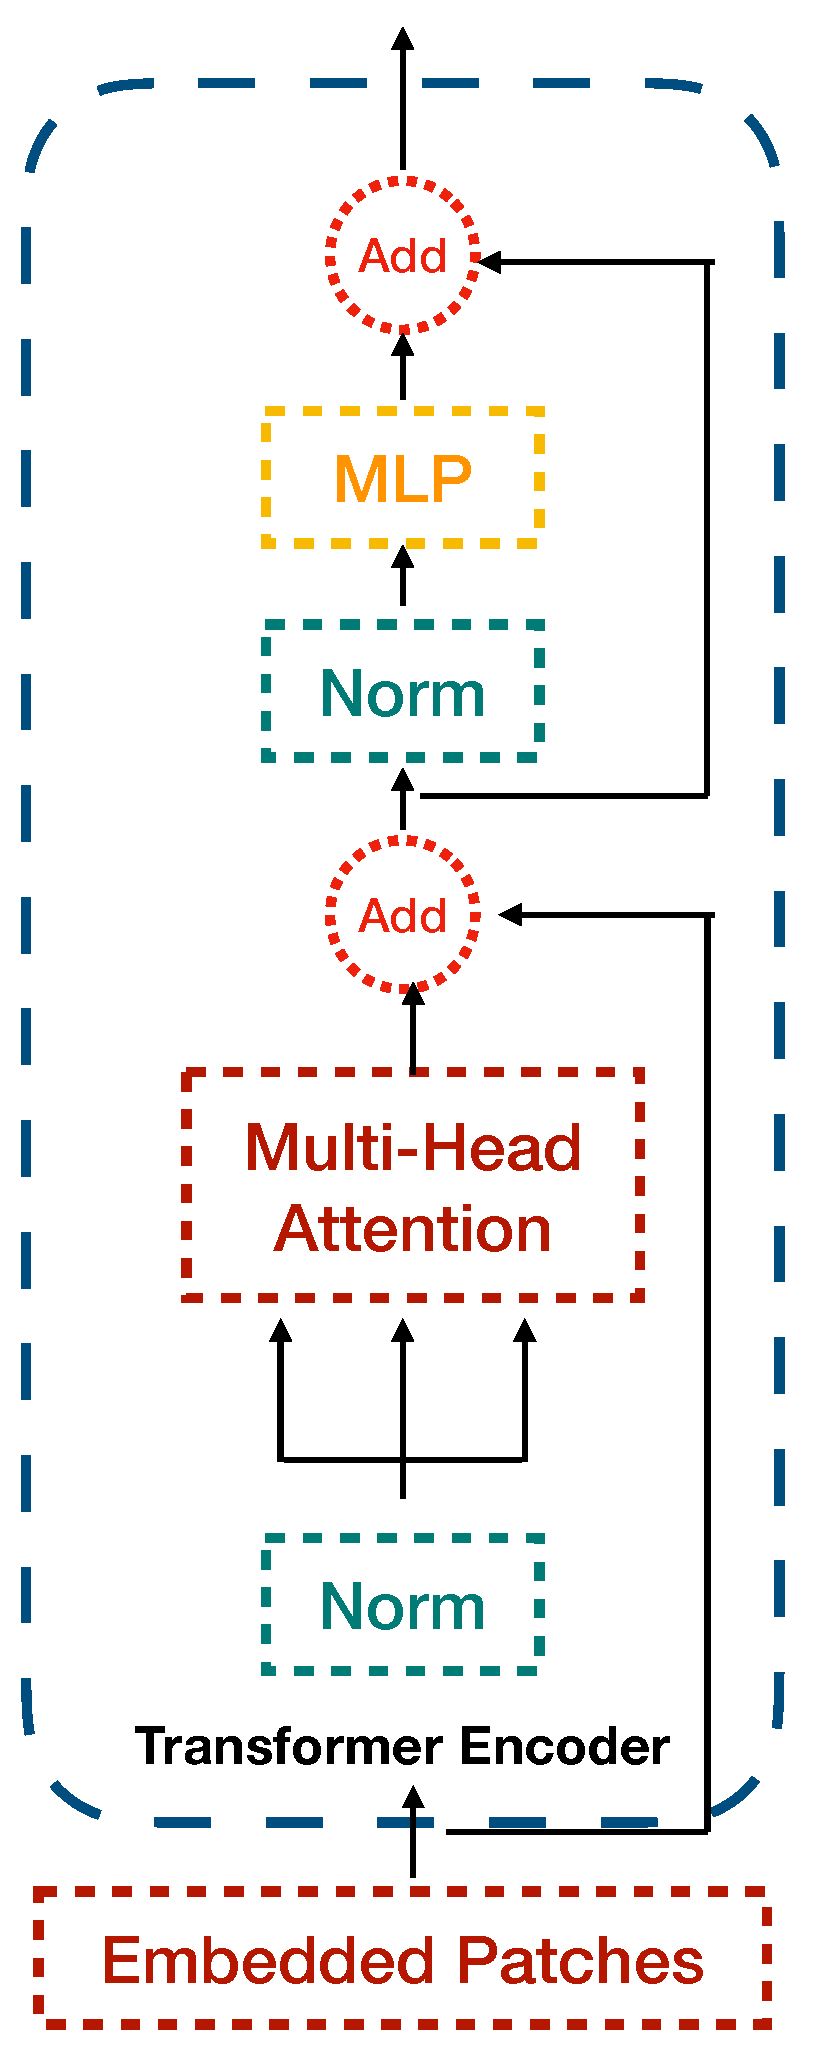
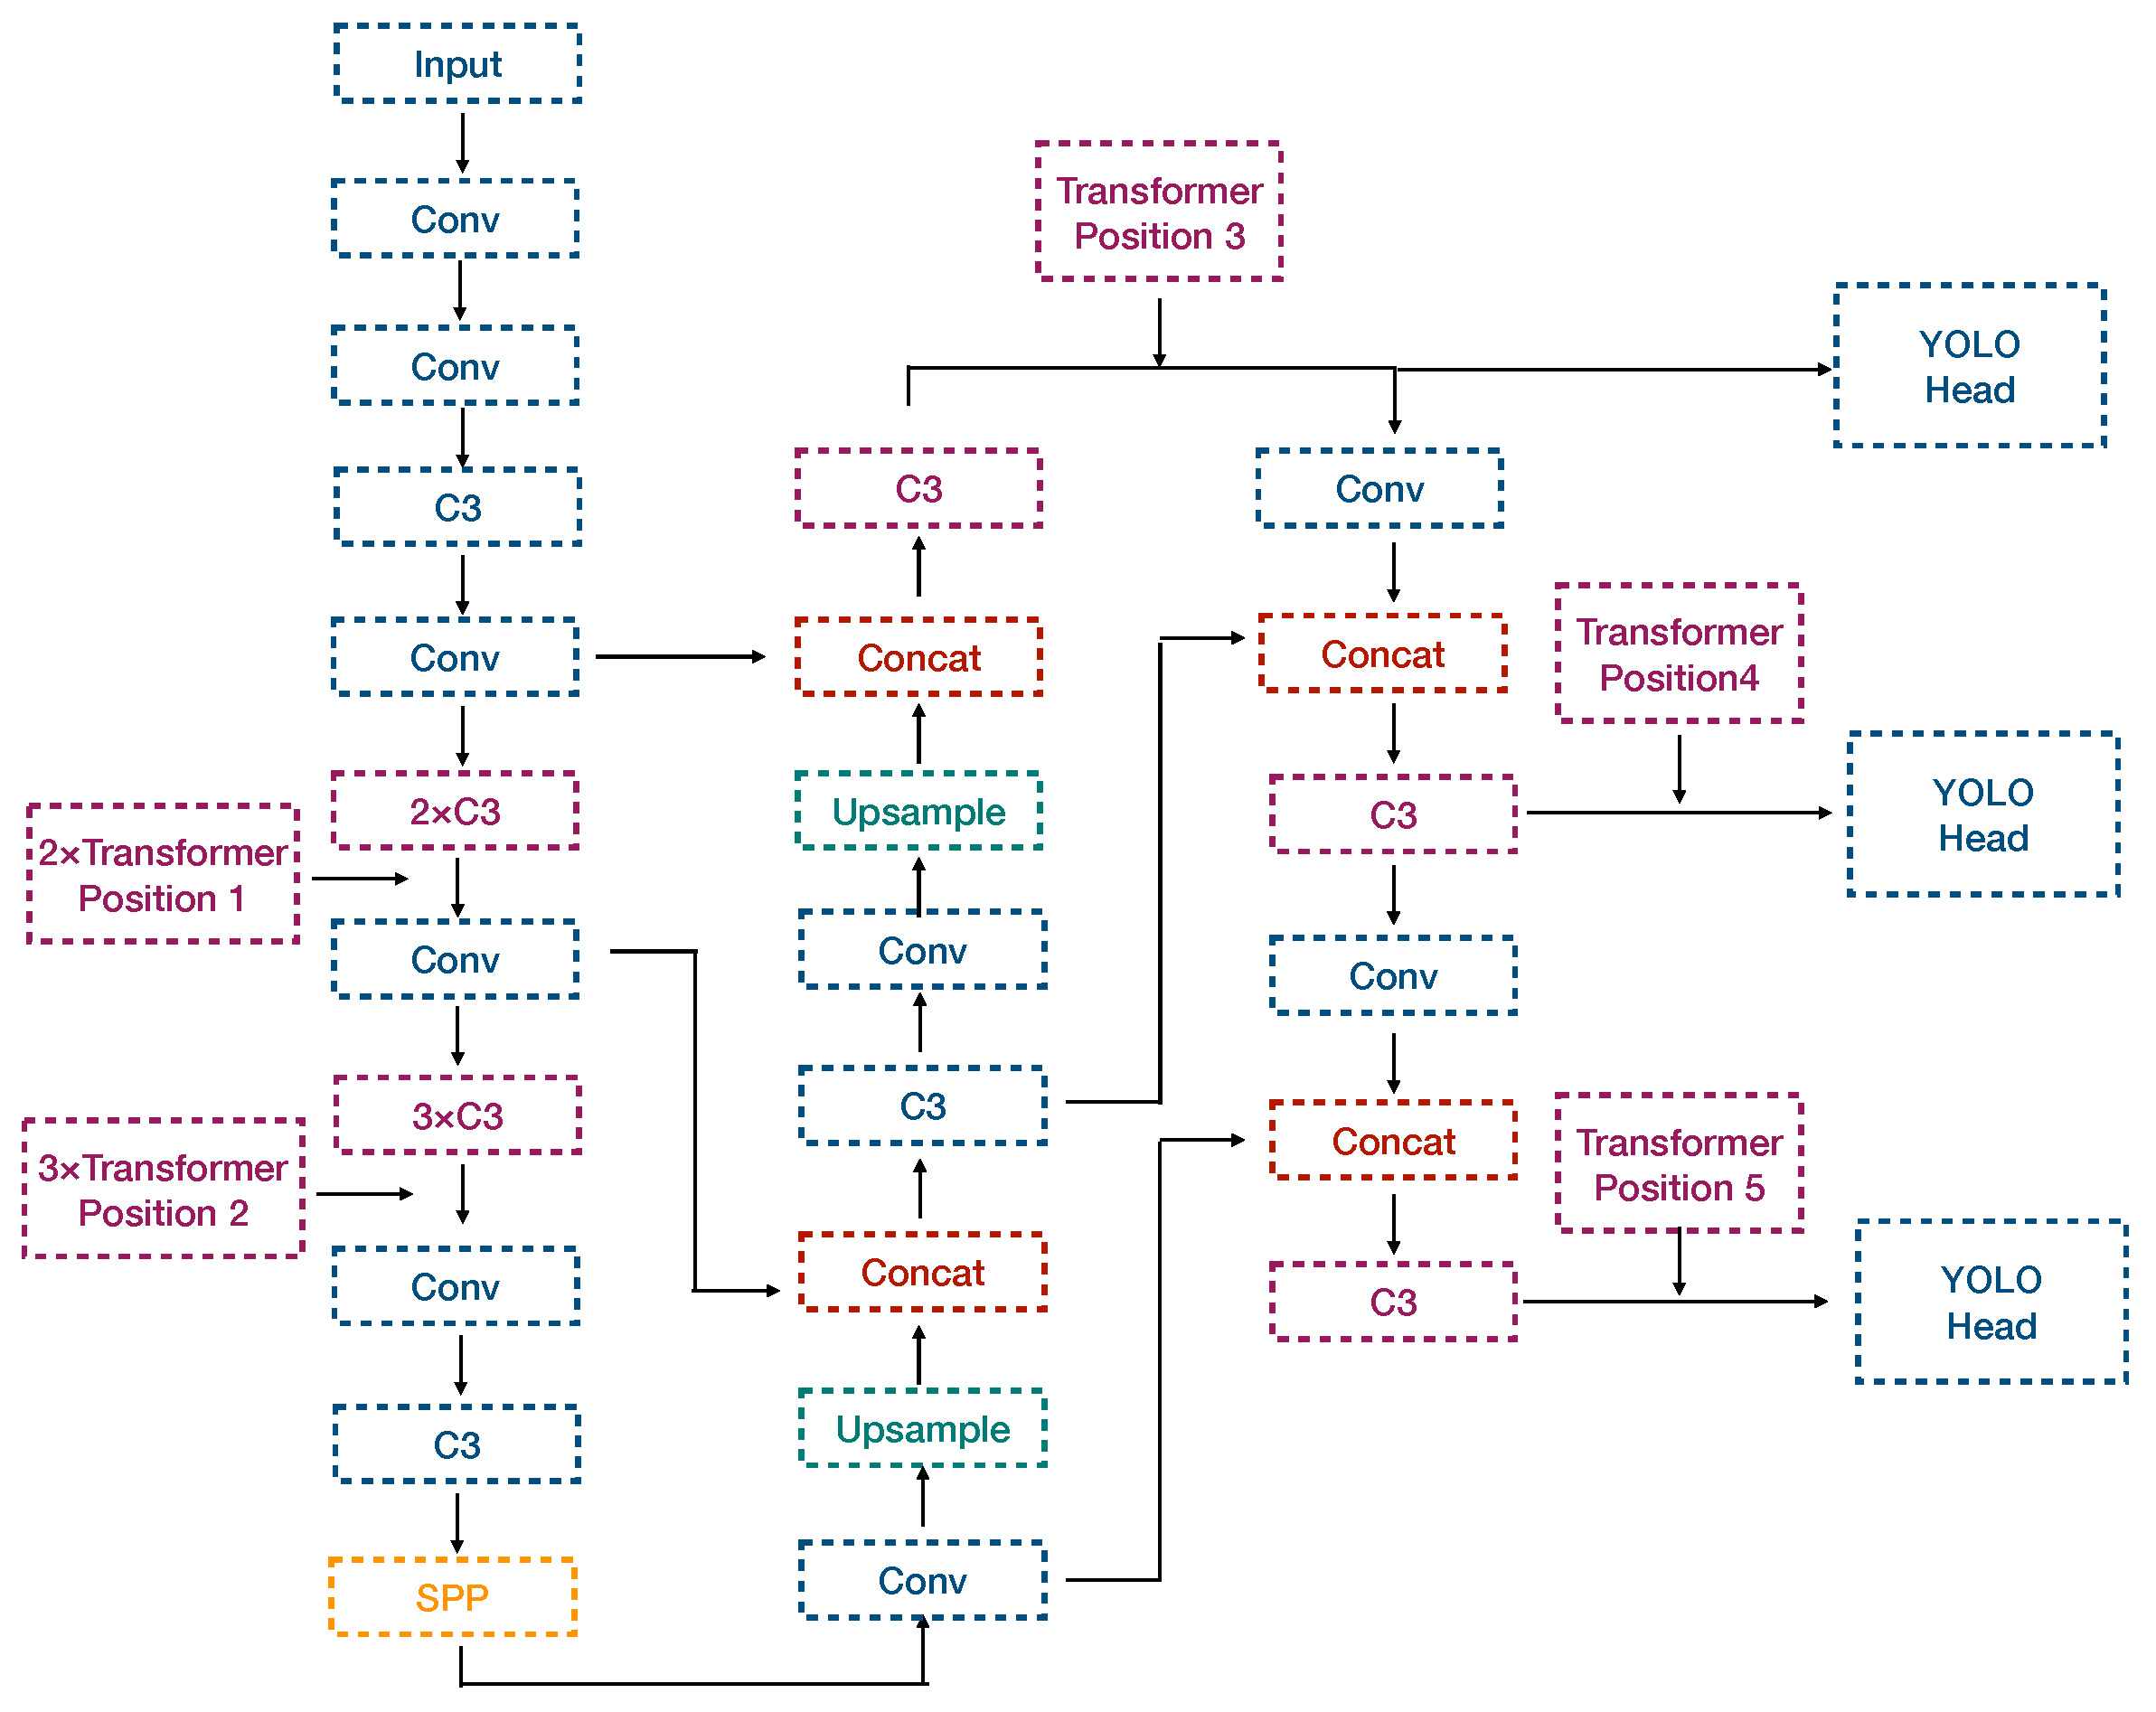
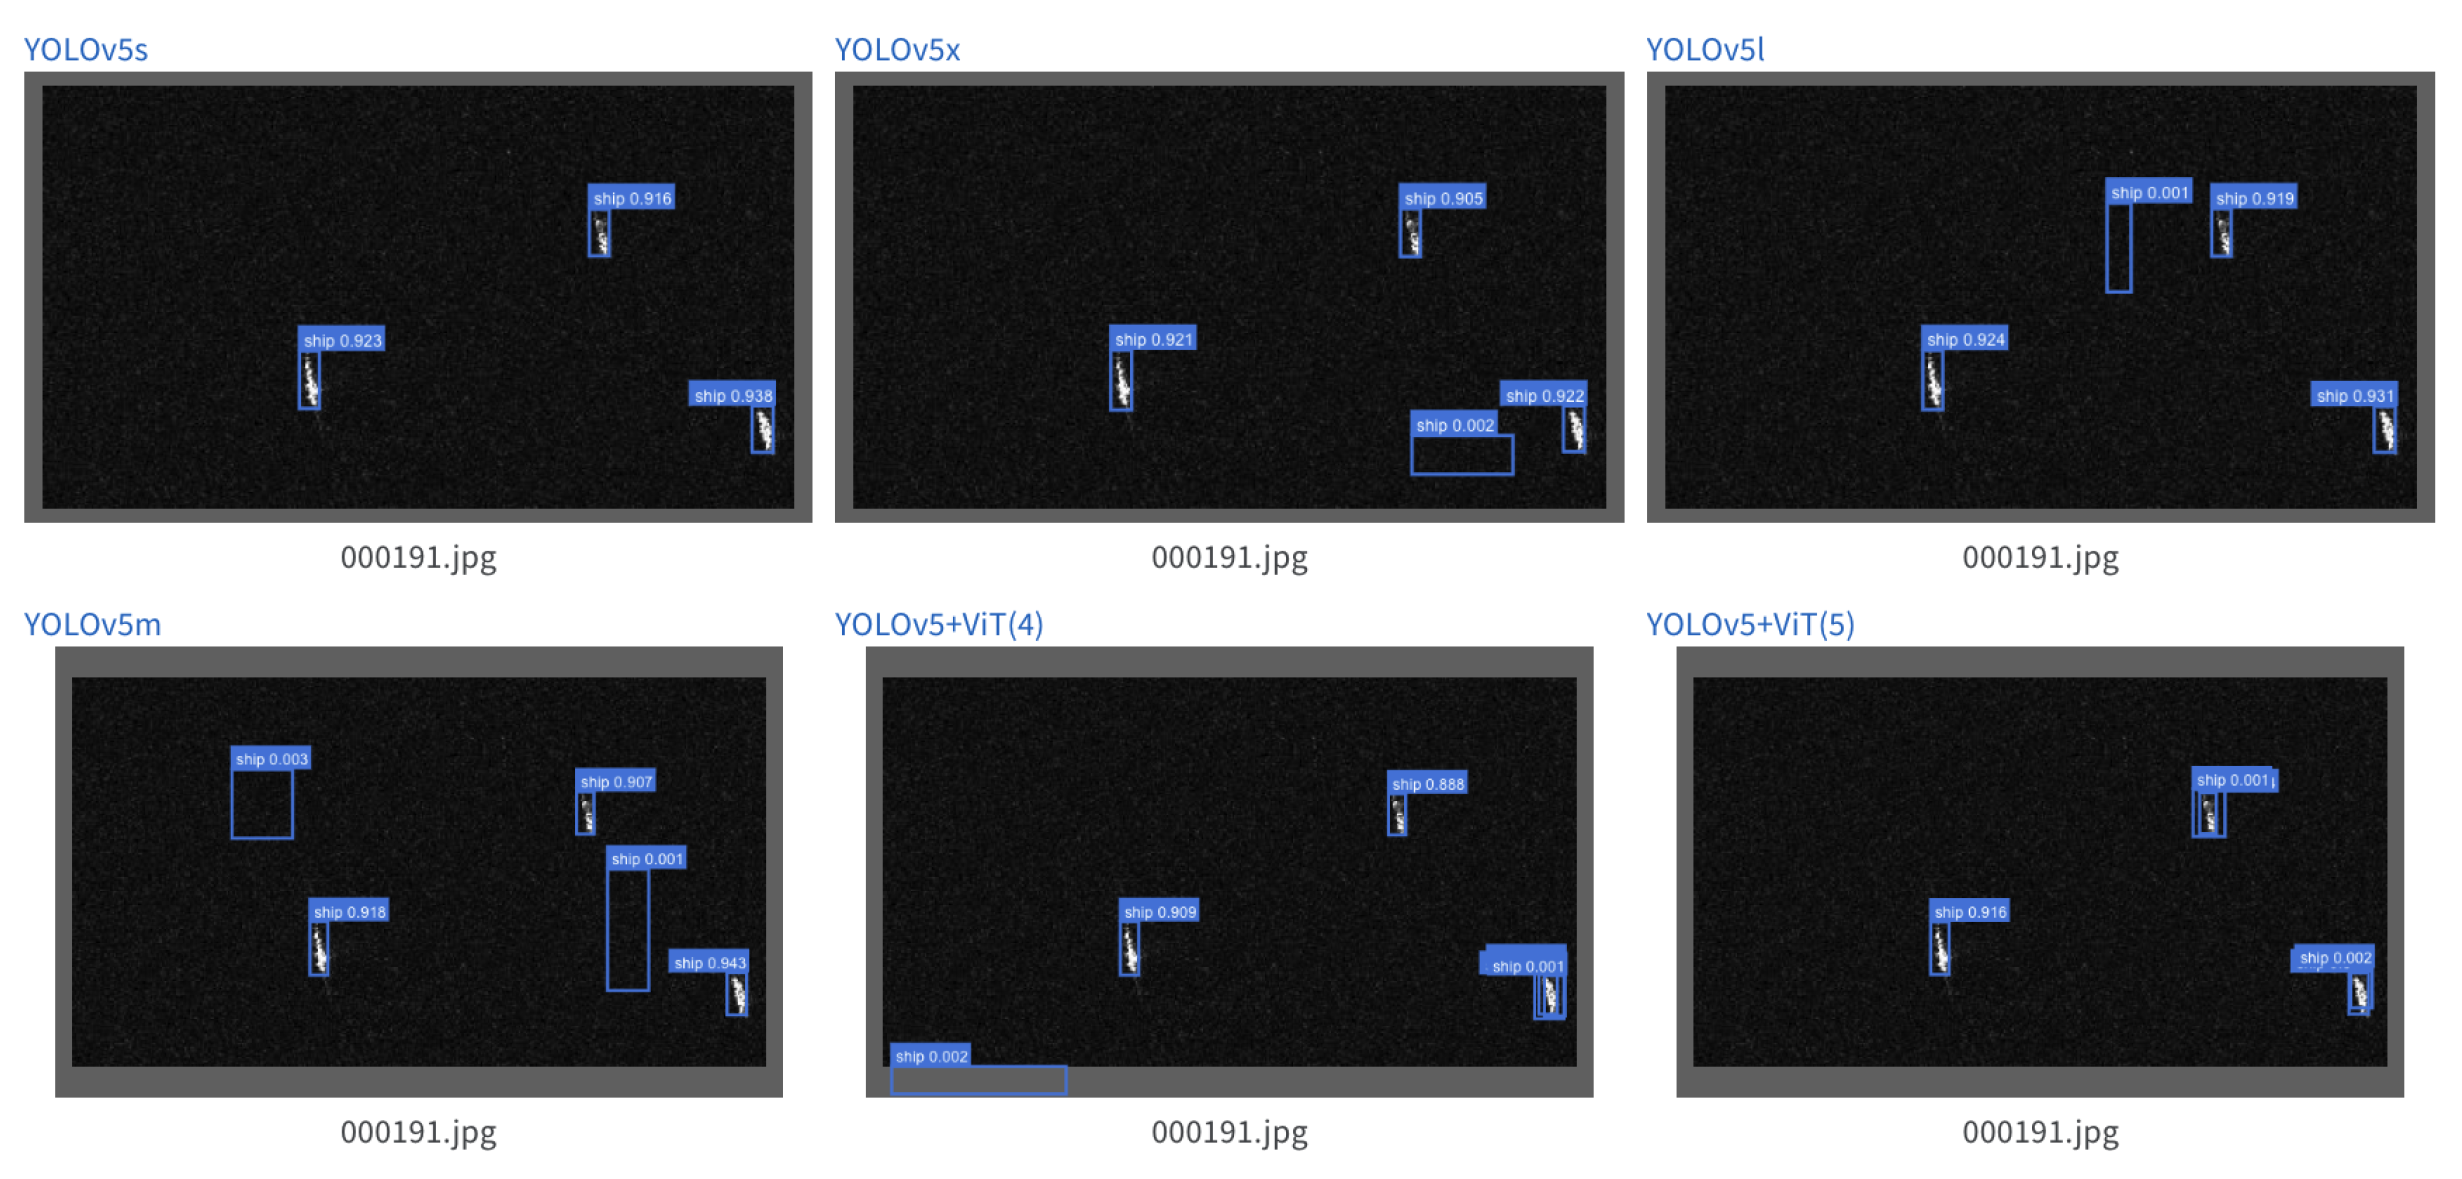
We study the fusion performance of the vision transformer module under the reduced YOLO framework. Choosing a suitable position to integrate the vision transformer module can improve mAP and reduce false alarms;
3.
We compared the model size and performance of classic YOLOv5 models through experiments at different scales. Reducing the number of input channels of the network and adequately controlling the model depth has little effect on detection performance for SAR ship detection tasks. The YOLO-ViTSS has good detection performance and achieves 96.77% m A P 0.5 with a lightweight parameter of 1.3 MB; this is more streamlined than the methods proposed in those articles [26,27,28,29,30];
4.
We calculated computational complexity and energy consumption. The energy consumption of YOLO-ViTSS is only 1/7 of YOLOv5X. Furthermore, it has only an average training power consumption of 151W which means a 0.7-square-meter satellite solar array can meet the power supply requirement; it has excellent potential to port to satellite platforms for on-orbit reasoning and online training, providing a green solution for online IoT access of satellite remote sensing data.

2. Materials and Methods

2.1. A New Paradigm for Remote Sensing Image Interpretation

In recent years, with the rapid development of large-scale satellite constellation technology, the resolution, update frequency, and spectral range of remote sensing data have rapidly increased. Combined with the characteristics of remote sensing data and the new capabilities brought by artificial intelligence, the interpretation technology of remote sensing images has been improved from manual interpretation to an intelligent one marked by rapid investigation and monitoring, scientific diagnosis and analysis, efficient decision-making and management. As shown in Figure 1, the current method of remote sensing intelligent interpretation is to use the HPC server on the ground segment to complete the intelligent interpretation of the remote sensing image after transmitting the remote sensing image data to the ground segment and generating remote sensing products for users.
However, the post-processing and interpretation of remote sensing images on the ground still have certain limitations and room for optimization, such as poor timeliness and large link occupancy. Furthermore, HPC for interpreting remote sensing data will also consume power resources. The consumption of energy resources will increase significantly with the continuous increase in satellites and the generated remote sensing data.
In order to optimize the above problems, this paper proposes a new remote sensing image processing system architecture, as shown in the right half of Figure 1, which transplants the remote sensing interpretation calculation from the ground segment to the space segment. On-board remote sensing interpretation in the space segment has the following advantage:
1.
More environmentally friendly: The satellite uses solar energy. Compared with computing on the ground which consumes the electronic resources on the earth, on-orbit computing uses clean energy provided by satellites to saves the electronic resources on the earth.
2.
More timeliness: The remote sensing satellite are the front end of perception. On-orbit interpretation can complete the early discovery and continuous tracking of the target information of interest.
3.
Easier access to IoT: Only transmitting meaningful semantic information instead of raw remote sensing data could reduce the bandwidth occupied by the inter-satellite link, making it easier to realize the collaborative work of multiple satellites.
4.
Automatically improves the recognition performance of satellites in orbit: On-orbit semi-supervised training of intelligent models could be performed in real orbital work scenarios to improve performance.
However, there are still the following challenges in performing on-orbit interpretation calculations:
1.
Compared with high-performance servers on the ground, the computing power and storage resources on satellites are more limited, so a more lightweight target detection algorithm is required, that is, a neural network model algorithm with lower computational energy consumption and less storage space.
2.
To achieve enough high precision requirements.
Therefore, research on the algorithm of intelligent interpretation with lightweight, high precision, and low power consumption is the core problem. This research intends to focus on the new remote sensing image processing constitution of on-orbit interpretation, and face the practical problem of automatic ship target detection in SAR remote sensing images.
According to the analysis in Section 1, the one-stage target detection framework has more lightweight characteristics. Based on a large number of investigations, we chose the SOTA algorithm YOLOv5 as the baseline technique to build a target detection framework suitable for the satellite platform.

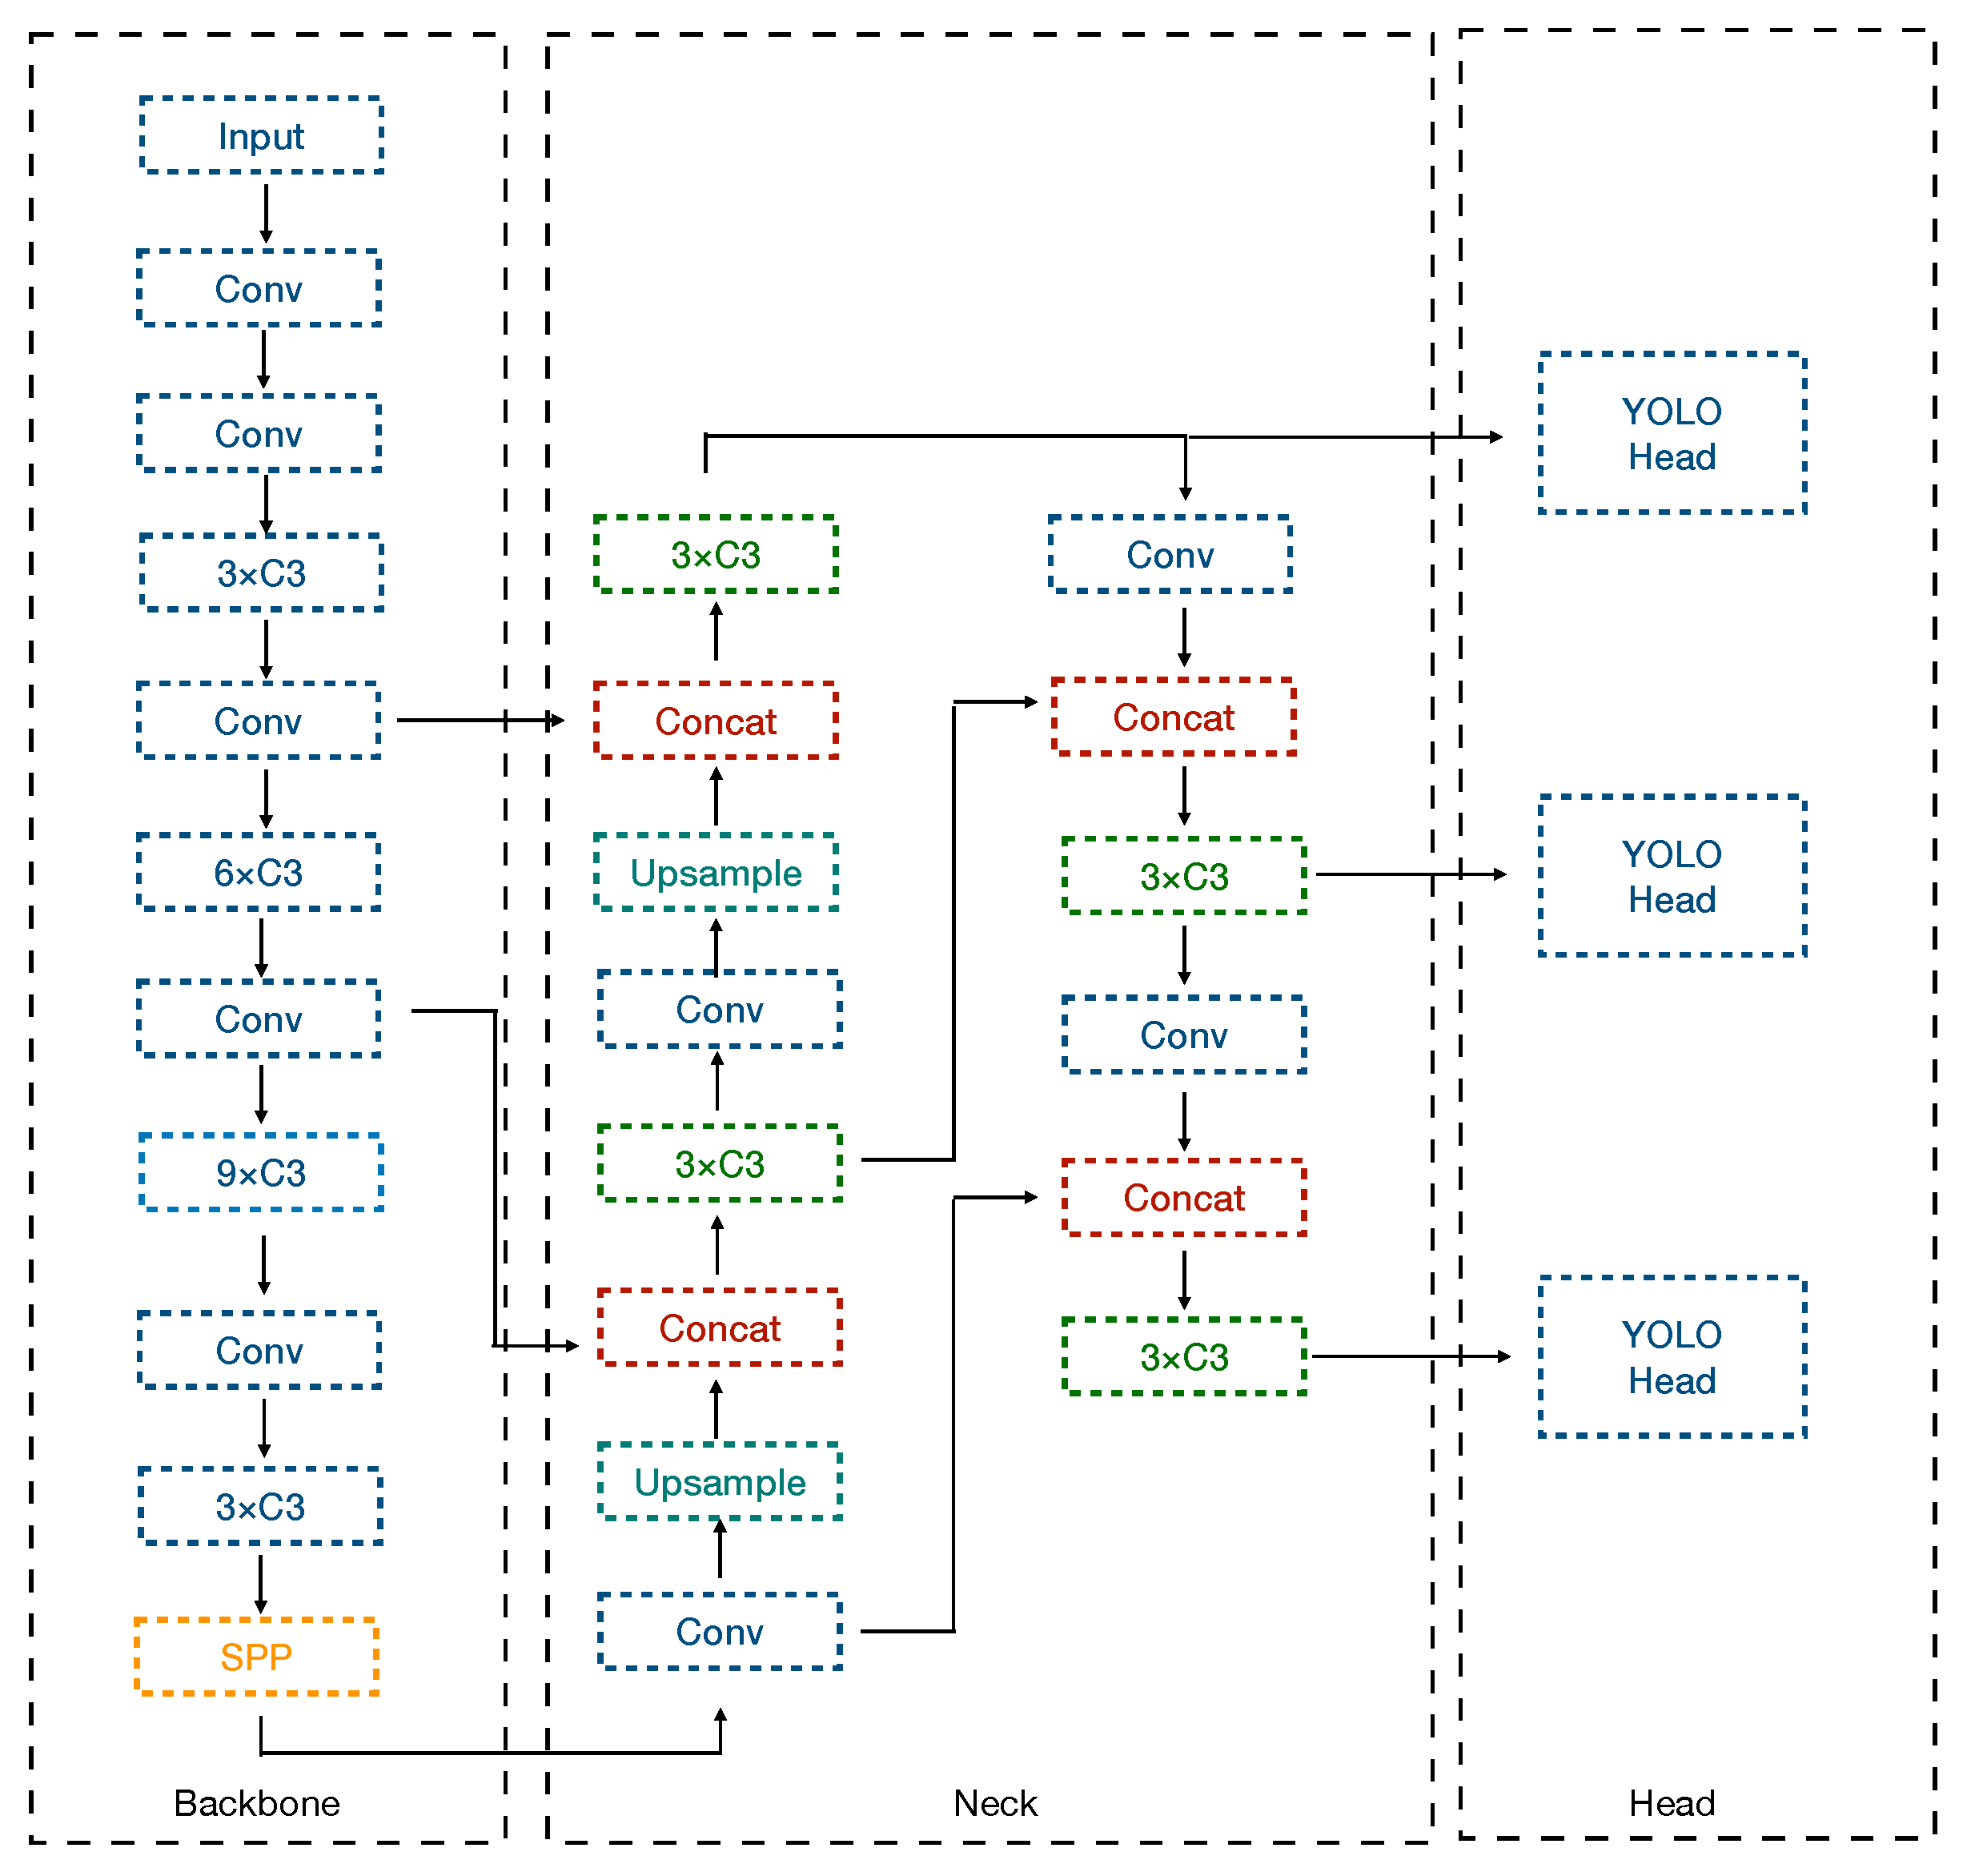
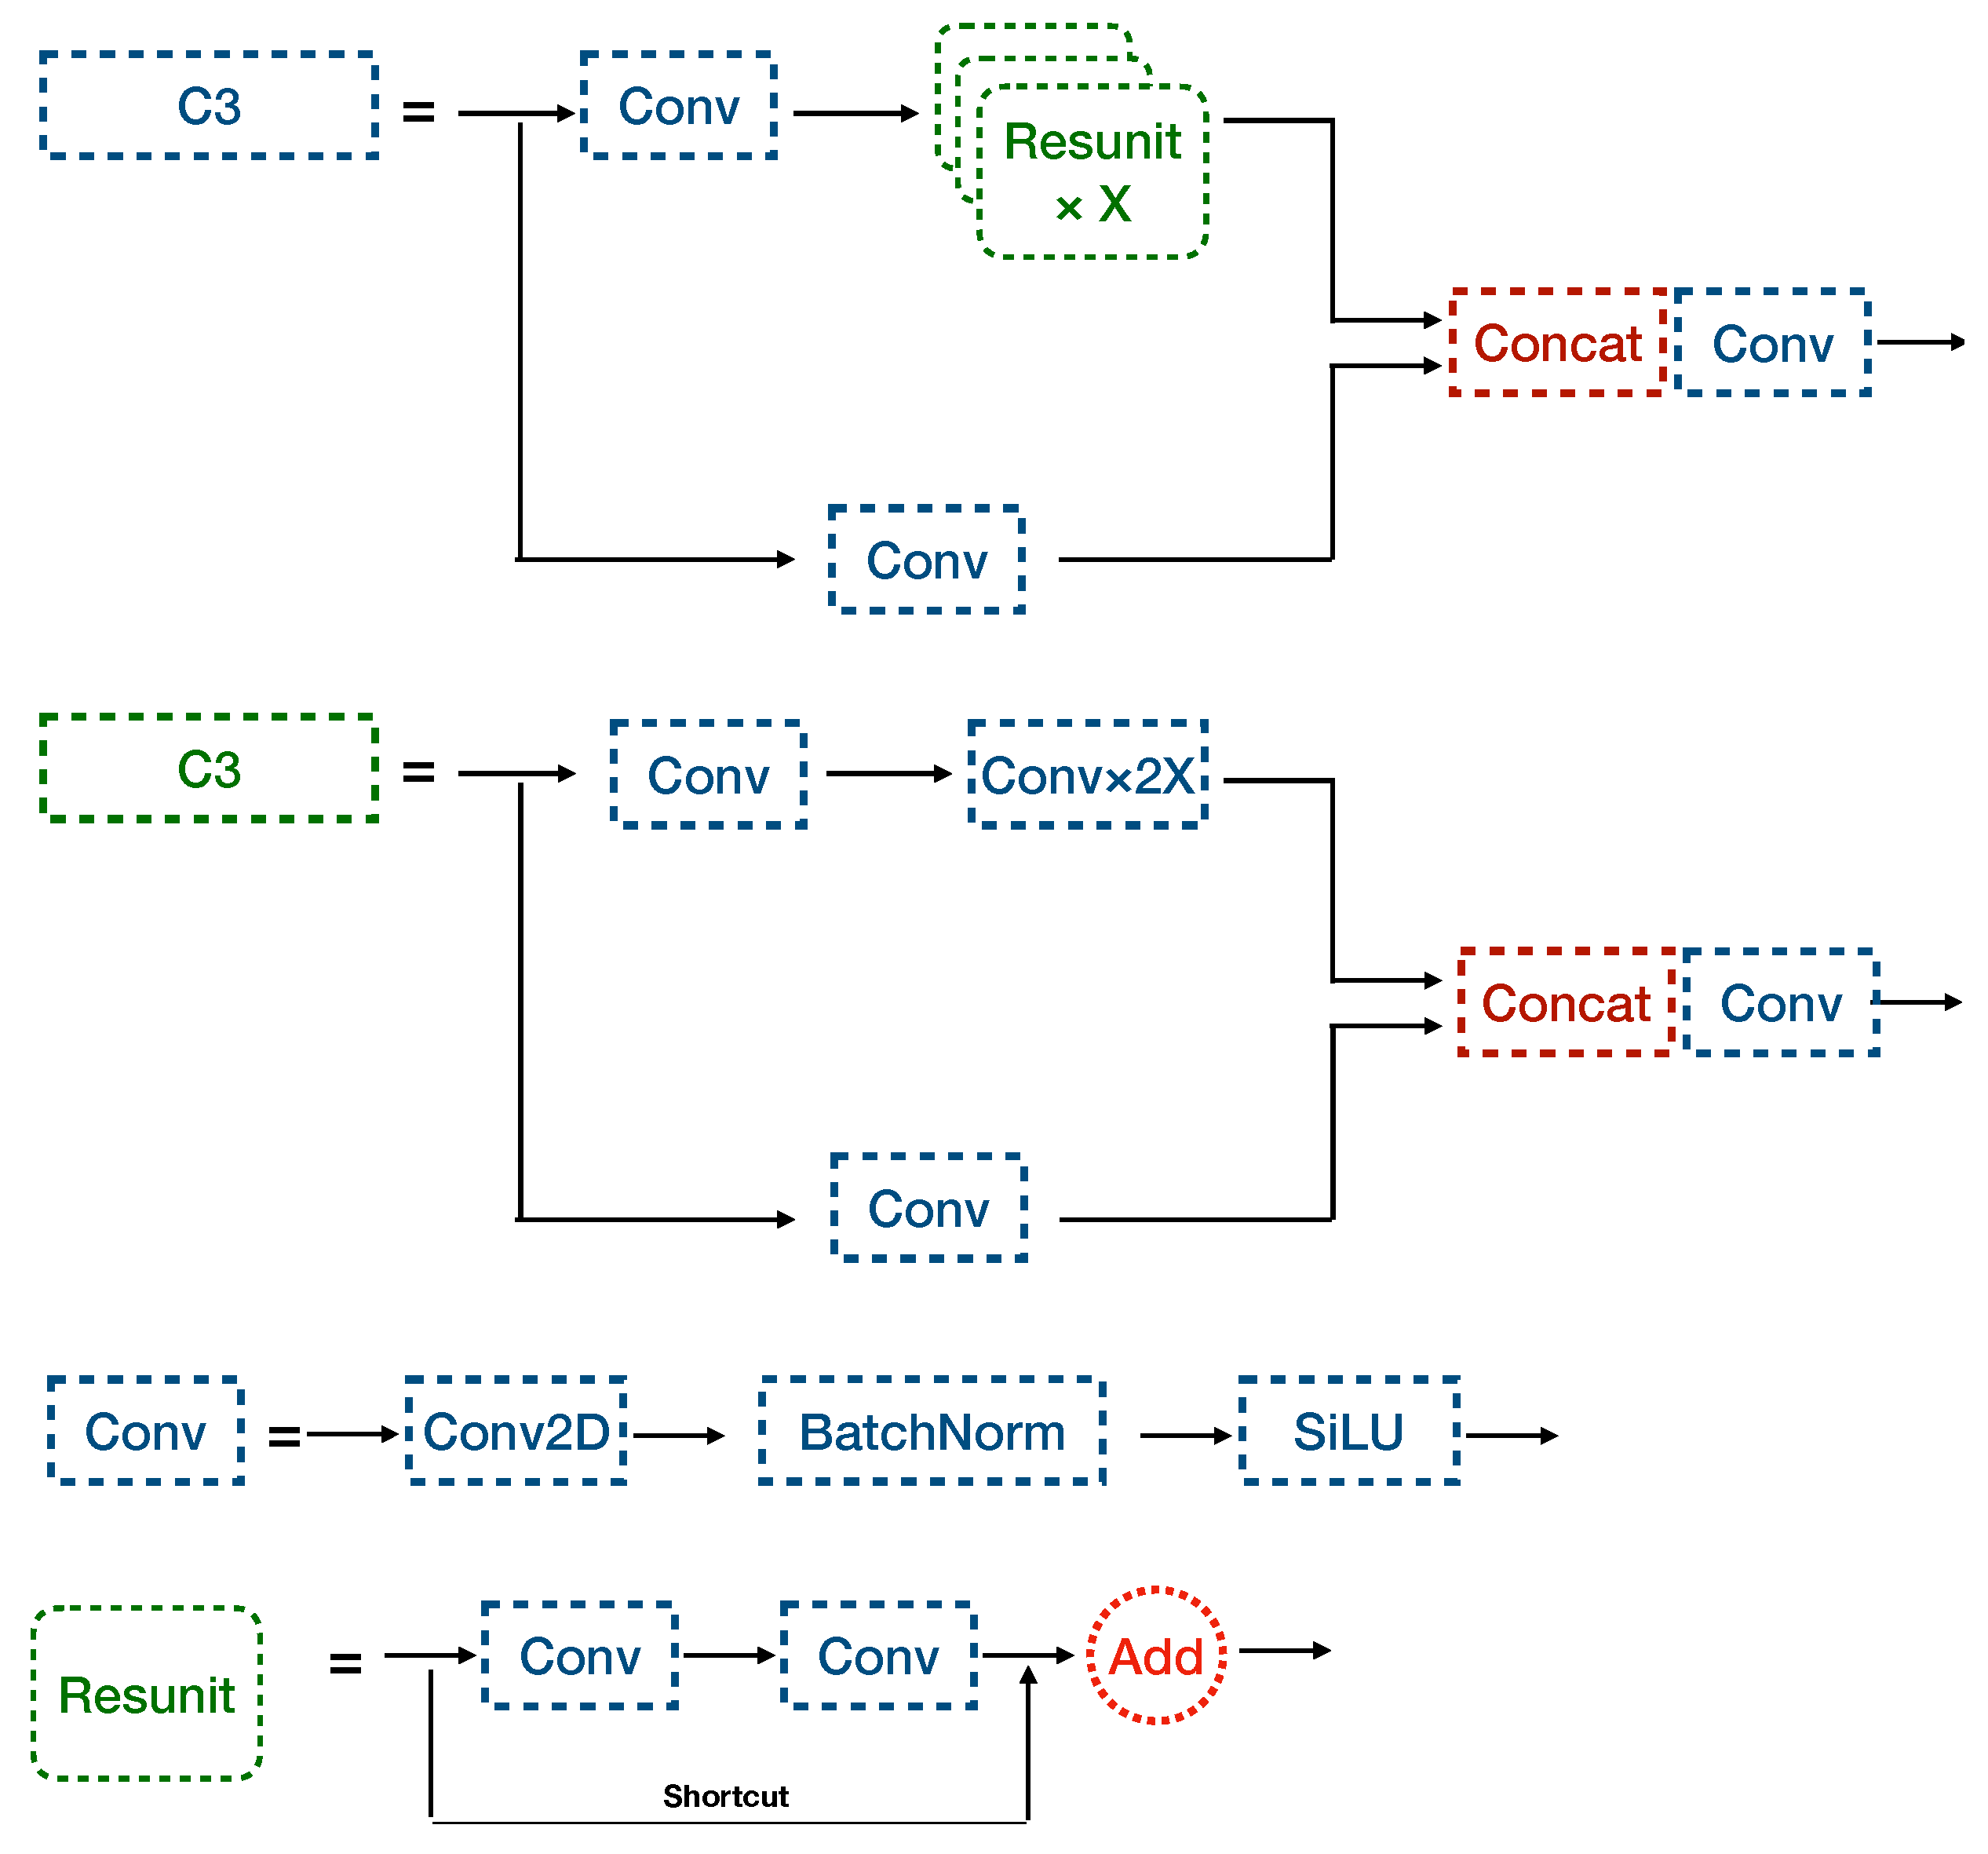
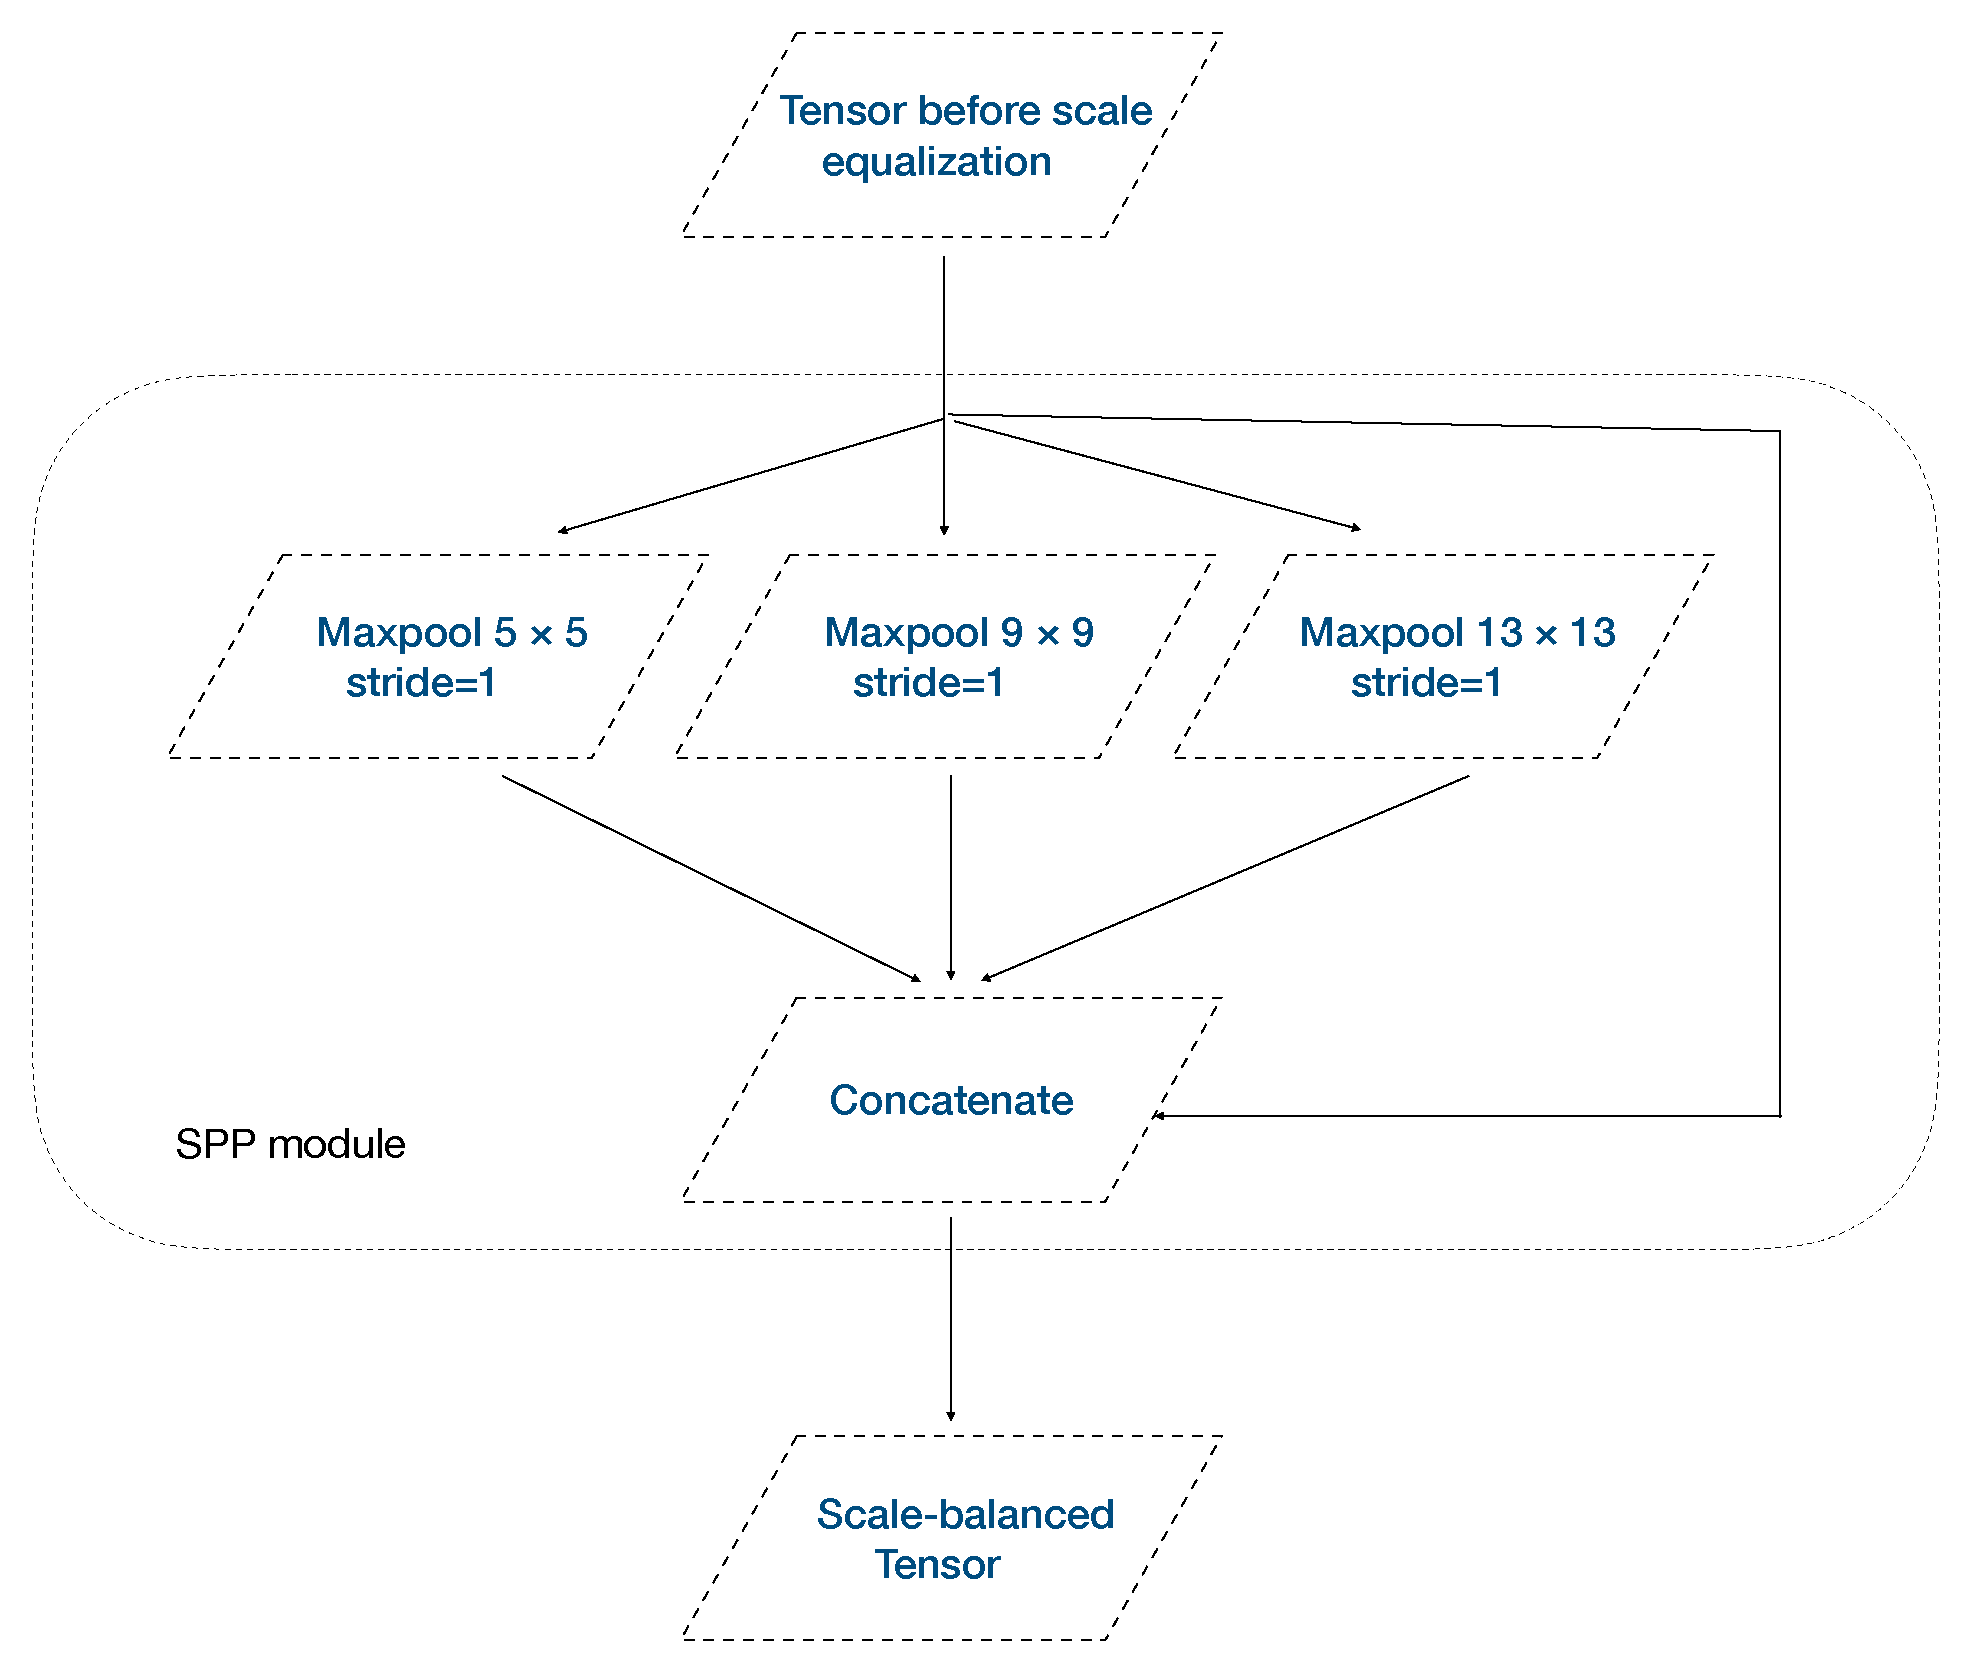
2.2. YOLOv5 Object Detection Framework

The principle of YOLO is to divide the input image tensor into N * N cell grids [18]. If the center of the target is in a grid cell, select that grid cell as the predicted bounding box. Figure 2 shows the architecture of the YOLOv5 detector. The network consists of three parts: the backbone network, the neck network, and the head network. The backbone network is used for feature extraction of input tensors. The neck network is used for collecting multi-scale features and fed to the head. A YOLOv3 [20] detect head used for output multi-scale object detection information in a one-hot form with location and classification information.
Figure 3 shows the structure of the constituent unit: CONV units, C3 units, and an SPP unit. CONV unit performs 2D convolution, batch normalization, and Sigmoid-weighted Linear Unit (SiLU) activation in sequence. SiLU is a special case of the swish function which performs nonlinear smoothing on the ReLU function [34,35]. SiLU is defined as the following equation [35]:
S ( x ) = x · σ ( x ) , where σ ( t ) = ( 1 + exp ( t ) ) 1
The C3 is a Cross Stage Partial (CSP) module, it divides the input tensor into two compute branches, after the calculation, the two branches connect and operate a CONV unit. Two types of C3 units are used in YOLOv5, as shown in Figure 3, the blue C3 unit shows the C3 unit with residual structure applied to the backbone network, and Resunit [36] is a residual structure that avoids depth computation degradation issues in the process; the green C3 unit with no residual structure was used for Neck, and the Resunit was replaced with the CONV unit. Figure 4 shows the Spatial Pyramid Pooling (SPP) module [37]; it concatenates different scale receptive fields to adapt to multi-scale targets.
For binary classification problems, the design of the loss function should consider bounding box loss and object confidence loss synchronously. The object confidence loss is used to reflect the confidence probability that the bounding box contains an object. The confidence prediction is closer to 1, the more likely it is that the center of the object is within this bounding box. O b j e c t C o n f i d e n c e is defined as follows [21]:
O b j e c t   C o n f i d e n c e = P r o b a b i l i t y ( O b j e c t ) I O U p G T
The I O U p G T indices measure the relevance correlation between prediction bounding box and ground truth boundingbox, I O U p G T defined as the following equation:
I O U P G T = B P B G T B P B G T
where B P , B G T describe the predicted bounding box area, and ground truth bounding box, respectively. The confidence loss defined as the following equation [21]:
L c = λ pos i = 0 N 2 j = 0 B I i , j obj C l j ^ log C i j + 1 C ^ l j log 1 C i j λ n e g i = 0 N 2 j = 0 B I i , j obj C l j ^ log C i j + 1 C i j log 1 C l j ^
where N 2 denotes grids quantity, B denotes bounding boxes quantity in each grid, I i , j o b j determine if the bounding box contains an object in the ith grid, when an object exists in the jth bounding box, I i , j o b j equal to 1, otherwise it is 0. C i j ^ denotes the confidence of prediction, C i j denotes the confidence of ground truth. λ p o s and λ n e g used to control the weight of the loss function from bounding box coordinate predictions.

2.3. Proposed Method

Transformers were originally proposed for language modeling [38], and recently vision transformers were applied to computer vision, which has shown promising potential in a variety of tasks, such as recognition, detection, and segmentation [39]. The transformer encoder block can capture global information and abundant contextual information [40]. The structure of the vision transformer is shown in Figure 5.
The basic unit of language information is a word, but a picture is composed of pixels. If a method similar to NLP is used to arrange the pixels into a queue for input, the input dimension has far exceeded the sequence length that the Transformer could carry; therefore, based on this problem, the Vision Transformer proposes a strategy to block the image, that is, the original image is divided into small patches and encoded in blocks.
Figure 5 shows a block composition of VisionTransofomer. The input tensor first passes through Layer Normalization, then passes through a Multi-Head Attention, passes through a residual connection, then passes through Layer Normalization, and finally obtains the output through an MLP and residual connection. Dimensions remain unchanged.
A vision transformer encoder contains two stages with residual connections. One is a multi-head attention layer, and the other is a fully connected MLP layer. The transformer encoder block adds the ability to focus on the current pixel and acquire the semantics of the context. Thus, we use the transformer encoder fuse in the detection framework to avoid the underfitting problem of lightweight networks.
Figure 6 shows our method; we simplified the number of C3 layers in YOLOv5 and reduced the number of input channels to 1/8 to achieve a lightweight baseline detection network. Such a reduced parameter was chosen for two reasons: Firstly, since the SAR ship detection task is a binary classification task; and the SAR image is a grayscale image, the number of color channels is only 1/3 of the optical RGB image, so there is no need for a complex backbone network to extract image features. Secondly, the input channel of 1/8 is selected to ensure that the weight file can adapt to the capability of the aerospace-grade onboard computers. Take a 6U aerospace-grade computer RAD750 [40] as an example, its EEPROM has a storage space of 4 MB, The size of the model file is about 1.3 MB with a 1/8 input channel, which is just enough to achieve double redundancy storage on the computer to avoid data loss in the space radiation environment.
To prevent the underfitting of the shallow network, we fuse the vision transformer module in the baseline network. It is worth noting that to ensure the balance of the entire detection framework and keep the lightweight feature, we also adjust the scale of the transformer. The transformer input channel is reduced to 1/8 and the number of layers is reduced to 1/3 of the paper [31] proposed to match the lightweight detection network. Since we study a lightweight algorithm, the efficiency of the transformer encoder integration within the detection framework is crucial, to study this problem we set different pre-fusion points on the baseline detection framework; the position definition corresponding map is shown in Figure 6. Due to the black-box nature of the neural network model, we set up experiments to investigate different configurations’ performance and energy consumption to find the most efficient fusion configuration.

2.4. Dataset

SAR Ship Detection Dataset (SSDD) [30] is an open-source dataset with a total of 1160 images for evaluating performance in this paper. We divide the dataset into training sets with 928 images and test sets with 232 images. Figure 7 shows examples. The average number of ships per image is 2.12.
We convert the label files from the PASCAL VOC standard to YOLO format, each rectangular bounding box represents each ship label in the dataset; each bounding box contains five parameters, the normalized (from 0 to 1) ship center position (X, Y), the length and width of the rectangle (W, H), and one-bit ship identification marks. Figure 8 shows the labeling method.

3. Results

3.1. Evaluation Methods

Precision rate, Recall rate, and mean Average Precision ( m A P ) indicators are dedicated to evaluating the model’s performance. If the predicted result is true and the ground truth result is also true, the test result is regarded as a true positive ( T P ). If the predicted result is true and the ground truth result is false, the test result is regarded as a false positive ( F P ). If the predicted result is false but the ground truth result is true, the test result is regarded as a false negative ( F N ).
Equation (5) defines the Precision rate. Precision describes the amount of the positives predicted by the detector as true positives. Equation (6) defines the Recall rate. Recall describes the amount of true positive examples recalled by the detector from the perspective of true results. When calculating Precision and Recall separately by gradually lowering the IOU thresholds that consider detections to be true. With Recall on the horizontal axis and Precision on the vertical axis formed precision–recall (P–R) curve; Equation (7) defines the mAP index. It describes the area enclosed by the P–R curve and the coordinate axis and characterizes the model’s combined performance in terms of Precision and Recall. The experiments are implemented on an Nvidia RTX-2070 Super GPU.
P r e c i s i o n = T P T P + F P
R e c a l l = T P T P + F N
m A P = 0 0 P ( R ) d R

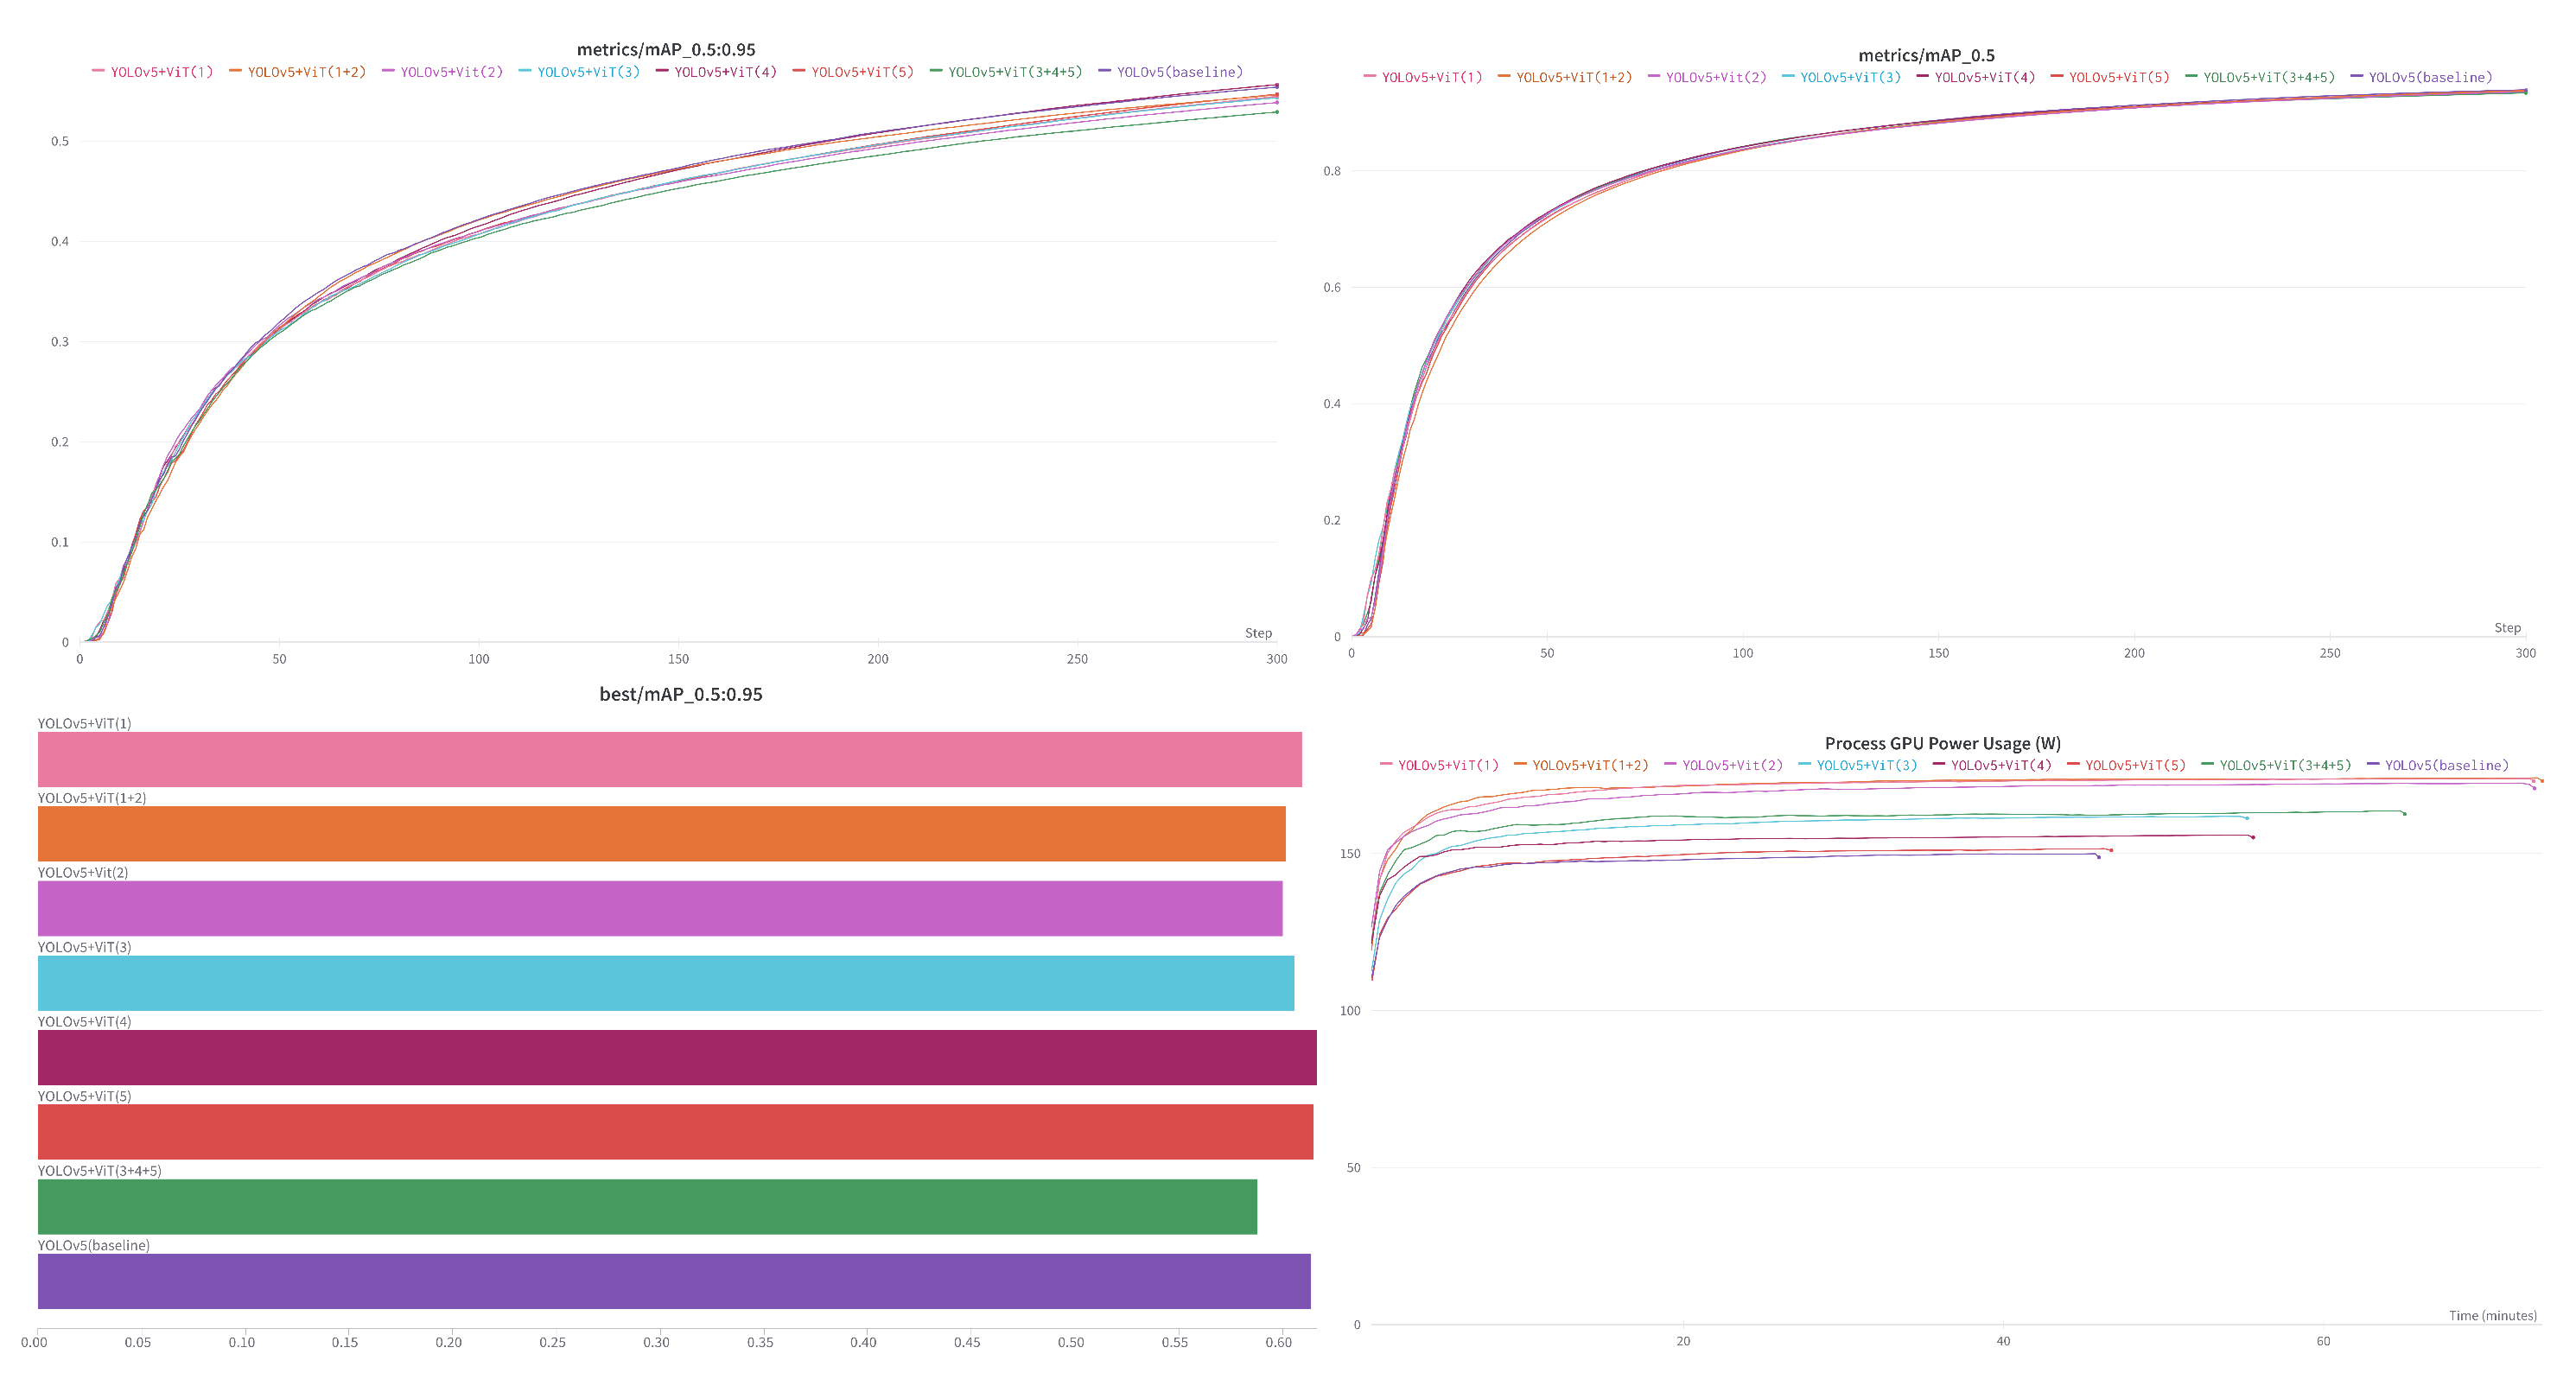
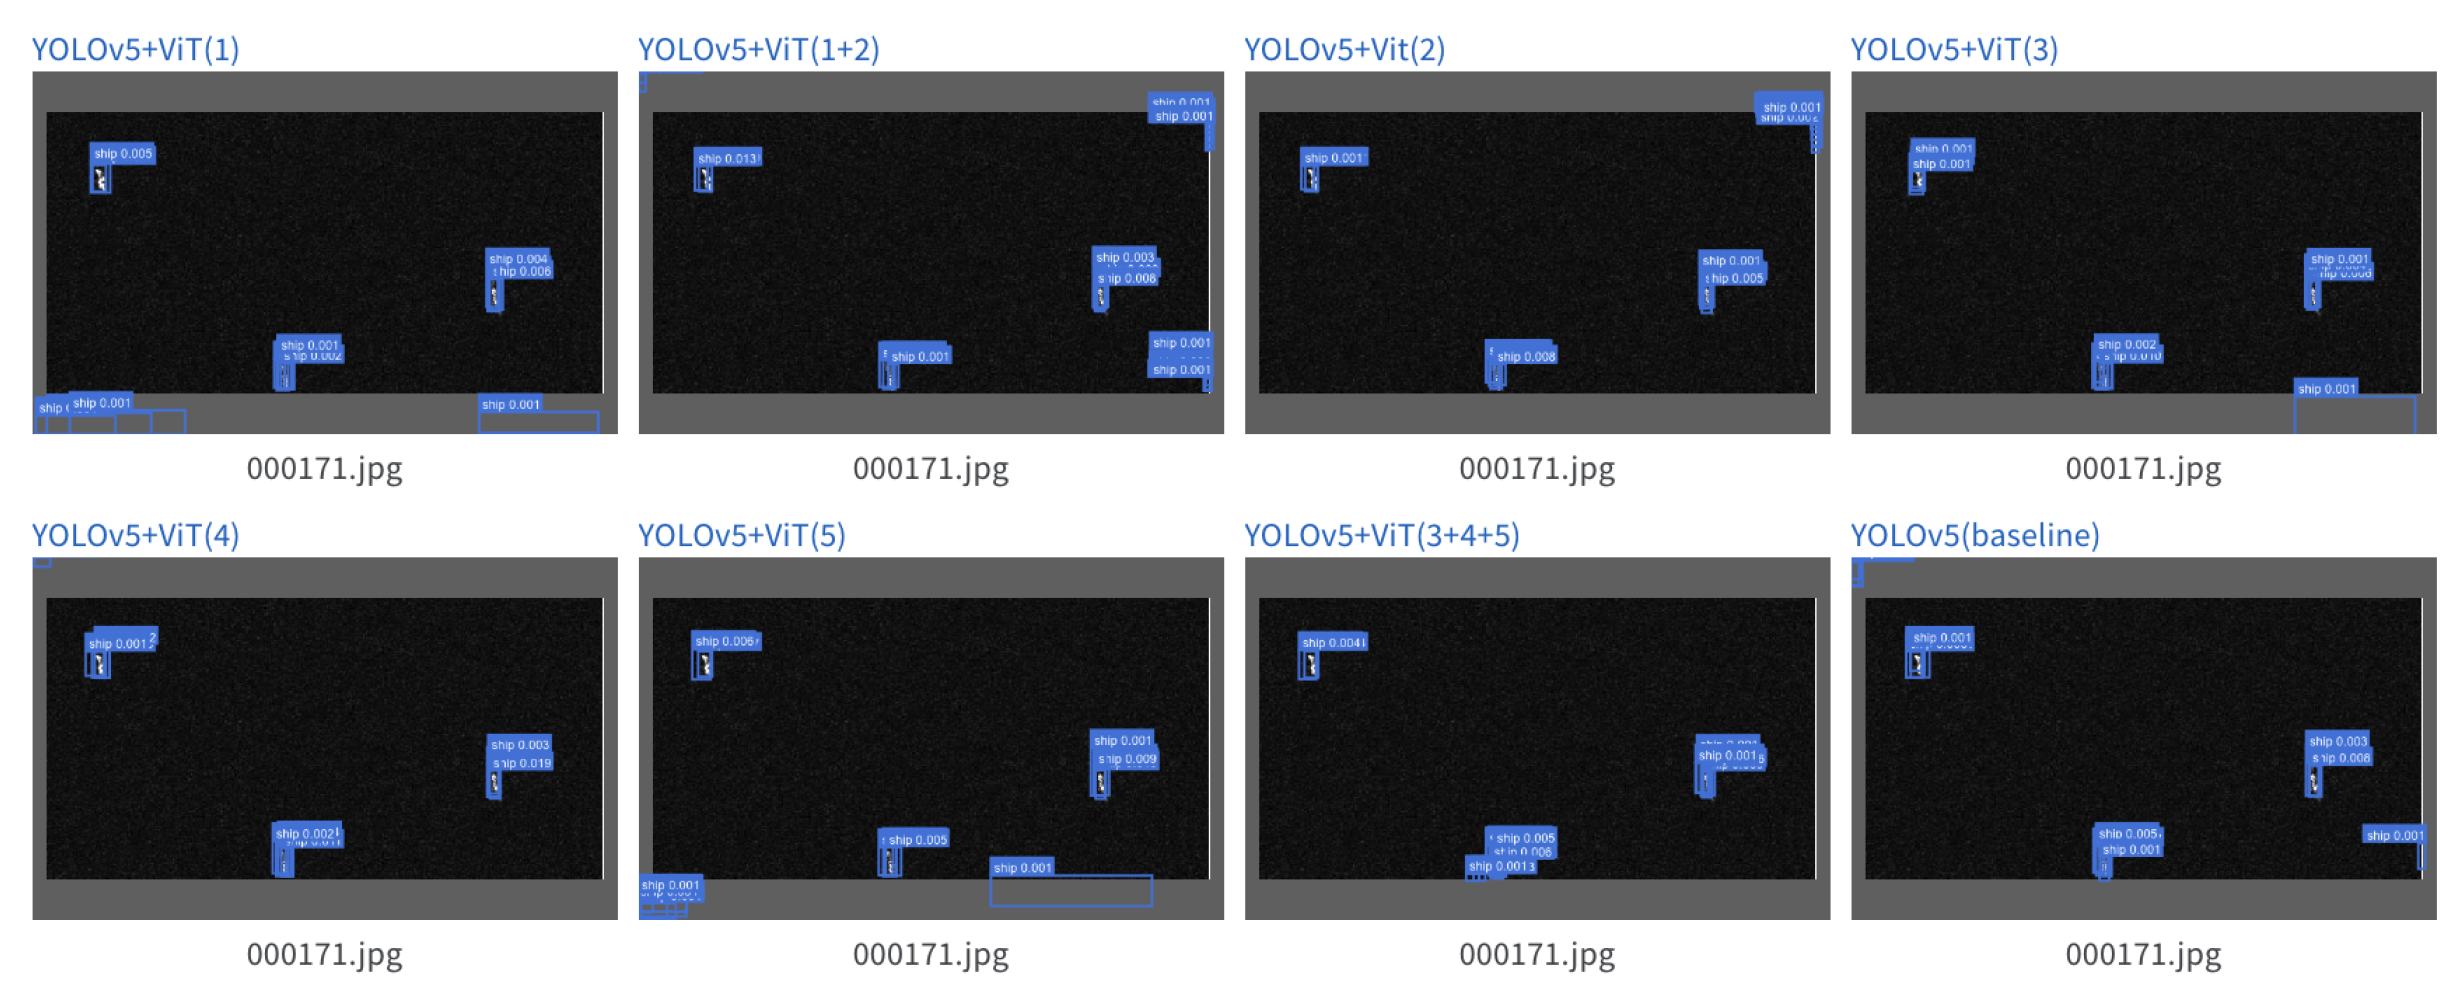
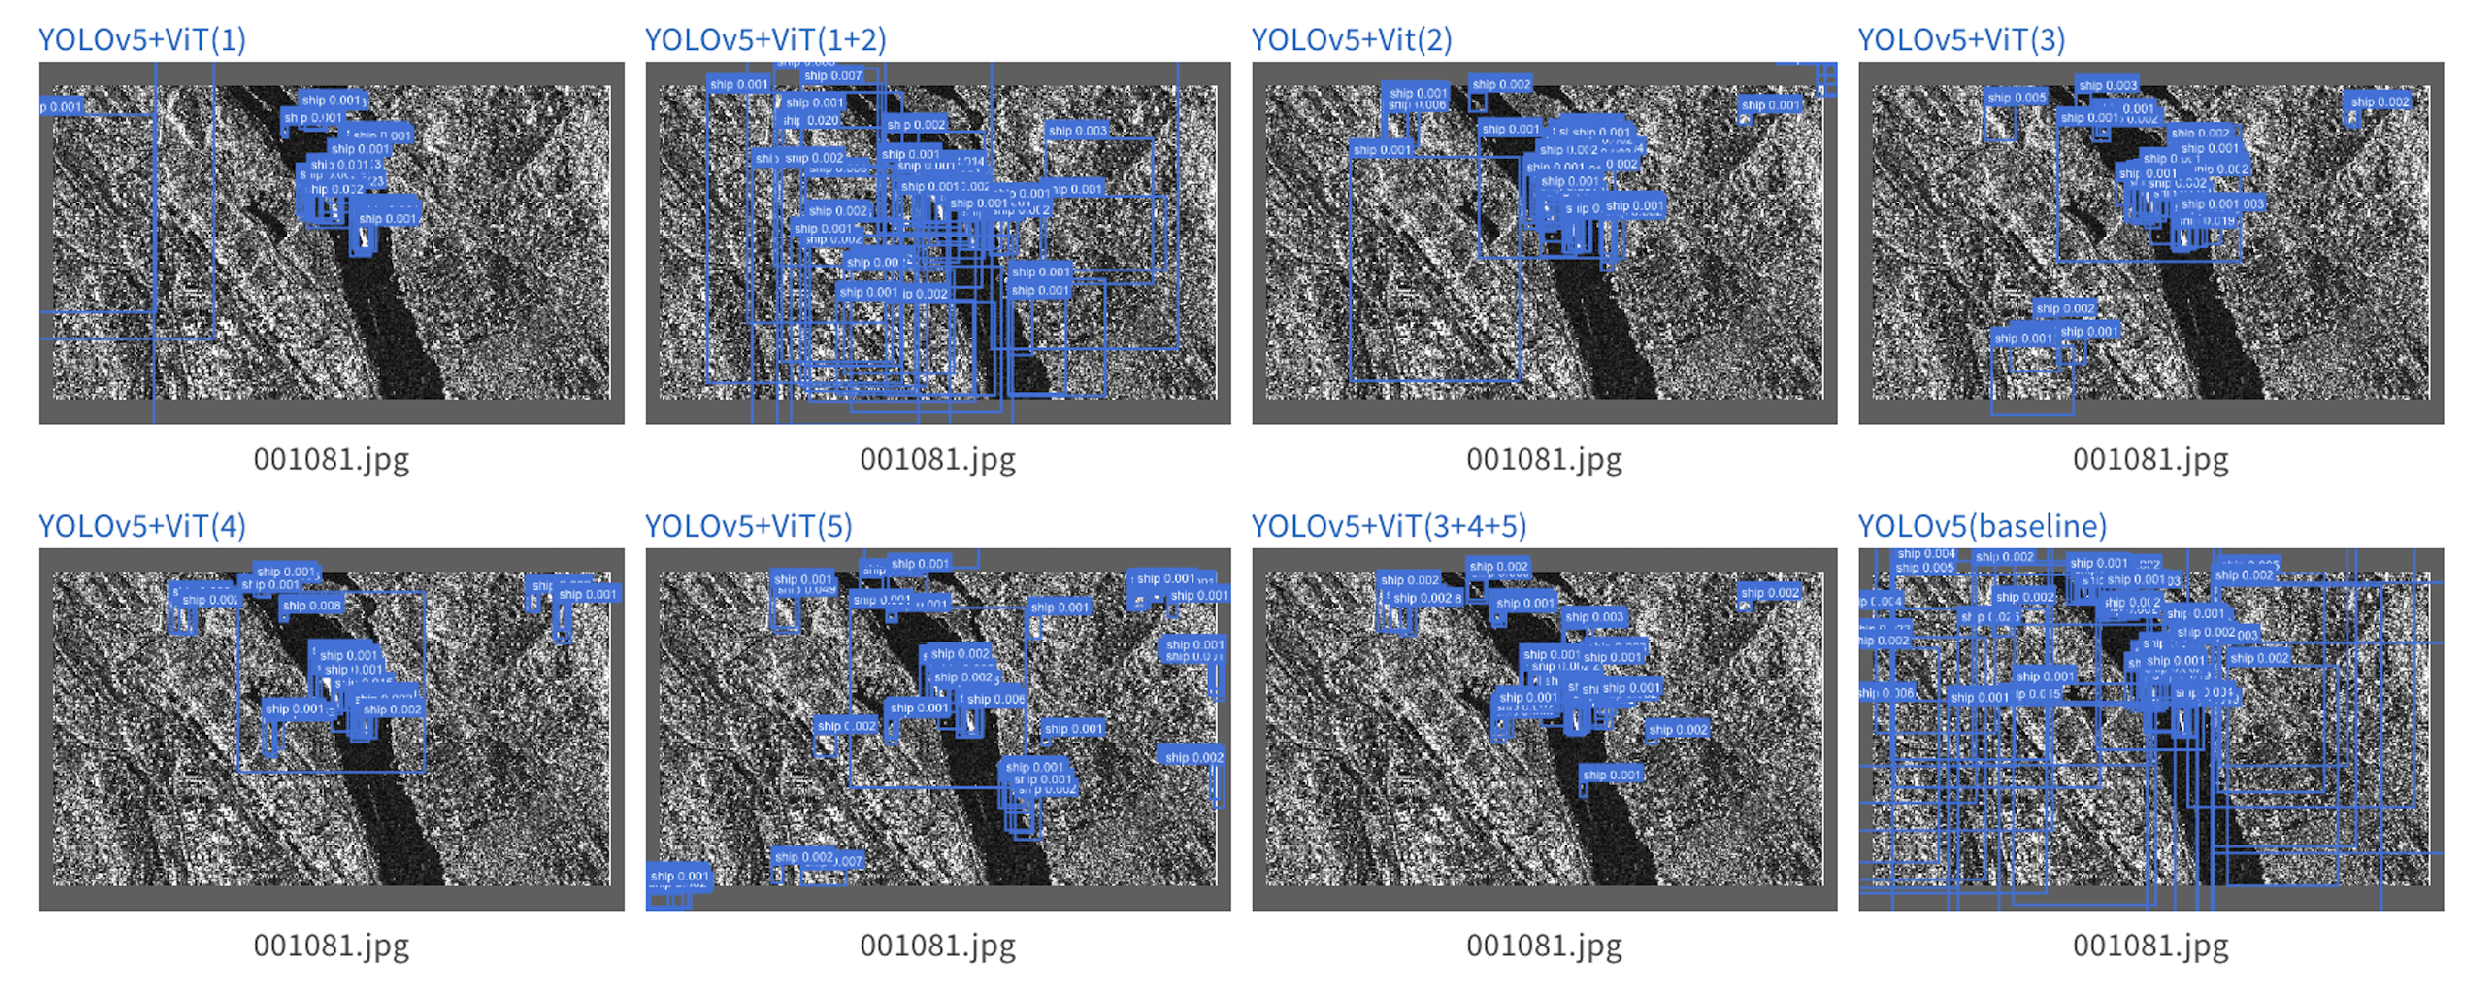
3.2. Experiment 1: Fusion Configuration Research

Firstly, we evaluate the performance of the transformer encoder fuse with the detection framework. We select five pre-fusion positions in the baseline detection networks shown in Figure 6; we add the transformer encoder, train, and test different configuration module’s performance separately according to the corresponding relationship. Hyperparameter settings: SGD optimizer with 0.01 learning rate; the batch size is set to 16. the number of workers is set to 8; After 300 epochs, Table 1 listed the results.
We count the power consumption of the GPU in the calculation process. Figure 9 plots the mAP–Epoch curve and GPU power usage–training time curve. We can see that different configurations also correspond to different training times and power, fusing the transformer module in the neck position can achieve higher performance gains, as well as relatively low training power consumption.
By comparing the training time and power consumption of the baseline and the proposed method, it can be seen that adding the transformer module increases the computational complexity. In addition, by observing the experimental data, adding a transformer module on Position 1 and Position 2 significantly results in longer training time and higher training power consumption than adding a transformer module on Position 3, Position 4, and Position 5, which is due to the matching for the multiple layers of the backbone network, the transformer encoder with a corresponding multiple, as shown in Figure 6. Furthermore, the front part of the network has a higher resolution feature map than the end of the network. Thus, fusing the transformer encoder in the backbone brings higher computational complexity than fusing the transformer encoder in the neck.
Interestingly, although the computational cost of integrating the transformer at the end of the network is not high, it brings a significant improvement in mAP. We can find that by adding the transformer module in Position 4 and Position 5, the model performance metrics have been improved. In other words, fusing the transformer module at the end of the network to capture more “global” context information in the low-resolution feature map, is more efficient for improving performance.

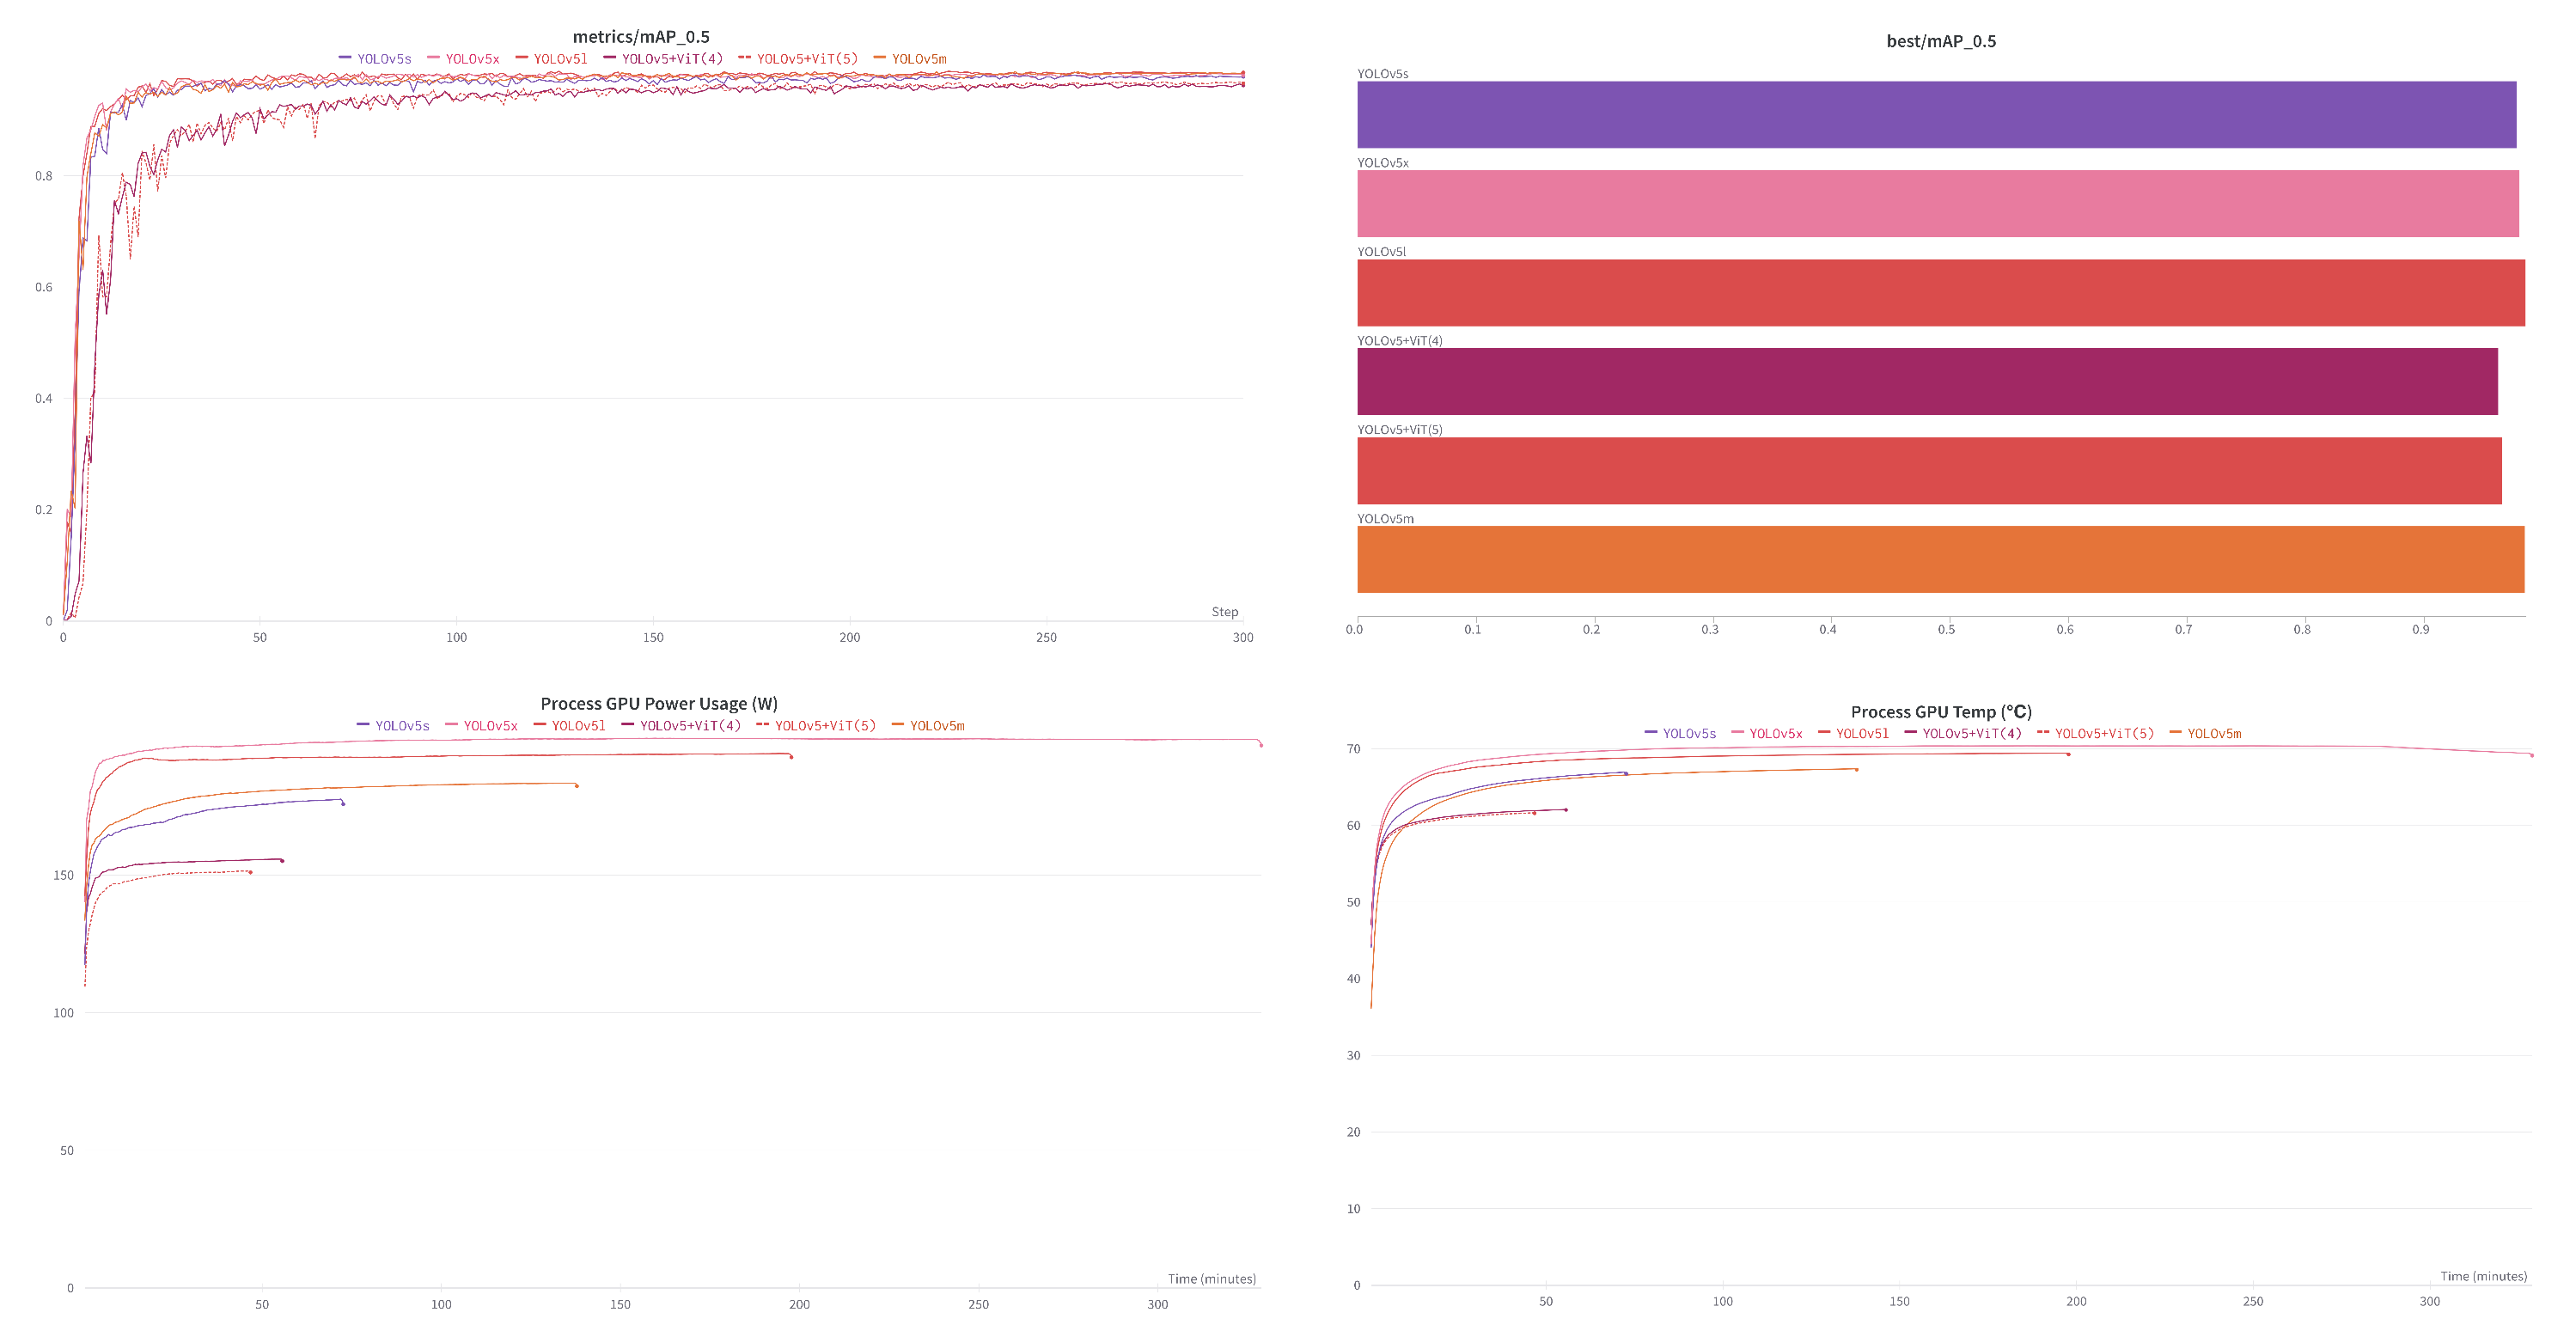
3.3. Experiment 2: Module Scale Research

This experiment studies the performance comparison between the proposed method with different scales of classic YOLOv5 modules with Small, Medium, Large, and X large scales. Table 2 and Figure 10 show the test result.
As shown in Figure 10, the best performing model is YOLOv5L with m A P 0.5 = 98.56%, the YOLOv5 + ViT(5) m A P 0.5 = 96.60%, which is 1.96% lower than YOLOv5L. However, the parameters of the proposed method in this paper are only 1.3 M, which is only 1.5% of the YOLOv5X. It can be seen from the training time and the average power consumption of the GPU that the proposed methods are more environmentally friendly and energy-saving. For example, the training process of YOLOv5 + ViT(4) lasts 55.6 min, and the average power consumption is 155 W while training a YOLOv5X model, the energy consumption is 7.8 times that of YOLOv5 + ViT(4). The method proposed in this paper is lightweight and low training power consumption and is especially suitable for deployed on satellites for onboard reasoning and online learning.

4. Discussion

We evaluated the performance of the vision transformer encoder at different positions integrated with the lightweight framework. The experimental results show that integrating the vision transformer encoder in the neck (Position 4 and Position 5) can make the model more efficient. In this section, we analyze the visualization results, that is Bounding-box generated before Non-Maximum Suppression (NMS).
Figure 11 shows an offshore scene; we can see that the bounding box generate by YOLOv5 + ViT(4) is more focused on the target. This shows that the integrated vision transducer encoder in the neck effectively improves the detection performance.
Figure 12 proves the above point again, integrated vision transformer encoder in the neck (YOLOv5 + ViT(4)) effectively reduces false alarms caused by river bank textures.
Figure 13 shows the comparison with the different scales of YOLOv5. Interestingly, although the YOLOv5 + ViT(5) model parameters are less than others, it also effectively avoids false alarms. Compared with the optical image, the SAR image has only one gray channel, and the ocean remote sensing has an only gray background. The features are relatively single, so there is no need to obtain redundant feature extraction. Furthermore, the YOLOv5 detector is easily disturbed by the noise in the SAR image, mistakenly detected noise as a ship, and leads to a false alarm phenomenon occurring. The detector combines the vision transformer and suppresses the false alarms. From this point of view, YOLO − ViTSS has an anti-noise ability. This is because, due to the integration of the vision transformer encoder, the model not only pays attention to the pixel information of the corresponding channel but also pays attention to the context information, which effectively reduces the false alarm caused by noise, which is suitable for SAR images with inherent coherent noise especially. We call the proposed model, which fuses with the vision transformer module in the neck: YOLO with the Vision Transformer encoder for SAR Ship Detection(YOLO − ViTSS). Experiments show that YOLO−ViTSS has good anti-noise performance and is very lightweight and energy-saving, it can be deployed on spaceborne computers with limited computing power for online training and on-orbit detection, transplanting the YOLO−ViTSS to the remote sensing satellite platform will be an important future work. Furthermore, another important future work is exploring interpretability and setting up cross-validation training, it will be an effective technical route to further improve the generalization ability of the model and reduce the parameters.

5. Conclusions

The vigorous development of the commercial aerospace industry and the interconnection of everything in the intelligent world has become an irreversible trend. Satellite remote sensing has entered the era of a big data link with IoT. Compared with traditional remote sensing data interpretation calculations on the ground that consume electricity resources on the earth, it is more environmentally friendly to run high-performance computing with solar power from satellites in orbit. Although the energy savings of a satellite may be negligible. However, with the construction of giant constellations, if the satellites are fully utilized for high-performance computing, the savings in power resources on Earth will be considerable.
On-orbit interpretation gives remote sensing images an expanse of application space. The experiment performance shows that our method is effective. YOLO-ViTSS has anti-noise ability, lightweight characteristics, and energy-saving. The model size of 1.31 MB and computational complexity is 1.1GFLOPs can be easily integrated into the satellite computing platform. The average training power consumption of 151 W can be powered by a 0.7-square-meter satellite solar array, which can meet the microsatellites’ power supply. YOLO-ViTSS has great potential deployed to the onboard computer on SAR satellite constellations to build a novel real-time, online training supportable, online IoT accessible, eco-friendly, and sustainable SAR image interpretation mode.

Author Contributions

Conceptualization, F.X.; Data curation, F.X. and S.L.; Formal analysis, F.X.; Funding acquisition, F.X., Y.L. and B.L.; Investigation, F.X. and B.L.; Methodology, F.X.; Project administration, B.L.; Resources, F.X.; Software, F.X.; Supervision, H.L. and Y.L.; Validation, F.X.; Visualization, F.X.; Writing—original draft, F.X.; Writing—review & editing F.X. All authors have read and agreed to the published version of the manuscript.

Funding

This research received no external funding.

Institutional Review Board Statement

Not applicable.

Informed Consent Statement

Not applicable.

Data Availability Statement

Not applicable.

Conflicts of Interest

The authors declare no conflict of interest.

References

  1. Li, W.; Awais, M.; Ru, W.; Shi, W.; Ajmal, M.; Uddin, S.; Liu, C. Review of sensor network-based irrigation systems using IoT and remote sensing. Adv. Meteorol. 2020, 2020, 8396164. [Google Scholar]
  2. Guilhot, D.; Hoyo, T.; Bartoli, A.; Ramakrishnan, P.; Leemans, G.; Houtepen, M.; Salzer, J.; Metzger, J.; Maknavicius, G. Internet-of-Things-Based Geotechnical Monitoring Boosted by Satellite InSAR Data. Remote. Sens. 2021, 13, 2757. [Google Scholar] [CrossRef]
  3. Wei, W.; Gao, Z.; Gao, S.; Jia, K. A SINS/SRS/GNS Autonomous Integrated Navigation System Based on Spectral Redshift Velocity Measurements. Sensors 2018, 18, 1145. [Google Scholar]
  4. Stasolla, M.; Mallorqui, J.; Margarit, G.; Santamaria, C.; Walker, N. A comparative study of operational vessel detectors for maritime surveillance using satellite-borne synthetic aperture radar. IEEE J. Sel. Top. Appl. Earth Obs. Remote. Sens. 2016, 9, 2687–2701. [Google Scholar] [CrossRef] [Green Version]
  5. Ben-Larbi, M.; Pozo, K.; Haylok, T.; Choi, M.; Grzesik, B.; Haas, A.; Krupke, D.; Konstanski, H.; Schaus, V.; Fekete, S.; et al. Towards the automated operations of large distributed satellite systems. Part 1: Review and paradigm shifts. Adv. Space Res. 2016, 67, 3598–3619. [Google Scholar]
  6. Michailidis, E.; Potirakis, S.; Kanatas, A. AI-Inspired Non-Terrestrial Networks for IIoT. Rev. Enabling Technol. Appl. IoT 2016, 1, 3598–3619. [Google Scholar]
  7. Lin, Y.; Fan, Y.; Jiang, C.; Wang, Z.; Shao, W. MIMO SAR Using Orthogonal Coding: Design, Performance Analysis, and Verifications. Int. J. Antennas Propag. 2015, 3, 1–10. [Google Scholar]
  8. Gao, X.; Roy, S.; Xing, G. MIMO-SAR: A hierarchical high-resolution imaging algorithm for mmWave FMCW radar in autonomous driving. IEEE Trans. Veh. Technol. 2021, 70, 7322–7334. [Google Scholar] [CrossRef]
  9. Younis, M.; Krieger, G.; Moreira, A. MIMO SAR techniques and trades. In Proceedings of the European Radar Conference (EuRAD), Nuremberg, Germany, 9–11 October 2013. [Google Scholar]
  10. Wang, W.Q. MIMO SAR imaging: Potential and challenges. Aerospace and Electronic Systems Magazine. Aerosp. Electron. Syst. Mag. 2013, 28, 18–23. [Google Scholar]
  11. Krizhevsky, A.; Sutskever, I.; Hinton, G. Imagenet classification with deep convolutional neural networks. Adv. Neural Inf. Process. Syst. 2012, 25. Available online: https://proceedings.neurips.cc/paper/2012/file/c399862d3b9d6b76c8436e924a68c45b-Paper.pdf (accessed on 1 May 2022). [CrossRef]
  12. Girshick, R.; Donahue, J.; Darrell, T.; Malik, J. Rich feature hierarchies for accurate object detection and semantic segmentation. In Proceedings of the IEEE Conference on Computer Vision and Pattern Recognition, Columbus, OH, USA, 23–28 June 2014; pp. 580–587. [Google Scholar]
  13. Girshick, R. Fast r-cnn. In Proceedings of the IEEE International Conference on Computer Vision, Santiago, Chile, 7–13 December 2015; pp. 1440–1448. [Google Scholar]
  14. Ren, S.; He, K.; Girshick, R.; Sun, J. Faster r-cnn: Towards real-time object detection with region proposal networks. Adv. Neural Inf. Process. Syst. 2015, 28. Available online: https://proceedings.neurips.cc/paper/2015/file/14bfa6bb14875e45bba028a21ed38046-Paper.pdf (accessed on 1 May 2022). [CrossRef] [PubMed] [Green Version]
  15. He, K.; Zhang, X.; Ren, S.; Sun, J. Spatial pyramid pooling in deep convolutional networks for visual recognition. IEEE Trans. Pattern Anal. Mach. Intell. 2015, 37, 1904–1916. [Google Scholar] [CrossRef] [PubMed] [Green Version]
  16. Lin, T.Y.; Goyal, P.; Girshick, R.; He, K.; Dollár, P. Focal loss for dense object detection. In Proceedings of the IEEE International Conference on Computer Vision, Venice, Italy, 22–29 October 2017; pp. 2980–2988. [Google Scholar]
  17. Liu, W.; Anguelov, D.; Erhan, D.; Szegedy, C.; Reed, S.; Fu, C.Y.; Berg, A. SSD: Single shot multibox detector. In Proceedings of the European Conference on Computer Vision, Honolulu, HI, USA, 21–26 July 2017; pp. 21–37. [Google Scholar]
  18. Redmon, J.; Divvala, S.; Girshick, R.; Farhadi, A. You only look once: Unified, real-time object detection. In Proceedings of the IEEE Conference on Computer Vision and Pattern Recognition, Las Vegas, NV, USA, 27–30 June 2016; pp. 779–788. [Google Scholar]
  19. Redmon, J.; Farhadi, A. YOLO9000: Better, faster, stronger. In Proceedings of the IEEE Conference on Computer Vision and Pattern Recognition, Honolulu, HI, USA, 21–26 July 2017; pp. 7263–7271. [Google Scholar]
  20. Redmon, J.; Farhadi, A. Yolov3: An incremental improvement. arXiv 2018, arXiv:1804.02767. [Google Scholar]
  21. Bochkovskiy, A.; Wang, C.Y.; Liao, H.Y. Yolov4: Optimal speed and accuracy of object detection. arXiv 2020, arXiv:2004.10934. [Google Scholar]
  22. Ultralytics Yolov5. Available online: https://github.com/ultralytics/yolov5 (accessed on 2 February 2022).
  23. Zhao, H.; Zhou, Y.; Zhang, L.; Peng, Y.; Hu, X.; Peng, H.; Cai, X. Mixed YOLOv3-LITE: A lightweight real-time object detection method. Sensors 2020, 20, 1861. [Google Scholar] [CrossRef] [Green Version]
  24. Jia, Y.-F.; Chen, G.; Jiang, Z.; Yang, M.; Xing, L.-Y.; Cui, Y. A lightweight fast object detection method. J. Netw. Intell. 2022, 7, 209–221. [Google Scholar]
  25. Lapegna, M. A GPU-Parallel Image Coregistration Algorithm for InSar Processing at the Edge. Sensors 2021, 21, 5916. [Google Scholar]
  26. Zhong, R. On-Board Real-Time Ship Detection in HISEA-1 SAR Images Based on CFAR and Lightweight Deep Learning. Remote. Sens. 2021, 13, 1995. [Google Scholar]
  27. Xu, X.; Zhang, X.; Zhang, T. Lite-YOLOv5: A Lightweight Deep Learning Detector for On-Board Ship Detection in Large-Scene Sentinel-1 SAR Images. Remote. Sens. 2022, 14, 1018. [Google Scholar] [CrossRef]
  28. Chang, Y.L.; Anagaw, A.; Chang, L.; Wang, Y.C.; Hsiao, C.Y.; Lee, W.H. Ship detection based on YOLOv2 for SAR imagery. Remote. Sens. 2019, 11, 786. [Google Scholar] [CrossRef] [Green Version]
  29. Huyan, L.; Bai, Y.; Li, Y.; Jiang, D.; Zhang, Y.; Zhou, Q.; Wei, J.; Liu, J.; Zhang, Y.; Cui, T. A Lightweight Object Detection Framework for Remote Sensing Images. Remote Sens. 2021, 13, 683. [Google Scholar] [CrossRef]
  30. Zhu, X.; Lyu, S.; Wang, X.; Zhao, Q. TPH-YOLOv5: Improved YOLOv5 Based on Transformer Prediction Head for Object Detection on Drone-captured Scenarios. In Proceedings of the IEEE/CVF International Conference on Computer Vision, Montreal, QC, Canada, 11–17 October 2021; pp. 2778–2788. [Google Scholar]
  31. Dosovitskiy, A.; Beyer, L.; Kolesnikov, A.; Weissenborn, D.; Zhai, X.; Unterthiner, T.; Dehghani, M.; Minderer, M.; Heigold, G.; Gelly, S.; et al. An image is worth 16 × 16 words: Transformers for image recognition at scale. arXiv 2020, arXiv:2010.11929. [Google Scholar]
  32. Liang, J.; Homayounfar, N.; Ma, W.C.; Xiong, Y.; Hu, R.; Urtasun, R. Polytransform: Deep polygon transformer for instance segmentation. In Proceedings of the IEEE/CVF Conference on Computer Vision and Pattern Recognition, Seattle, WA, USA, 13–19 June 2020; pp. 9131–9140. [Google Scholar]
  33. Li, J.; Qu, C.; Shao, J. Ship detection in SAR images based on an improved faster R-CNN. In Proceedings of the 2017 SAR in Big Data Era: Models, Methods and Applications (BIGSARDATA), Beijing, China, 13–14 November 2017; pp. 1–6. [Google Scholar]
  34. Agarap, A. Deep learning using rectified linear units (relu). arXiv 2018, arXiv:1803.08375. [Google Scholar]
  35. Elfwing, S.; Uchibe, E.; Doya, K. Sigmoid-weighted linear units for neural network function approximation in reinforcement learning. Neural Netw. 2018, 107, 3–11. [Google Scholar] [CrossRef] [PubMed]
  36. He, K.; Zhang, X.; Ren, S.; Sun, J. Deep residual learning for image recognition. In Proceedings of the IEEE Conference on Computer Vision and Pattern Recognition, Las Vegas, NV, USA, 27–30 June 2016; pp. 770–778. [Google Scholar]
  37. Wang, C.Y.; Liao, H.Y.; Wu, Y.H.; Chen, P.Y.; Hsieh, J.W.; Yeh, I.H. CSPNet: A new backbone that can enhance learning capability of CNN. In Proceedings of the IEEE/CVF Conference on Computer Vision and Pattern Recognition Workshops, Seattle, WA, USA, 13–19 June 2020; pp. 390–391. [Google Scholar]
  38. Vaswani, A.; Shazeer, N.; Parmar, N.; Uszkoreit, N.; Jones, J.; Gomez, L.; Kaiser, A.; Polosukhin, I. Attention is all you need. Adv. Neural Inf. Process. Syst. 2017, 30. Available online: https://proceedings.neurips.cc/paper/2017/file/3f5ee243547dee91fbd053c1c4a845aa-Paper.pdf (accessed on 3 May 2022).
  39. Carion, N.; Massa, F.; Synnaeve, G.; Usunier, N.; Kirillov, A.; Zagoruyko, S. End-to-end object detection with transformers. In Proceedings of the European Conference on Computer Vision, Glasgow, UK, 23–28 August 2020; Springer: Cham, Switzerland, 2020; p. 30. [Google Scholar]
  40. Space Product Literature. Available online: https://www.baesystems.com/en-us/our-company/inc-businesses/electronic-systems/product-sites/space-products-and-processing/radiation-hardened-electronics (accessed on 7 May 2022).
Figure 1. Comparison of traditional remote sensing interpretation methods and on-orbit interpretation methods.
Sustainability 14 09277 g001
Figure 2. The network architecture of the YOLOv5 detector. Modules with different colors represent different structures, the details are shown in Figure 3.
Sustainability 14 09277 g002
Figure 3. Structural details of the C3 and the CONV units. The blue C3 module contains the Shortcut structure, the green C3 module does not contain the Shortcut structure.
Sustainability 14 09277 g003
Figure 4. Structural details of the SPP unit.
Sustainability 14 09277 g004
Figure 5. Schematic diagram of Vision Transformer Encoder.
Sustainability 14 09277 g005
Figure 6. Block diagram of the proposed method. The figure also shows a corresponding map of the position relationship added by the transformer encoder marked in purple. For example: If the vision transformer is fused at Position 1, then the fusion network is named YOLOv5+ViT(1); if the transformer is connected at Position 1 and Position 2, then the fusion network is named YOLOv5+ViT(1+2).
Sustainability 14 09277 g006
Figure 7. Some slice samples of the SSDD dataset. The green bounding box is the ground truth annotation of the ships in the dataset.
Sustainability 14 09277 g007
Figure 8. The annotation information of a labeled ship chip.
Sustainability 14 09277 g008
Figure 9. The upper-left subgraph plots the Epoch–mAP curve; the upper-right subgraph plots the Epoch–mAP curve; the lower-left subgraph is the best mAP in 300 epochs; the lower-right subgraph plots the GPU power usage and training time curve.
Sustainability 14 09277 g009
Figure 10. The upper left subgraph plots the Epoch–mAP curve; the upper right subgraph is the best mAP in 300 epochs; the lower-left subgraph plots the GPU power usage and training time curve; the lower right subgraph plots the GPU temperature during the training progress.
Sustainability 14 09277 g010
Figure 11. An offshore visualization scenario. Each subgraph represents the Bounding-box generated before NMS in the different models.
Sustainability 14 09277 g011
Figure 12. A complex visualization scenario. Each subgraph represents the Bounding-box generated before NMS in the different models.
Sustainability 14 09277 g012
Figure 13. An offshore visualization scenario. Each subgraph represents the Bounding-box generated before NMS in the different scale models.
Sustainability 14 09277 g013
Table 1. Experiment results of different fusion configurations.
MethodPrecision (%)Recall (%)mAP 0.5 (%)mAP 0.5 : 0.95 (%)Training Time(min)Consumption (W)FLOPs (G)
YOLOv5 + ViT(1)96.8891.9496.4960.9573.1172.91.1
YOLOv5 + ViT(2)95.5093.0496.6060.0373.1171.61.1
YOLOv5 + ViT(3)97.6091.0096.7360.5955.2161.51.1
YOLOv5 + ViT(4)94.7191.5896.2662.0455.6155.71.1
YOLOv5 + ViT(5)98.7690.8496.6061.5246.7151.91.1
YOLOv5 + ViT(1+2)95.5991.5896.7760.2073.6172.91.1
YOLOv5 + ViT(3+4+5)95.5291.2196.1758.8064.8162.11.1
Baseline95.2892.6796.6261.3845.9148.71.1
Table 2. Experiment results of different scales.
MethodPrecision (%)Recall (%)mAP 0.5 (%)Parameters (Byte)Training Time(min)Consumption (W)FLOPs (G)
YOLOv5x98.3095.2498.0586.2 M328.9202.1204.3
YOLOv5l97.2496.8898.5646.1 M197.0192.2107.8
YOLOv5m97.4196.3398.5020.9 M136.1183.247.9
YOLOv5s95.9896.1597.817.00 M72.6174.515.9
YOLOv5 + ViT(4)94.7191.5896.261.31 M55.6155.71.1
YOLOv5 + ViT(5)98.7690.8496.601.31 M46.7151.91.1
Publisher’s Note: MDPI stays neutral with regard to jurisdictional claims in published maps and institutional affiliations.

