Article

Smart Rainwater Harvesting for Sustainable Potable Water Supply in Arid and Semi-Arid Areas

1
Laboratoire de Génie Civil et géo-Environnement, Lille University, IMT Lille Douai, JUNIA Hauts-de-France, ULR 4515-LGCgE, F-59000 Lille, France
2
Energy, Environment and Water Research Center, The Cyprus Institute, Aglantzia 2121, Cyprus
*
Author to whom correspondence should be addressed.
Sustainability 2022, 14(15), 9271; https://doi.org/10.3390/su14159271
Submission received: 13 June 2022 / Revised: 24 July 2022 / Accepted: 26 July 2022 / Published: 28 July 2022
(This article belongs to the Special Issue Sustainable Water Resources Management and Sustainable Environment)

Abstract

:
This paper presents a smart rainwater harvesting (RWH) system to address water scarcity in Palestine. This system aims to improve the water harvesting capacity by using a shared harvesting system at the neighborhood level and digital technology. The presentation of this system is organized as follows: (i) identification of the challenges of the rainwater harvesting at the neighborhood level, (ii) design of the smart RWH system architecture that addresses the challenges identified in the first phase, (iii) realization of a simulation-based reliability analysis for the smart system performance. This methodology was applied to a residential neighborhood in the city of Jenin, Palestine. The main challenges of smart water harvesting included optimizing the shared tank capacity, and the smart control of the water quality and leakage. The smart RWH system architecture design is proposed to imply the crowdsourcing-based and automated-based smart chlorination unit to control and monitor fecal coliform and residual chlorine: screens, filters, and the first flush diverter address RWH turbidity. Water level sensors/meters, water flow sensors/meters, and water leak sensors help detect a water leak and water allocation. The potential time-based reliability (Re) and volumetric reliability (Rv) for the smart RWH system can reach 38% and 41%, respectively. The implication of the smart RWH system with a dual water supply results in full reliability indices (100%). As a result, a zero potable water shortage could be reached for the dual water supply system, compared to 36% for the municipal water supply and 59% for the smart RWH system. Results show that the smart RWH system is efficient in addressing potable water security, especially when combined with a dual water supply system.

1. Introduction

This paper introduces smart rainwater harvesting (RWH) and smart dual water supply systems to promote sustainable water security. RWH is an ancient practice that dates back to 2000 years BC [1]. It has been widely adopted in several countries worldwide including India [2], Sri Lanka [3], Kenya [4], Zambia [5], Ghana [6], Pakistan [7], Jordan [8,9], Afghanistan [10], Egypt [11], and Bangladesh [12]. The application of this paper targets water-scarce areas, such as the West Bank in Palestine. Such areas face severe environmental challenges [13], particularly a decrease in freshwater, population growth, and contamination of water resources [14,15,16,17,18,19]. Moreover, conventional water supply systems have limited capacity to meet water demand [20]. For example, in the West Bank, conventional systems can provide only 60% of the domestic water demand [21]. In addition, scholars highlighted the vulnerability of the water system to contamination [19,22,23].
Several authors presented the advantages of using RWH [15,24,25,26]. Conventional rooftop RWH systems include a collection catchment, conveyance, and storage tanks [27]. These systems have several strengths, including (i) independency, (ii) proximity of RWH storage tanks to users, (iii) ease of construction and maintenance, (iv) erosion and flood mitigation, and (v) reduction of pressure on water resources [7,28]. However, these conventional systems have some limitations [29], particularly a lack of control of the quality of the harvested water potability [29]. As a result, the RWH is perceived as an undrinkable source of water worldwide [30,31,32]. In addition, conventional systems don’t monitor (i) the filling and emptying process of the storage tanks, or (ii) the water leakage [33]. These processes are governed considering different factors: rainfall volume and intensity, tank storage capacity, and water demand [33].
Scholars proposed smart technologies to enhance the engineering systems’ efficiency and overcome their limitations [34,35,36,37,38]. Smart technologies use real-time and historical data to improve the performance and resilience of urban systems [34,35,36,37]. They are used in different fields such as health [39,40], transportation, mobility [41,42], indoor risk management [43], energy [44], and environment [45]. They are also used to enhance water supplies [46,47], monitor urban water networks [48,49], detect water leakage [50,51], monitor water quality [52,53,54], and enhance water resources management [55,56,57,58].
Concerning RWH, scholars introduced smart technologies to address the shortcomings of the conventional RWH systems on the household level [33,59] with a focus on a single-aspect upgrade [33,59] on either water quantity or water quality. Ref. [33] discussed using IOT-based sensors to control the water level in RWH tanks. This use secures sufficient spare in the tank to receive the runoff following storm events. It has been found that adopting water-level monitoring in RWH tanks can pointedly mitigate urban flooding and secure non-potable water supply [33]. Ref. [59] discussed using an IOT-based water quality sensor to control the quality of harvested water. The sensor helps in diverting the harvested water (based on its pH value) into two storage tanks: potable and non-potable tanks. Harvested water in the tanks is then directed to the most appropriate uses (e.g., drinking and irrigation). However, the use of pH to control the harvested water potability is controversial [19]. The World Health Organization (WHO) stated the vulnerability of RWH to physical (e.g., turbidity), chemical (e.g., nitrate, lead, and zinc), and biological contamination (e.g., coliform) [60,61]. The type of contamination depends on different factors, including (i) the RWH’s surrounding activities (e.g., urban, industrial, and agricultural activities) and (ii) roofs, pipes, and storage tanks materials [60,61]. Scholars proposed several decentralized systems for the treatment of rainwater, such as chlorination [62], pasteurization [63], ultraviolet light (UV) [64], filtration [65], boiling [66], and a combination thereof [67]. The characterization of sources, types, and levels of RWH contamination is of high importance in order to adopt the most suitable treatment units in the smart RWH system.
Considering the challenges of water harvesting and the limitations of the conventional water harvesting system, this paper proposes an innovative smart water harvesting system that combines (i) water tank sharing at the neighborhood level, and (ii) a dual water supply system. The novelty of the proposed system stems from its ability to smartly monitor the water quality, water level, and water leakage, and to increase the harvesting efficiency through enhancing the water sharing capacity at the neighborhood level.

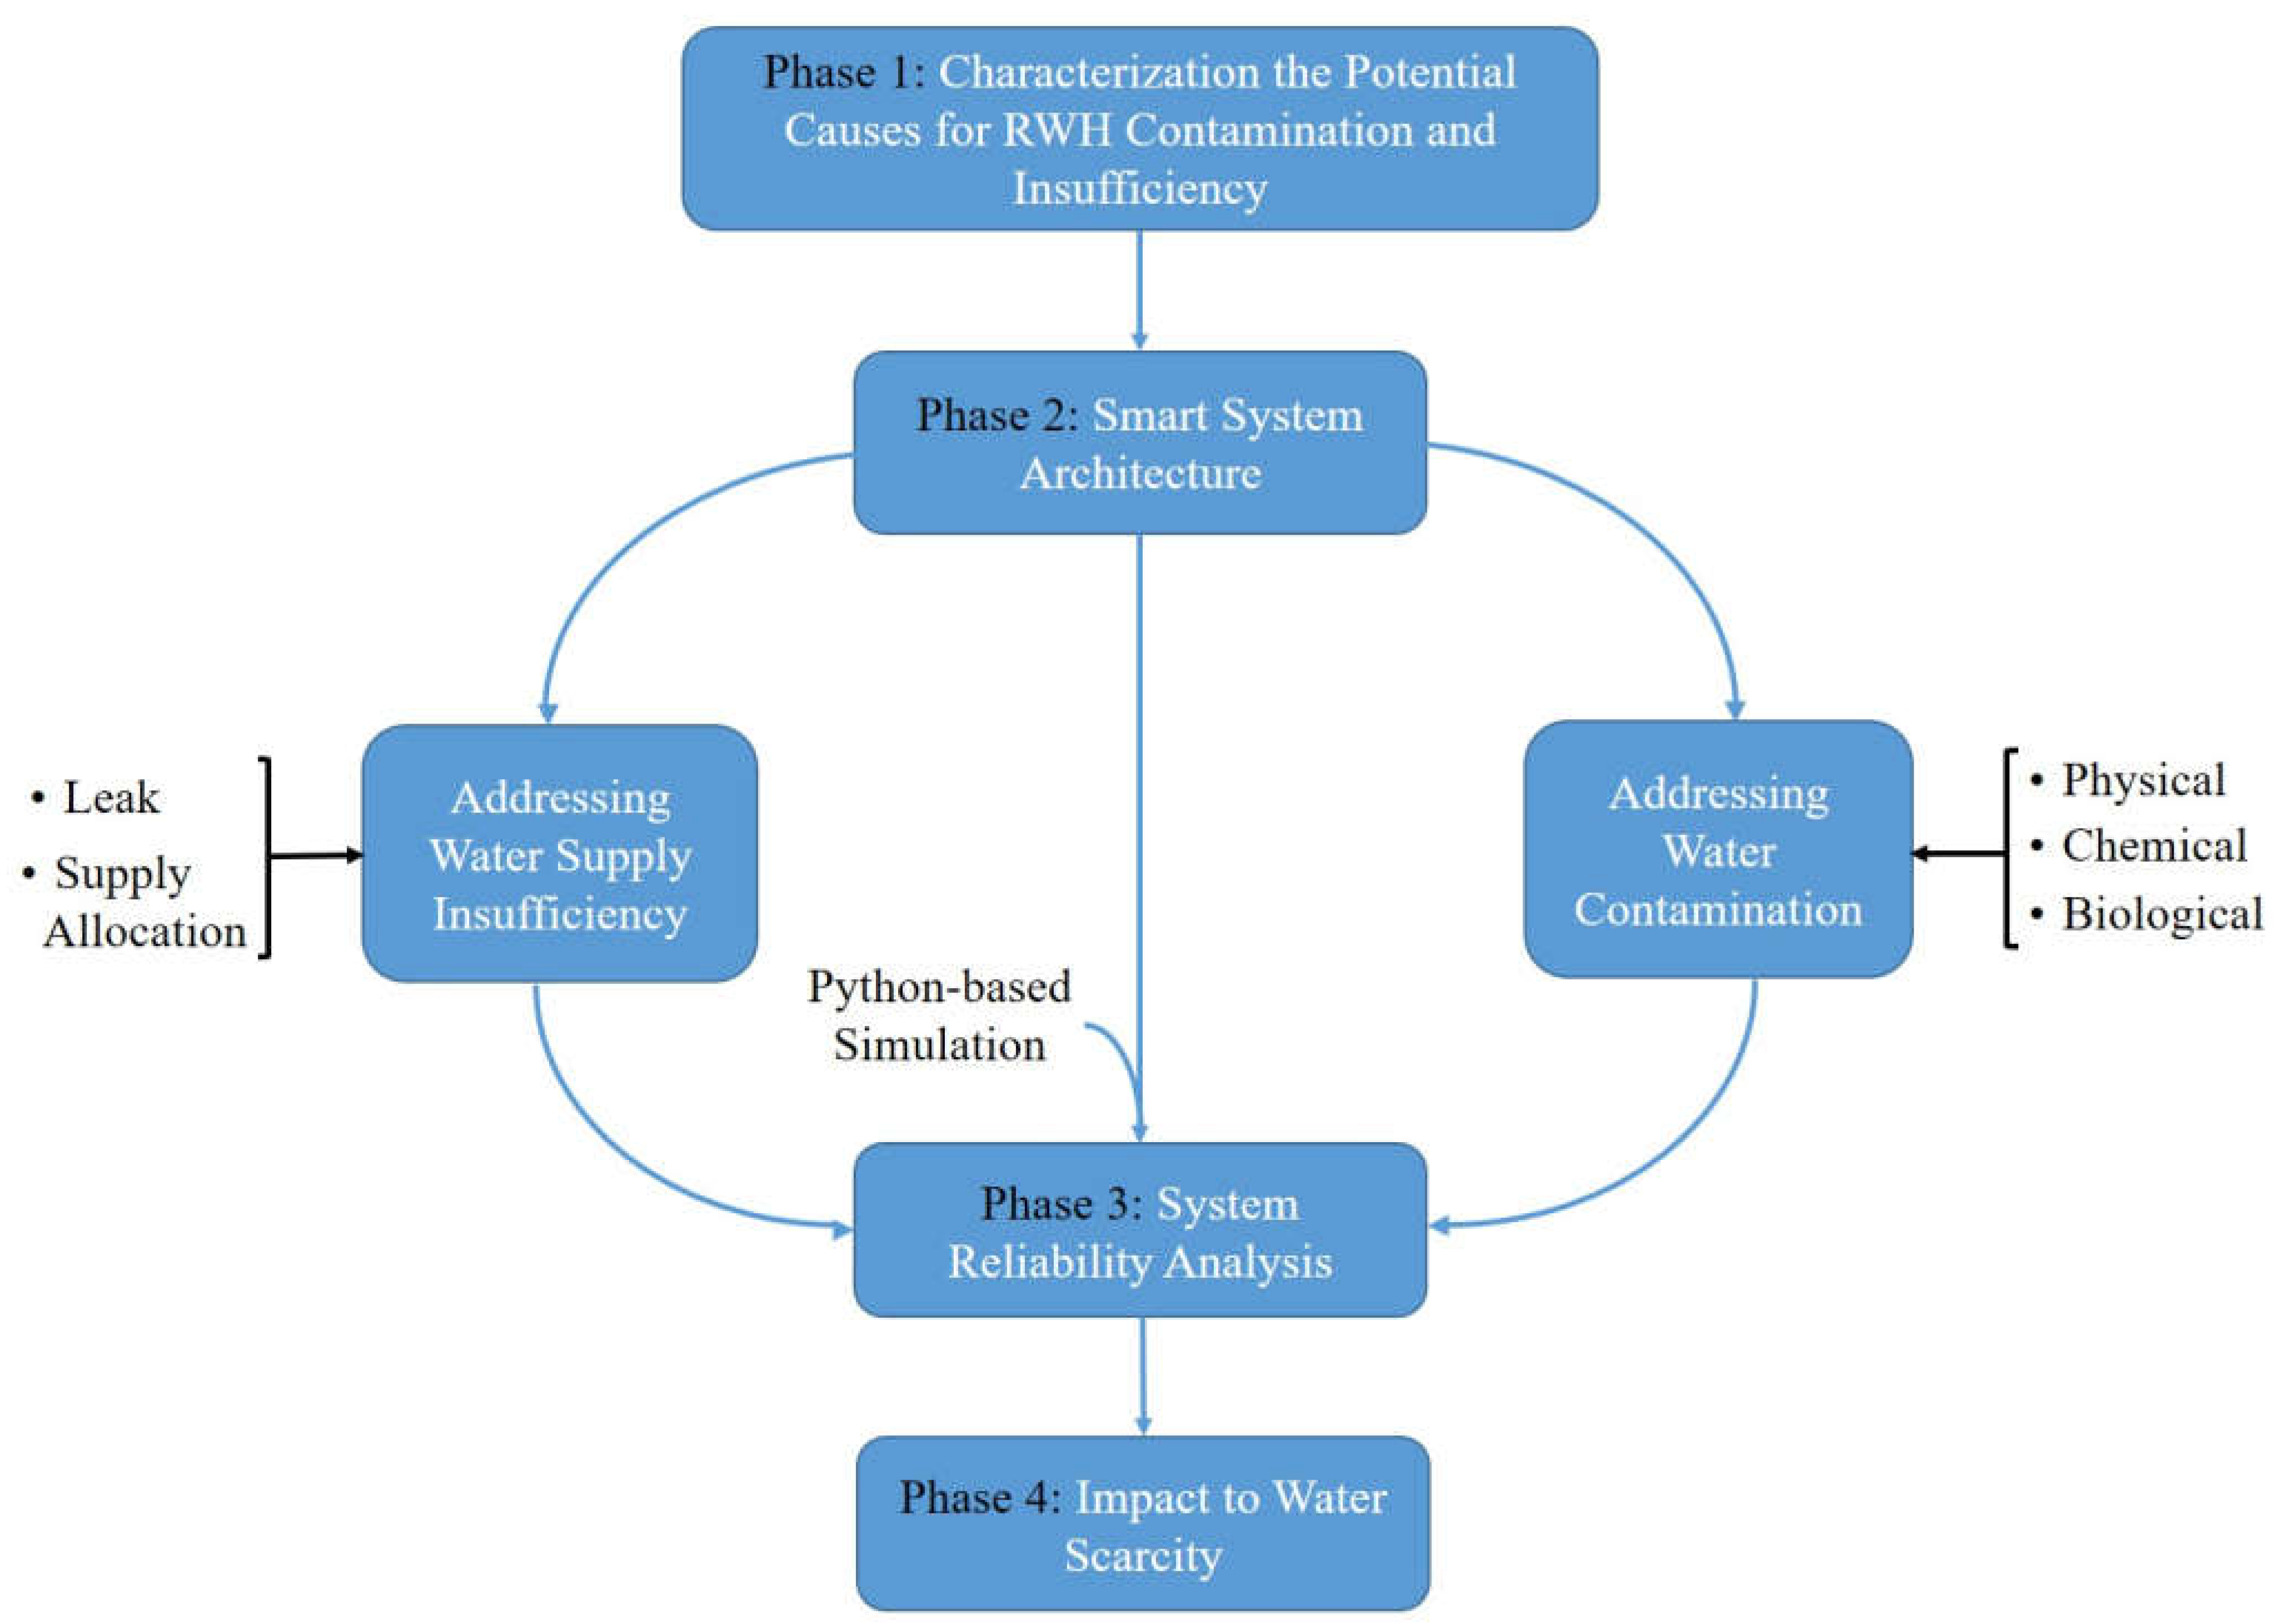
2. Materials and Methods

The methodology adopted in this research involves three phases, as shown in Figure 1. The first phase targets the characterization of the potential causes of RWH contamination and insufficiency. Phase 2 employs the characterization outputs to design the smart RWH system architecture. The last phase aims at performing a reliability analysis of the smart system performance.

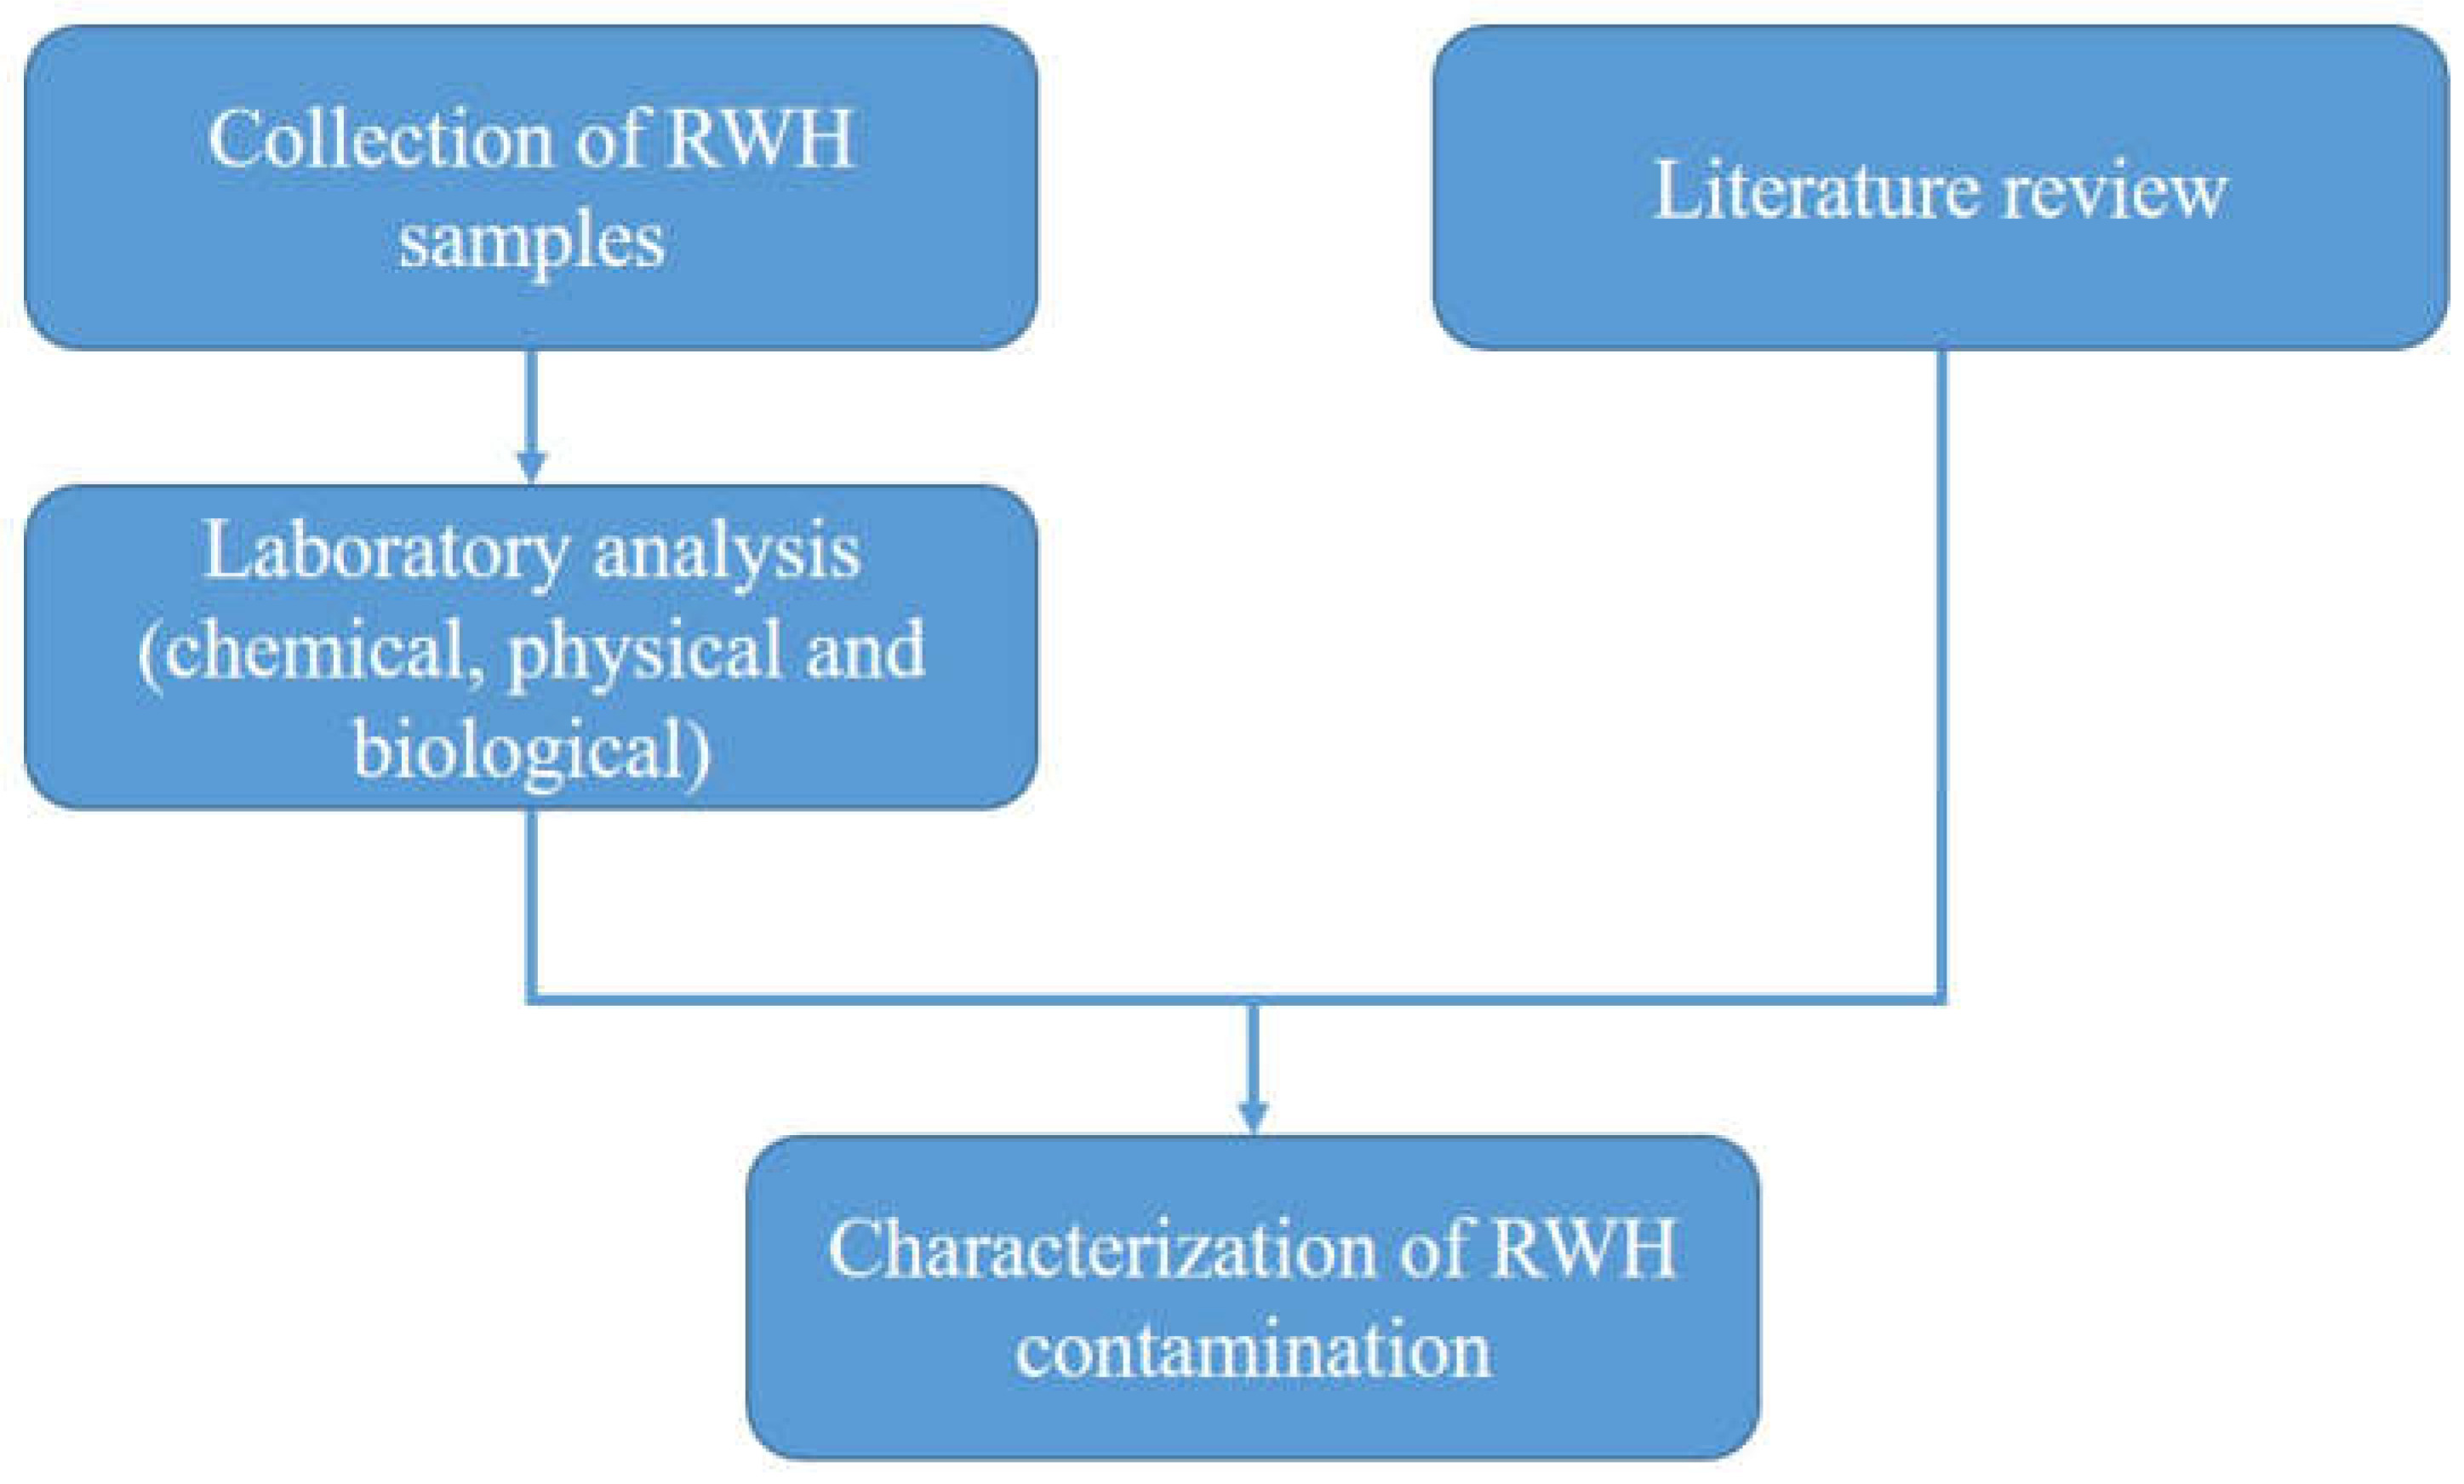
2.1. Assessment of Conventional RWH Shortcomings

In order to establish an efficient configuration of the required smart system, the research methodology starts by assessing the challenges of the conventional RWH system. Although RWH is less vulnerable to contamination than surface and groundwater resources, it could be exposed to contamination sources [68,69]. The first source is the atmosphere, as the rain droplets could absorb air contaminants such as nitrite, carbon dioxide, and sulfate [70]. In addition, it could acquire heavy metals due to industrial emissions (e.g., lead, zinc, copper, and cadmium) [71]. The second source is rooftop materials [70] (e.g., lead-based roofs) which are classified as a hotspot for various toxins [72]. The third source is from wastes (e.g., fecal material and leaves), originating from creatures (e.g., birds) and trees, and settled on roofs [72]. These sources could cause physical, chemical, and biological contamination of RWH [73,74]. The type of RWH contamination differs spatially [74,75]. It depends on the surrounding activities that pollute the roofs and air [74,75]. Monitoring and implementing treatment units for these contaminations are complex, costly, and time-consuming [76,77]. Thus, characterizing the probable contaminants and their sources is a core step in constructing an efficient and financially feasible quality monitoring system. This paper characterizes RWH contamination by considering: (i) the spatial sampling of the RWH from different locations, (ii) the laboratory analysis of the collected samples, and (iii) a review of the literature (see Figure 2).
The inefficiency of RWH systems in providing a reasonable water supply volume could be attributed to uncontrollable and controllable factors [9,78]. The uncontrollable factors include the rainfall volumes and patterns and the roof area [25]. The controllable ones include the proper sizing of the RWH storage tank, leaks in the RWH system, the efficiency of the RWH system components (e.g., pumps and valves), and the roof type [9,25,78]. Therefore, controlling and monitoring these controllable components is the key to an efficient RWH system.

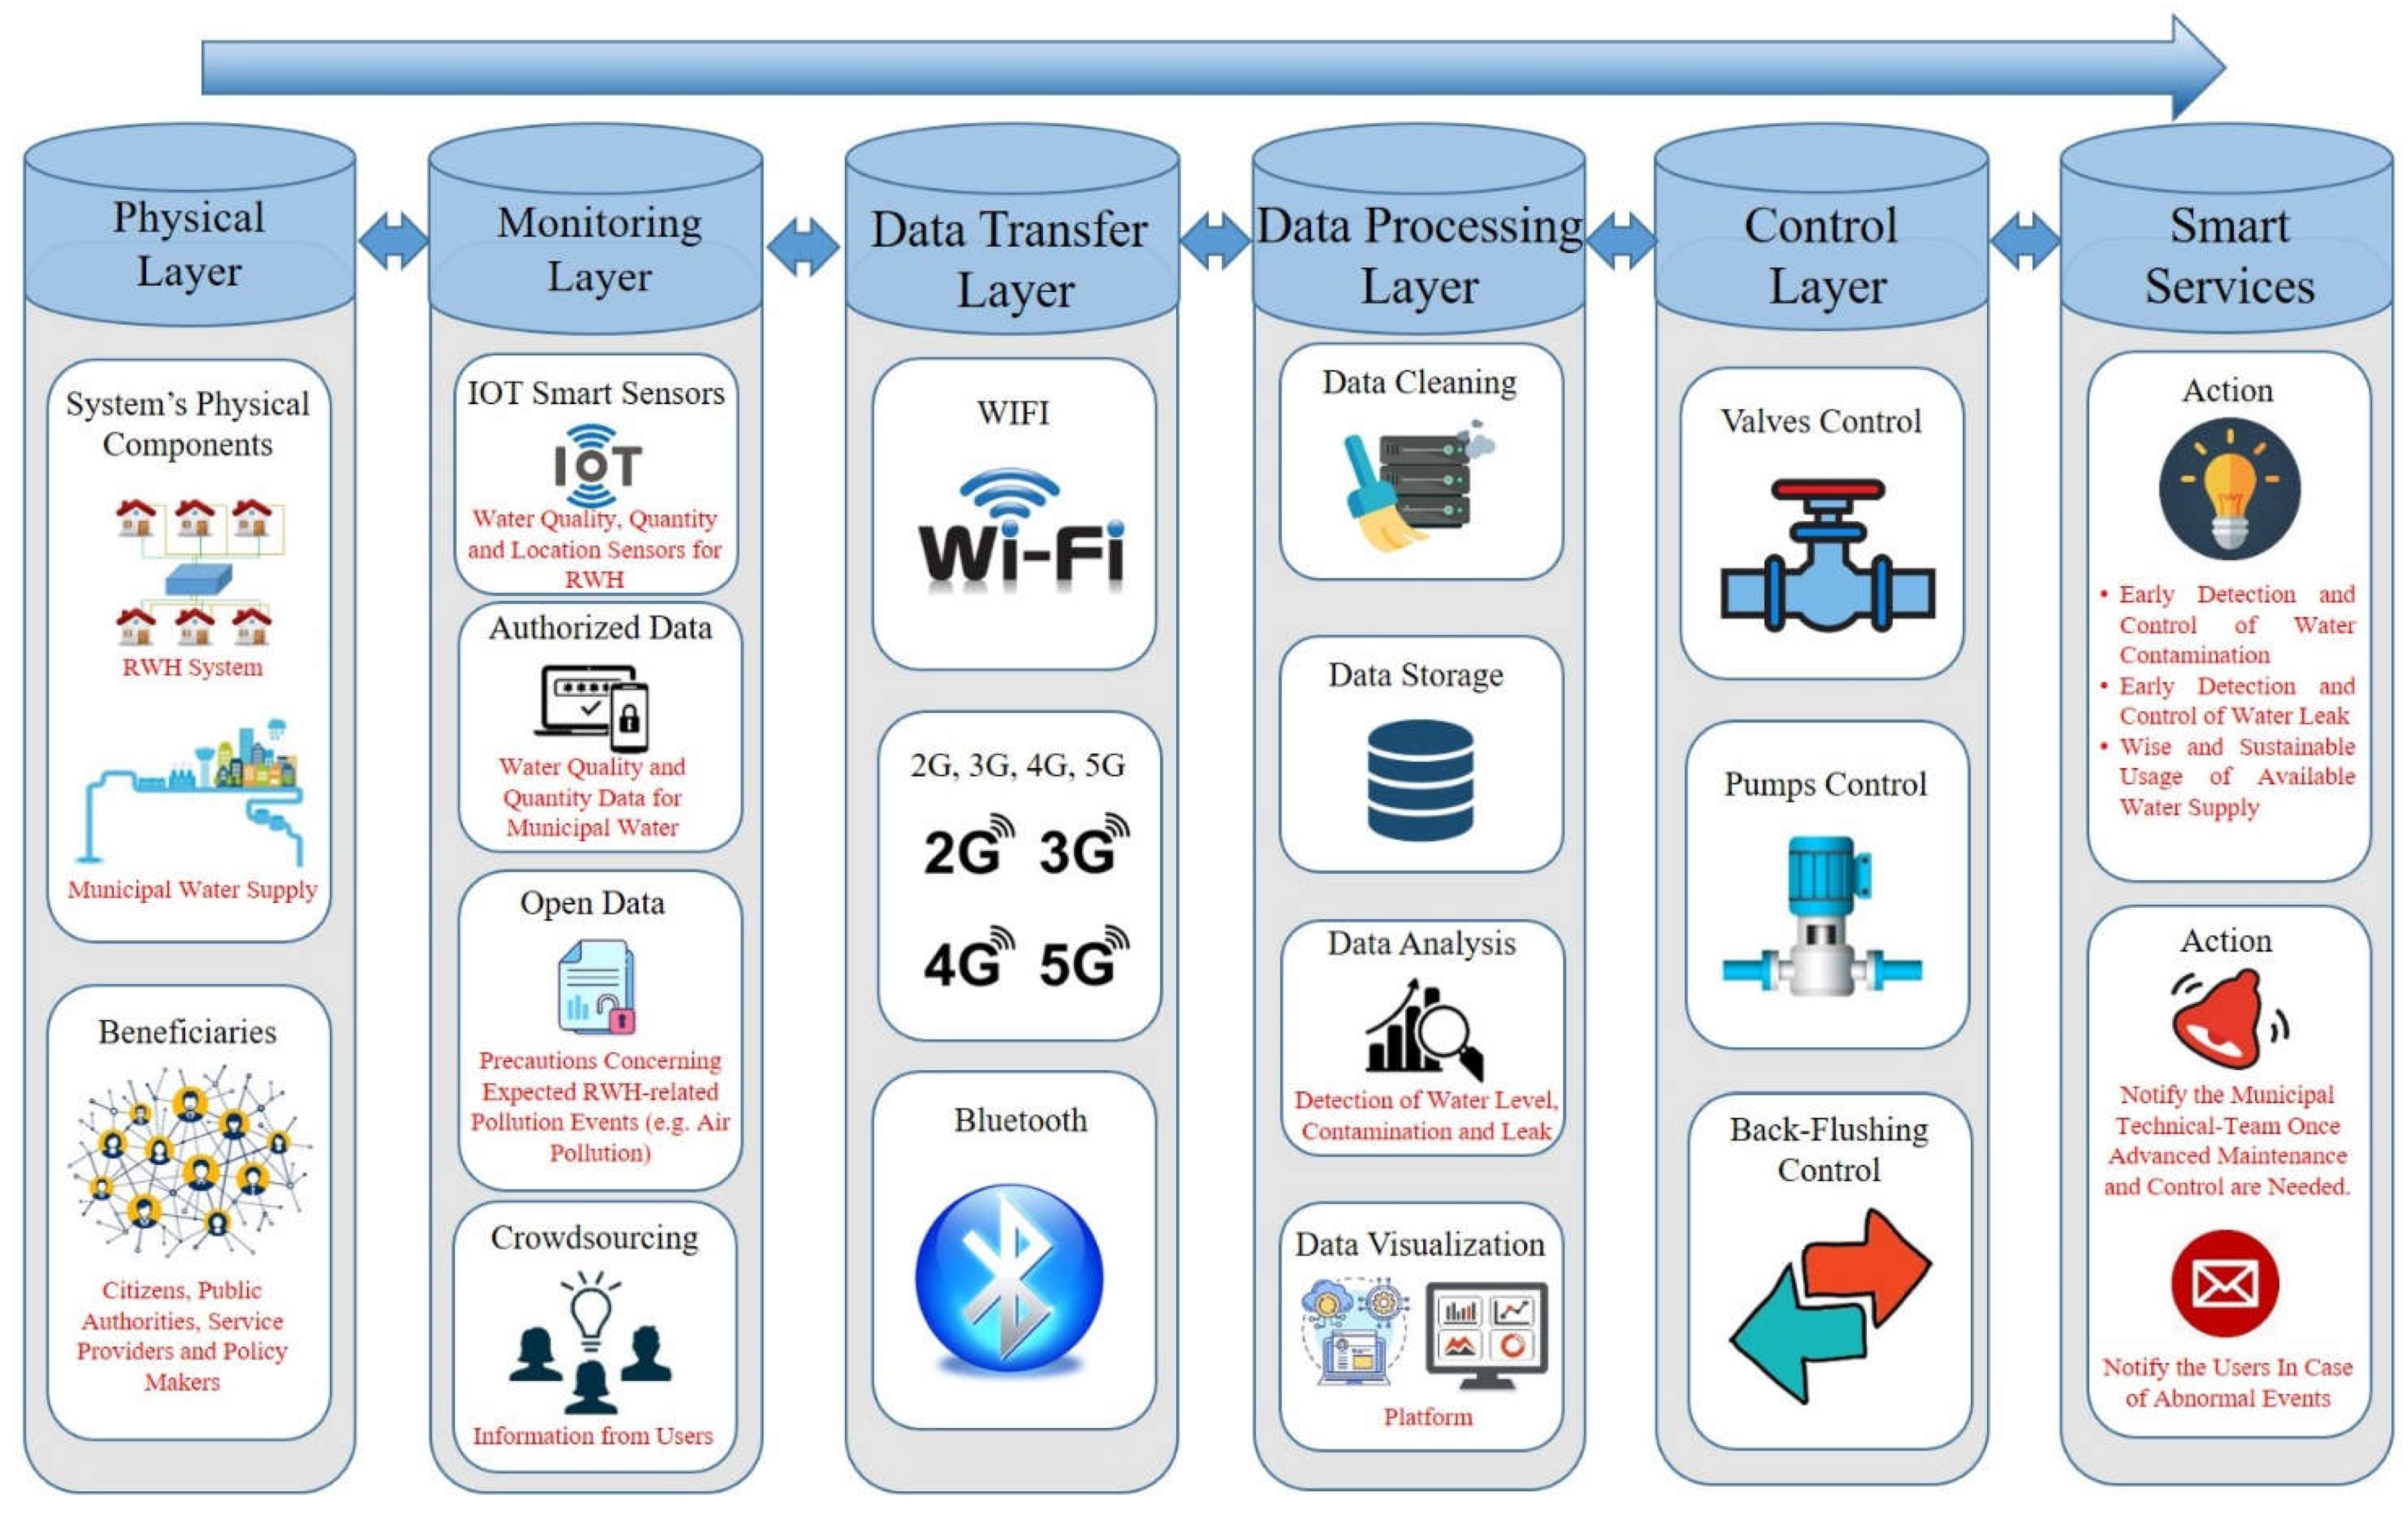
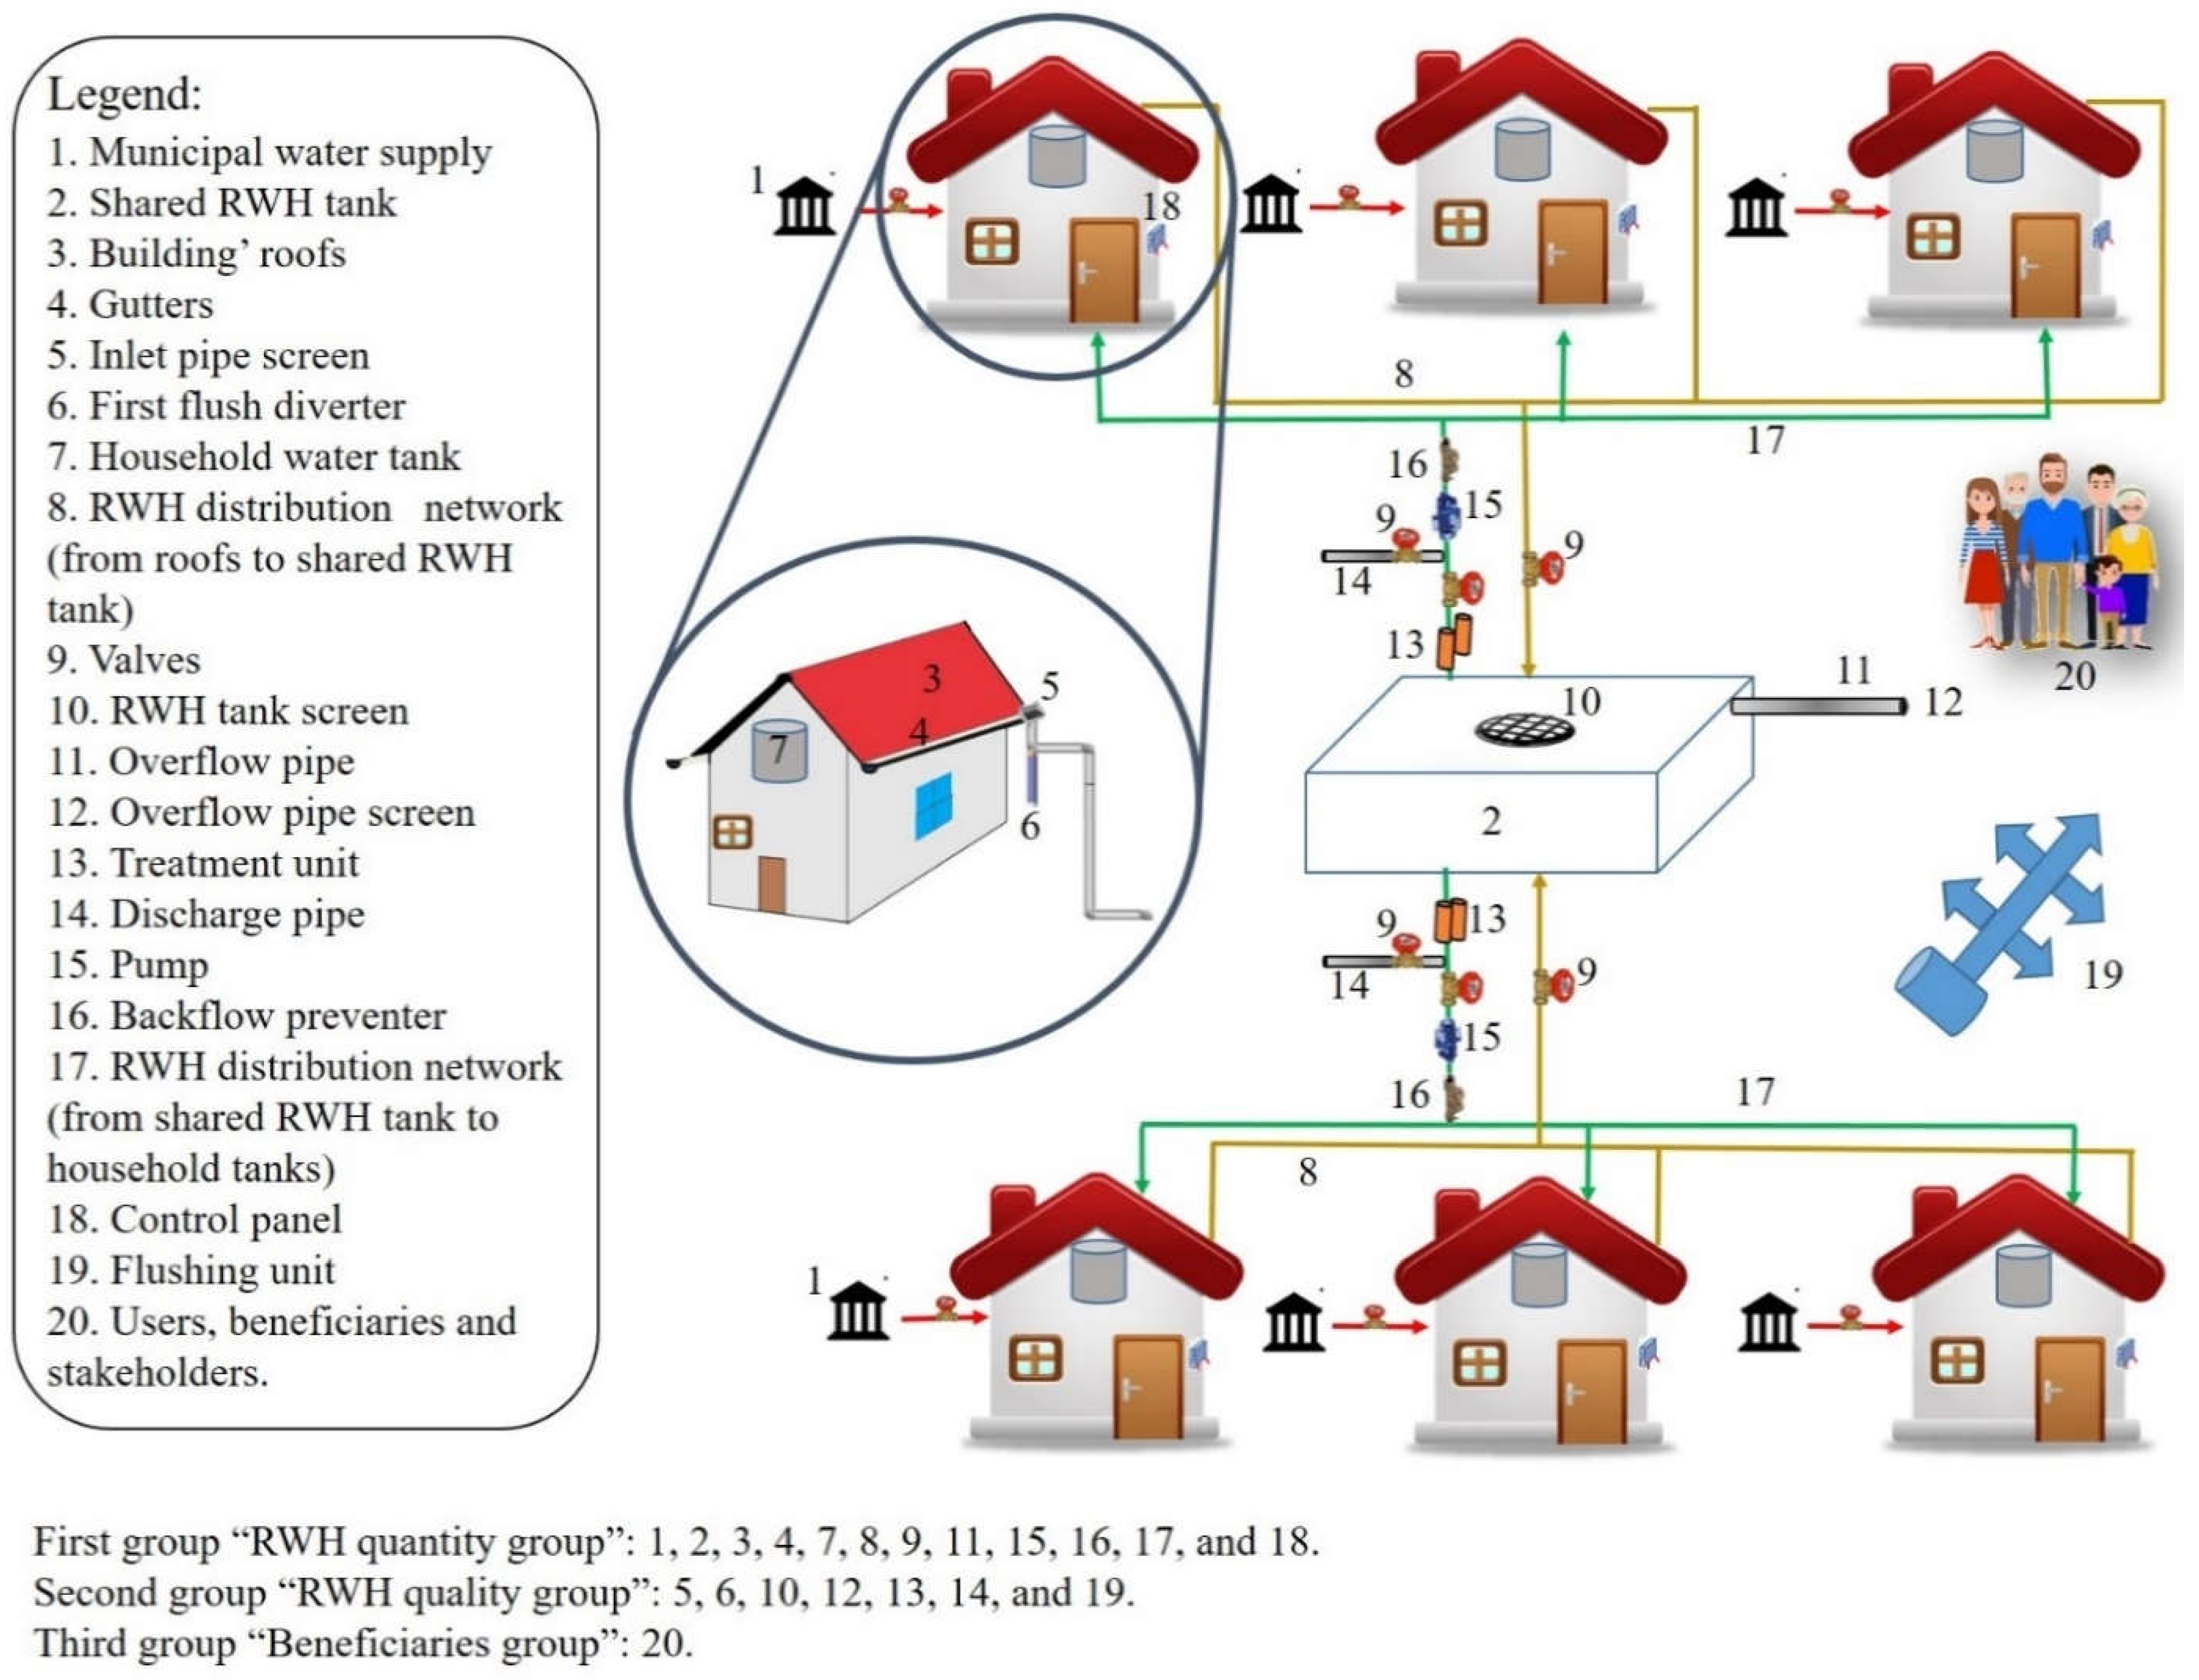
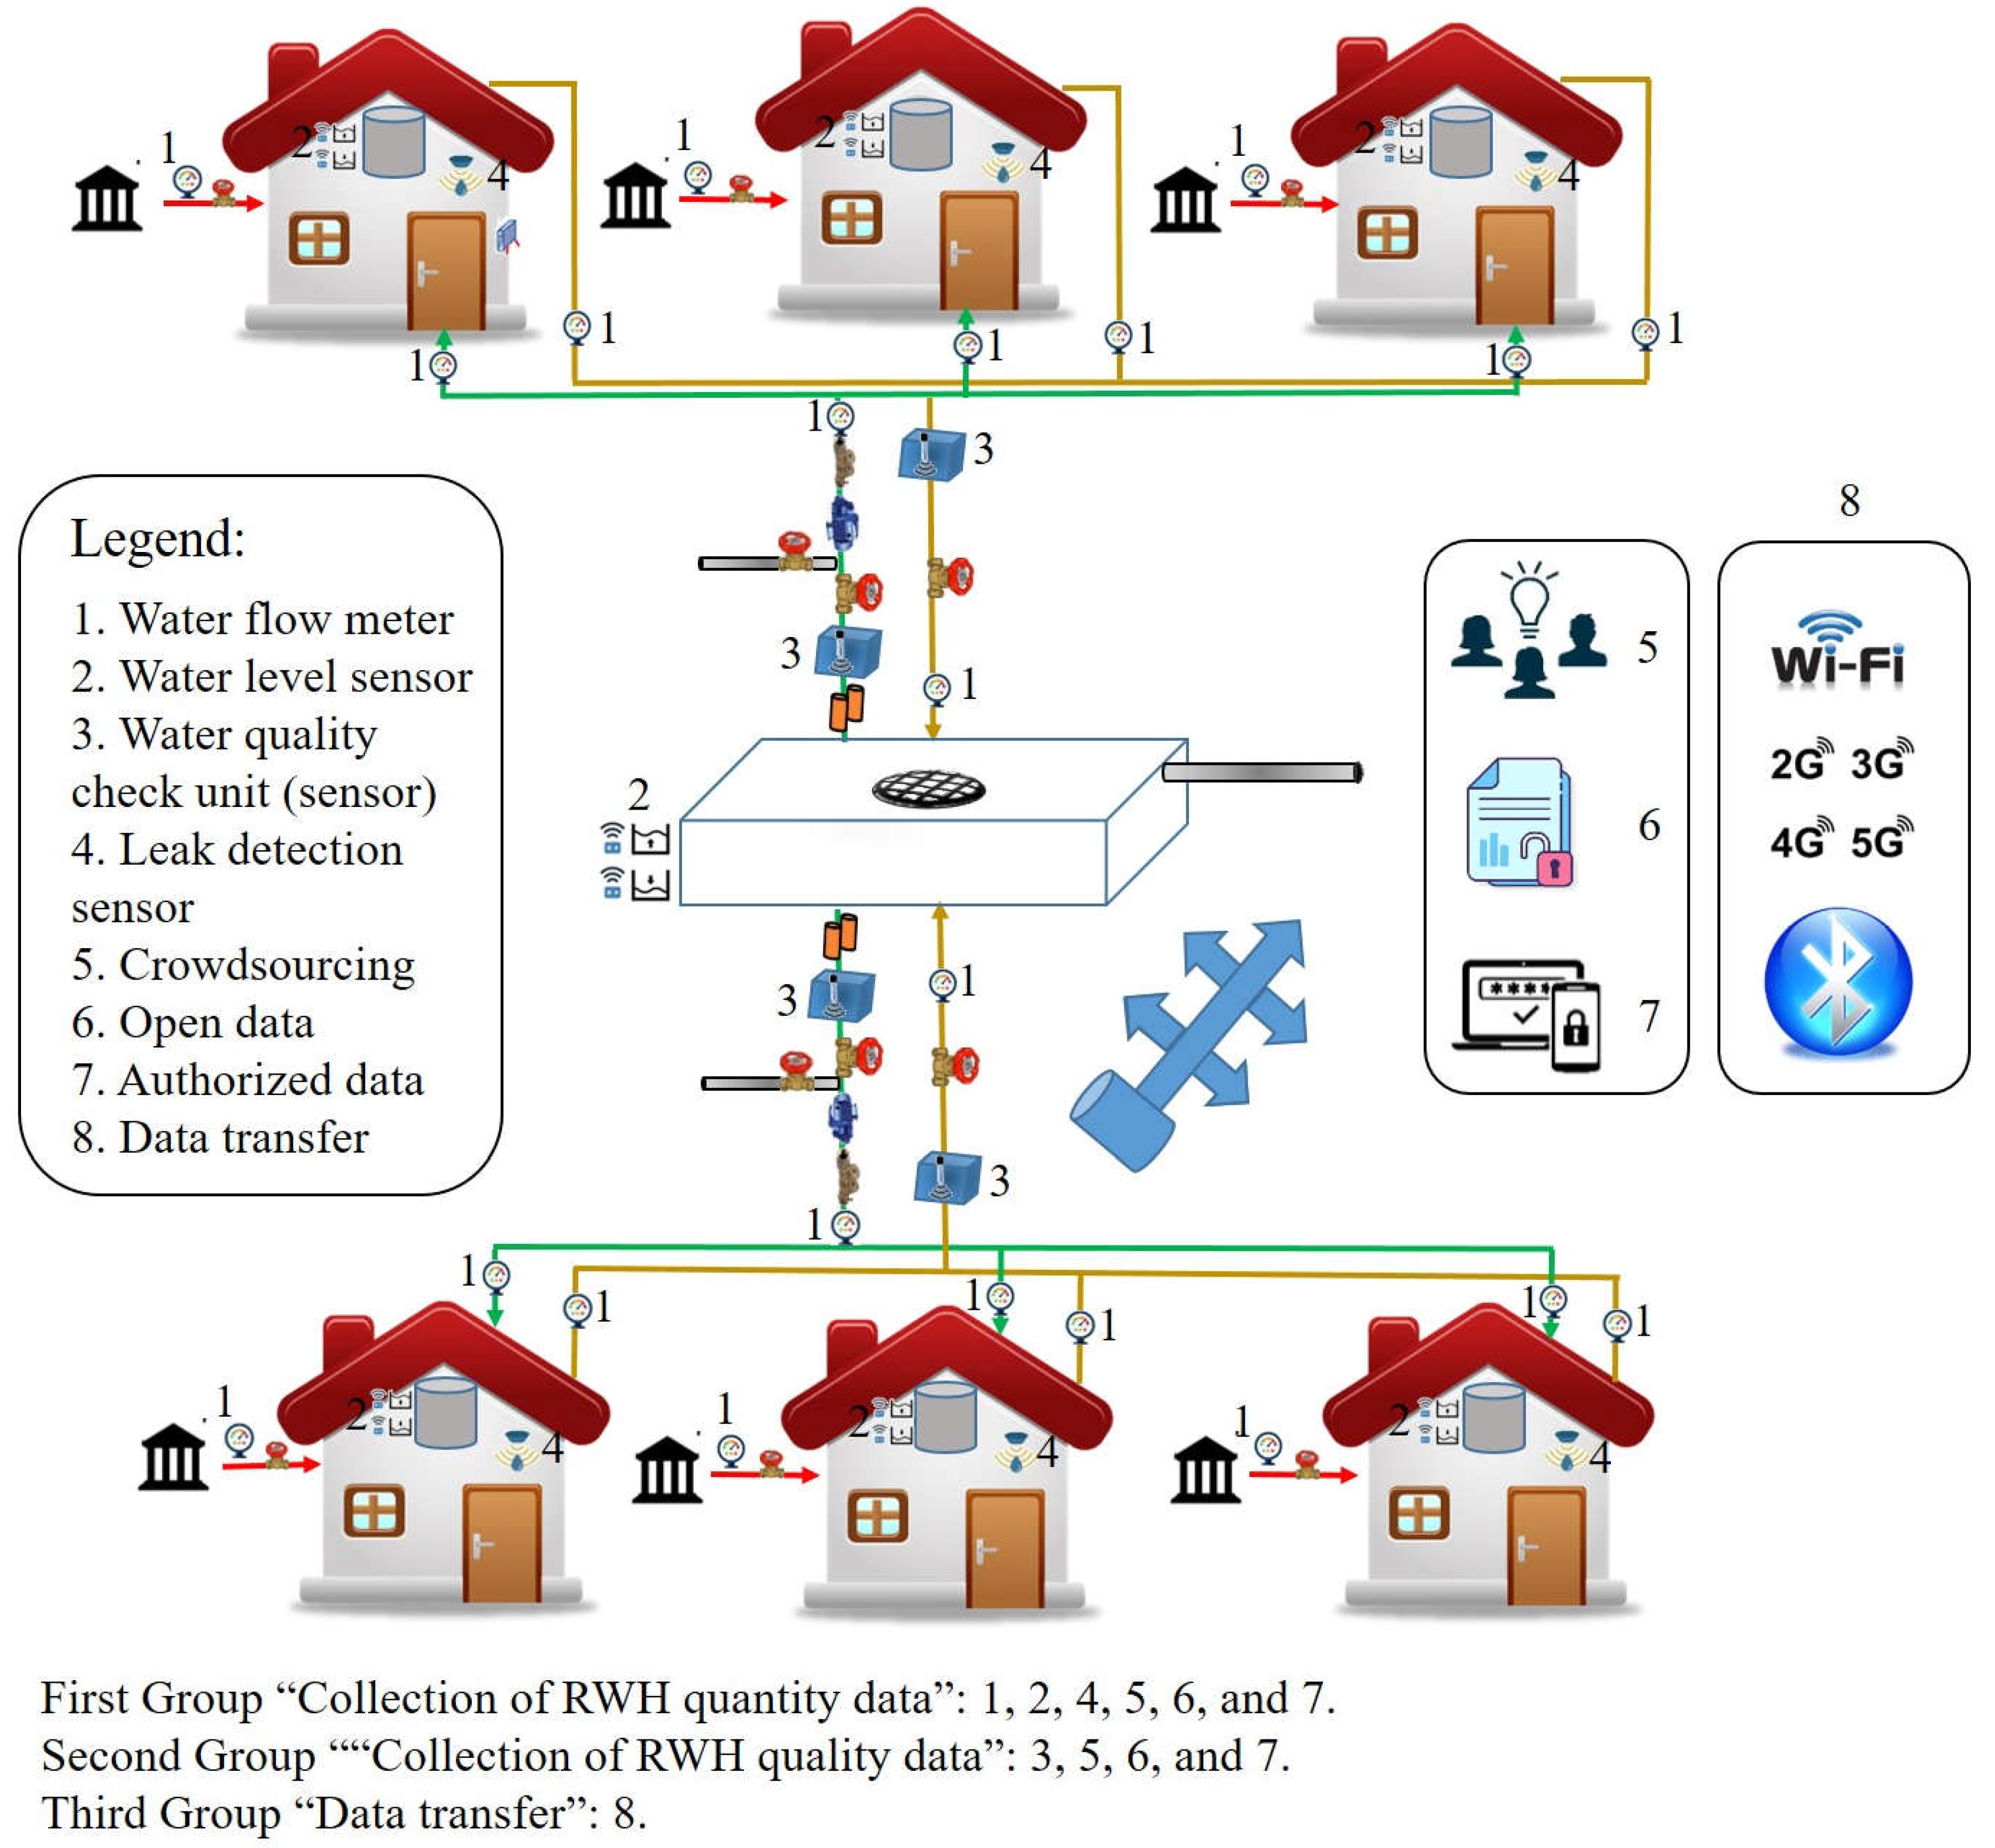
2.2. Smart RWH System Architecture

The smart RWH system is used to ensure (i) early detection of water contamination and water leak, (ii) the control of water contamination and water leak, (iii) satisfying the needed domestic water demand, and (iv) the wise and sustainable use of available water resources/supply. In addition, the system ensures (i) data collection, (ii) interaction with users, and (iii) the control of the smart system’s equipment, such as valves and pumps.
The architecture of the smart RWH system involves six layers, as illustrated in Figure 3. The physical layer includes the physical components of the water harvesting system, the municipal water supply, and the users. The monitoring layer includes sensors used to monitor the water quality, water flow, and the water level in the water tank. The data transfer layer uses wireless technology for data transmission from the monitoring system to the server. The data processing layer operates data cleaning, storage, analysis, and visualization. The control layer includes actuators that control the water flow, such as pumps and valves. Finally, the smart services include the detection of water contamination or water leak, and the optimal tank filling.

2.2.1. The Physical Layer

The water supply, leak, and contamination are influenced by the building’s distribution, citizens’ density, and the water distribution systems [79,80]. Therefore, the smart water supply system is designed to consider the physical components (See Figure 4), which could be organized into three groups. The first one, “RWH quantity group” is responsible for facilitating the collection of RWH. It involves the building roofs, gutters, shared RWH tank, household water tank, RWH distribution network (from roofs to shared RWH tank and from shared RWH tank to household water tanks), valves, overflow pipe, pump, backflow preventer, municipal water supply, and control panel. The second group, “RWH quality group” is responsible for mitigating/avoiding the contamination of harvested water. It involves the inlet filter, first flush diverter, RWH tank screen, overflow pipe screen, treatment unit, discharge pipe, and flushing unit. The third group, “Beneficiaries group” concerns the users, public authorities, service providers, and policymakers.
The building roofs are considered the catchment area for receiving the falling rainfall droplets. Such droplets are transported through the gutters (channels located around the edge of a sloping roof) to the RWH distribution network. The latter is used to transport the rainwater from the roofs to the shared RWH tank. Valves are used to regulate the water supply. They have three main functions: stopping and starting the water flow, throttling the water flow, and directing the water flow. Pumps transport the harvested rainwater from the shared tank to the household water tank installed on the top of the house. The house tank is also connected to the municipal water system. Backflow preventers are installed to protect the pump.
An inlet filter is installed to catch the large debris and prevent them from entering the pipe of the RWH distribution network. A first flush diverter is used to capture and divert the contaminated harvested water during the first rain because different substances and deposits could contaminate it on the roof. However, this diverter forms the second defense line since it captures the contaminants not captured by the inlet filter. The RWH tank screen is located at the entry point of the RWH storage tank. It has two main roles: filtering the harvested water before reaching the storage tank, and preventing pests and mosquitos from entering the tank. The overflow pipe screen (filter) is installed at the end of the overflow pipe. It also prevents pests and mosquitos from entering the RWH system. A treatment unit is added to convert the non-potable water into potable water. This unit will be based on the characterization of the probable RWH contamination in the study area. A discharge pipe is installed to discharge the non-potable water away from the distribution network and prevent it from reaching the household water tank. Finally, a flushing unit is added for cleaning, disinfecting, and flushing the RWH system.
The features of the system components depend on the design criteria, cost, and social preference [8,25,81]. Several roofing materials could be used; concrete and the bricks are the most common [25]. Scholars confirmed the impact of roof material on the RWH’s collection efficiency [25]. Tow shapes of gutters (based on their cross-section) can be used which are K-style and half-round gutters. They can be made of aluminum, copper, steel, zinc, and fiber-reinforced plastic [81]. Several shapes of storage tanks can be used including rounded, cube-shaped, pear-shaped, or rectangular [8]. They could be made of concrete, steel, or plastic [8]. Installing the properly sized first flush diverter is of high importance to protect the harvested water quality [8].

2.2.2. The Monitoring and Data Transfer Layer

This layer ensures the collection, monitoring, and transfer of data through three groups. The first group, “Collection of RWH quantity data” facilitates the monitoring of water flow, levels, and leak. It involves (i) smart water flow meter to monitor the water flow in the distribution network, (ii) water level sensor to monitor the water level in the shared RWH tank and the household’s tanks, and (iii) leak detection sensor: these sensors can detect an indoor water leak for different household equipment. The second group, “Collection of RWH quality data” employs smart water quality devices to monitor the water quality in the RWH system (See Figure 5).
The system also uses crowdsourcing, open data, and authorized data to collect the water supply agenda from the water provider, the weather and air quality forecasting from the relevant authorities, and information from users about the water quality or water shortage in the RWH service [82,83].
The third group, “Data transfer” is responsible for transmitting the real-time data from the meters, IoT sensors, devices, crowdsourcing, open data, and authorized data to the RWH server in order to be processed and analyzed. This is carried out using wireless networks (e.g., WIFI, Bluetooth, and 4G).

2.2.3. Data Processing Layer

The data processing layer operates the following tasks: data cleaning, data storage, analysis, and visualization. Data cleaning is the process of guaranteeing data correctness, consistency, and usability [84,85]. It involves detecting and removing/replacing/correcting inaccurate records from the database [43]. The smart system’s actions depend highly on the input data [86]. Therefore, cleaning collecting data could significantly help the smart systems avoid inappropriate actions. Data storage includes the containment and integration of collected data in a specific location (database) [87]. The access, calling, and manipulation of stored data should be secured (e.g., using XQuery) [88]. XQuery is a functional language that is employed to retrieve the stored data in XML format [88]. Data analysis converts the collected, cleaned, and stored data into helpful information [89,90], which is then used to conduct suitable actions [89,90]. In this research, data is statistically analyzed. Water quality statistics (minimum, 1st quartile, median, mean 3rd quartile, and maximum) are compared to the drinking water standards stated by the WHO [60]. Statistics concerning water flow, volumes, and levels in the RWH system are analyzed and compared. ArcGIS is also used to facilitate the spatial analysis of data. This analysis helps detect a water leak and allocate water resources to users. Data visualization is the graphical representation of the analyzed data [91,92]. It forms an effective way of communication, especially where the input data is big data (e.g., temporal, spatial, and spatiotemporal data) [90].
Data cleaning, storage, analysis, and visualization are connected to the smart platform. The platform receives real-time data from the water level sensors, water flow meters, and leak detection sensors. It can then detect a water leak in (i) the RWH system, (ii) the municipal water system, (iii) indoor household equipment, and in an (iv) indoor water network. The platform also receives water quality records concerning the treated RWH from the water quality check unit. These real-time records will be available for the users on the platform.

2.2.4. Control Layer and the Provided Smart Services

Following data analysis, the smart system operates control actions of pumps and valves (e.g., via automated system and/or user interface module). Such a module enables the end users to control the system components remotely. For example, pumps will be automatically shut down in case of water contamination to avoid a non-potable water supply. Valves will be used to discharge the contaminated water through the discharge pipes. Moreover, backflushing will be automatically operated to clean and disinfect the RWH system from the contaminants. In a case when a water leak is detected, pumps and valves will be temporally turned off to minimize water losses.
The smart system provides several services, including (i) the early detection of water contamination, (ii) the early detection of a water leak, (iii) the smart control and elimination of water contamination to secure potable water supply, (iv) the optimal use of available water resources (e.g., RWH and municipal water supply), and (v) incidents notification to users.

2.3. Smart System Reliability Analysis

The smart water system’s reliability aims to assess the efficiency and capability of the system to supply the water demand [93,94]. Scholars introduced two indices for the estimation of the systems reliability: (i) time-based reliability (Re), which designates the ratio of days with a fully met water demand in one year, (ii) and the volumetric reliability (Rv), which denotes the ratio of the annual supplied water to the annual volume of water demand [15,95,96,97].
This research is based on a simulation-based Re and Rv dataset obtained using a Python code on the Kaggle platform. The simulation was carried out in three steps. The first step consists of estimating the daily water demand (Dt) and the daily captured volume of RWH at the roofs (St). The second step targets the quantification of the daily volume of rainwater in the RWH tank (Vt), the daily overflow from the RWH tank (Ot), and the daily shortage in covering the needed water demand (Xt). Finally, the last step targets the estimation of both Re and Rv.
  • First step: Estimation of Dt and St
The daily per capita water consumption rate (DWCR) is identified in view of the WHO recommendation [60]. Such rates, along with the residents’ statistics, are employed to estimate Dt:
D t = DWCR t     POP 1000
where
  • Dt: the water demand on the t-th day (m3/day)
  • DWCR: the daily per capita water consumption rate in liter/capita/day (L/c/d)
  • POP: the resident’s statistics (capita)
St is estimated using Gould and Nissen-Petersen’s Equation (1):
S t = j = 1 n RF t     A j     RC j
where
  • St: the potential daily RRWH volume for the shared system in the t-th day (m³/day)
  • RFt: daily RF for the t-th day (m/day)
  • Aj: area for the j-th rooftop (m²)
  • RC: runoff and collection efficiency coefficient for the j-th rooftop [25]
  • t: the day (1 to 365)
  • j: the building number
  • n: total number of buildings
  • Second step: Estimation of Vt, Ot, and Xt
The estimation of Vt, Ot, and Xt is conducted using the following formulas [94]:
O t = Max ( 0 , V t 1 + S t D t C )
V t = t = 1 365 Max ( 0 , V t 1 + S t D t O t )
X t = Min ( 0 , V t 1 + S t D t )
where
  • Ot: daily overflow from the RWH tank (m³)
  • Vt: daily water volume in the RWH tank in the current day
  • Vt−1: daily water volume in the RWH tank in the previous day
  • St: daily captured volume of rainwater at the roof (m³)
  • Dt: daily water demand (m³)
  • C: tank size/capacity (m³)
  • Xt: daily shortage in covering the needed water demand (m³)
  • t: day (1 to 365)
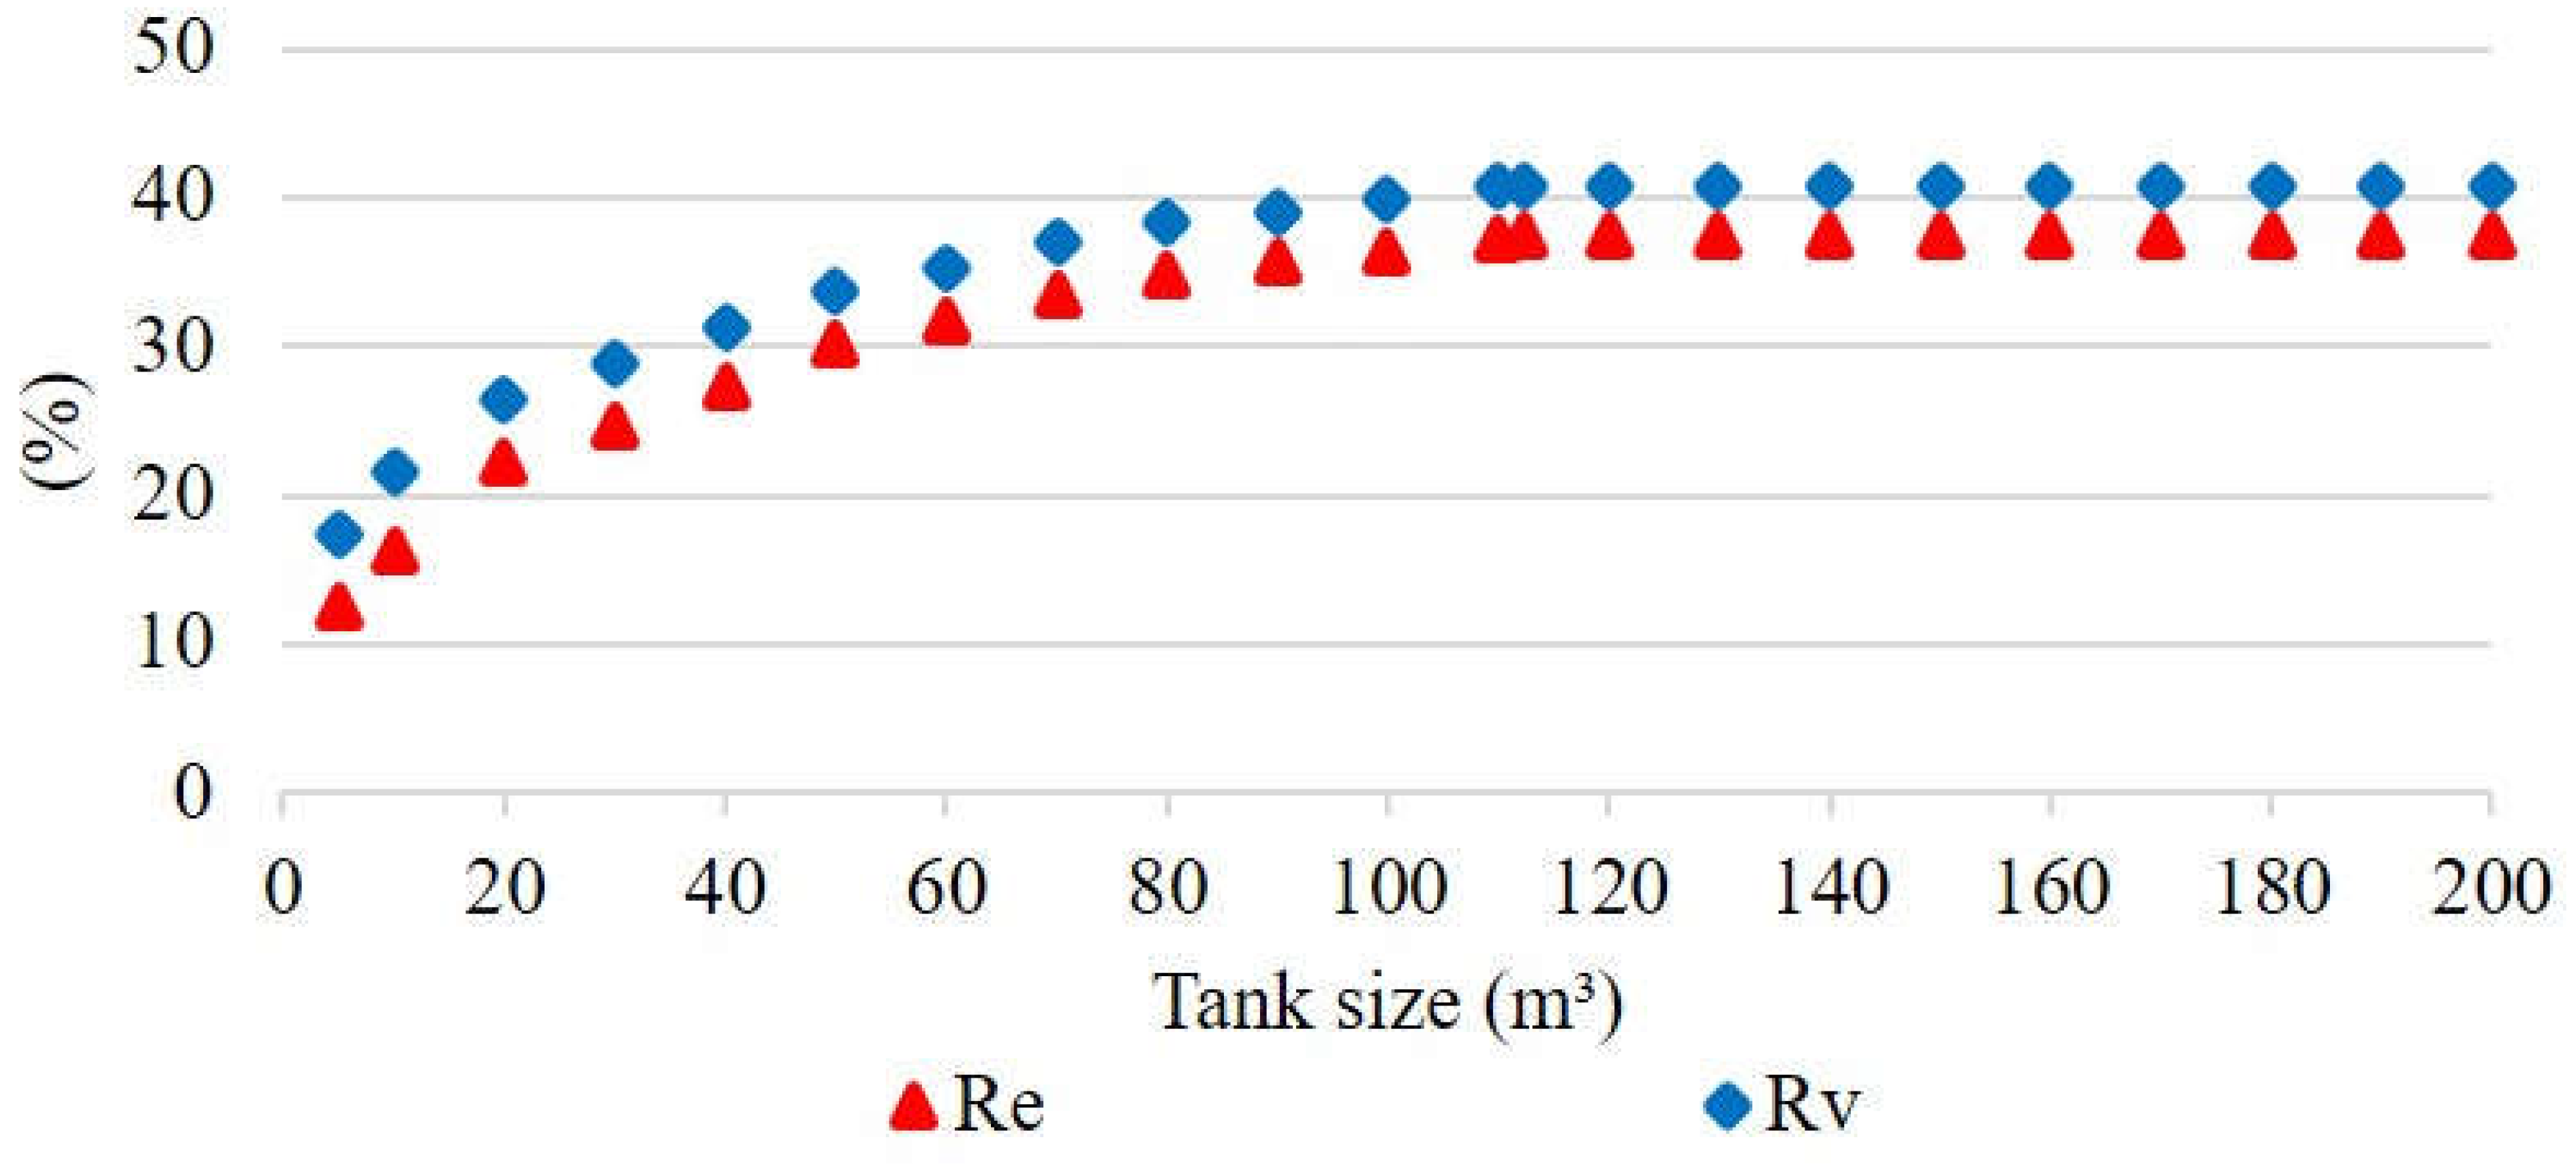
  • Third step: Estimation of Re and Rv
Re and Rv are estimated using the following formulas [15,95,96,97]:
R e = N U N     100
R v = AWS   AWD     100
where:
  • N: total days in a year (365 days)
  • U: number of days with water shortage each year (Xt > 0) (in days)
  • AWS: annual water supply from the system (in m3)
  • AWD: annual water demand (in m3)
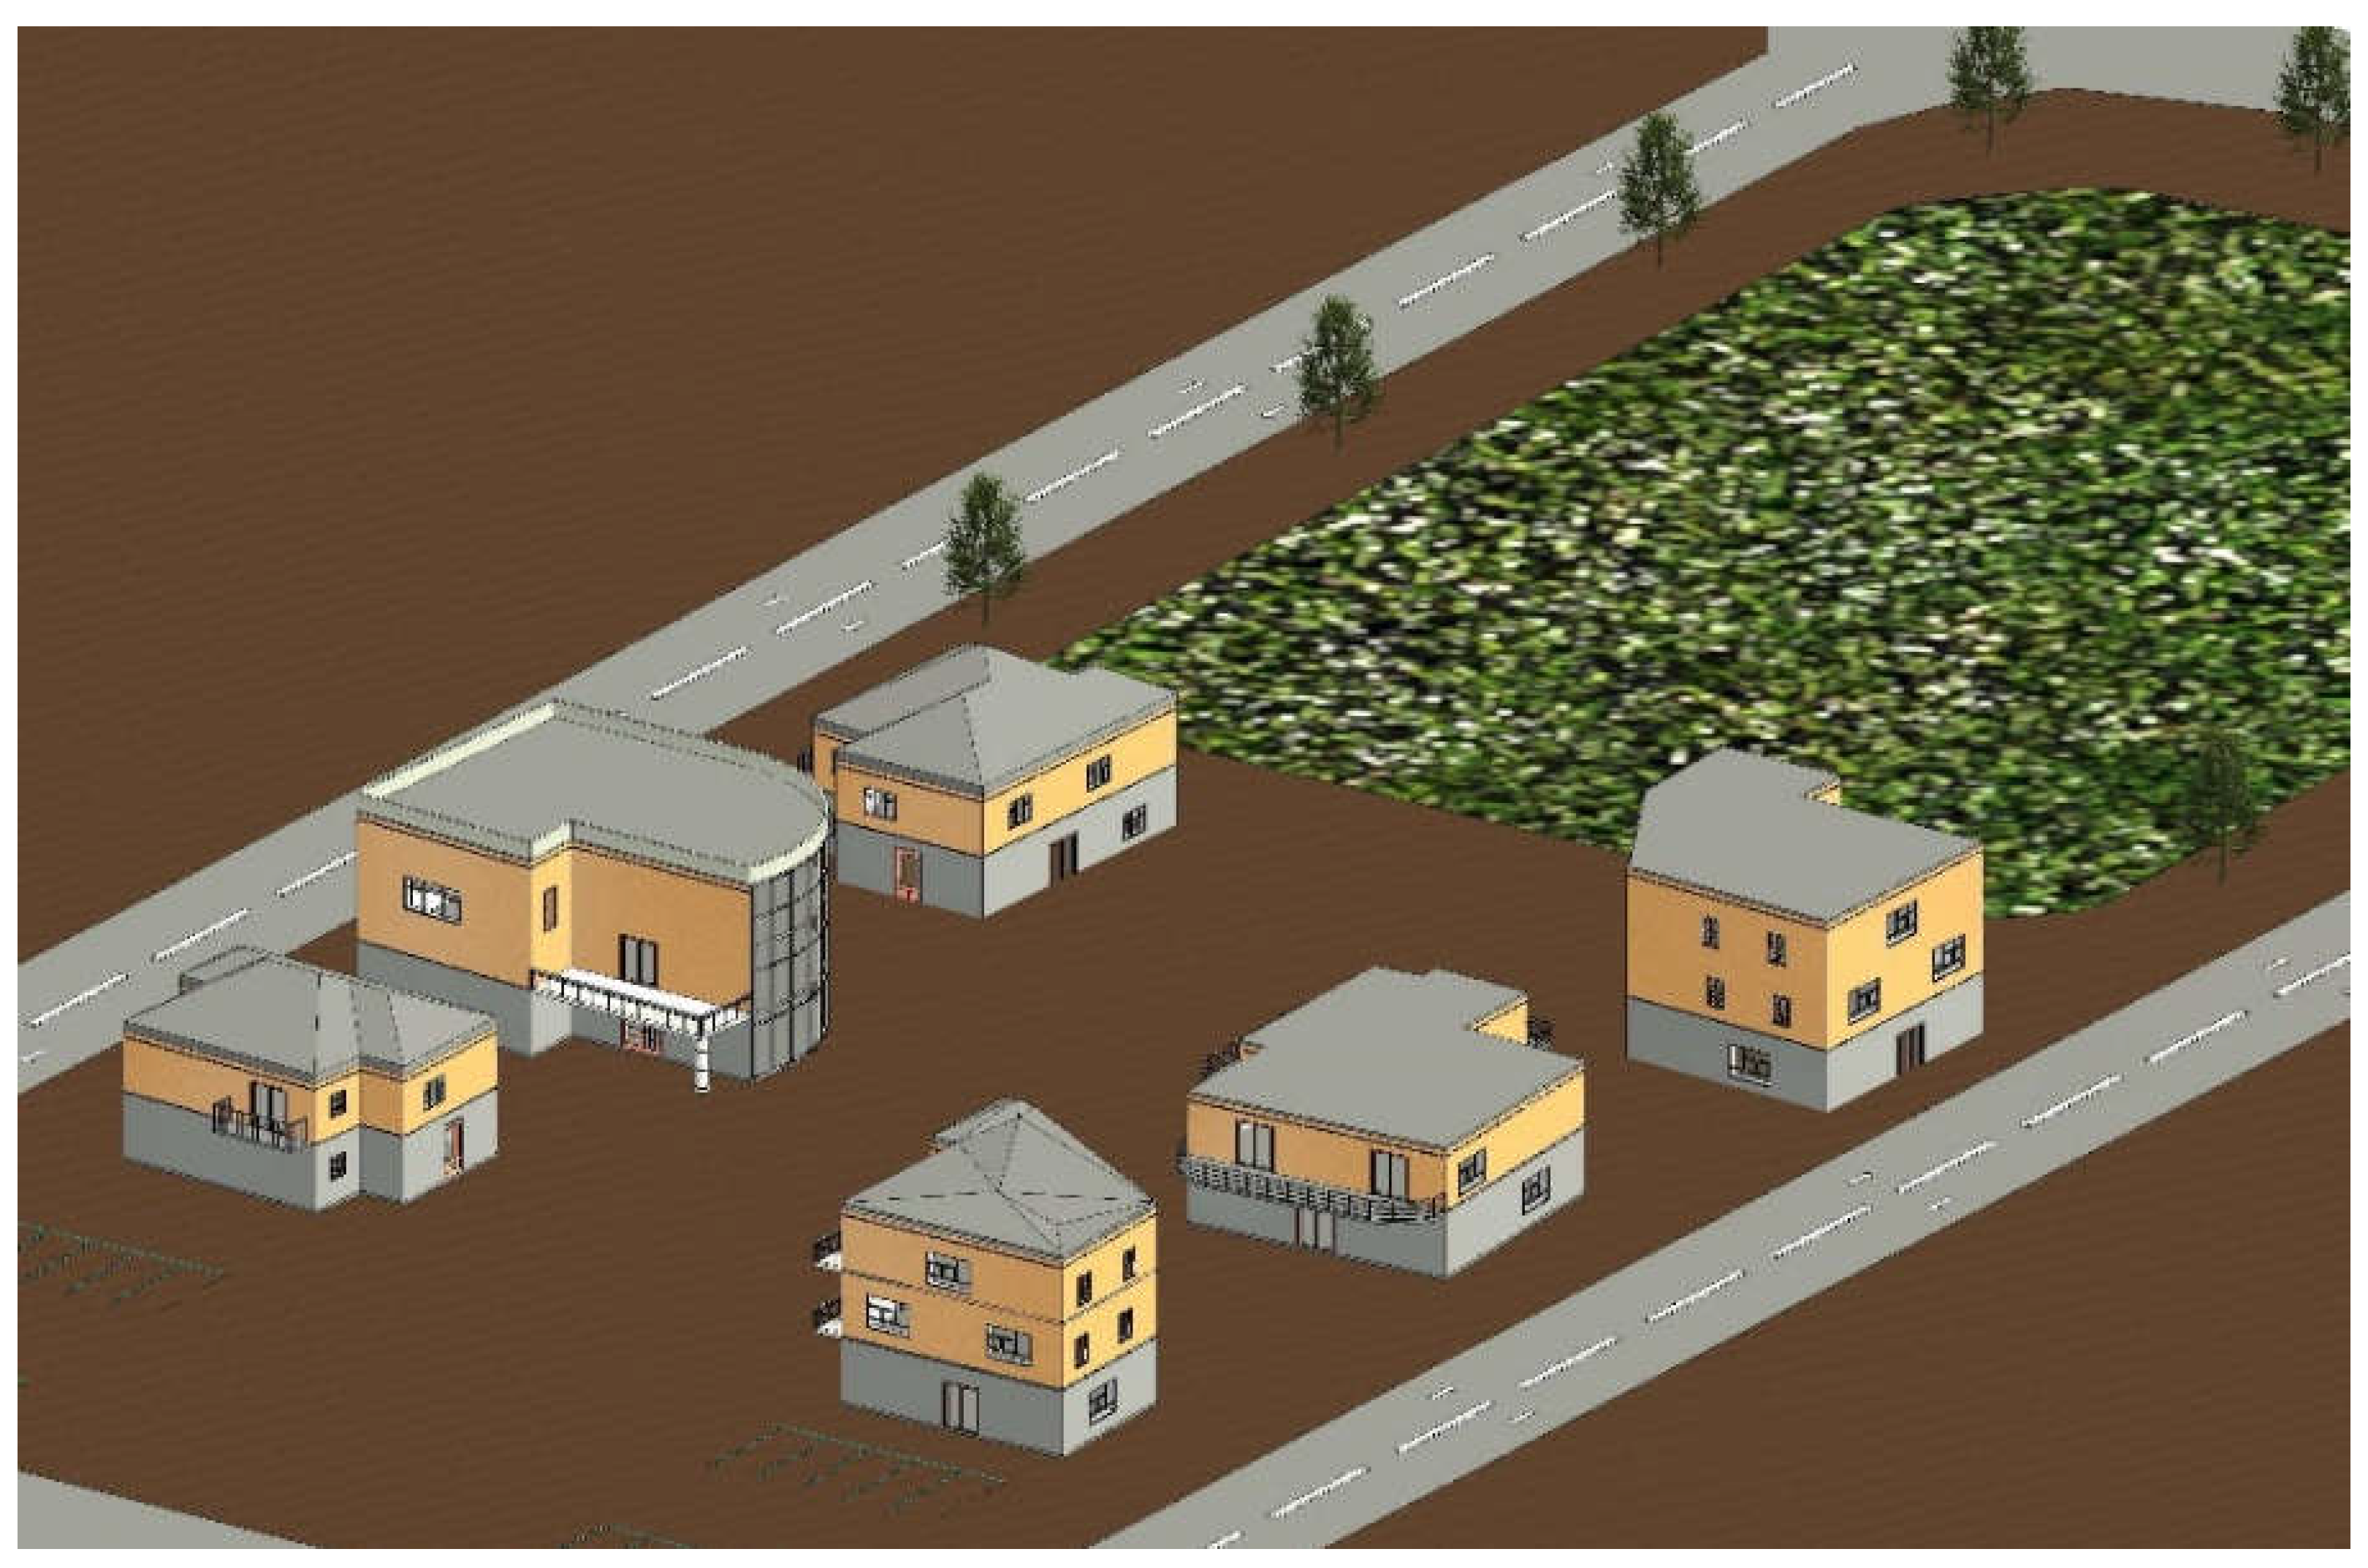
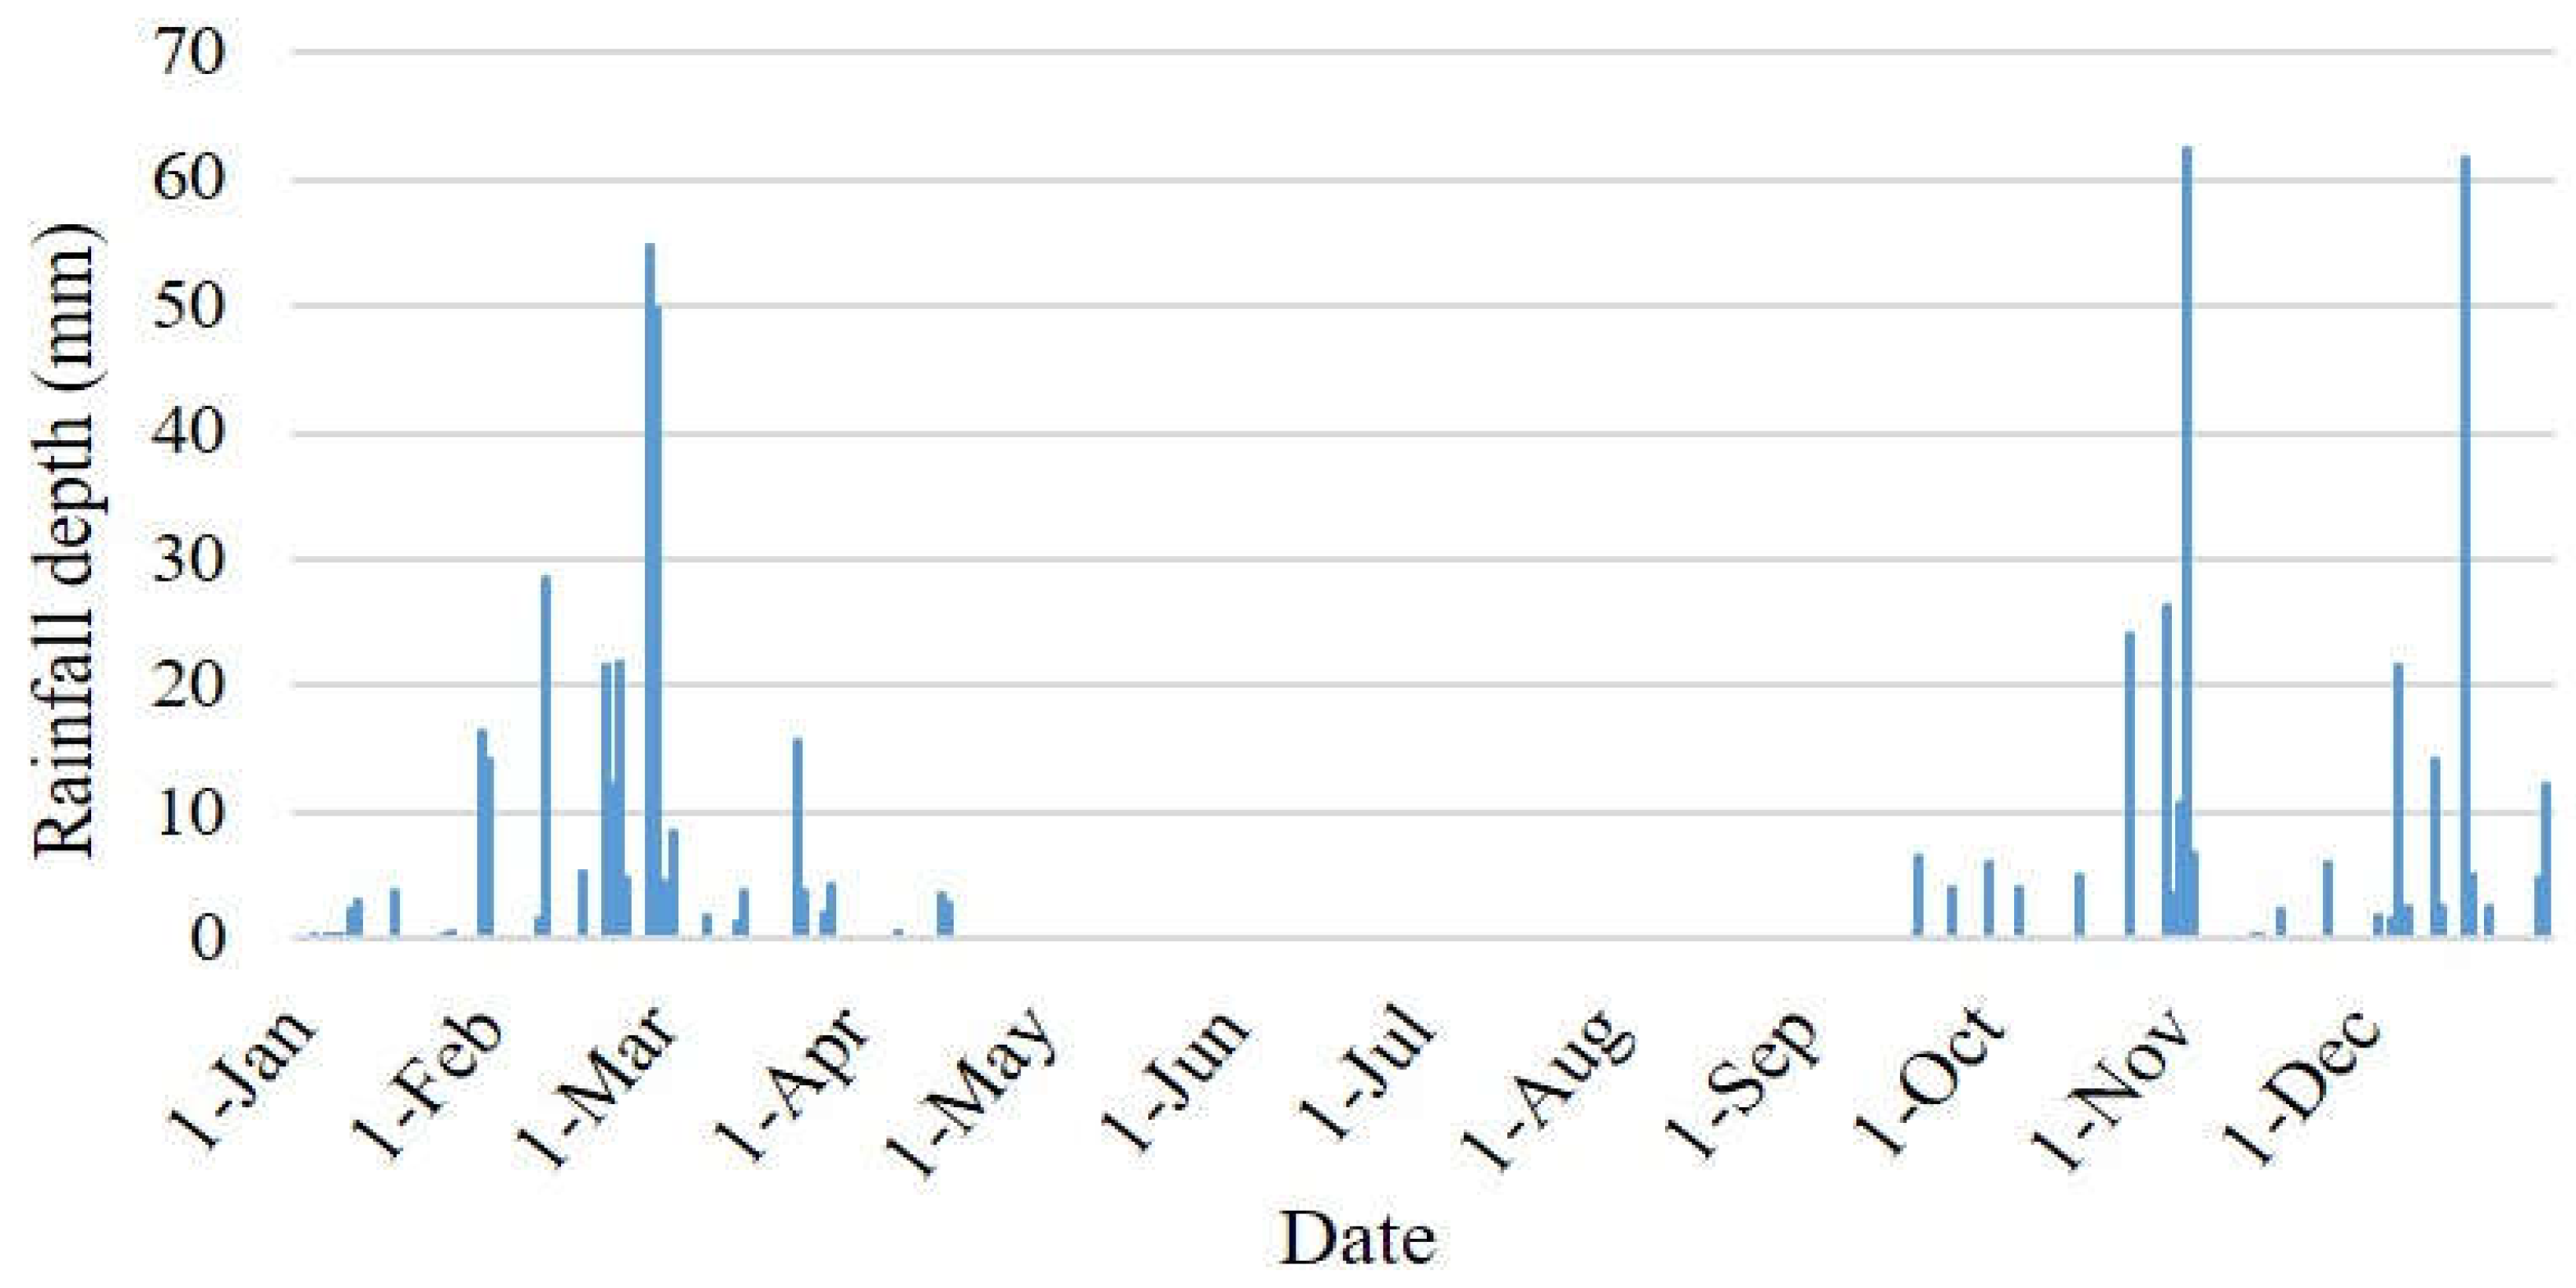
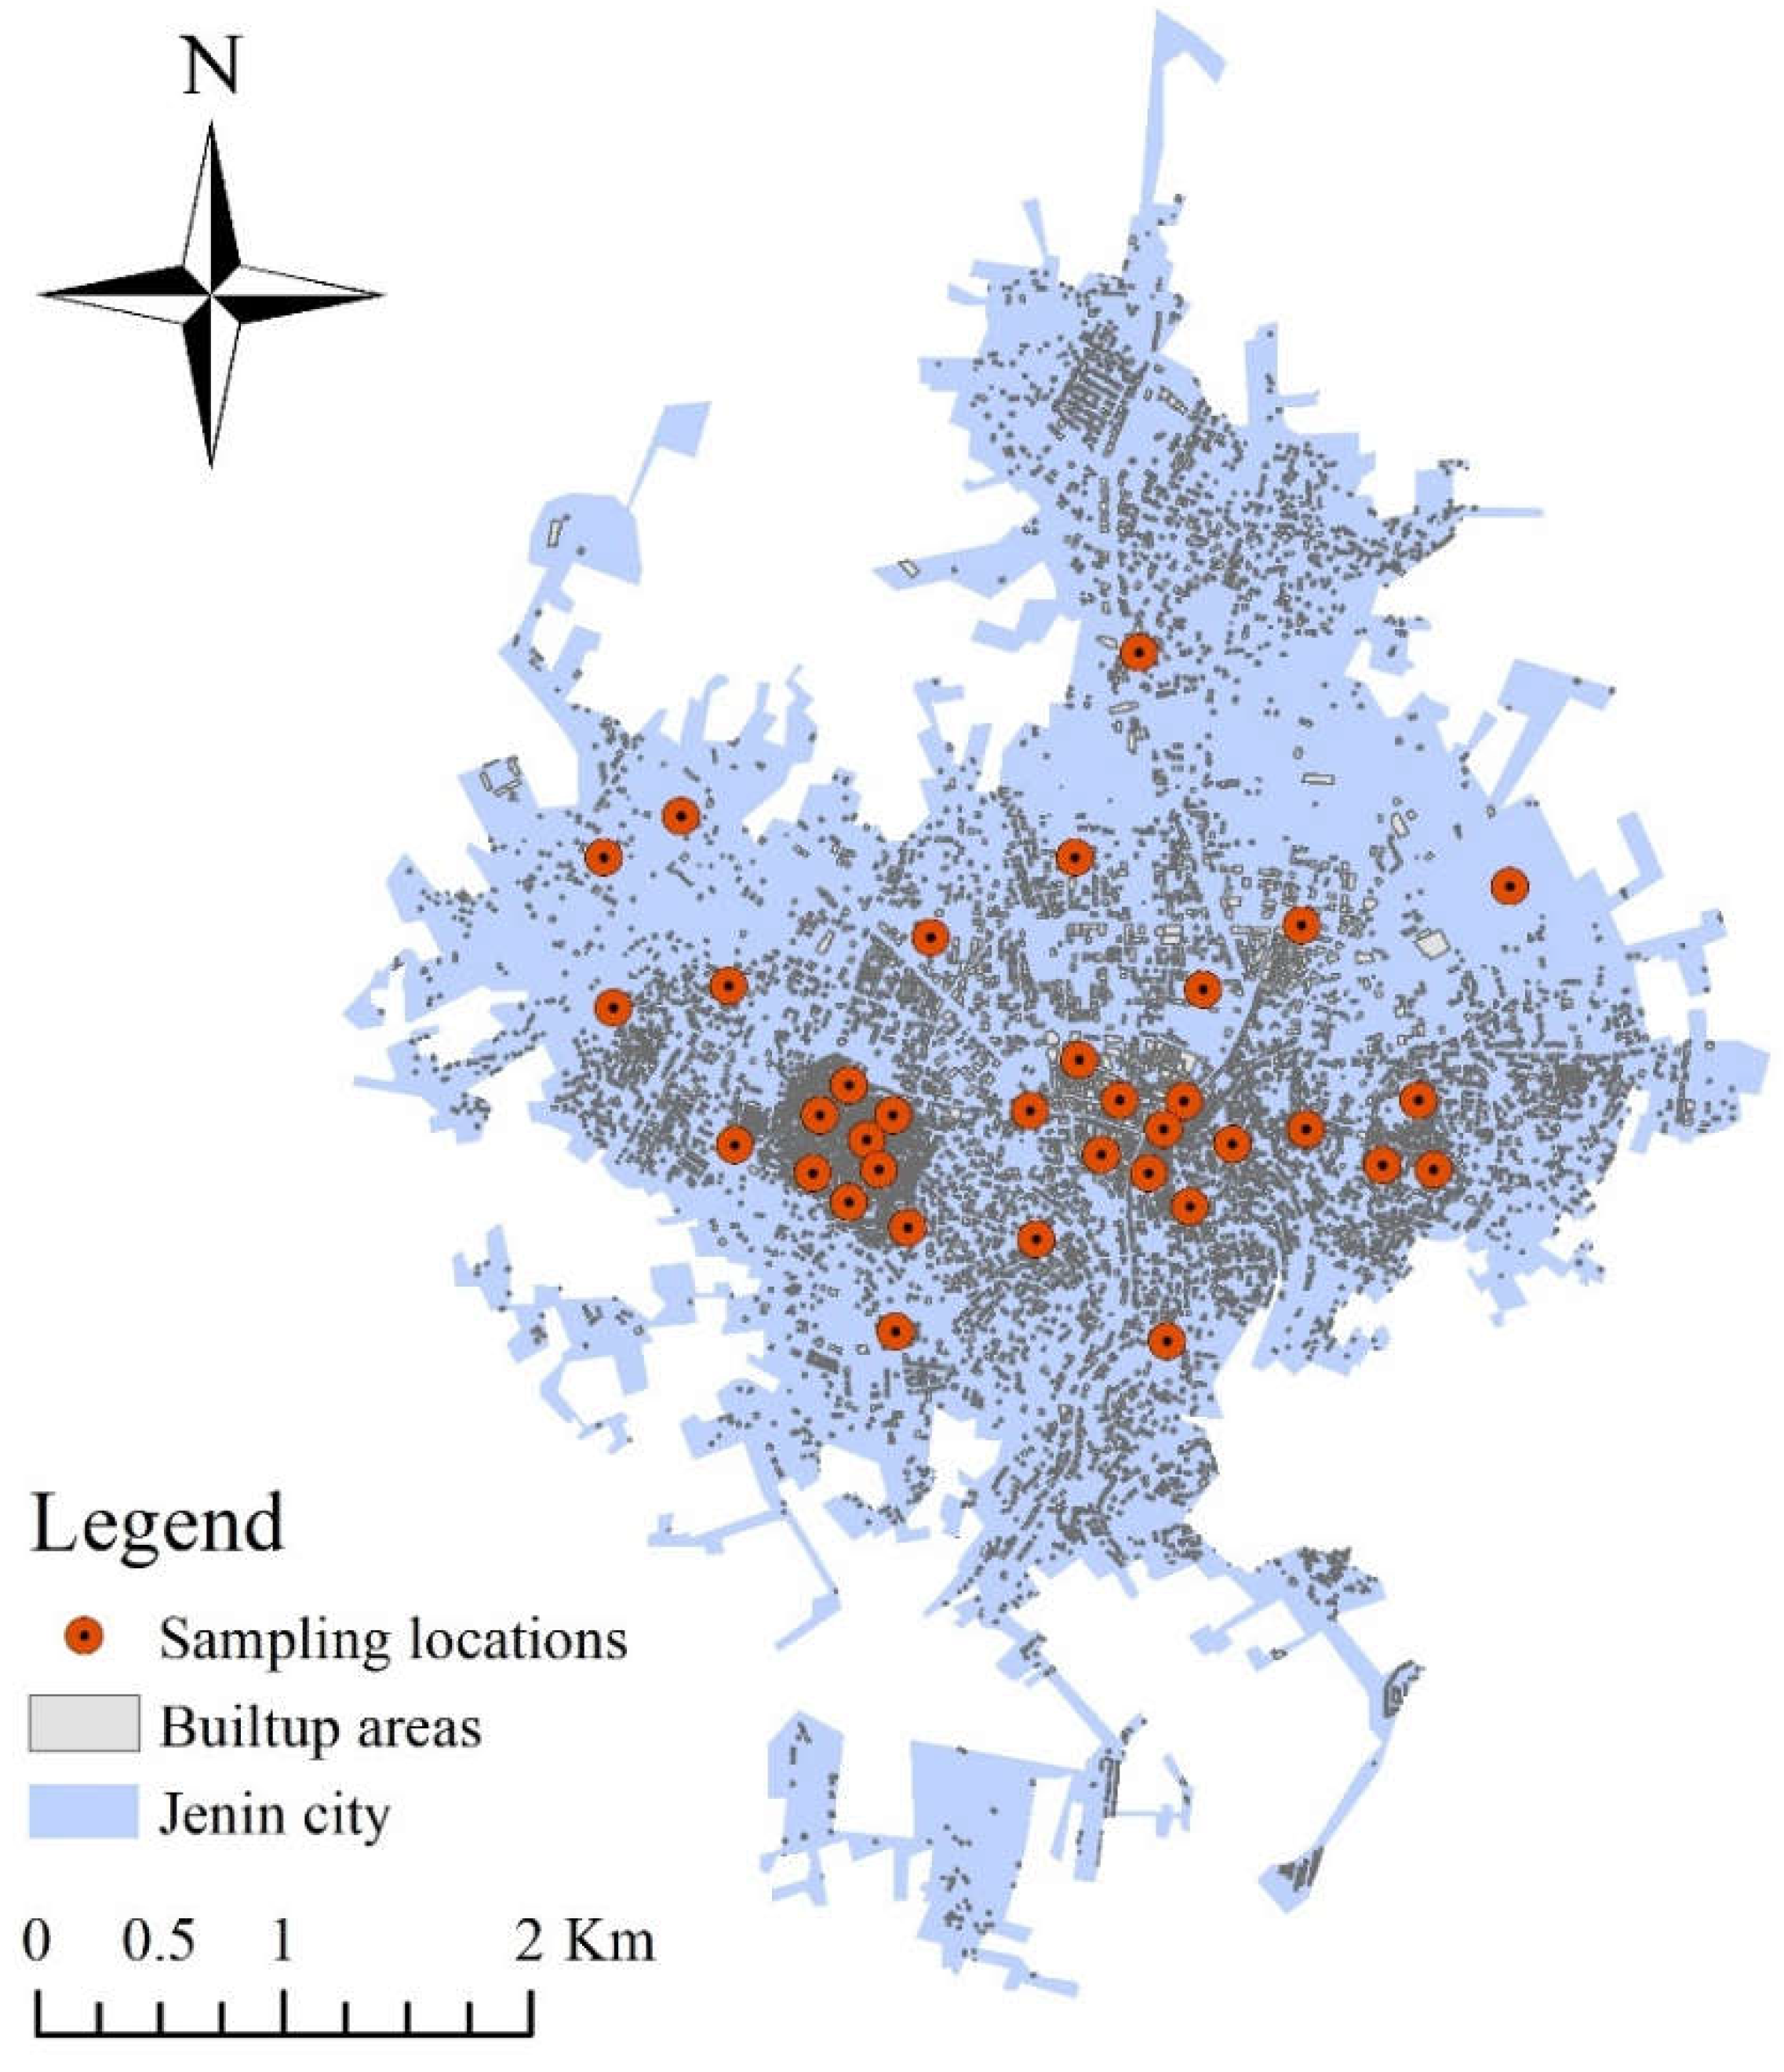
3. Case Study

The application of the proposed methodology was carried out in a small neighborhood in the city of Jenin, which is located in the north of the West Bank, Palestine (See Figure 6). Table 1 summarizes the characteristics of the six buildings in the neighborhood.
However, the water supply continuity is vulnerable and ranges between 2–3 days/week [98]. Each of the high-altitude, moderate-altitude, and low-altitude locations in the study area are separately supplied (7 days every 3 weeks). Therefore, supply volumes vary considering the altitude of the community and the season (See Table 2). DWCR of about 100 L/c/d is specified for the study area, according to the WHO and Palestinian Water Authority (PWA) recommendations [25,99].
The community receives an average annual rainfall of around 590 mm/year, while the maximum annual daily rainfall is about 62.3 mm/day [100]. Therefore, the number of rainy days (with rainfall depth of more than 1 mm/day) is around 50 days [100]. The temporal distribution of the daily rainfall in the study area is shown in Figure 7. It is noticed that most of the rainfall falls between October and April.
Spatially distributed RWH samples were collected from 35 residential units in the city of Jenin (See Figure 8). The sampling process was carried out between October and December 2021. RWH samples were analyzed at the laboratory for various physiochemical and biological water quality parameters, including pH, turbidity, chloride, alkalinity, total dissolved solids (TDS), FC, and residual chlorine. The sampling and analysis processes were carried out considering the regulations and procedures stated by the WHO [60]. Analysis results were then compared to the WHO drinking water standards [60].

4. Results

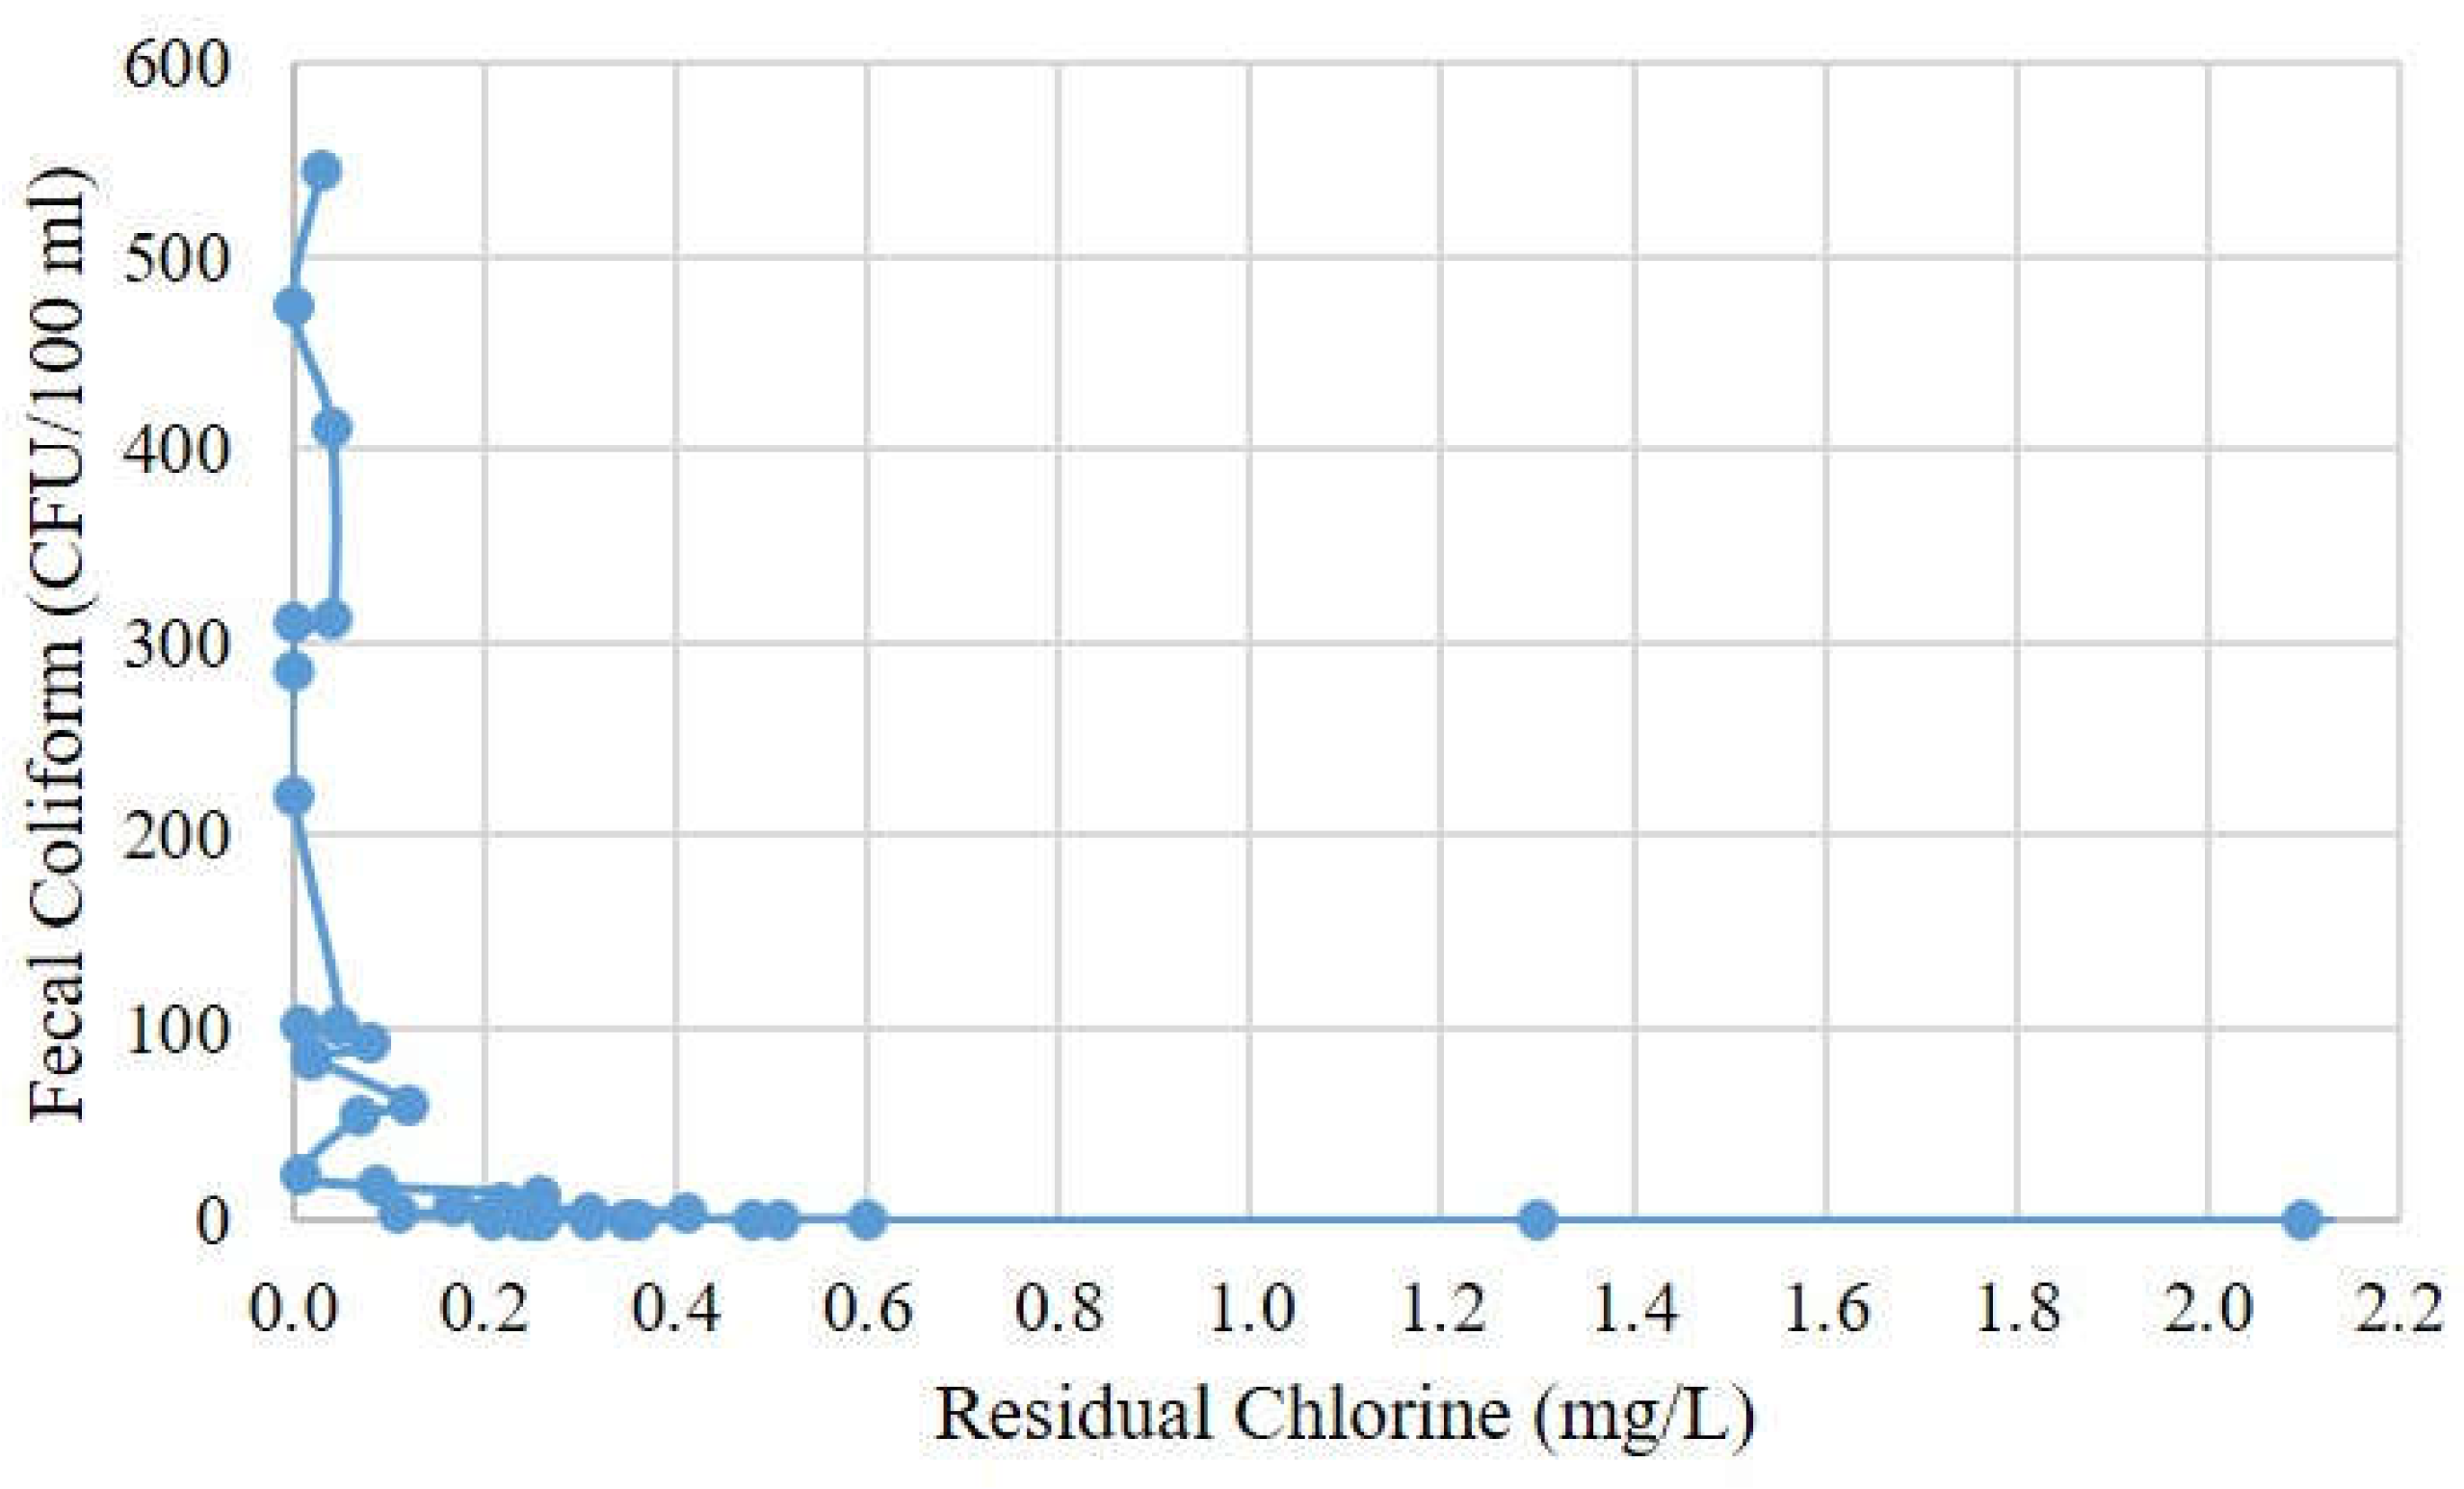
4.1. Smart RWH Quality Assessment and Control

This section assesses the probable physiochemical and biological contamination in the collected RWH samples (Table 3). Accordingly, it proposes the most suitable and feasible smart quality control options.
Table 3 shows that pH, chloride, alkalinity, and TDS are within the acceptable limits of the WHO standards for all the samples. In contrast, 20% of the samples exceed the thresholds of the WHO turbidity standards. Measured turbidity could reach 29 nephelometric turbidity units (NTU), about six times higher than the maximum allowable limit (5 NTU). This could be related to the absence of screens and filters in the RWH systems present in the study area [101]. High turbidity protects the organisms (e.g., bacteria and pathogens) in the drinking water [102,103,104]; therefore, disinfecting the water (e.g., through chlorination) becomes less efficient. Thus, consuming such water could cause nausea and headaches to users [102,103,104].
Around 49% of the samples recorded FC levels higher than the WHO standards. The maximum presence of FC in the sampled water reaches 545 CFU/100 mL (around 55 times the maximum allowable limit by the WHO). This could be attributed to the extensive use of cesspits for wastewater disposal [19]. Leaching from these cesspits could contaminate the underground RWH tank [101,105,106]. Birds, animals, and other creatures’ fecal waste (on the roof or next to the storage tank) form a main source of FC in the harvested rainwater [101,105,106]. Elevated numbers of FC in drinking water are linked to stomach infections, and intestinal diseases such as diarrhea and nausea [107,108]. The severity of such health problems might be higher and could be life-threatening for people suffering from immune deficiencies [107,108].
In total, 51% of the samples recorded a residual chlorine concentration lower than the minimum recommended concentration. Securing the minimum recommended chlorine concentration in drinking water is important [109,110] to eliminate bacteria’s harmful effects and prevent water recontamination during the storage phase [109,110]. On the other hand, around 6% of the samples exceeded the maximum allowable residual chlorine concentration. High residual chlorine concentrations can react to form hypochlorous acid and hypochlorites [111,112]. Therefore, consuming water with high chlorine concentrations could cause human health problems such as diarrhea, vomiting, stomachaches, poisoning, and bladder cancer [111,112,113,114]. In addition, high chlorine levels affect the water palatability since it becomes of unpleasant taste and odor [115,116].
Results of the physiochemical and biological assessment are compatible with what was found by other scholars for the southern [105,117,118], middle [101], and northern [106] parts of the West Bank.
Figure 9 indicates the negative relationship between residual chlorine and FC among the 35 samples. Such a relationship is in line with other researchers’ findings [119,120,121]. It was found that 16 out of the 17 samples contaminated by FC were also over the stated limits of residual chlorine. They almost fall below the minimum threshold of residual chlorine (0.2 mg/L). Therefore, controlling the levels of residual chlorine in RWH will relatively secure the control of FC as well.
The physiochemical and biological analysis shows that the control of the RWH turbidity is the first defense line for securing RWH potability in the study area. Such control could be performed by installing the inlet pipe screen, first flush diverter, filter, and overflow pipe screen. The smart monitoring of turbidity could be conducted by assessing the performance of such a defense line. This could be achieved by using (i) smart turbidity sensors and/or (ii) conventional turbidity meters and crowdsourcing.
Controlling the FC levels is the most important part of the RWH quality control. Due to its efficiency, scholars recommend the use of UV filtration for the control of FC in rainwater water [64]. However, the high cost of this filtration restricts its suitability for decentralized water systems, particularly in developing countries [122]. Boiling is another option for water disinfection [123]. However, it has limited suitability to the smart shred system, and it is more suitable for individual household practices. Moreover, the boiling and cooling of water is energy dependent, time-consuming, and restricts the direct use of water [123].
Chlorination is proposed for the disinfection of rainwater in the smart systems due to several factors including its efficiency [122], low cost [122], and the abundance and experience to deal with the disinfectant materials in the West Bank [98]. According to the WHO, RWH requires 2 mg/L of chlorine to be disinfected (to inactive the organisms, including FC) [99]. Thus, the WHO recommended an optimal chlorination rate of about 2.5 mg/L to ensure the disinfection of existing FC [99]. Such disinfection maintains a residual chlorine concentration of around 0.5 mg/L in the harvested water. This will secure the re-disinfection of future FC contamination during the storage and pumping phases [99]. Thus, the use and calibration of the chlorination unit are of high importance in the smart RWH system. In addition, residual chlorine sensors/meters are noticeably cheaper than other water quality sensors (including FC sensors/meters) [60,99]. Therefore, this research proposes the use of these feasible sensors to control FC and residual chlorine levels through the RWH system in the study area.
New do-it-yourself (DIY) systems are proposed by a non-governmental organization (NGO), Aqueous Solutions, for the biological treatment of water (based on biochar and metallic iron) [66]. Such cost-effective systems showed their efficiency for water disinfection in Thailand [66]. Up to now, these DIY systems are not available in the West Bank. Therefore, they are highly recommended in the future.

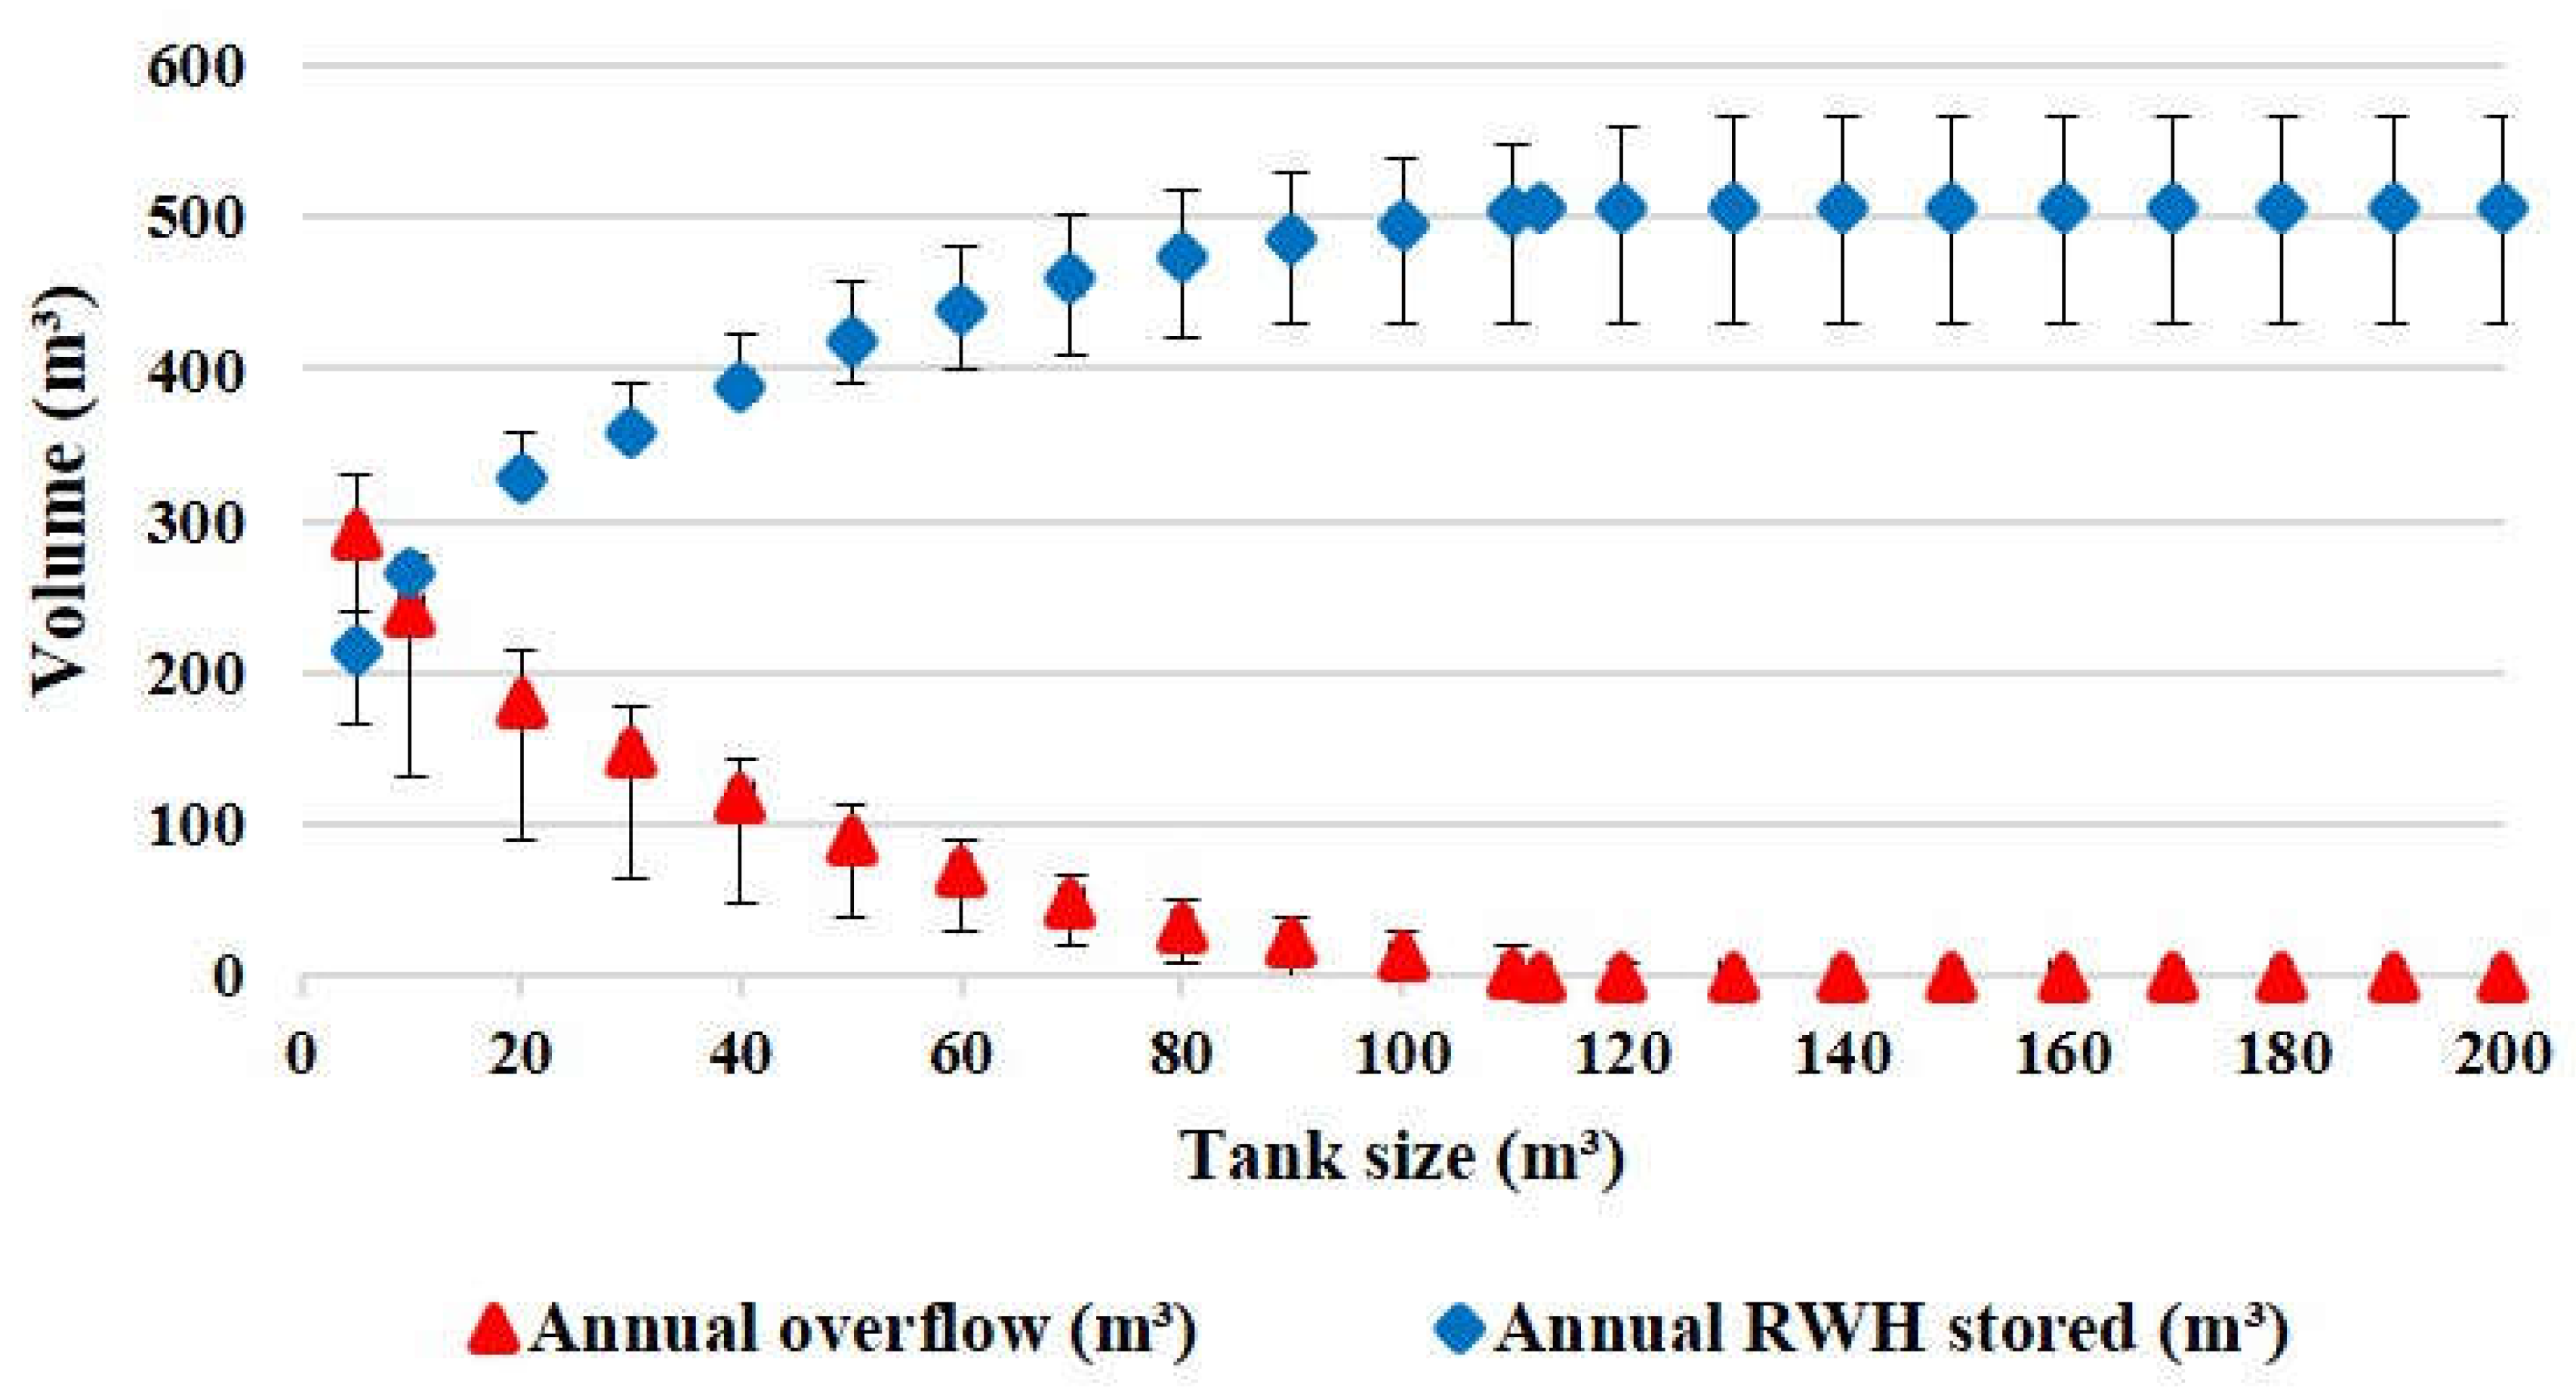
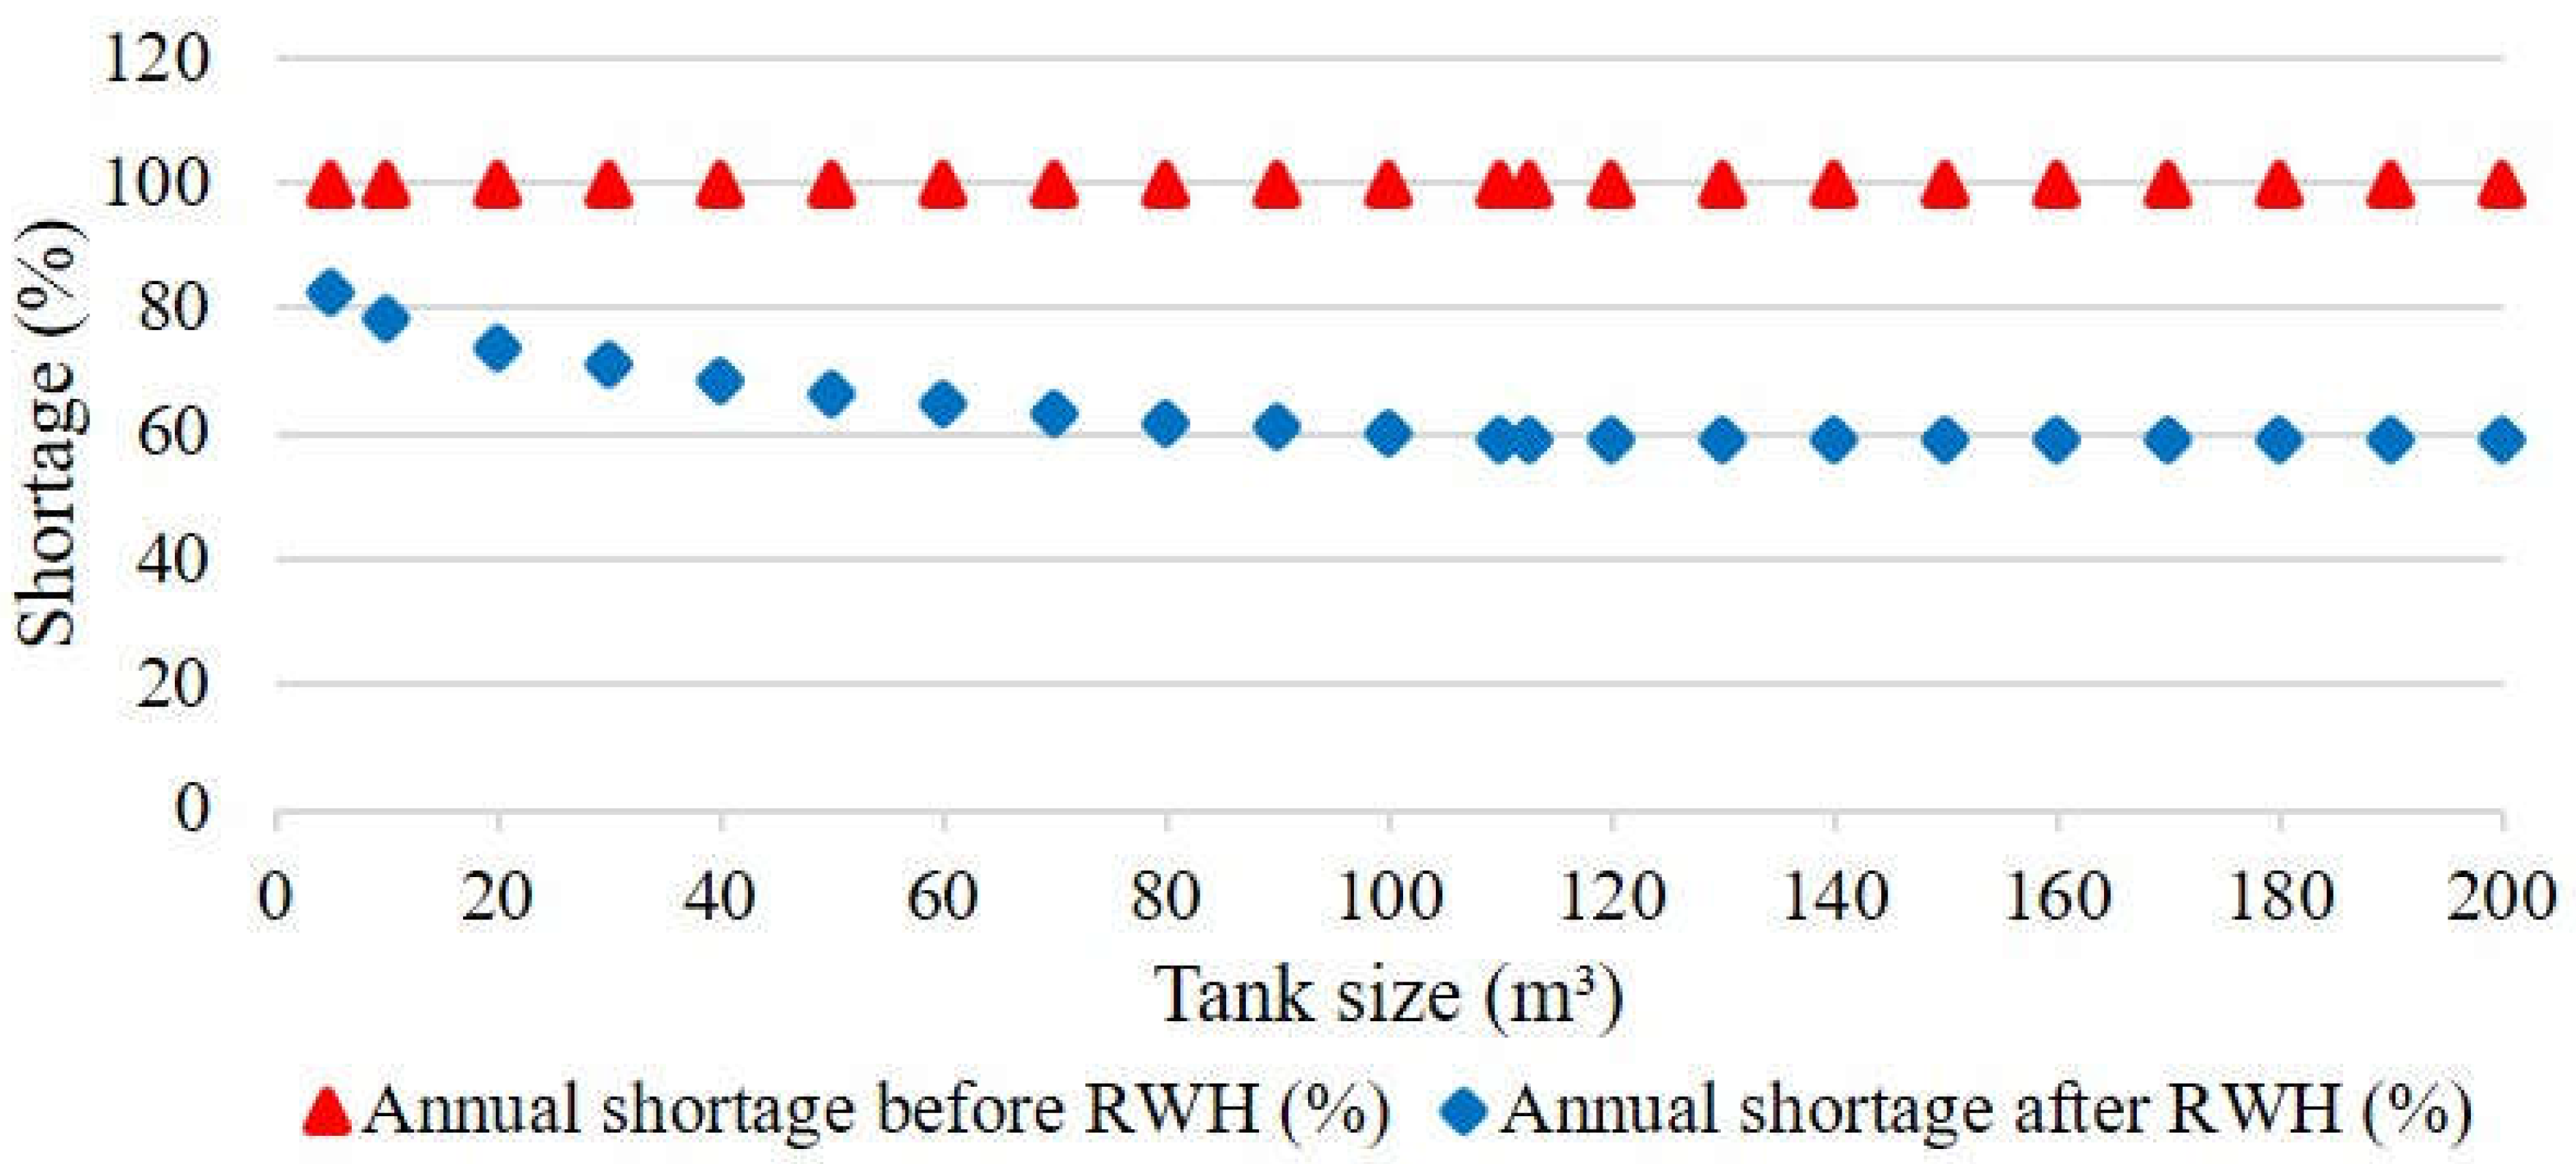
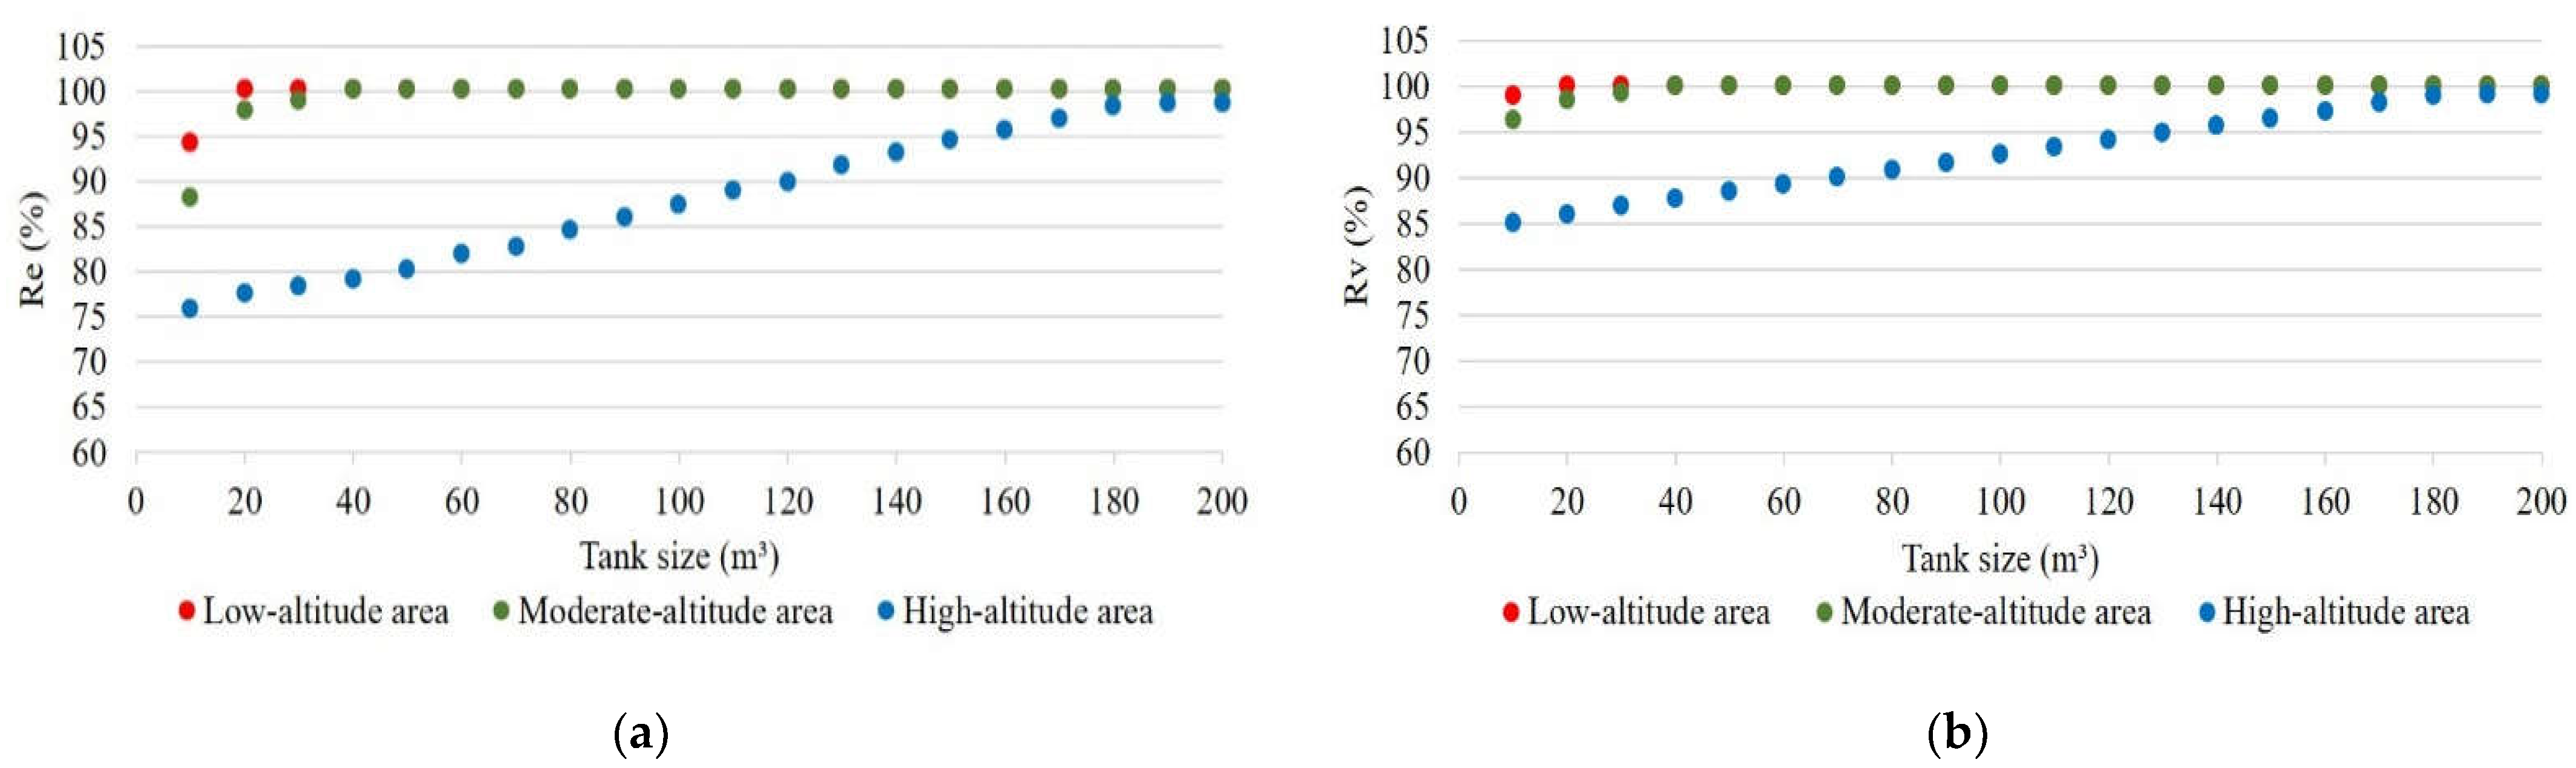
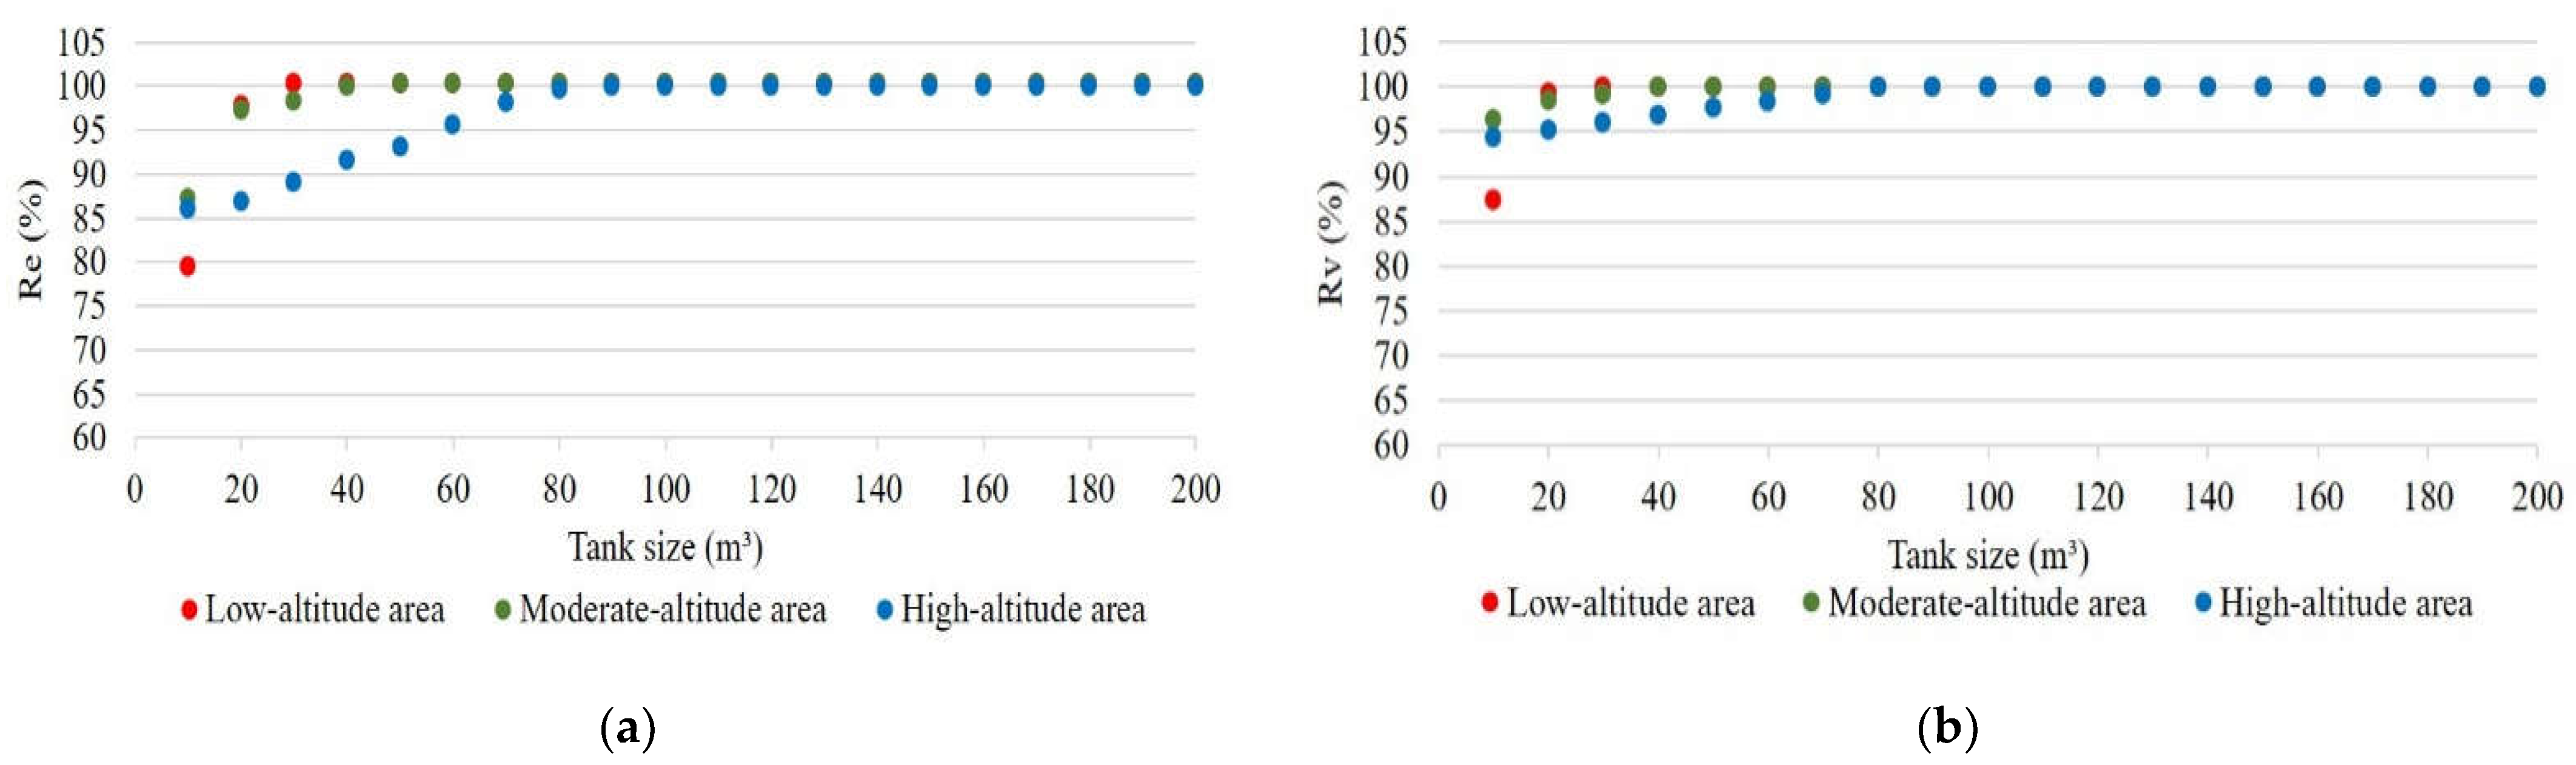
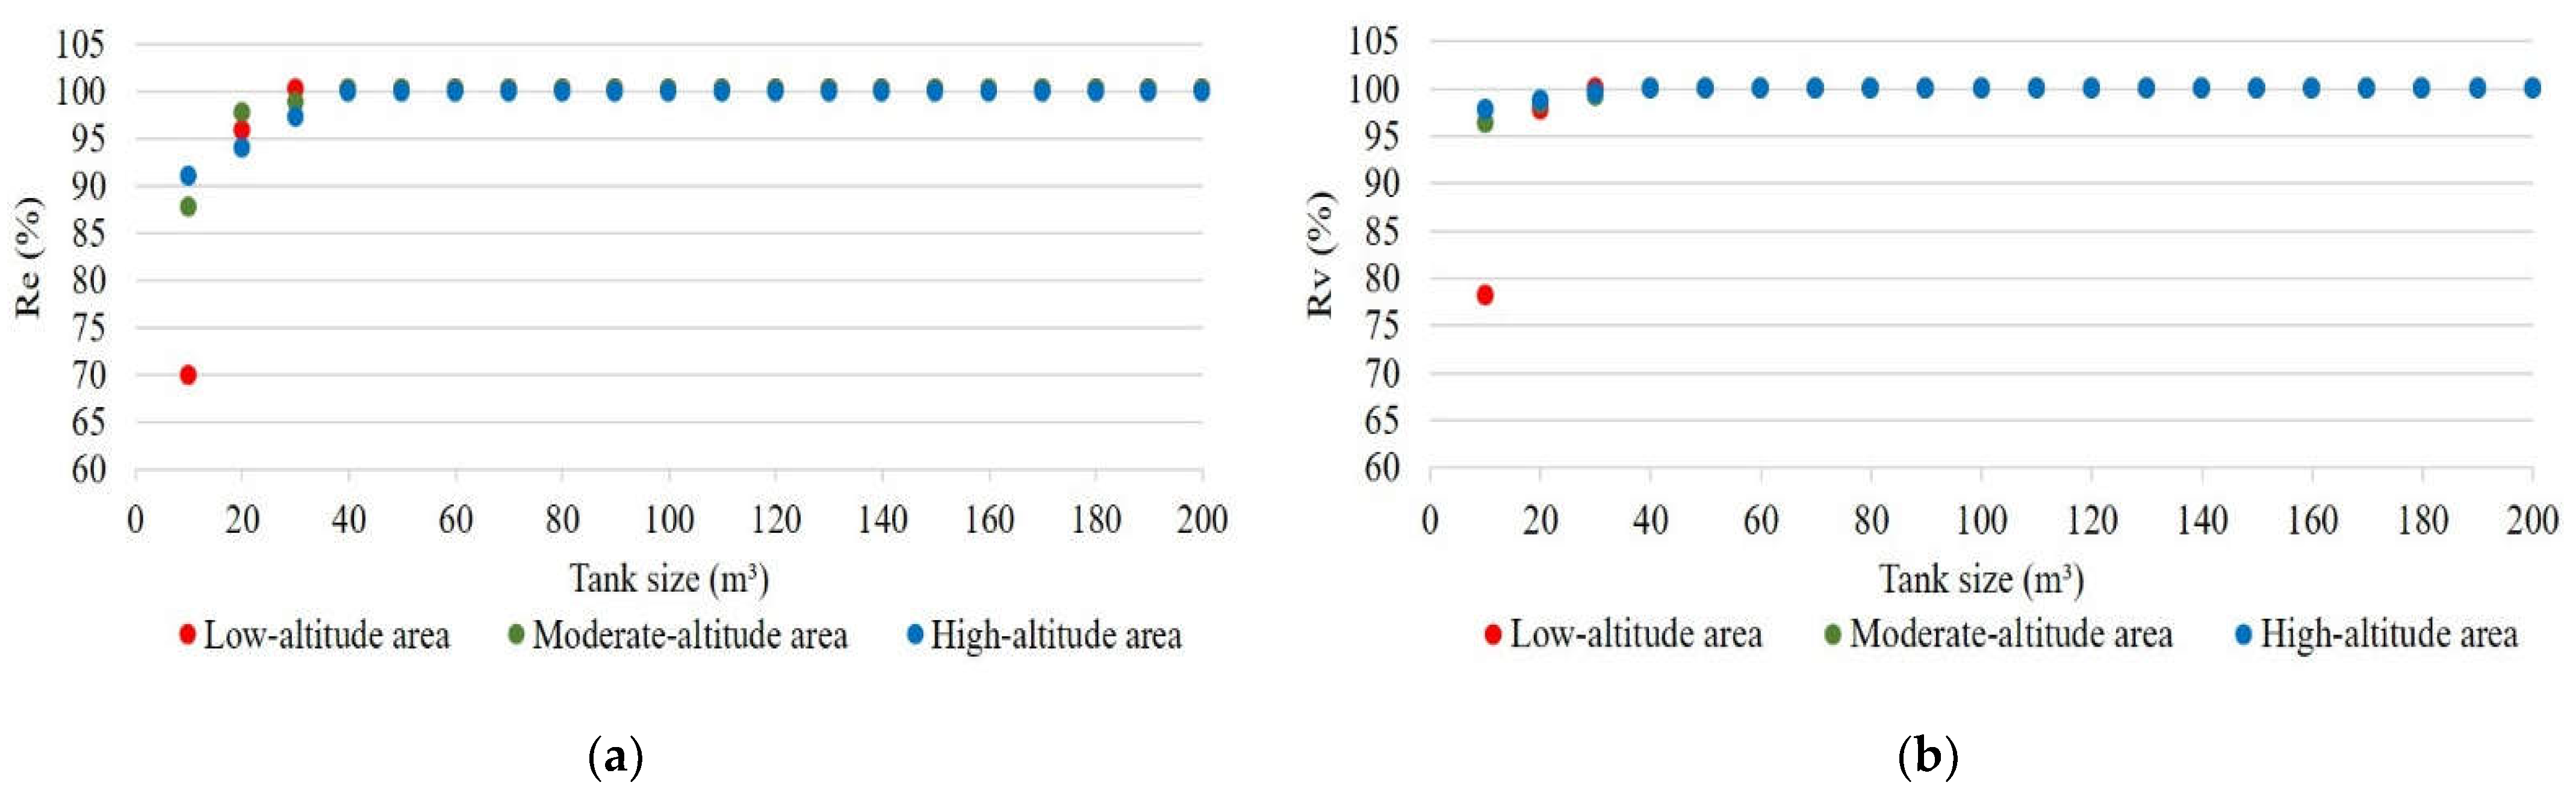
4.2. Smart RWH System Reliability

This section discusses the reliability of the smart RWH system in supplying the residents with their potable water needs. The potential annual RWH volume on the roofs is around 507 m3. However, the actual annual RWH volume that could be stored and utilized is dependent to the size of the RWH storage tank. Figure 10 shows the effect of RWH tank size on the annual RWH and overflow volumes. It is found that the annual storage of the RWH increases with the tank size to attain a maximum of about 500 m3 for a tank size of 112 m3. This size guarantees no overflow from the tank. Errors in the volumes of RWH and tank overflow could be caused by two main sources: (i) partial exploitation of the roofs for RWH, and (ii) temporal variation in rainfall volumes. Since there is no available data concerning the exploitation rates of each roof, this error analysis neglects the effect of such rates, but they are highly recommended to be considered in future work (e.g., using surveys). The furnished error analysis in this paper focuses on the temporal variation in rainfall volumes (by comparing the dry and wet years to the adopted average rainfall year). Figure 10 shows that the higher tank size was, the higher the error in RWH volumes were. In contrast, it was found that the higher the tank size was, the lower the error in overflow volumes were.
According to Equation (1), the annual water demand for the study area is around 1240 m3/year. The lowest shortage (59%) in water supply could be reached by using the optimal tank size (112.5 m3) (See Figure 11). However, using lower sizes is associated with a higher shortage rate. For instance, the tank of 5 m3 size has 83% shortage in providing the needed water demand.
Figure 12 displays the influence of the tank size on Re and Rv of the smart RWH system. Re is around 12.6% for the 5 m3 tank. Such a rate covers the water demand for 46 days. The maximum Re (37.5%) is recorded for the 112.5 m3 tank, which means that the residents’ water demand is covered for 137 days. Concerning Rv, the maximum recorded rate is 41%. This implies providing the residents with an average daily supply of (41 L/c/d).
To overcome the water shortage with the RWH system, it is necessary to use the dual water system that combines RWH and municipal water supply [124]. Various researchers discussed the concept and performance of the dual supply system [124,125,126,127,128]. Scholars agreed on adopting two independent distribution networks: centralized and decentralized [124,125,126,127,128]. This section discusses the dynamic management of the proposed dual water supply system. Such management considers the various spatial levels in the study area (e.g., high-altitude, moderate-altitude, and low-altitude locations).
Figure 13 shows the effect of the tank size on Re and Rv for the smart dual water supply system, in light of the existing municipal water supply agenda. Both reliability indices hit 100% for the low-altitude (using tank sizes of 20 m3) and moderate-altitude locations (using tank sizes of 40 m3). This implies fully addressing water scarcity (0% of water shortage). Concerning high-altitude locations, Re ranges between 76% (for 10 m3 tank) and 98% (for 190 m3 tank). In addition, Rv ranges between 85% (for 10 m3 tank) and 99% (for 190 m3 tank).
Such results urge the need to propose and examine other municipal water supply agendas in order to achieve 100% reliability for all altitude levels. Thus, two agendas are introduced: (i) agenda A (9, 7, and 5 days of water supply per 3 weeks for high-altitude, moderate-altitude, and low-altitude locations, respectively), and agenda B (10, 7, and 4 days of water supply per 3 weeks for high-altitude, moderate-altitude, and low-altitude locations, respectively).
Figure 14 shows that agenda A could assist in reaching the full reliability (both Re and Rv) at all altitude levels in the study area. This could be realized by utilizing tank sizes of 30, 40, and 80 m3 for the low-altitude, moderate-altitude, and high-altitude regions, respectively. On the other hand, it was found that agenda B achieves the same reliability records (100%) by utilizing smaller tank sizes. Tank sizes of 30 m3 could be used in low-altitude areas, and 40 m3 could be used in moderate-altitude and high-altitude areas (See Figure 15). These results indicate the efficiency and reliability of the dual water system in addressing the water demand compared to the smart RWH system solely. It also shows the need for rescheduling the existing municipal water supply agenda.

5. Discussion

This section compares the findings of the proposed smart RWH and dual systems to what was found by other scholars. The smart RWH system attained a potential annual RWH capacity in the study area of about 0.6 m3 of rainfall per 1 m2 of roof, which is slightly higher than the 0.5 m3 of rainfall per 1 m2 of roof found by Alawna and Shadeed, 2021 [129]. The slight variation could be due to the different sources of rainfall data. Our study used daily rainfall data while Alawna and Shadeed, 2021, relied on long-term annual rainfall data [129].
The success and efficiency of RWH in addressing 41% of the needed water demand supports what was found by Shadeed et al., 2019 [130], which highlighted Jenin Governorate as an optimal location for implementing the rooftop RWH systems.
According to Shadeed and Alawna, 2021 [131], a 60 m3 storage tank is needed to entail a 39% of Rv for a five-member family living in a 150 m2 house in Jenin Governorate. On the other hand, the smart RWH system proposed in this paper entailed a 41% Rv using a 112 m3 shared storage tank for 34 persons living in five houses (with total roof areas of about 840 m2). More efficiently, the dynamically managed dual water system hits a 100% Rv for the five houses using a 40 m3 shared storage tank, given the rescheduling of the municipal water supply agenda (Agenda B). The higher reliability of the shared systems with respect to the individual ones could be referred to the swap in harvesting and utilization of the rainwater among the five houses. Thus, adopting either the 112 m3 or the 40 m3 shared tanks instead of using five individual tanks (60 m3 each) could significantly promote the socioeconomic development of the study area.

6. Conclusions

This paper introduced and assessed the reliability of a smart RWH/dual water supply system to address the potable water shortage in the water-scarce areas. First, assessing the potential challenges of the conventional roof RWH systems was followed by proposing a smart RWH system architecture to cope with such challenges. Next, the smart system architecture was introduced, in light of the collection and utilization of shared RWH. A Python-based simulation followed this to assess the reliability of the smart RWH system.
Results indicated the need for a crowdsourcing-based, and automation-based treatment and check units in the smart system to control the elevated turbidity, fecal coliform, and residual chlorine in the harvested rainwater in Jenin. The smart RWH system showed the capability to cover 41% of the domestic water needs of citizens.
Results indicated the efficiency and reliability of the dual water system in addressing the water demand compared to the smart RWH system solely. The dynamic management of the system (including the storage) enabled the best reliability by using smaller storage tank sizes. This could have a significant positive effect on the city’s socio-economic development. Results also showed the need for rescheduling the existing municipal water supply agenda. By adopting the dynamic management and a new supply agenda, the smart dual system showed its ability to cover the water demand at all altitude levels in the study area.
Future research could improve the work achieved by targeting (i) the cost-benefit analysis for the smart RWH system and (ii) the social acceptance investigation for the adoption of the proposed system.

Author Contributions

Conceptualization, T.J. and I.S.; methodology, T.J. and I.S.; software, T.J.; validation, T.J., I.S. and F.C.; formal analysis, T.J.; investigation, T.J. and I.S.; resources, I.S.; data curation, T.J. and I.S.; writing—original draft preparation, T.J.; writing—review and editing, T.J., I.S. and F.C.; visualization, T.J.; supervision, I.S. and F.C.; project administration, I.S.; funding acquisition, I.S. All authors have read and agreed to the published version of the manuscript.

Funding

This research received no external funding.

Institutional Review Board Statement

Not applicable.

Informed Consent Statement

Not applicable.

Data Availability Statement

Restrictions apply to the availability of these data. Data was obtained from Palestinian Water Authority (PWA), Palestinian Metrological Authority (PMA), and The Palestinian Central Bureau of Statistics (BCBS). Data are available from the authors with the permission of PWA, PMA, and BCBS.

Conflicts of Interest

The authors declare no conflict of interest.

References

  1. Gould, J.; Nissen-Petersen, E. Rainwater Catchment Systems for Domestic Supply: Design, Construction and Implementation; IT Publications: London, UK, 1999. [Google Scholar]
  2. Biswas, S.; Sahoo, S.; Debsarkar, A.; Pal, M. Assessment of Adoption Potential of Rooftop Rainwater Harvesting to Combat Water Scarcity: A Case Study of North Parganas District of West Bengal, India. Arab. J. Geosci. 2021, 14, 1636. [Google Scholar] [CrossRef]
  3. Sendanayake, S. Potential for Domestic Rooftop Rainwater Harvesting in the District of Colombo, Sri Lanka. Imp. J. Interdiscip. Res. IJIR 2016, 2, 231–236. [Google Scholar]
  4. Mundia, C. Assessing the Reliability of Rooftop Rainwater Harvesting for Domestic Use in Western Kenya. Master’s Thesis, Southern Illinois University, Carbondale, IL, USA, January 2021. [Google Scholar]
  5. Malambo, T.; Huang, Q. Rooftop Rainwater Harvesting as an Alternative Domestic Water Resource in Zambia. J. Geosci. Environ. Prot. 2016, 4, 41–57. [Google Scholar] [CrossRef] [Green Version]
  6. Boakye, E.; John-Jackson, N. Quantifying Rooftop Rainwater Harvest Potential: Case of Takoradi Polytechnic in Takoradi, Ghana. Int. J. Sci. Res. IJSR 2015, 5, 6–391. [Google Scholar] [CrossRef]
  7. Abbas, S.; Mahmood, M.; Yaseen, M. Assessing the Potential for Rooftop Rainwater Harvesting and Its Physio and Socioeconomic Impacts, Rawal Watershed, Islamabad, Pakistan. Environ. Dev. Sustain. 2021, 10, 17942–17963. [Google Scholar] [CrossRef]
  8. Abdulla, F.A. Rainwater Harvesting in Jordan: Potential Water Saving, Optimal Tank Sizing and Economic Analysis. Urban Water J. 2019, 17, 446–456. [Google Scholar] [CrossRef]
  9. Abu-Zreig, M.; Ababneh, F.; Abdullah, F. Assessment of Rooftop Rainwater Harvesting in Northern Jordan. Phys. Chem. Earth 2019, 114, 102794. [Google Scholar] [CrossRef]
  10. Rahimi, O.; Murakami, K. Rooftop Rainwater Harvesting and its Efficiency in Kabul New City. J. Jpn. Soc. Civ. Eng. 2017, 73, 25–30. [Google Scholar] [CrossRef] [Green Version]
  11. Gado, T.A.; El-Agha, D.E. Feasibility of Rainwater Harvesting for Sustainable Water Management in Urban Areas of Egypt. Environ. Sci. Pollut. Res. ESPR 2020, 27, 32304–32317. [Google Scholar] [CrossRef]
  12. Biswas, B.; Mandal, B. Construction and Evaluation of Rainwater Harvesting System for Domestic Use in a Remote and Rural Area of Khulna, Bangladesh. Int. Sch. Res. Notices 2014, 2014, 751952. [Google Scholar] [CrossRef]
  13. Patrão, C.; Moura, P.; de Almeida, A.T. Review of Smart City Assessment Tools. Smart Cities 2020, 3, 1117–1132. [Google Scholar] [CrossRef]
  14. Chourabi, H.; Nam, T.; Walker, S.; Gil-Garcia, J.R.; Mellouli, S.; Nahon, K.; Pardo, T.A.; Scholl, H.J. Understanding Smart Cities: An Integrative Framework. In Proceedings of the 45th Hawaii International Conference on System Sciences, Maui, HI, USA, 4–7 January 2012; pp. 2289–2297. [Google Scholar] [CrossRef]
  15. Preeti, P.; Rahman, A. A Case Study on Reliability, Water Demand and Economic Analysis of Rainwater Harvesting in Australian Capital Cities. Water 2021, 13, 2606. [Google Scholar] [CrossRef]
  16. Jaren, L.S.; Mondal, M.S. Assessing Water Poverty of Livelihood Groups in Peri-Urban Areas around Dhaka under a Changing Environment. Water 2021, 13, 2674. [Google Scholar] [CrossRef]
  17. Villar-Navascués, R.A.; Fragkou, M.C. Managing Water Scarcity Futures: Identifying Factors Influencing Water Quality, Risk Perception and Daily Practices in Urban Environments after the Introduction of Desalination. Water 2021, 13, 2738. [Google Scholar] [CrossRef]
  18. Ayt Ougougdal, H.; Yacoubi Khebiza, M.; Messouli, M.; Lachir, A. Assessment of Future Water Demand and Supply under IPCC Climate Change and Socio-Economic Scenarios, Using a Combination of Models in Ourika Watershed, High Atlas, Morocco. Water 2020, 12, 1751. [Google Scholar] [CrossRef]
  19. Judeh, T.; Bian, H.; Shahrour, I. GIS-Based Spatiotemporal Mapping of Groundwater Potability and Palatability Indices in Arid and Semi-Arid Areas. Water 2021, 13, 1323. [Google Scholar] [CrossRef]
  20. Judeh, T.; Haddad, M.; Özerol, G. Assessment of Water Governance in the West Bank, Palestine. Int. J. Glob. Environ. Issues 2017, 16, 119–134. [Google Scholar] [CrossRef]
  21. PCBS. Quantity of Water Supply for Domestic Sector, Water Consumed and Daily Consumption per Capita in the West Bank by Governorate in 2018. Available online: https://www.pcbs.gov.ps/Portals/_Rainbow/Documents/water-E9-2018.html (accessed on 14 June 2021).
  22. Anayah, F.M.; Almasri, M.N. Trends and Occurrences of Nitrate in the Groundwater of the West Bank, Palestine. Appl. Geogr. 2009, 29, 588–601. [Google Scholar] [CrossRef]
  23. Daghara, A.; Al-Khatib, I.A.; Al-Jabari, M. Quality of Drinking Water from Springs in Palestine: West Bank as a Case Study. J. Environ. Public Health 2019, 2019, 8631732. [Google Scholar] [CrossRef]
  24. Ranaee, E.; Abbasi, A.A.; Tabatabaee Yazdi, J.; Ziyaee, M. Feasibility of Rainwater Harvesting and Consumption in a Middle Eastern Semiarid Urban Area. Water 2021, 13, 2130. [Google Scholar] [CrossRef]
  25. Judeh, T.; Shahrour, I. Rainwater Harvesting to Address Current and Forecasted Domestic Water Scarcity: Application to Arid and Semi-Arid Areas. Water 2021, 13, 3583. [Google Scholar] [CrossRef]
  26. Tamagnone, P.; Cea, L.; Comino, E.; Rosso, M. Rainwater Harvesting Techniques to Face Water Scarcity in African Drylands: Hydrological Efficiency Assessment. Water 2020, 12, 2646. [Google Scholar] [CrossRef]
  27. Abdulla, F.; Abdulla, C.; Eslamian, S. Concept and Technology of Rainwater Harvesting. In Handbook of Water Harvesting and Conservation; John Wiley & Sons: Hoboken, NJ, USA, 2021; pp. 1–16. [Google Scholar] [CrossRef]
  28. Słyś, D.; Stec, A. Centralized or Decentralized Rainwater Harvesting Systems: A Case Study. Resources 2020, 9, 5. [Google Scholar] [CrossRef] [Green Version]
  29. Dao, D.A.; Tran, S.H.; Dang, H.T.T.; Nguyen, V.-A.; Nguyen, V.A.; Do, C.v.; Han, M. Assessment of Rainwater Harvesting and Maintenance Practice for Better Drinking Water Quality in Rural Areas. J. Water Supply Res. Technol. Aqua 2021, 70, 202–216. [Google Scholar] [CrossRef]
  30. Palermo, S.A.; Talarico, V.C.; Pirouz, B. Optimizing Rainwater Harvesting Systems for Non-Potable Water Uses and Surface Runoff Mitigation BT-Numerical Computations: Theory and Algorithms; Sergeyev, Y.D., Kvasov, D.E., Eds.; Springer International Publishing: Cham, Switzerland, 2020; pp. 570–582. [Google Scholar]
  31. Rostad, N.; Foti, R.; Montalto, F.A. Harvesting Rooftop Runoff to Flush Toilets: Drawing Conclusions from Four Major U.S. Cities. Resour. Conserv. Recycl. 2016, 108, 97–106. [Google Scholar] [CrossRef]
  32. Huang, Z.; Nya, E.L.; Rahman, M.A.; Mwamila, T.B.; Cao, V.; Gwenzi, W.; Noubactep, C. Integrated Water Resource Management: Rethinking the Contribution of Rainwater Harvesting. Sustainability 2021, 13, 8338. [Google Scholar] [CrossRef]
  33. Behzadian, K.; Kapelan, Z.; Mousavi, J.; Alani, A. Can Smart Rainwater Harvesting Schemes Result in the Improved Performance of Integrated Urban Water Systems? Environ. Sci. Pollut. Res. 2018, 25, 19271–19282. [Google Scholar] [CrossRef] [PubMed]
  34. Petrolo, R.; Loscri, V.; Mitton, N. Towards a Smart City Based on Cloud of Things, a Survey on the Smart City Vision and Paradigms. Trans. Emerg. Telecommun. Technol. 2015, 28, e2931. [Google Scholar] [CrossRef] [Green Version]
  35. Castro, M.; Jara, A.J.; Skarmeta, A.F.G. Smart Lighting Solutions for Smart Cities. In Proceedings of the 27th International Conference on Advanced Information Networking and Applications Workshops, Barcelona, Spain, 25–28 March 2013; pp. 1374–1379. [Google Scholar] [CrossRef]
  36. Stratigea, A. The Concept of ‘Smart’ Cities—Towards Community Development? NETCOM 2012, 26, 375–388. [Google Scholar] [CrossRef] [Green Version]
  37. Kyriazis, D.; Varvarigou, T.A.; White, D.; Rossi, A.; Cooper, J. Sustainable Smart City IoT Applications: Heat and Electricity Management & Eco-Conscious Cruise Control for Public Transportation. In Proceedings of the 2013 IEEE 14th International Symposium on “A World of Wireless, Mobile and Multimedia Networks” (WoWMoM), Madrid, Spain, 4–7 June 2013; pp. 1–5. [Google Scholar]
  38. Şevik, S.; Aktaş, A. Performance enhancing and improvement studies in a 600 kW solar photovoltaic (PV) power plant; manual and natural cleaning, rainwater harvesting and the snow load removal on the PV arrays. Renew. Energy 2022, 181, 490–503. [Google Scholar] [CrossRef]
  39. Zhao, J.; Zhou, B.; Butler, J.P.; Bock, R.G.; Portelli, J.P.; Bilén, S.G. IoT-Based Sanitizer Station Network: A Facilities Management Case Study on Monitoring Hand Sanitizer Dispenser Usage. Smart Cities 2021, 4, 979–994. [Google Scholar] [CrossRef]
  40. Carminati, M.; Sinha, G.R.; Mohdiwale, S.; Ullo, S.L. Miniaturized Pervasive Sensors for Indoor Health Monitoring in Smart Cities. Smart Cities 2021, 4, 146–155. [Google Scholar] [CrossRef]
  41. Bin Hariz, M.; Said, D.; Mouftah, H.T. A Dynamic Mobility Traffic Model Based on Two Modes of Transport in Smart Cities. Smart Cities 2021, 4, 253–270. [Google Scholar] [CrossRef]
  42. Anagnostopoulos, T. A Predictive Vehicle Ride Sharing Recommendation System for Smart Cities Commuting. Smart Cities 2021, 4, 177–191. [Google Scholar] [CrossRef]
  43. Wehbe, R.; Shahrour, I. A BIM-Based Smart System for Fire Evacuation. Future Internet 2021, 13, 221. [Google Scholar] [CrossRef]
  44. Martins, F.; Patrão, C.; Moura, P.; de Almeida, A.T. A Review of Energy Modeling Tools for Energy Efficiency in Smart Cities. Smart Cities 2021, 4, 1420–1436. [Google Scholar] [CrossRef]
  45. Vishnu, S.; Ramson, S.R.J.; Senith, S.; Anagnostopoulos, T.; Abu-Mahfouz, A.M.; Fan, X.; Srinivasan, S.; Kirubaraj, A.A. IoT-Enabled Solid Waste Management in Smart Cities. Smart Cities 2021, 4, 1004–1017. [Google Scholar] [CrossRef]
  46. Mudumbe, M.J.; Abu-Mahfouz, A.M. Smart Water Meter System for User-Centric Consumption Measurement. In Proceedings of the 2015 IEEE 13th International Conference on Industrial Informatics (INDIN), Cambridge, UK, 22–24 July 2015; pp. 993–998. [Google Scholar] [CrossRef]
  47. Savić, D.; Vamvakeridou-Lyroudia, L.; Kapelan, Z. Smart Meters, Smart Water, Smart Societies: The IWIDGET Project. Procedia Eng. 2014, 89, 1105–1112. [Google Scholar] [CrossRef] [Green Version]
  48. Rasekh, A.; Hassanzadeh, A.; Mulchandani, S.; Modi, S.; Banks, M. Smart Water Networks and Cyber Security. J. Water Resour. Plan. Manag. 2016, 142, 1816004. [Google Scholar] [CrossRef]
  49. Wu, Z.Y.; El-Maghraby, M.; Pathak, S. Applications of Deep Learning for Smart Water Networks. Procedia Eng. 2015, 119, 479–485. [Google Scholar] [CrossRef]
  50. Mashhadi, N.; Shahrour, I.; Attoue, N.; el Khattabi, J.; Aljer, A. Use of Machine Learning for Leak Detection and Localization in Water Distribution Systems. Smart Cities 2021, 4, 1293–1315. [Google Scholar] [CrossRef]
  51. Farah, E.; Shahrour, I. Leakage Detection Using Smart Water System: Combination of Water Balance and Automated Minimum Night Flow. Water Resour. Manag. 2017, 31, 4821–4833. [Google Scholar] [CrossRef]
  52. Prasad, A.N.; Mamun, K.A.; Islam, F.R.; Haqva, H. Smart Water Quality Monitoring System. In Proceedings of the 2nd Asia-Pacific World Congress on Computer Science and Engineering (APWC on CSE), Nadi, Fiji, 2–4 December 2015; pp. 1–6. [Google Scholar] [CrossRef]
  53. Dong, J.; Wang, G.; Yan, H.; Xu, J.; Zhang, X. A Survey of Smart Water Quality Monitoring System. Environ. Sci. Pollut. Res. 2015, 22, 4893–4906. [Google Scholar] [CrossRef]
  54. Pasika, S.; Gandla, S.T. Smart Water Quality Monitoring System with Cost-Effective Using IoT. Heliyon 2020, 6, e04096. [Google Scholar] [CrossRef]
  55. Ramos, H.M.; McNabola, A.; López-Jiménez, P.A.; Pérez-Sánchez, M. Smart Water Management towards Future Water Sustainable Networks. Water 2020, 12, 58. [Google Scholar] [CrossRef] [Green Version]
  56. Lee, S.W.; Sarp, S.; Jeon, D.J.; Kim, J.H. Smart Water Grid: The Future Water Management Platform. Desalination Water Treat. 2015, 55, 339–346. [Google Scholar] [CrossRef]
  57. Ntuli, N.; Abu-Mahfouz, A. A Simple Security Architecture for Smart Water Management System. Procedia Comput. Sci. 2016, 83, 1164–1169. [Google Scholar] [CrossRef] [Green Version]
  58. Robles, T.; Alcarria, R.; Martín, D.; Morales, A.; Navarro, M.; Calero, R.; Iglesias, S.; López, M. An Internet of Things-Based Model for Smart Water Management. In Proceedings of the 28th International Conference on Advanced Information Networking and Applications Workshops, Victoria, BC, Canada, 13–14 May 2014; pp. 821–826. [Google Scholar] [CrossRef]
  59. Ranjan, V.; Reddy, M.V.; Irshad, M.; Joshi, N. The Internet of Things (IOT) Based Smart Rain Water Harvesting System. In Proceedings of the 6th International Conference on Signal Processing and Communication (ICSC), Noida, India, 5–7 March 2020; pp. 302–305. [Google Scholar] [CrossRef]
  60. World Health Organization. Guidelines for Drinking-Water Quality; World Health Organization: Geneva, Switzerland, 2011; pp. 1–631. [Google Scholar]
  61. Frichot, J.J.H.; Rubiyatno; Talukdar, G. Water Quality Assessment of Roof-Collected Rainwater in Miri, Malaysia. Trop. Aquat. Soil Pollut. 2021, 1, 87–97. [Google Scholar] [CrossRef]
  62. Otter, P.; Sattler, W.; Grischek, T.; Jaskolski, M.; Mey, E.; Ulmer, N.; Grossmann, P.; Matthias, F.; Malakar, P.; Goldmaier, A.; et al. Economic Evaluation of Water Supply Systems Operated with Solar-Driven Electro-Chlorination in Rural Regions in Nepal, Egypt and Tanzania. Water Res. 2020, 187, 116384. [Google Scholar] [CrossRef] [PubMed]
  63. Mac Mahon, J.; Gill, L.W. Sustainability of Novel Water Treatment Technologies in Developing Countries: Lessons Learned from Research Trials on a Pilot Continuous Flow Solar Water Disinfection System in Rural Kenya. Dev. Eng. 2018, 3, 47–59. [Google Scholar] [CrossRef]
  64. Naddeo, V.; Scannapieco, D.; Belgiorno, V. Enhanced Drinking Water Supply through Harvested Rainwater Treatment. J. Hydrol. 2013, 498, 287–291. [Google Scholar] [CrossRef]
  65. Frechen, F.-B.; Exler, H.; Romaker, J.; Schier, W. Long-Term Behaviour of a Gravity-Driven Dead End Membrane Filtration Unit for Potable Water Supply in Cases of Disasters. Water Supply 2011, 11, 39–44. [Google Scholar] [CrossRef]
  66. Huang, Z.; Nya, E.L.; Cao, V.; Gwenzi, W.; Rahman, M.A.; Noubactep, C. Universal Access to Safe Drinking Water: Escaping the Traps of Non-Frugal Technologies. Sustainability 2021, 13, 9645. [Google Scholar] [CrossRef]
  67. Yang, H.; Hu, R.; Ndé-Tchoupé, A.I.; Gwenzi, W.; Ruppert, H.; Noubactep, C. Designing the Next Generation of Fe0-Based Filters for Decentralized Safe Drinking Water Treatment: A Conceptual Framework. Processes 2020, 8, 745. [Google Scholar] [CrossRef]
  68. Mosley, L. Water Quality of Rainwater Harvesting Systems; SOPAC: Suva, Fiji, 2005; pp. 1–19. [Google Scholar]
  69. Wu, L.; Gao, J.; Zhao, W.; Xu, X.; Yin, Y.; Wu, L. Quality Assessment of Rainwater and Harvested Rainwater Stored in Different Types of Cisterns. Water Supply 2016, 17, 652–664. [Google Scholar] [CrossRef] [Green Version]
  70. Osayemwenre, G.; Osibote, O.A. A Review of Health Hazards Associated with Rainwater Harvested from Green, Conventional and Photovoltaic Rooftops. Int. J. Environ. Sci. Dev. 2021, 12, 1–15. [Google Scholar] [CrossRef]
  71. Chubaka, C.E.; Whiley, H.; Edwards, J.W.; Ross, K.E. Lead, Zinc, Copper, and Cadmium Content of Water from South Australian Rainwater Tanks. Int. J. Environ. Res. Public Health 2018, 15, 1551. [Google Scholar] [CrossRef] [Green Version]
  72. Abbasi, T.; Abbasi, S.A. Sources of Pollution in Rooftop Rainwater Harvesting Systems and their Control. Crit. Rev. Environ. Sci. Technol. 2011, 41, 2097–2167. [Google Scholar] [CrossRef]
  73. Alim, M.A.; Rahman, A.; Tao, Z.; Samali, B.; Khan, M.M.; Shirin, S. Suitability of Roof Harvested Rainwater for Potential Potable Water Production: A Scoping Review. J. Clean. Prod. 2020, 248, 119226. [Google Scholar] [CrossRef]
  74. Vilane, T.; Simiso, G. An Assessment of the Quality of Rainwater Harvested Using Rooftop Rainwater Harvesting (RWH) Technologies in Swaziland. J. Agric. Sci. Eng. 2018, 3, 55–64. [Google Scholar]
  75. Tamimi, L. Rainwater Harvesting System: Quality and Impacts on Public Health. Master’s Thesis, Birzeit University, Ramallah, Palestine, February 2016. [Google Scholar]
  76. Hasan, N.; Driejana, D.; Sulaeman, A.; Ariesyady, H. Water Quality Indices for Rainwater Quality Assessment in Bandung Urban Region. IOP Conf. Ser. Mater. Sci. Eng. 2019, 669, 12044. [Google Scholar] [CrossRef]
  77. Ighalo, J.O.; Adeniyi, A.G. A Comprehensive Review of Water Quality Monitoring and Assessment in Nigeria. Chemosphere 2020, 260, 127569. [Google Scholar] [CrossRef]
  78. Das, D. A Case Study of Rainwater Harvesting: Its Desing, Factors Affecting and Cost Installation of AIIMS Hospital, Raipur. SSRN Electron. J. 2019, 1–5. [Google Scholar] [CrossRef]
  79. Mizuki, F.; Mikava, K.; Kurishu, H. Intelligent Water System for Smart Cities. Hitachi Rev. 2012, 61, 147–151. [Google Scholar]
  80. Rojek, I.; Studzinski, J. Detection and Localization of Water Leaks in Water Nets Supported by an ICT System with Artificial Intelligence Methods as a Way Forward for Smart Cities. Sustainability 2019, 11, 581. [Google Scholar] [CrossRef] [Green Version]
  81. Mao, J.; Xia, B.; Zhou, Y.; Bi, F.; Zhang, X.; Zhang, W.; Xia, S. Effect of Roof Materials and Weather Patterns on the Quality of Harvested Rainwater in Shanghai, China. J. Clean. Prod. 2021, 279, 123419. [Google Scholar] [CrossRef]
  82. Shahrour, I.; Xie, X. Role of Internet of Things (IoT) and Crowdsourcing in Smart City Projects. Smart Cities 2021, 4, 1276–1292. [Google Scholar] [CrossRef]
  83. Guo, B.; Wang, Z.; Yu, Z.; Wang, Y.; Yen, N.Y.; Huang, R.; Zhou, X. Mobile Crowd Sensing and Computing: The Review of an Emerging Human-Powered Sensing Paradigm. ACM Comput. Surv. 2015, 48, 1–31. [Google Scholar] [CrossRef]
  84. Hu, J. Data Cleaning and Feature Selection for Gravelly Soil Liquefaction. Soil Dyn. Earthq. Eng. 2021, 145, 106711. [Google Scholar] [CrossRef]
  85. Love, S.B.; Yorke-Edwards, V.; Diaz-Montana, C.; Murray, M.L.; Masters, L.; Gabriel, M.; Joffe, N.; Sydes, M.R. Making a Distinction between Data Cleaning and Central Monitoring in Clinical Trials. Clin. Trials 2021, 18, 386–388. [Google Scholar] [CrossRef] [PubMed]
  86. Northcutt, C.; Jiang, L.; Chuang, I. Confident Learning: Estimating Uncertainty in Dataset Labels. J. Artif. Intell. Res. JAIR 2021, 70, 1373–1411. [Google Scholar] [CrossRef]
  87. Liu, D.; Zhang, Y.; Jia, D.; Zhang, Q.; Zhao, X.; Rong, H. Toward Secure Distributed Data Storage with Error Locating in Blockchain Enabled Edge Computing. Comput. Stand. Interfaces 2022, 79, 103560. [Google Scholar] [CrossRef]
  88. Robie, J. XML Processing and Data Integration with XQuery. IEEE Internet Comput. 2007, 11, 62–67. [Google Scholar] [CrossRef]
  89. Tang, B.; Chen, Z.; Hefferman, G.; Wei, T.; He, H.; Yang, Q. A Hierarchical Distributed Fog Computing Architecture for Big Data Analysis in Smart Cities. In Proceedings of the ASE Big Data & Social Informatics 2015, Kaohsiung, Taiwan, 7–9 October 2015. [Google Scholar] [CrossRef]
  90. Elhoseny, H.; Elhoseny, M.; el-din Riad, A.; Hassanien, A.E. A Framework for Big Data Analysis in Smart Cities. In Proceedings of the International Conference on Advanced Machine Learning Technologies and Applications 2018, Cairo, Egypt, 5–7 May 2018; pp. 405–414. [Google Scholar] [CrossRef]
  91. Ji, W.; Xu, J.; Qiao, H.; Zhou, M.; Liang, B. Visual IoT: Enabling Internet of Things Visualization in Smart Cities. IEEE Netw. 2019, 33, 102–110. [Google Scholar] [CrossRef]
  92. Da Silva Lopes, M.A.; Dória Neto, A.D.; de Medeiros Martins, A. Parallel T-SNE Applied to Data Visualization in Smart Cities. IEEE Access 2020, 8, 11482–11490. [Google Scholar] [CrossRef]
  93. Karim, M.R.; Sakib, B.M.S.; Sakib, S.S.; Imteaz, M.A. Rainwater Harvesting Potentials in Commercial Buildings in Dhaka: Reliability and Economic Analysis. Hydrology 2021, 8, 9. [Google Scholar] [CrossRef]
  94. Fulton, L.v. A Simulation of Rainwater Harvesting Design and Demand-Side Controls for Large Hospitals. Sustainability 2018, 10, 1659. [Google Scholar] [CrossRef] [Green Version]
  95. Basinger, M.; Montalto, F.; Lall, U. A Rainwater Harvesting System Reliability Model Based on Nonparametric Stochastic Rainfall Generator. J. Hydrol. 2010, 392, 105–118. [Google Scholar] [CrossRef]
  96. Ursino, N.; Grisi, A. Reliability and Efficiency of Rainwater Harvesting Systems under Different Climatic and Operational Scenarios. Int. J. Sustain. Dev. Plan. 2017, 12, 194–199. [Google Scholar] [CrossRef]
  97. Zhang, S.; Zhang, J.; Jing, X.; Wang, Y.; Wang, Y.; Yue, T. Water Saving Efficiency and Reliability of Rainwater Harvesting Systems in the Context of Climate Change. J. Clean. Prod. 2018, 196, 1341–1355. [Google Scholar] [CrossRef]
  98. Jenin Municipality (JM). Annual Report on Water Supply Service in Jenin Municipality; JM: Jenin, Palestine, 2019; pp. 1–15. [Google Scholar]
  99. Howard, G.; Bartram, J. Domestic Water Quantity, Service Level and Health; WHO: Geneva, Switzerland, 2003; pp. 1–39. [Google Scholar]
  100. Palestinian Metrological Authority (PMA). Climate Bulletin; PMA: Ramallah, Palestine, 2018; pp. 1–34. [Google Scholar]
  101. Mahmoud, N.; Hogland, W.; Sokolov, M.; Rud, V.; Myazin, N. Assessment of Rainwater Harvesting for Domestic Water Supply in Palestinian Rural Areas. MATEC Web Conf. 2018, 245, 6012. [Google Scholar] [CrossRef]
  102. Muoio, R.; Caretti, C.; Rossi, L.; Santianni, D.; Lubello, C. Water Safety Plans and Risk Assessment: A Novel Procedure Applied to Treated Water Turbidity and Gastrointestinal Diseases. Int. J. Hyg. Environ. Health 2020, 223, 281–288. [Google Scholar] [CrossRef]
  103. Soros, A.; Amburgey, J.E.; Stauber, C.E.; Sobsey, M.D.; Casanova, L.M. Turbidity Reduction in Drinking Water by Coagulation-Flocculation with Chitosan Polymers. J. Water Health 2019, 17, 204–218. [Google Scholar] [CrossRef] [Green Version]
  104. Alenazi, M.; Hashim, K.S.; Hassan, A.A.; Muradov, M.; Kot, P.; Abdulhadi, B. Turbidity Removal Using Natural Coagulants Derived from the Seeds of Strychnos Potatorum: Statistical and Experimental Approach. IOP Conf. Ser. Mater. Sci. Eng. 2020, 888, 12064. [Google Scholar] [CrossRef]
  105. Al-Batsh, N.; Al-Khatib, I.A.; Ghannam, S.; Anayah, F.; Jodeh, S.; Hanbali, G.; Khalaf, B.; van der Valk, M. Assessment of Rainwater Harvesting Systems in Poor Rural Communities: A Case Study from Yatta Area, Palestine. Water 2019, 11, 585. [Google Scholar] [CrossRef] [Green Version]
  106. Daoud, A.K.; Swaileh, K.M.; Hussein, R.M.; Matani, M. Quality Assessment of Roof-Harvested Rainwater in the West Bank, Palestinian Authority. J. Water Health 2011, 9, 525–533. [Google Scholar] [CrossRef] [Green Version]
  107. Xu, G.; Wang, T.; Wei, Y.; Zhang, Y.; Chen, J. Fecal Coliform Distribution and Health Risk Assessment in Surface Water in an Urban-Intensive Catchment. J. Hydrol. 2022, 604, 127204. [Google Scholar] [CrossRef]
  108. Wang, J.; Deng, Z. Modeling and Predicting Fecal Coliform Bacteria Levels in Oyster Harvest Waters along Louisiana Gulf Coast. Ecol. Indic. 2019, 101, 212–220. [Google Scholar] [CrossRef]
  109. Helbling, D.; Vanbriesen, J. Modeling Residual Chlorine Response to a Microbial Contamination Event in Drinking Water Distribution Systems. J. Environ. Eng. 2009, 135, 918–927. [Google Scholar] [CrossRef]
  110. Goyal, R.v.; Patel, H.M. Analysis of Residual Chlorine in Simple Drinking Water Distribution System with Intermittent Water Supply. Appl. Water Sci. 2015, 5, 311–319. [Google Scholar] [CrossRef] [Green Version]
  111. Hrudey, S.E.; Backer, L.C.; Humpage, A.R.; Krasner, S.W.; Michaud, D.S.; Moore, L.E.; Singer, P.C.; Stanford, B.D. Evaluating Evidence for Association of Human Bladder Cancer with Drinking-Water Chlorination Disinfection By-Products. J. Toxicol. Environ. Health Part B 2015, 18, 213–241. [Google Scholar] [CrossRef] [PubMed]
  112. Kali, S.; Khan, M.; Ghaffar, M.S.; Rasheed, S.; Waseem, A.; Iqbal, M.M.; Bilal khan Niazi, M.; Zafar, M.I. Occurrence, Influencing Factors, Toxicity, Regulations, and Abatement Approaches for Disinfection by-Products in Chlorinated Drinking Water: A Comprehensive Review. Environ. Pollut. 2021, 281, 116950. [Google Scholar] [CrossRef] [PubMed]
  113. Källén, B.A.J.; Robert, E. Drinking Water Chlorination and Delivery Outcome—A Registry-Based Study in Sweden. Reprod. Toxicol. 2000, 14, 303–309. [Google Scholar] [CrossRef]
  114. Pickering, A.J.; Crider, Y.; Sultana, S.; Swarthout, J.; Goddard, F.G.B.; Anjerul Islam, S.; Sen, S.; Ayyagari, R.; Luby, S.P. Effect of In-Line Drinking Water Chlorination at the Point of Collection on Child Diarrhoea in Urban Bangladesh: A Double-Blind, Cluster-Randomised Controlled Trial. Lancet Glob. Health 2019, 7, e1247–e1256. [Google Scholar] [CrossRef] [Green Version]
  115. Crider, Y.; Sultana, S.; Unicomb, L.; Davis, J.; Luby, S.P.; Pickering, A.J. Can You Taste It? Taste Detection and Acceptability Thresholds for Chlorine Residual in Drinking Water in Dhaka, Bangladesh. Sci. Total Environ. 2018, 613, 840–846. [Google Scholar] [CrossRef]
  116. Wang, A.; Lin, Y.; Xu, B.; Hu, C.; Gao, Z.; Liu, Z.; Cao, T.; Gao, N. Factors Affecting the Water Odor Caused by Chloramines during Drinking Water Disinfection. Sci. Total Environ. 2018, 639, 687–694. [Google Scholar] [CrossRef]
  117. Al-Salaymeh, A.; Al-Khatib, I.A.; Arafat, H.A. Towards Sustainable Water Quality: Management of Rainwater Harvesting Cisterns in Southern Palestine. Water Resour. Manag. 2011, 25, 1721–1736. [Google Scholar] [CrossRef]
  118. Celik, I.; Tamimi, L.M.A.; Al-Khatib, I.A.; Apul, D.S. Management of Rainwater Harvesting and Its Impact on the Health of People in the Middle East: Case Study from Yatta Town, Palestine. Environ. Monit. Assess. 2017, 189, 271. [Google Scholar] [CrossRef]
  119. Zafarzadeh, A.; Amanidaz, N.; Seyedghasemi, N. Relationship between Turbidity and Residual Chlorine and Microbial Quality of Drinking Water. Med. Lab. J. 2014, 8, 74–81. [Google Scholar]
  120. Farooq, S.; Hashmi, I.; Qazi, I.A.; Qaiser, S.; Rasheed, S. Monitoring of Coliforms and Chlorine Residual in Water Distribution Network of Rawalpindi, Pakistan. Environ. Monit. Assess. 2008, 140, 339–347. [Google Scholar] [CrossRef]
  121. Yousefi, M.; Saleh, H.N.; Yaseri, M.; Mahvi, A.H.; Soleimani, H.; Saeedi, Z.; Zohdi, S.; Mohammadi, A.A. Data on Microbiological Quality Assessment of Rural Drinking Water Supplies in Poldasht County. Data Brief 2018, 17, 763–769. [Google Scholar] [CrossRef]
  122. Fitzhenry, K.; Barrett, M.; O’Flaherty, V.; Dore, W.; Cormican, M.; Rowan, N.; Clifford, E. The Effect of Wastewater Treatment Processes, in Particular Ultraviolet Light Treatment, on Pathogenic Virus Removal; EPA Research: Wexford, Ireland, 2016; pp. 1–53. [Google Scholar]
  123. Akowanou, O.; Aina, M.; Groendijk, L.; Yao, B. Household Water Treatment in Benin: Current/Local Practices. Eur. J. Sci. Res. 2016, 142, 246–256. [Google Scholar]
  124. Kang, D.; Lansey, K. Dual Water Distribution Network Design under Triple-Bottom-Line Objectives. J. Water Resour. Plan. Manag. 2012, 138, 162–175. [Google Scholar] [CrossRef]
  125. Burszta-Adamiak, E.; Spychalski, P. Water Savings and Reduction of Costs through the Use of a Dual Water Supply System in a Sports Facility. Sustain. Cities Soc. 2021, 66, 102620. [Google Scholar] [CrossRef]
  126. Nguyen, D.C.; Han, M.Y. Design of Dual Water Supply System Using Rainwater and Groundwater at Arsenic Contaminated Area in Vietnam. J. Water Supply Res. Technol. Aqua 2014, 63, 578–585. [Google Scholar] [CrossRef]
  127. Rasoulkhani, K.; Mostafavi, A.; Cole, J.; Sharvelle, S. Resilience-Based Infrastructure Planning and Asset Management: Study of Dual and Singular Water Distribution Infrastructure Performance Using a Simulation Approach. Sustain. Cities Soc. 2019, 48, 101577. [Google Scholar] [CrossRef]
  128. Cole, J.; Sharvelle, S.; Fourness, D.; Grigg, N.; Roesner, L.; Haukaas, J. Centralized and Decentralized Strategies for Dual Water Supply: Case Study. J. Water Resour. Plan. Manag. 2018, 144, 5017017. [Google Scholar] [CrossRef]
  129. Alawna, S.; Shadeed, S. Rooftop Rainwater Harvesting to Alleviate Domestic Water Shortage in the West Bank, Palestine. An-Najah Univ. J. Res. A Nat. Sci. 2021, 35, 83–108. [Google Scholar]
  130. Shadeed, S.; Judeh, T.; Almasri, M. Developing a GIS-Based Water Poverty and Rainwater Harvesting Suitability Maps for Domestic Use in the Dead Sea Region (West Bank, Palestine). Hydrol. Earth Syst. Sci. 2019, 23, 1581–1592. [Google Scholar] [CrossRef] [Green Version]
  131. Shadeed, S.; Alawna, S. Optimal Sizing of Rooftop Rainwater Harvesting Tanks for Sustainable Domestic Water Use in the West Bank, Palestine. Water 2021, 13, 573. [Google Scholar] [CrossRef]
Figure 1. The research methodology used in this research.
Sustainability 14 09271 g001
Figure 2. Characterization of RWH contamination.
Sustainability 14 09271 g002
Figure 3. The architecture of the smart RWH system.
Sustainability 14 09271 g003
Figure 4. Physical components of the smart RWH system.
Sustainability 14 09271 g004
Figure 5. Monitoring components of the smart RWH system.
Sustainability 14 09271 g005
Figure 6. BIM representation for the case study.
Sustainability 14 09271 g006
Figure 7. Temporal distribution of the daily rainfall in the study area.
Sustainability 14 09271 g007
Figure 8. RWH sampling locations.
Sustainability 14 09271 g008
Figure 9. Residual chlorine VS. FC among the RWH samples.
Sustainability 14 09271 g009
Figure 10. Effect of tank size on the annual utilized RWH volumes and the annual overflow.
Sustainability 14 09271 g010
Figure 11. Effect of tank size on the annual shortage through the smart RWH system.
Sustainability 14 09271 g011
Figure 12. Effect of tank size to the Re and Rv, through the smart RWH system.
Sustainability 14 09271 g012
Figure 13. Impact of tank size on (a) Re; (b) Rv of the dual supply system considering the existing municipal water supply agenda.
Sustainability 14 09271 g013
Figure 14. Impact of tank size on (a) Re; (b) Rv of the dual supply system considering agenda A.
Sustainability 14 09271 g014
Figure 15. Impact of tank size on (a) Re; (b) Rv of the dual supply system considering agenda B.
Sustainability 14 09271 g015
Table 1. Characteristics of the buildings in the case study.
ParameterBuilding Number
Building 1Building 2Building 3Building 4Building 5Building 6
Roof area (m2)125.6188.3160.9134.6208.9148.6
Roof materialbricksconcreteconcretebricksconcretebricks
RC0.850.90.90.850.90.85
Residents’ number764845
Table 2. Municipal supply capacity at the neighborhood level.
AltitudeSupply Rate (m3/Day of Supply/Neighborhood) *
Dry Season
(May to October)
Rainy Season
(November to April)
High-altitude715
Moderate-altitude1025
Low-altitude2235
* neighborhood is adjacent houses in the study area (mainly 5–15 houses).
Table 3. Physiochemical and biological analysis of RWH samples.
ParameterMinMeanMedianMaxWHO
Standards
Number of Contaminated Samples (%)
pH6.927.327.317.756.5–8.50 (0%)
Turbidity
(NTU)
0.183.370.9528.50≤5.007 (20%)
Chloride
(mg/L)
15.0037.6637.0076.00≤250.000 (0%)
Alkalinity
(mg/L CaCO3)
65.00169.74145.00325.00≤400.000 (0%)
TDS
(mg/L)
72.00185.49175.00302.00≤600.000 (0%)
FC
(CFU/100 mL)
0.0092.239.00545.00≤10.0017 (48.6%)
Residual Chlorine (mg/L)0.000.270.172.100.2–0.820 (57.1%)
Publisher’s Note: MDPI stays neutral with regard to jurisdictional claims in published maps and institutional affiliations.

